Attached files
| file | filename |
|---|---|
| 8-K - SURMODICS, INC. 8-K - SURMODICS INC | a50086554.htm |
Exhibit 99.1
Investor Presentation Gary Maharaj President and CEO November 2011 SurModics Bringing Innovation Together
Safe Harbor Statement and Use of Non-GAAP Financials Some of the statements made during this meeting may be considered forward-looking statements. The 10-K for fiscal year 2011 identifies certain factors that could cause the Company’s actual results to differ materially from those projected in any forward-looking statements made during this meeting. The 10-K and subsequent filings are available through the Company or online at www.surmodics.com.The Company has included in the presentation materials certain non-GAAP financial results. The Company believes that these non-GAAP measures provide meaningful insight into our operating performance excluding certain event-specific charges, and provide an alternative perspective of our results of operations. The Company’s management uses non-GAAP measures, including those set forth in the presentation materials, to assess the Company’s operating performance and to determine payout under its executive compensation programs. The Company believes that presentation of certain non-GAAP measures allows investors to review its results of operations from the same perspective as management and the Company’s board of directors and facilitates comparisons of its current results of operations. The method used to produce non-GAAP results is not in accordance with GAAP and may differ from the methods used by other companies. Non-GAAP results should not be regarded as a substitute for corresponding GAAP measures but instead should be utilized as a supplemental measure of operating performance in evaluating the Company’s business. Non-GAAP measures do have limitations in that they do not reflect certain items that may have a material impact upon the Company’s reported financial results. As such, these non-GAAP measures presented should be viewed in conjunction with both the Company’s financial statements prepared in accordance with GAAP and the reconciliation of the supplemental non-GAAP financial measures to the comparable GAAP results provided for the specific periods presented, which are included in the presentation materials. 2
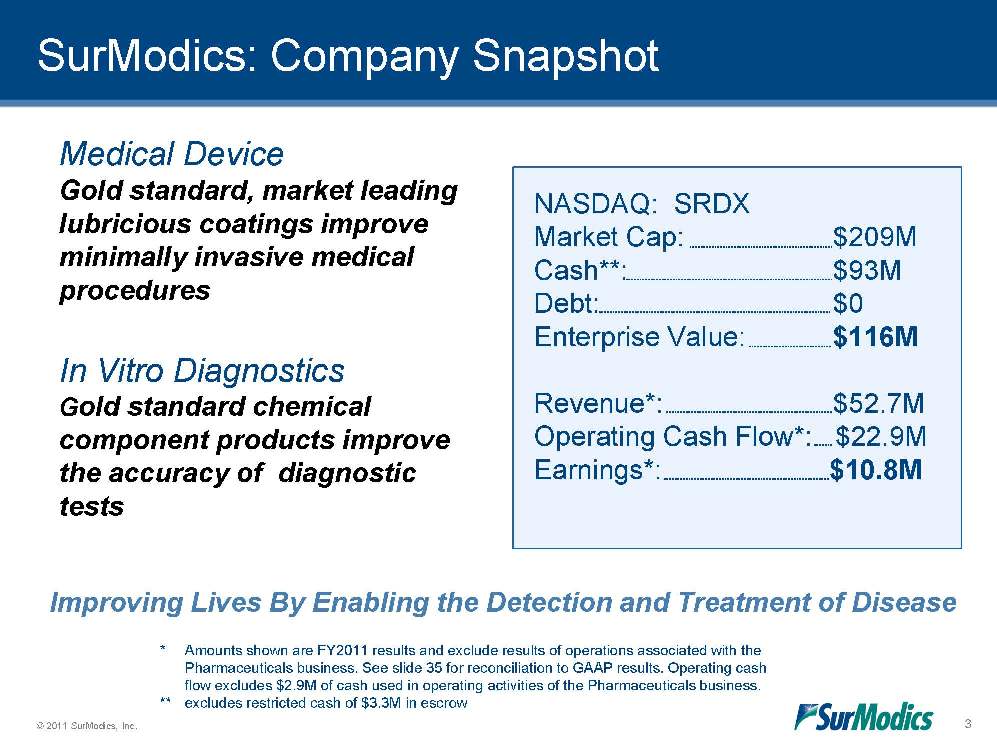
SurModics: Company Snapshot NASDAQ: SRDX Market Cap: $209M Cash**: $93M Debt: $0 Enterprise Value: $116M Revenue*: $52.7M Operating Cash Flow*: $22.9M Earnings*: $10.8M Improving Lives By Enabling the Detection and Treatment of Disease Medical Device Gold standard, market leading lubricious coatings improve minimally invasive medical procedures In Vitro Diagnostics Gold standard chemical component products improve the accuracy of diagnostic tests * Amounts shown are FY2011 results and exclude results of operations associated with the Pharmaceuticals business. See slide 35 for reconciliation to GAAP results. Operating cash flow excludes $2.9M of cash used in operating activities of the Pharmaceuticals business. ** excludes restricted cash of $3.3M in escrow 3
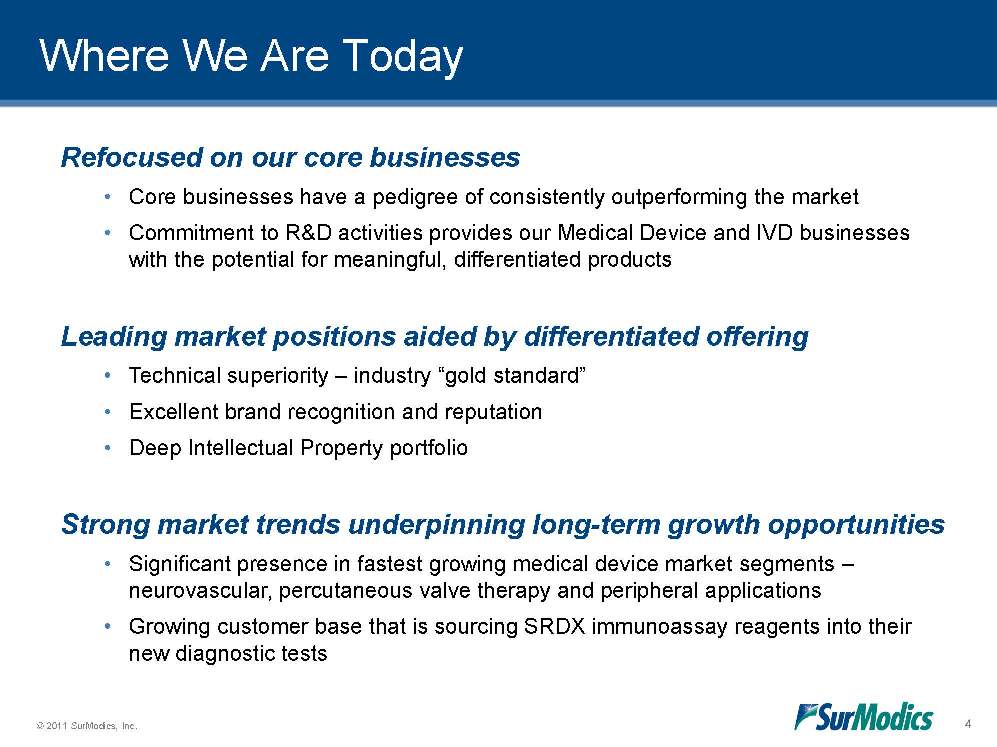
Where We Are Today Refocused on our core businesses •Core businesses have a pedigree of consistently outperforming the market •Commitment to R&D activities provides our Medical Device and IVD businesses with the potential for meaningful, differentiated products Leading market positions aided by differentiated offering •Technical superiority – industry “gold standard” •Excellent brand recognition and reputation •Deep Intellectual Property portfolio Strong market trends underpinning long-term growth opportunities •Significant presence in fastest growing medical device market segments – neurovascular, percutaneous valve therapy and peripheral applications •Growing customer base that is sourcing SRDX immunoassay reagents into their new diagnostic tests 4
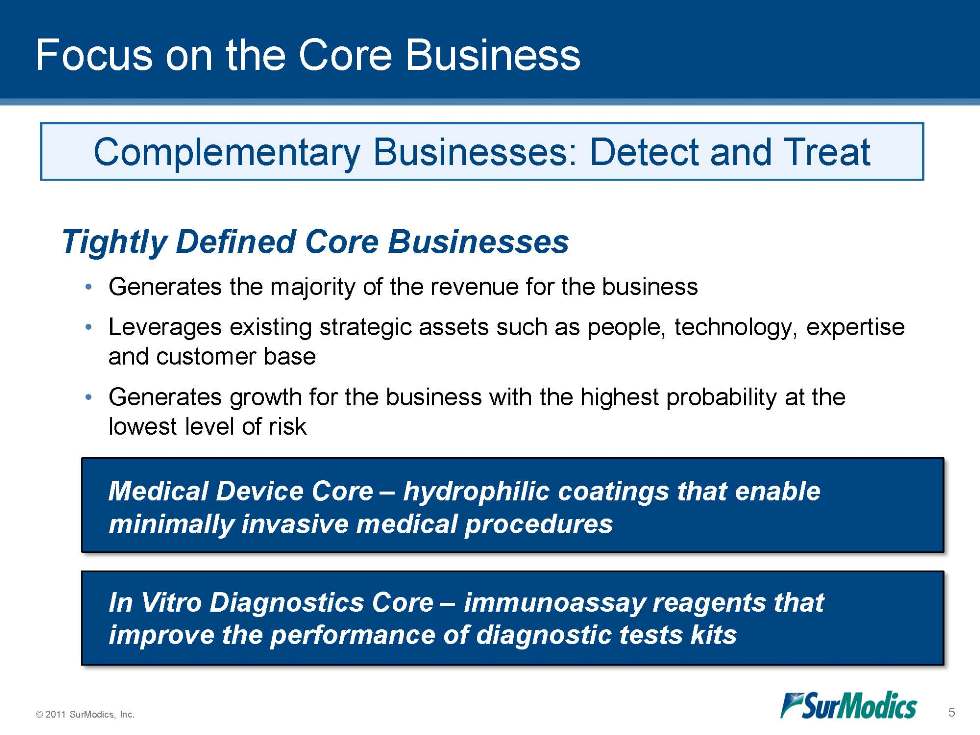
Focus on the Core Business Tightly Defined Core Businesses •Generates the majority of the revenue for the business •Leverages existing strategic assets such as people, technology, expertise and customer base •Generates growth for the business with the highest probability at the lowest level of risk Complementary Businesses: Detect and Treat Medical Device Core – hydrophilic coatings that enable minimally invasive medical procedures In Vitro Diagnostics Core – immunoassay reagents that improve the performance of diagnostic tests kits 5
Business Overview 6
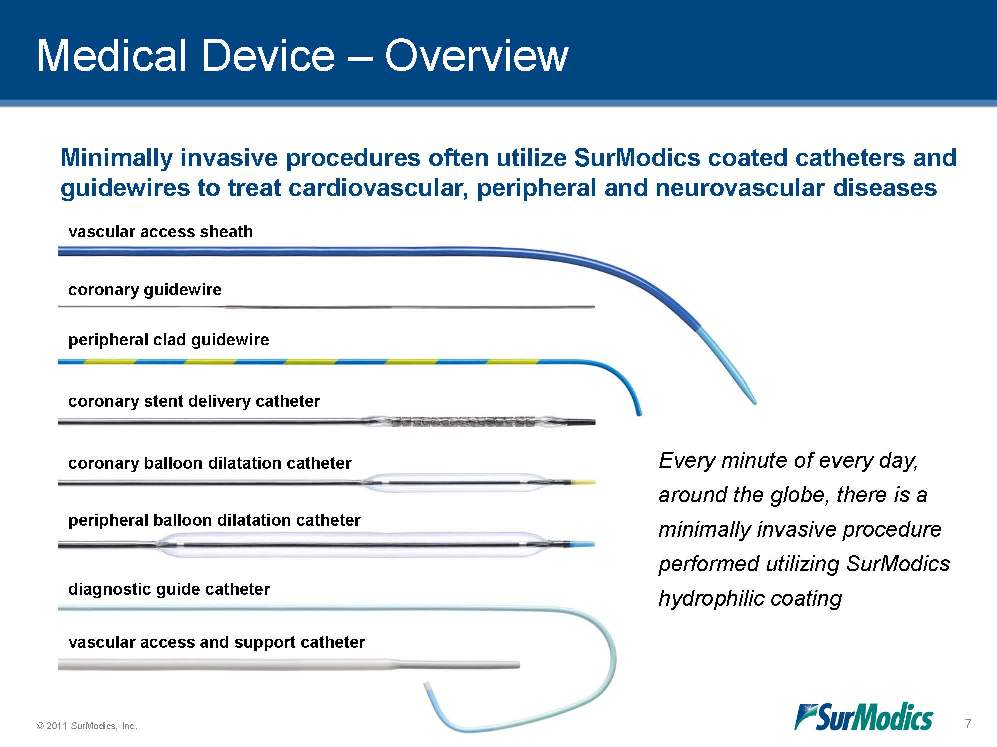
Medical Device – Overview Minimally invasive procedures often utilize SurModics coated catheters and guidewires to treat cardiovascular, peripheral and neurovascular diseases Every minute of every day, around the globe, there is a minimally invasive procedure performed utilizing SurModics hydrophilic coating vascular access sheath coronary guidewire peripheral clad guidewire coronary stent delivery catheter coronary balloon dilatation catheter peripheral balloon dilatation catheter diagnostic guide catheter vascular access and support catheter 7
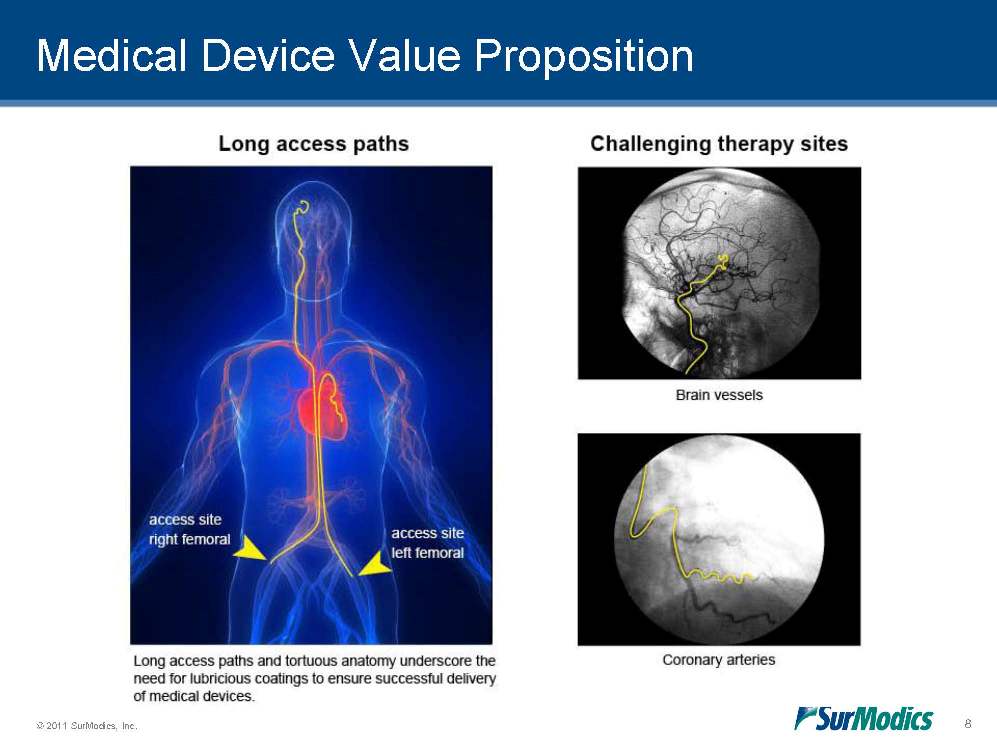
Medical Device Value Proposition 8 Long access paths Challenging therapy sites Brain vessels Coronary arteries Long access paths and tortuous anatomy underscore the need for lubricious coatings to ensure successful delivery of medical devices.
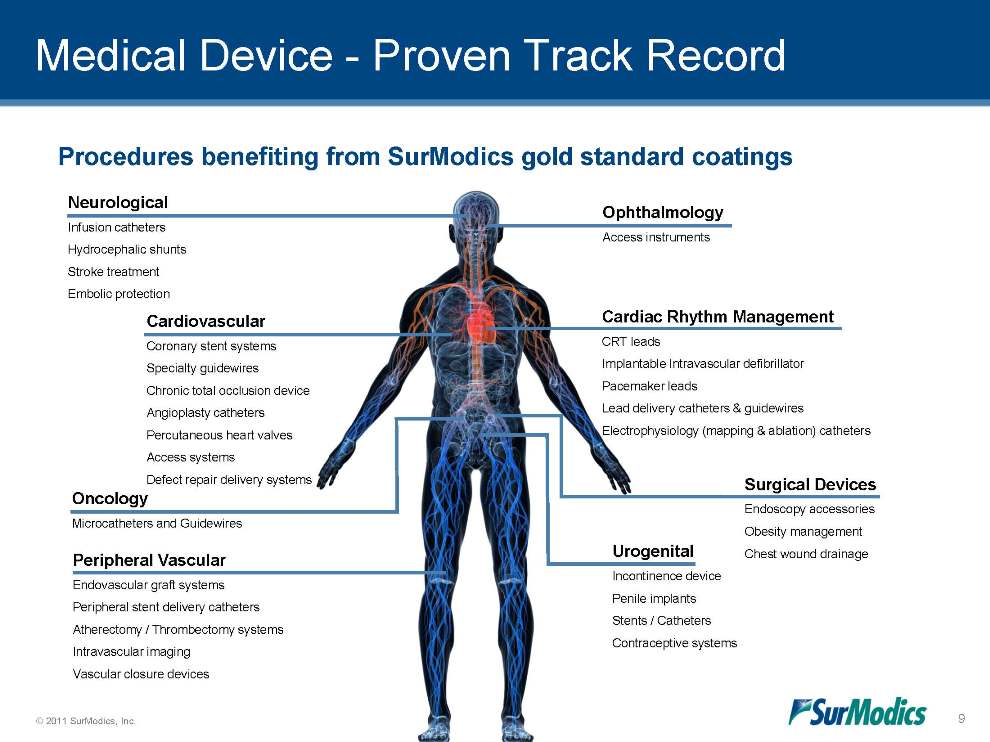
Medical Device - Proven Track Record Oncology Microcatheters and Guidewires Cardiovascular Coronary stent systems Specialty guidewires Chronic total occlusion device Angioplasty catheters Percutaneous heart valves Access systems Defect repair delivery systems Neurological Infusion catheters Hydrocephalic shunts Stroke treatment Embolic protection Ophthalmology Access instruments Cardiac Rhythm Management CRT leads Implantable Intravascular defibrillator Pacemaker leads Lead delivery catheters & guidewires Electrophysiology (mapping & ablation) catheters Urogenital Incontinence device Penile implants Stents / Catheters Contraceptive systems Peripheral Vascular Endovascular graft systems Peripheral stent delivery catheters Atherectomy / Thrombectomy systems Intravascular imaging Vascular closure devices Surgical Devices Endoscopy accessories Obesity management Chest wound drainage 9 Procedures benefiting from SurModics gold standard coatings
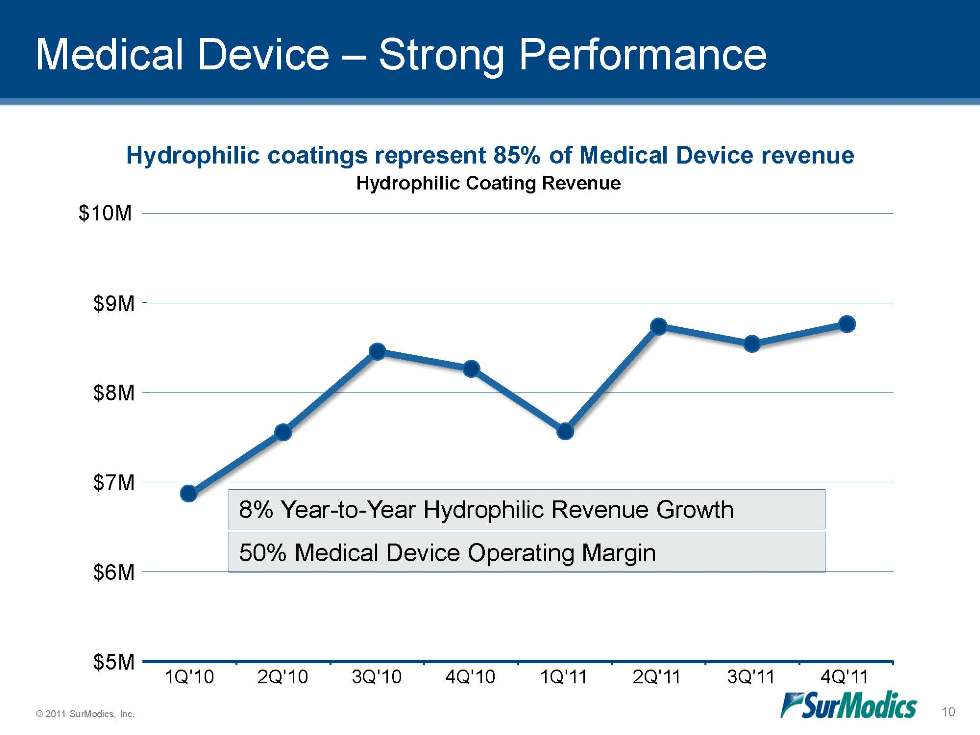
Medical Device – Strong Performance Hydrophilic coatings represent 85% of Medical Device revenue 50% Medical Device Operating Margin 8% Year-to-Year Hydrophilic Revenue Growth Hydrophilic Coating Revenue $5M $6M $7M $8M $9M 1Q'10 2Q'10 3Q'10 4Q'10 1Q'11 2Q'11 3Q'11 4Q'11 $10M 10
Plus a Bright Future… •New hydrophilic coating platform available in 2012 •Opportunities for market expansion •Opportunities for new platform breakthroughs •Well positioned in growing market segments Medical Device – Growth Drivers © 2011 SurModics, Inc. 12 Medical 11
Medical Device – Bright Future Next generation hydrophilic coating platform •Offers compelling value proposition –Preserves our gold standard lubricity and durability performance –Performance that meets increased regulatory requirements –Leverages our customers existing manufacturing process 12
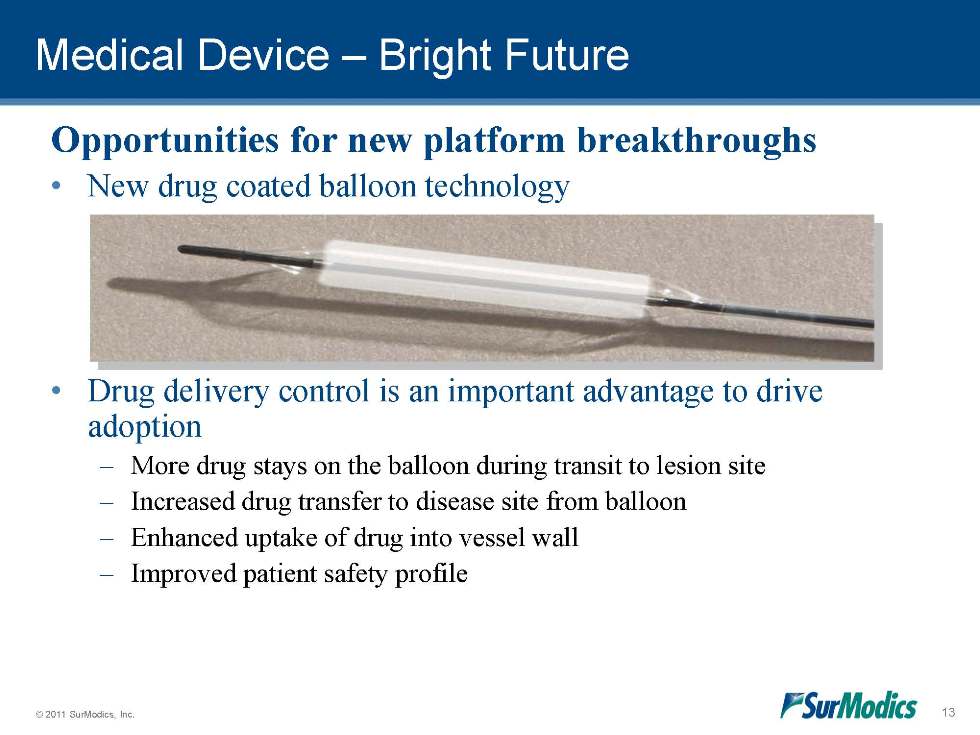
Medical Device – Bright Future Opportunities for new platform breakthroughs •New drug coated balloon technology •Drug delivery control is an important advantage to drive adoption –More drug stays on the balloon during transit to lesion site –Increased drug transfer to disease site from balloon –Enhanced uptake of drug into vessel wall –Improved patient safety profile 13
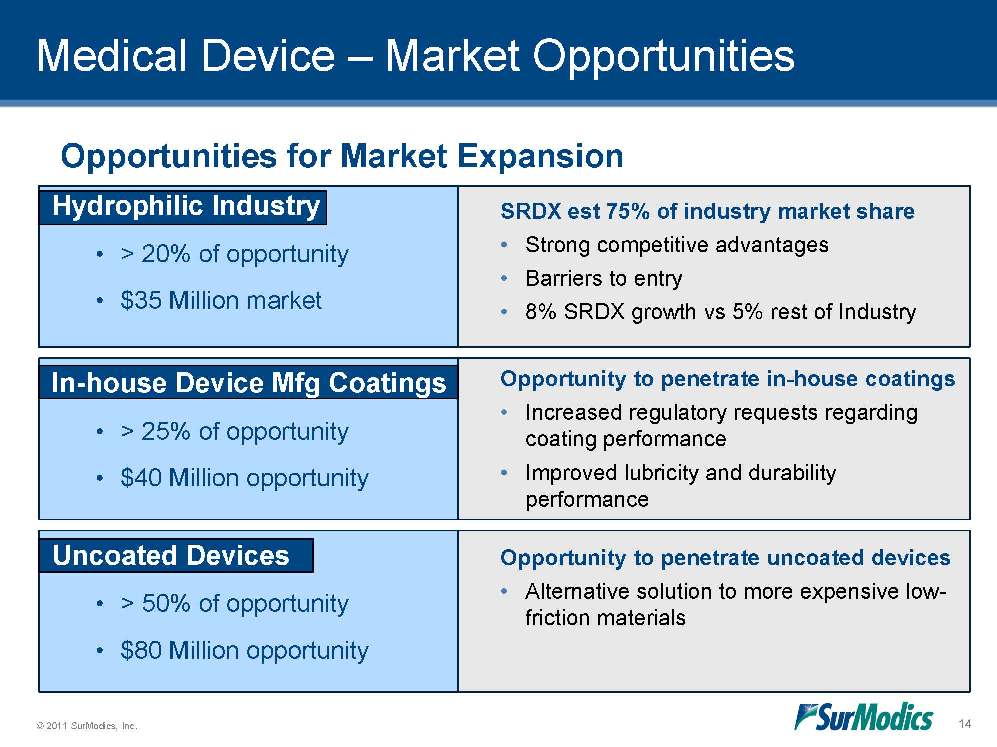
Medical Device – Market Opportunities SRDX est 75% of industry market share •Strong competitive advantages •Barriers to entry •8% SRDX growth vs 5% rest of Industry Opportunities for Market Expansion Opportunity to penetrate in-house coatings •Increased regulatory requests regarding coating performance •Improved lubricity and durability performance Opportunity to penetrate uncoated devices •Alternative solution to more expensive low-friction materials Hydrophilic Industry •> 20% of opportunity •$35 Million market In-house Device Mfg Coatings •> 25% of opportunity •$40 Million opportunity Uncoated Devices •> 50% of opportunity •$80 Million opportunity 14
Medical Device – Market Opportunities Well positioned in growing market segments… Neurovascular –$1.0B neurovascular market growing at 9% –$3.0B U.S. ischemic stroke market opportunity Percutaneous valve therapy –$3.0B transcatheter aortic valve implantation market opportunity Peripheral vascular –$1.2B peripheral vascular market growing at 6% In each of these markets we have… –Secured licenses with market leaders –Secured licenses with customers working on next generation technologies –Actively involved with unlicensed customers who are evaluating our coatings 15
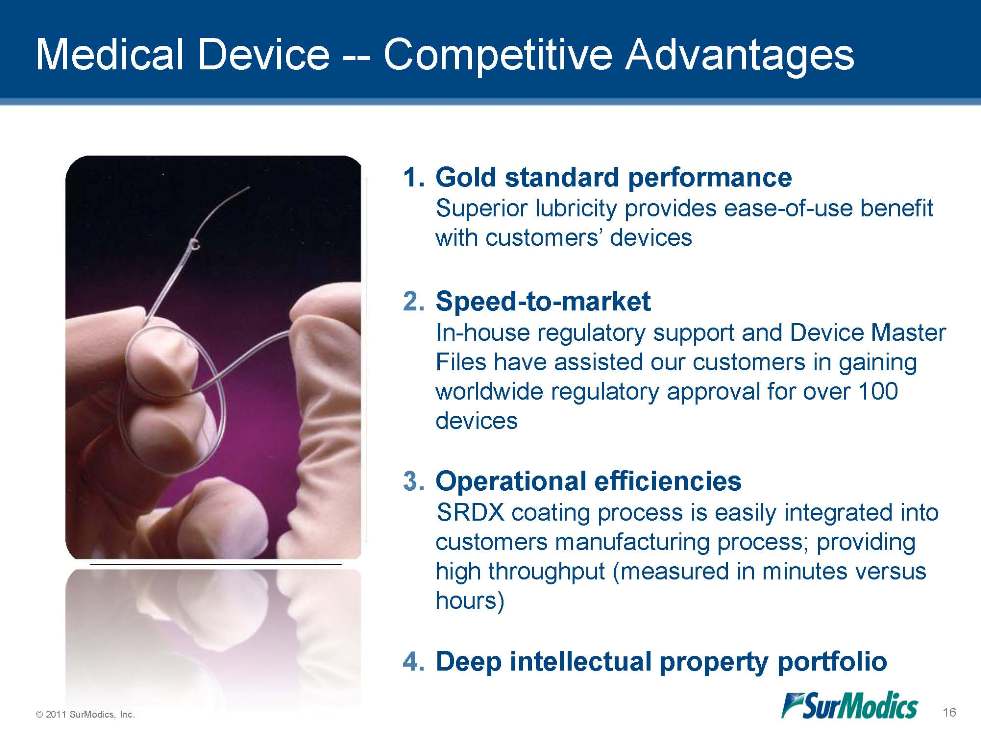
Medical Device -- Competitive Advantages 1.Gold standard performance Superior lubricity provides ease-of-use benefit with customers’ devices 2.Speed-to-market In-house regulatory support and Device Master Files have assisted our customers in gaining worldwide regulatory approval for over 100 devices 3.Operational efficiencies SRDX coating process is easily integrated into customers manufacturing process; providing high throughput (measured in minutes versus hours) 4.Deep intellectual property portfolio 16
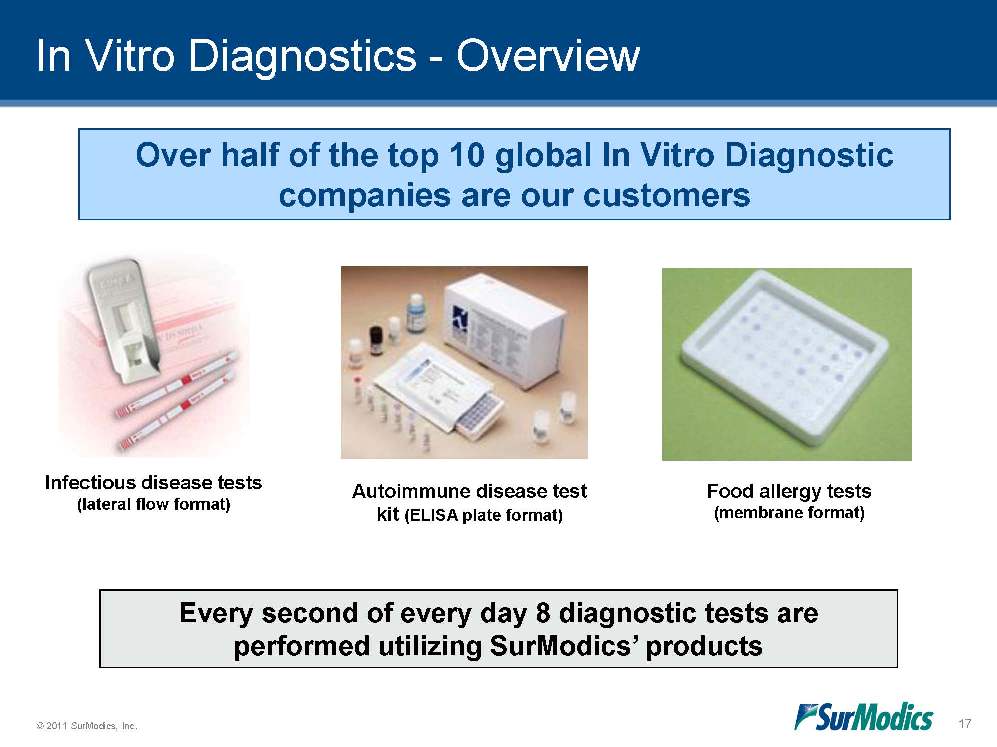
In Vitro Diagnostics - Overview Over half of the top 10 global In Vitro Diagnostic companies are our customers Food allergy tests (membrane format) Infectious disease tests (lateral flow format) Every second of every day 8 diagnostic tests are performed utilizing SurModics’ products Autoimmune disease test kit (ELISA plate format) 17
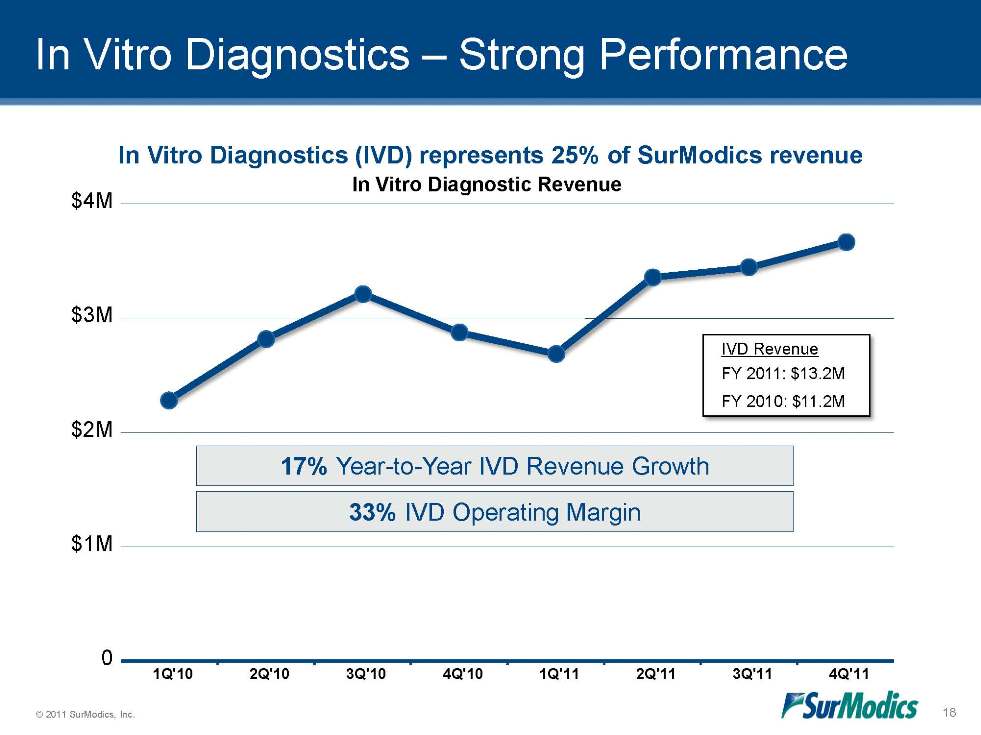
In Vitro Diagnostics – Strong Performance 17% Year-to-Year IVD Revenue Growth 33% IVD Operating Margin In Vitro Diagnostics (IVD) represents 25% of SurModics revenue FY 2011: $13.2M FY 2010: $11.2M IVD Revenue In Vitro Diagnostic Revenue 0 $1M $2M $3M $4M 1Q'10 2Q'10 3Q'10 4Q'10 1Q'11 2Q'11 3Q'11 4Q'11 18
In Vitro Diagnostics – Growth Drivers Plus a Bright Future… •New products that support customer needs •A growing customer base •Opportunity to increase our “share of test” 19
In Vitro Diagnostic – Product Opportunities New Products •Provide opportunities to increase our “share of test”; capture new customers; penetrate new market segments •Enhance our pipeline of new IVD products •Launched two new core diagnostic products in the fourth quarter of FY2011 •More to come, plan to launch several new products in FY2012 20
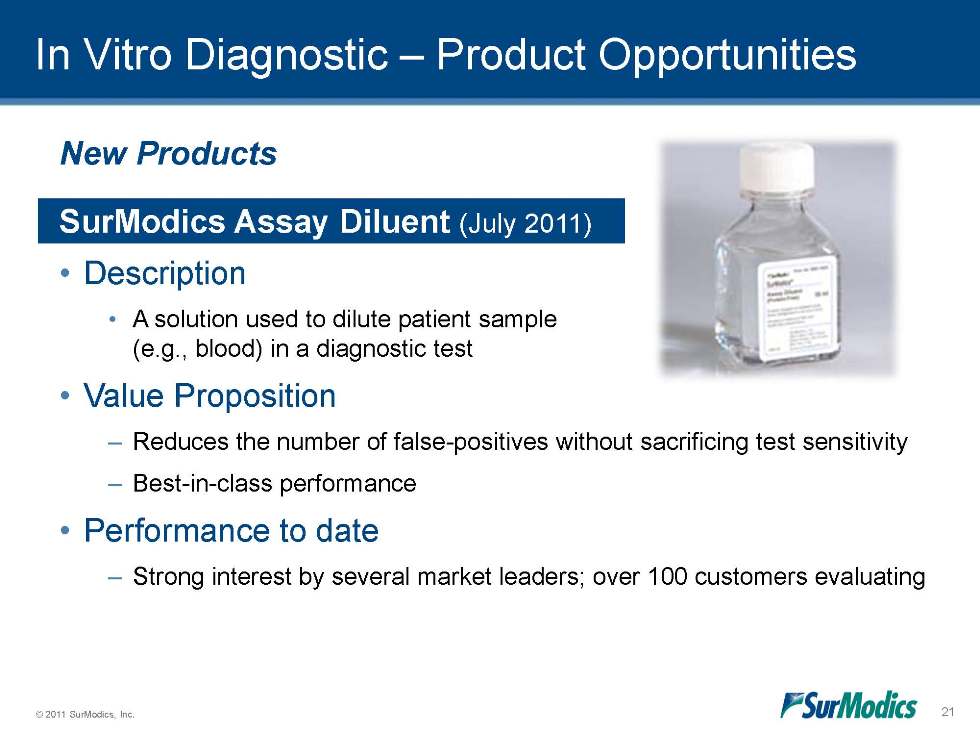
In Vitro Diagnostic – Product Opportunities New Products SurModics Assay Diluent (July 2011) •Description •A solution used to dilute patient sample (e.g., blood) in a diagnostic test •Value Proposition –Reduces the number of false-positives without sacrificing test sensitivity –Best-in-class performance •Performance to date –Strong interest by several market leaders; over 100 customers evaluating 21
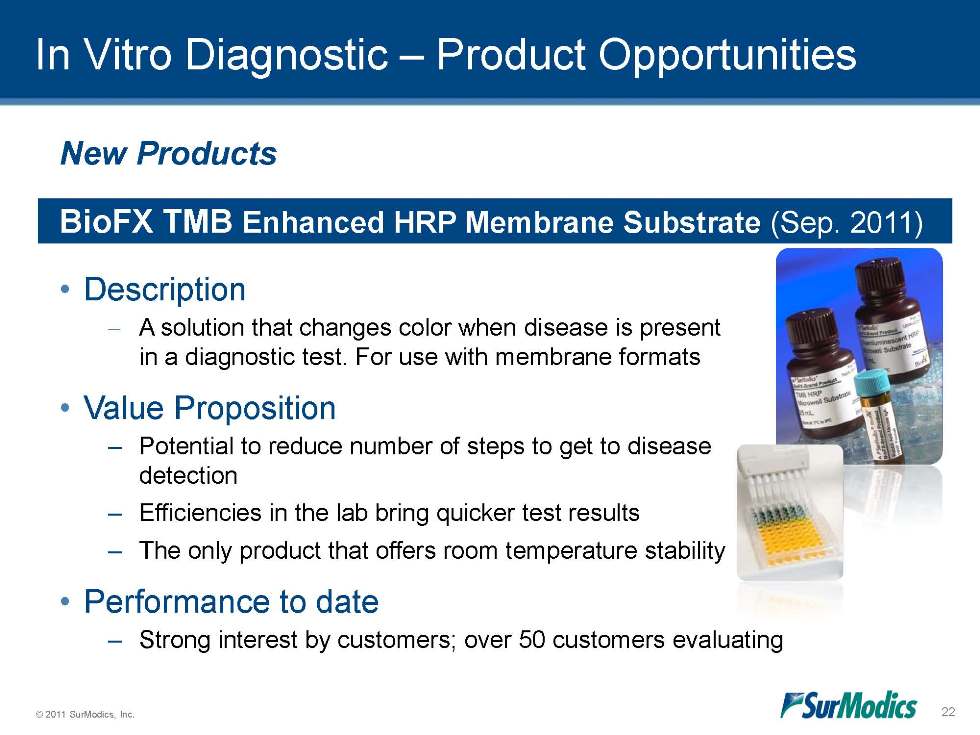
In Vitro Diagnostic – Product Opportunities New Products BioFX TMB Enhanced HRP Membrane Substrate (Sep. 2011) •Description –A solution that changes color when disease is present in a diagnostic test. For use with membrane formats •Value Proposition –Potential to reduce number of steps to get to disease detection –Efficiencies in the lab bring quicker test results –The only product that offers room temperature stability •Performance to date –Strong interest by customers; over 50 customers evaluating 22
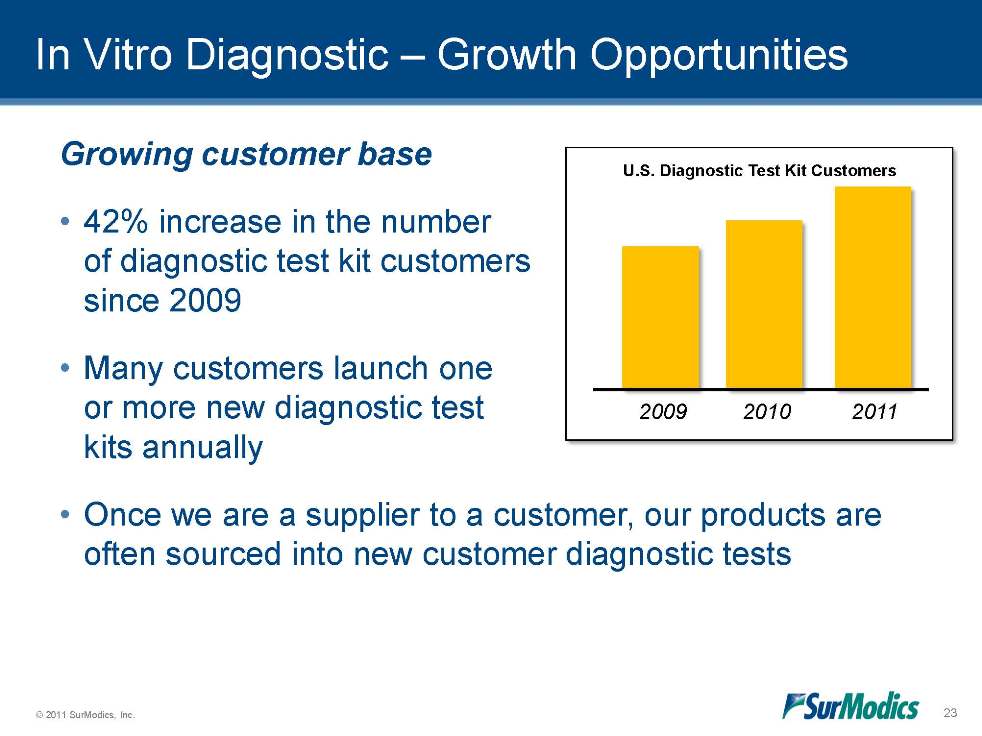
© 2011 SurModics, Inc. 23 Growing customer base •42% increase in the number of diagnostic test kit customers since 2009 •Many customers launch one or more new diagnostic test kits annually •Once we are a supplier to a customer, our products are often sourced into new customer diagnostic tests In Vitro Diagnostic – Growth Opportunities U.S. Diagnostic Test Kit Customers 2009 2010 2011
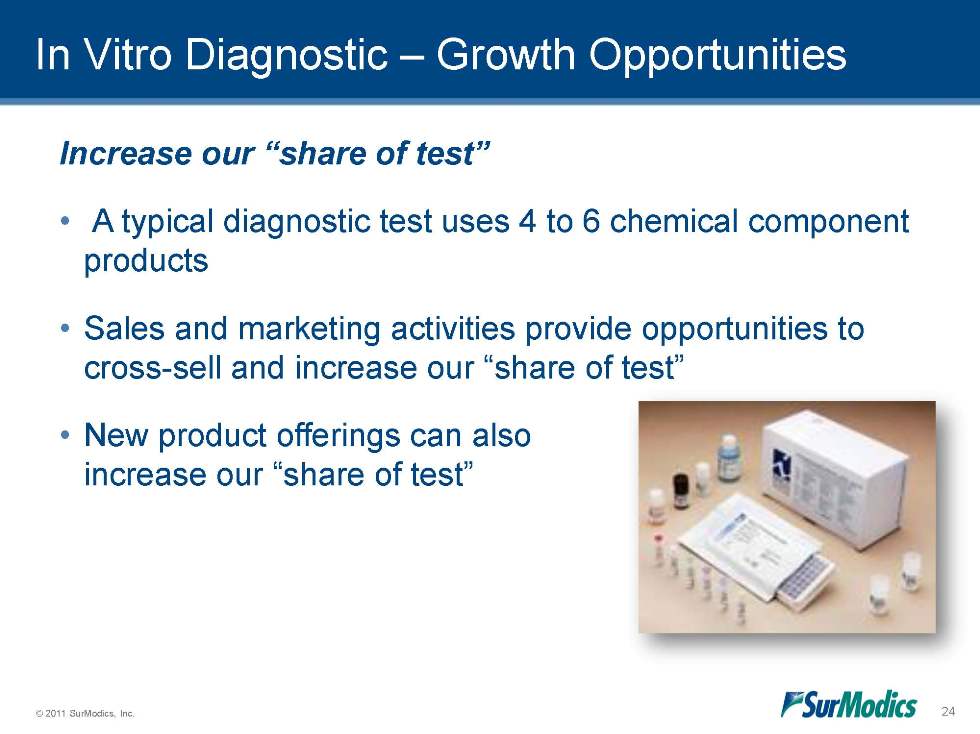
© 2011 SurModics, Inc. 24 In Vitro Diagnostic – Growth Opportunities Increase our “share of test” • A typical diagnostic test uses 4 to 6 chemical component products •Sales and marketing activities provide opportunities to cross-sell and increase our “share of test” •New product offerings can also increase our “share of test”
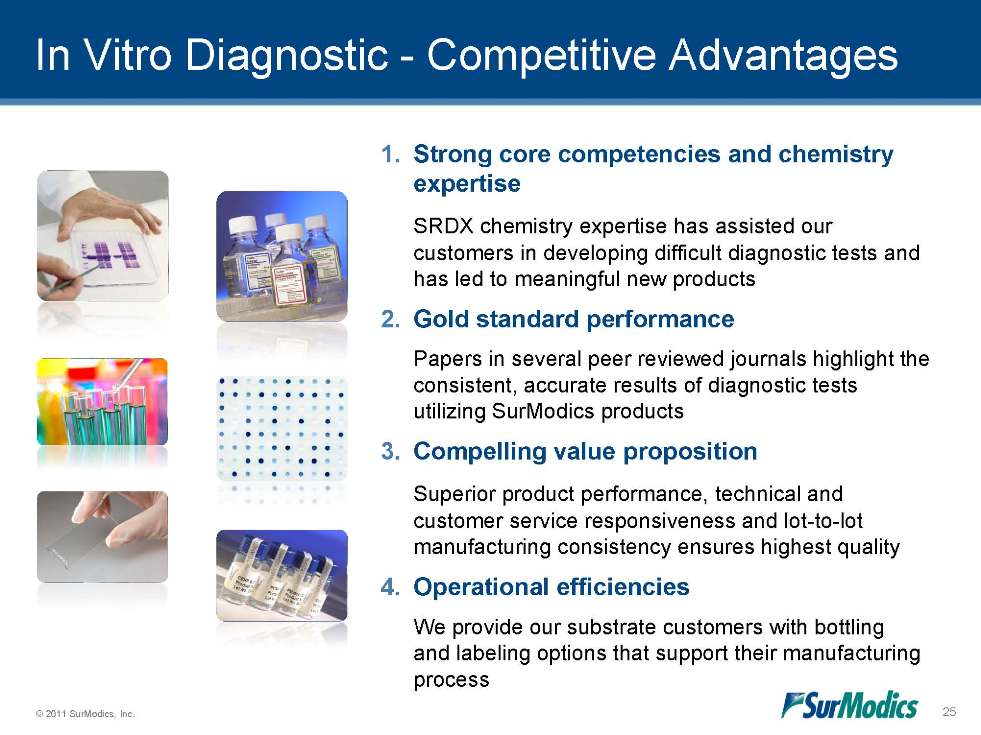
© 2011 SurModics, Inc. 25 In Vitro Diagnostic - Competitive Advantages 1.Strong core competencies and chemistry expertise SRDX chemistry expertise has assisted our customers in developing difficult diagnostic tests and has led to meaningful new products 2.Gold standard performance Papers in several peer reviewed journals highlight the consistent, accurate results of diagnostic tests utilizing SurModics products 3.Compelling value proposition Superior product performance, technical and customer service responsiveness and lot-to-lot manufacturing consistency ensures highest quality 4.Operational efficiencies We provide our substrate customers with bottling and labeling options that support their manufacturing process
Financial Review Tim Arens, Vice President of Finance and Interim CFO 26
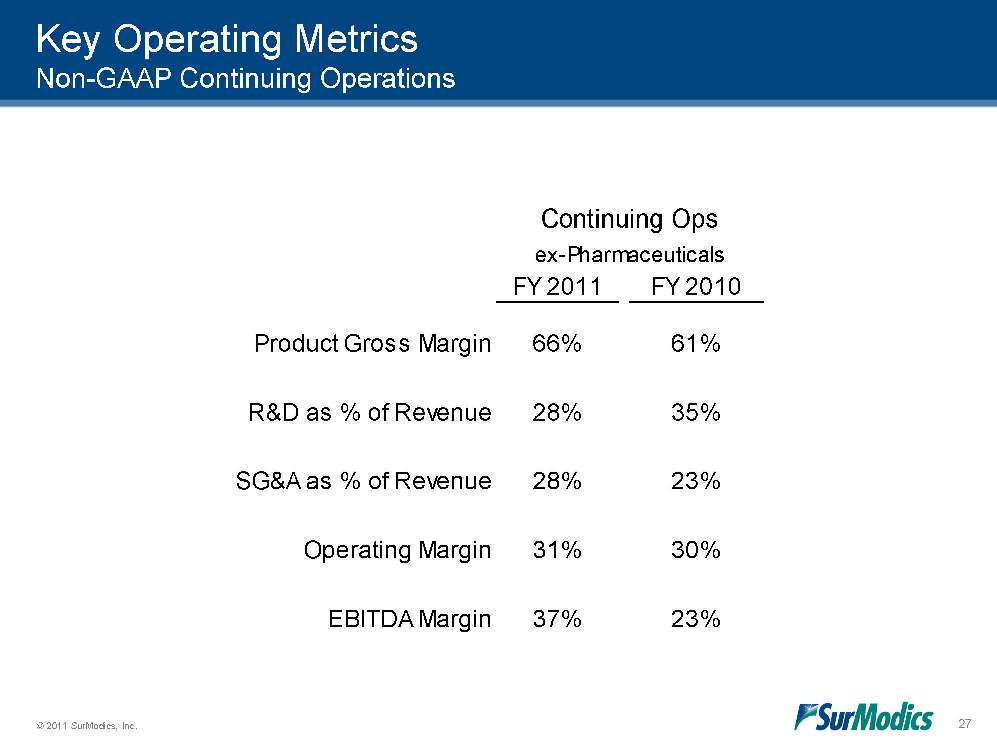
© 2011 SurModics, Inc. 27 FY 2011FY 201037%Continuing Opsex-PharmaceuticalsProduct Gross MarginR&D as % of Revenue66%61%28%35%SG&A as % of RevenueOperating MarginEBITDA Margin28%31%23%30%23%Key Operating Metrics Non-GAAP Continuing Operations
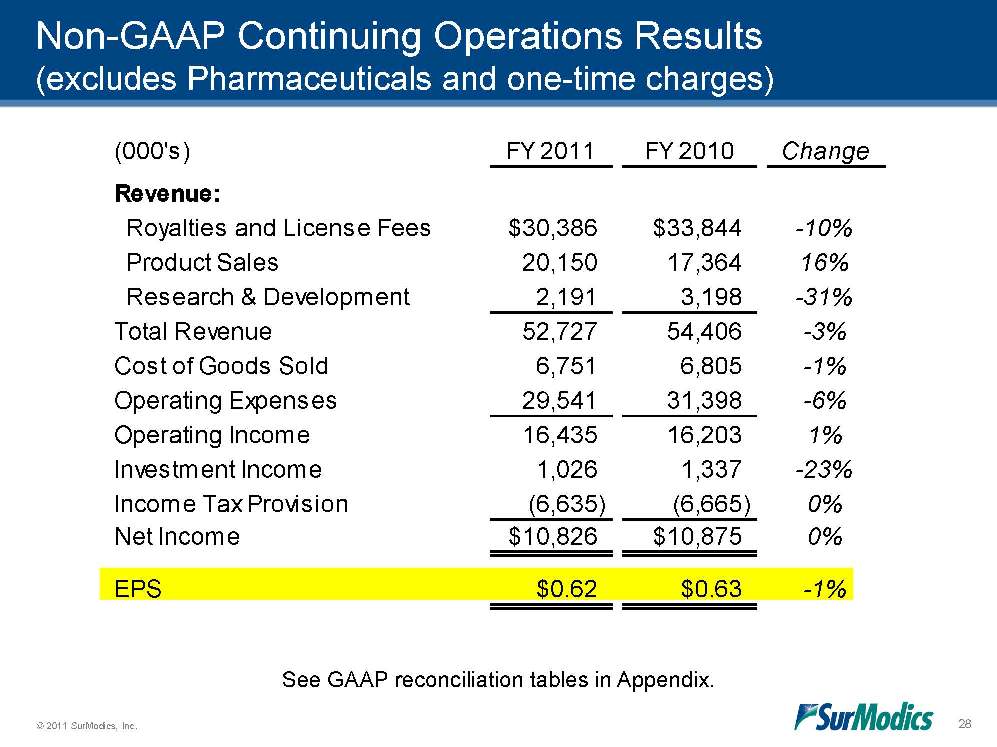
© 2011 SurModics, Inc. 28 (000's)FY 2011FY 2010ChangeRevenue: Royalties and License Fees$30,386$33,844-10% Product Sales20,15017,36416% Research & Development2,1913,198-31%Total Revenue52,72754,406-3%Cost of Goods Sold6,7516,805-1%Operating Expenses29,54131,398-6%Operating Income16,43516,2031%Investment Income1,0261,337-23%Income Tax Provision(6,635)(6,665)0%Net Income$10,826$10,8750%EPS$0.62$0.63-1%Non-GAAP Continuing Operations Results (excludes Pharmaceuticals and one-time charges) See GAAP reconciliation tables in Appendix.
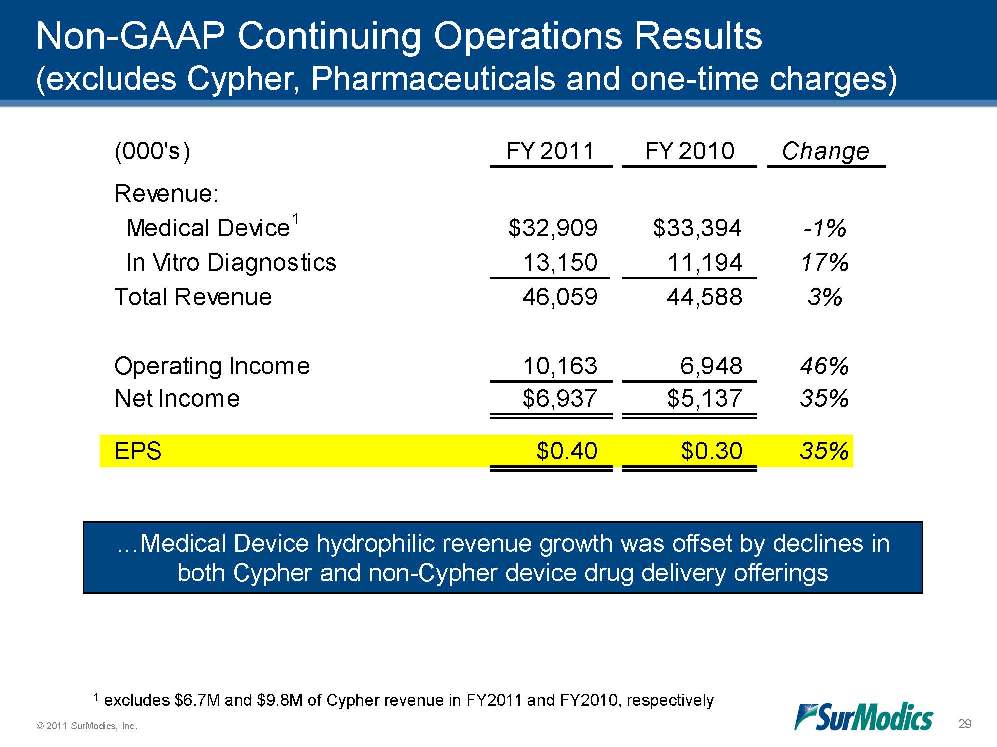
© 2011 SurModics, Inc. 29 (000's)FY 2011FY 2010ChangeRevenue: Medical Device1$32,909$33,394-1% In Vitro Diagnostics13,15011,19417%Total Revenue46,05944,5883%Operating Income10,1636,94846%Net Income$6,937$5,13735%EPS$0.40$0.3035%Non-GAAP Continuing Operations Results (excludes Cypher, Pharmaceuticals and one-time charges) …Medical Device hydrophilic revenue growth was offset by declines in both Cypher and non-Cypher device drug delivery offerings 1 excludes $6.7M and $9.8M of Cypher revenue in FY2011 and FY2010, respectively
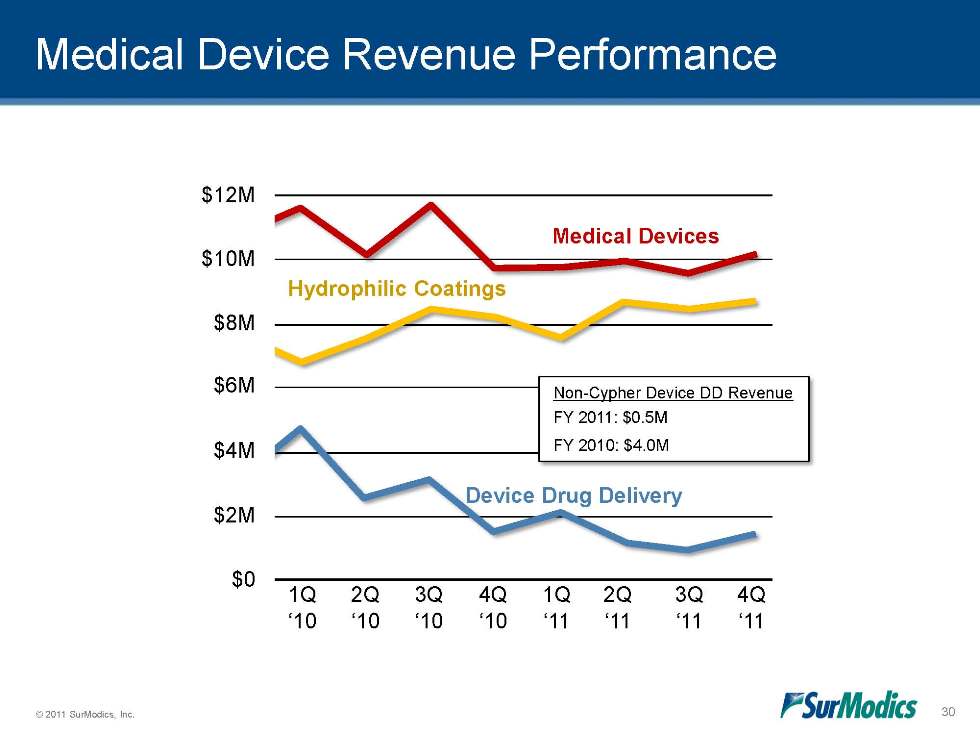
© 2011 SurModics, Inc. 30 Medical Device Revenue Performance Medical Devices Hydrophilic Coatings 1Q ‘09 2Q ‘09 3Q ‘09 4Q ‘09 1Q ‘10 2Q ‘10 3Q ‘10 4Q ‘10 1Q ‘11 2Q ‘11 3Q ‘11 4Q ‘11 Non-Cypher Device DD Revenue FY 2011: $0.5M FY 2010: $4.0M Device Drug Delivery $12M $10M $8M $6M $4M $2M $0
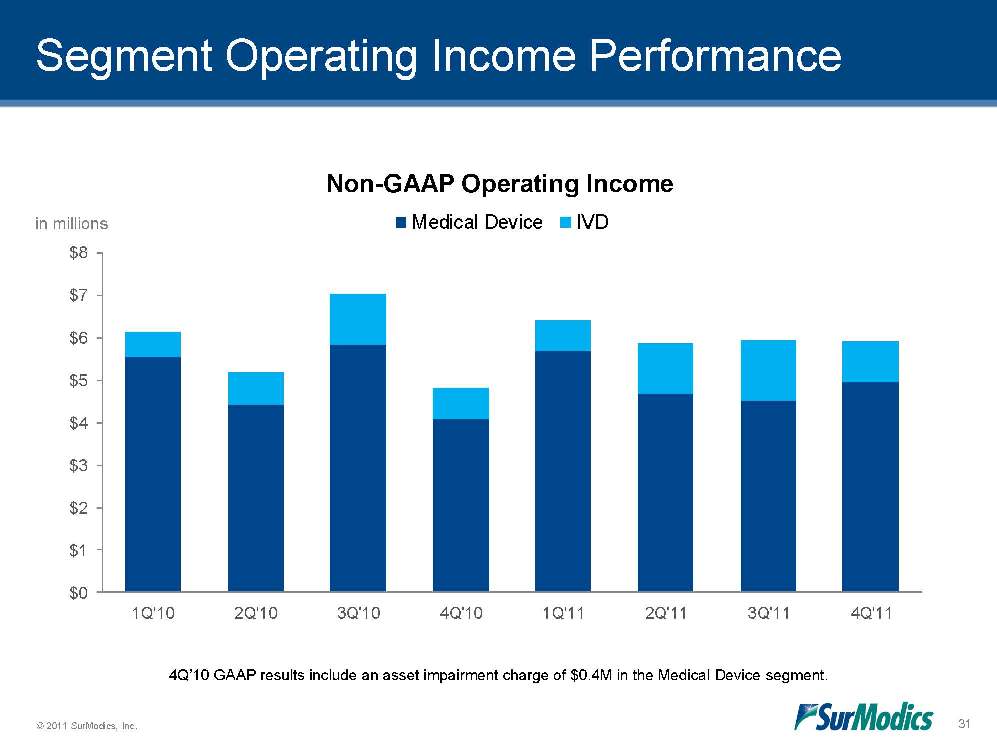
© 2011 SurModics, Inc. 31 Segment Operating Income Performance $0$1$2$3$4$5$6$7$81Q'102Q'103Q'104Q'101Q'112Q'113Q'114Q'11Non-GAAP Operating IncomeMedical DeviceIVDin millions 4Q’10 GAAP results include an asset impairment charge of $0.4M in the Medical Device segment.
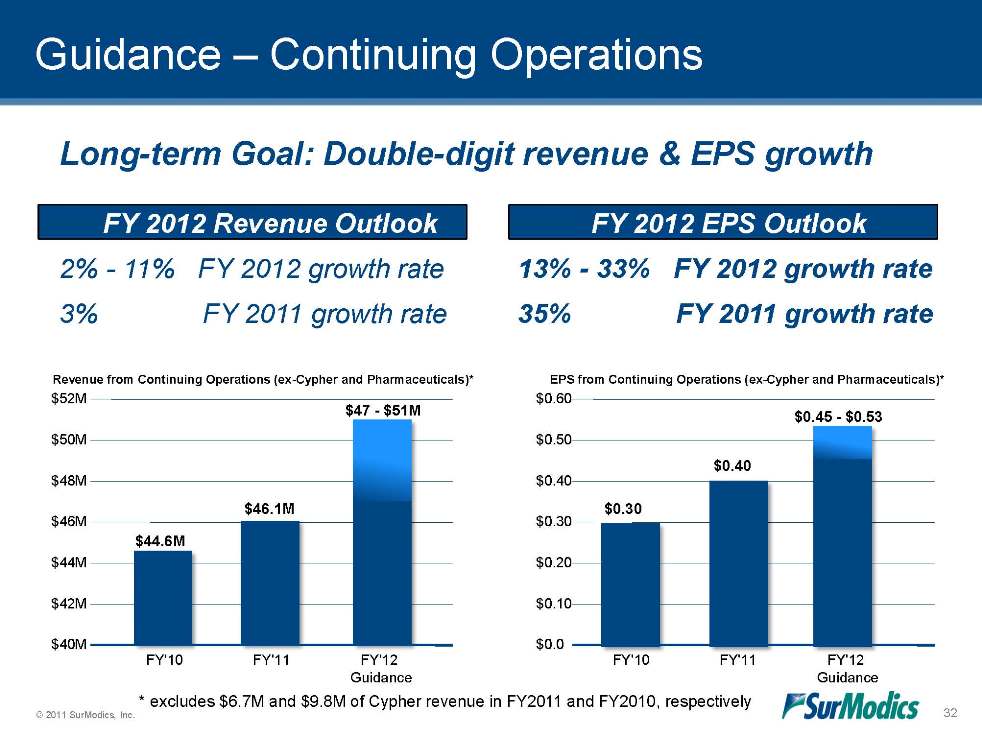
© 2011 SurModics, Inc. 32 $44.6M $46.1M $47 - $51M $0.30 $0.40 $0.45 - $0.53 Long-term Goal: Double-digit revenue & EPS growth 2% - 11% FY 2012 growth rate 3% FY 2011 growth rate 13% - 33% FY 2012 growth rate 35% FY 2011 growth rate Revenue from Continuing Operations (ex-Cypher and Pharmaceuticals)* $40M $42M $44M $46M $48M $50M $52M FY'10 FY'11 FY'12 Guidance EPS from Continuing Operations (ex-Cypher and Pharmaceuticals)* FY'10 FY'11 FY'12 Guidance $0.0 $0.10 $0.20 $0.30 $0.40 $0.50 $0.60 * excludes $6.7M and $9.8M of Cypher revenue in FY2011 and FY2010, respectively
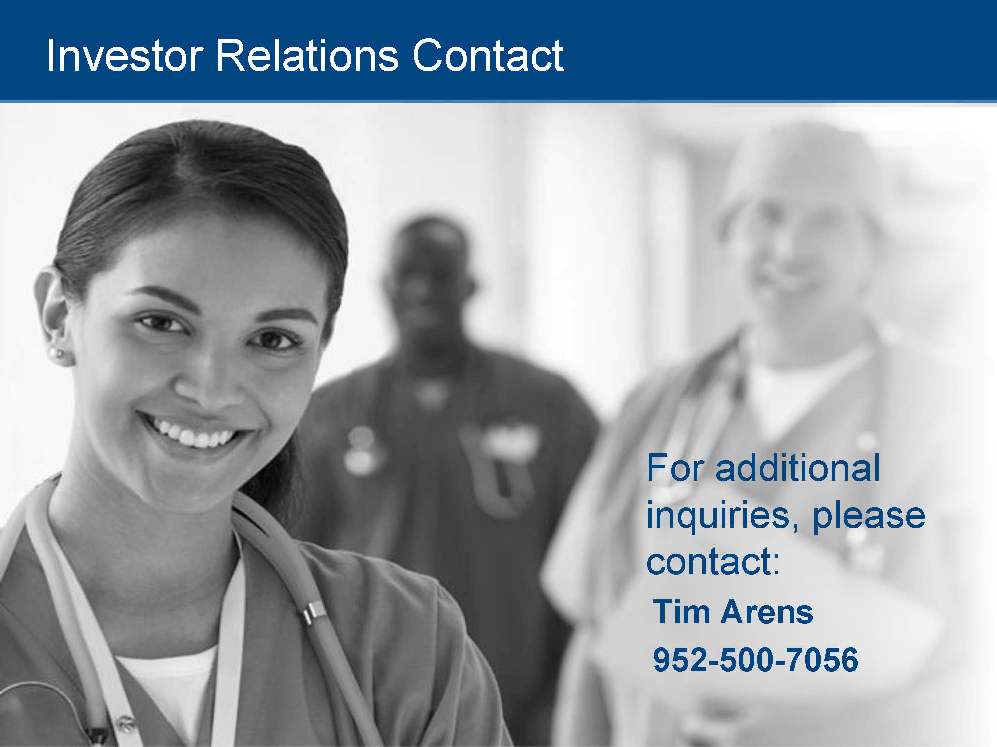
© 2011 SurModics, Inc. 33 Investor Relations Contact For additional inquiries, please contact: Tim Arens 952-500-7056
Appendix 34
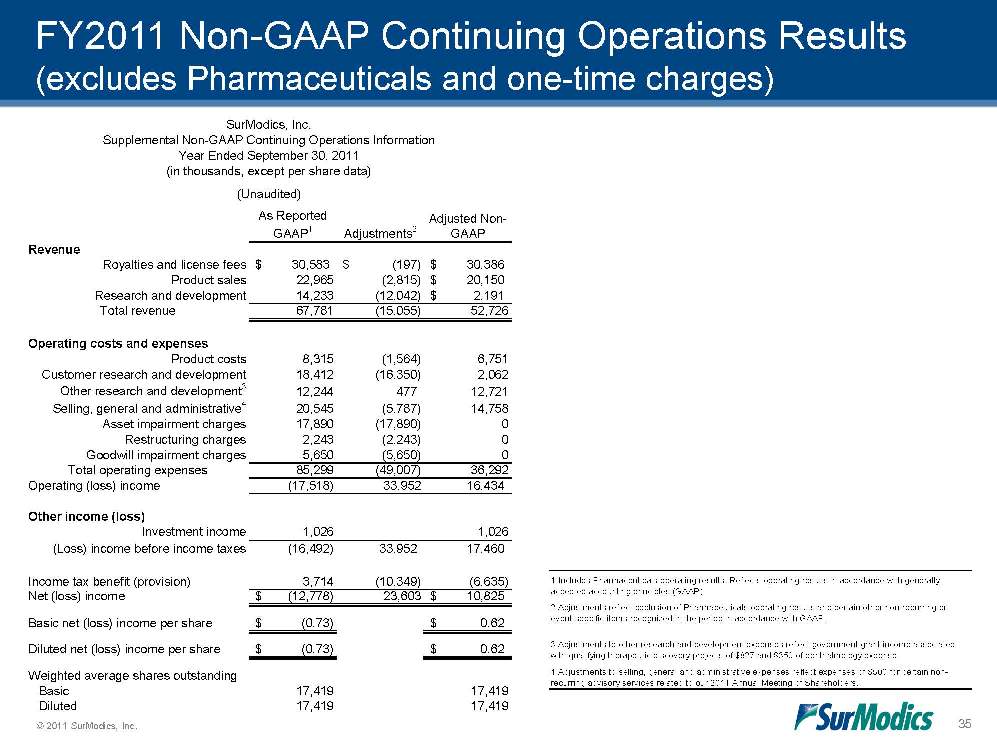
© 2011 SurModics, Inc. 35 FY2011 Non-GAAP Continuing Operations Results (excludes Pharmaceuticals and one-time charges) As Reported GAAP1Adjustments2Adjusted Non-GAAPRevenueRoyalties and license fees30,583$ (197)$ 30,386$ Product sales22,965(2,815)20,150$ Research and development14,233(12,042)2,191$ Total revenue67,781(15,055)52,726Operating costs and expensesProduct costs8,315(1,564)6,751Customer research and development18,412(16,350)2,062Other research and development312,24447712,721Selling, general and administrative420,545(5,787)14,758Asset impairment charges17,890(17,890)0Restructuring charges2,243(2,243)0Goodwill impairment charges5,650(5,650)0Total operating expenses85,299(49,007)36,292Operating (loss) income(17,518)33,95216,434Other income (loss)Investment income1,0261,026(Loss) income before income taxes(16,492)33,95217,460Income tax benefit (provision)3,714(10,349)(6,635)Net (loss) income(12,778)$ 23,60310,825$ Basic net (loss) income per share(0.73)$ 0.62$ Diluted net (loss) income per share(0.73)$ 0.62$ Weighted average shares outstanding Basic17,41917,419 Diluted17,41917,419(Unaudited)SurModics, Inc.Supplemental Non-GAAP Continuing Operations InformationYear Ended September 30, 2011(in thousands, except per share data)4 Adjustments to selling, general and administrative expenses reflect expenses of $500 for certain non-recurring advisory services related to our 2011 Annual Meeting of Shareholders.1 Includes Pharmaceuticals operating results. Reflects operating results in accordance with generally accepted accounting principles (GAAP).2 Adjustments reflect exclusion of Pharmaceuticals operating results and certain other non-recurring or event-specific items recognized in the period in accordance with GAAP.3 Adjustments to other research and development expenses reflect government grant income associated with qualifying therapeutic discovery projects of $827 and $350 of ophthalmology expense.
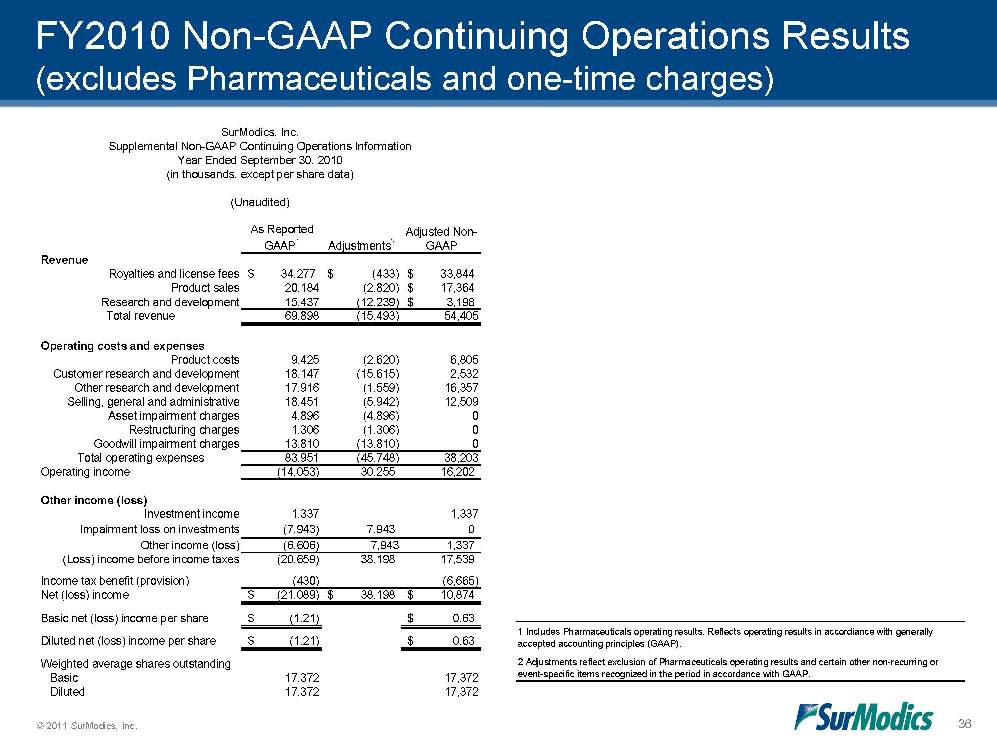
© 2011 SurModics, Inc. 36 FY2010 Non-GAAP Continuing Operations Results (excludes Pharmaceuticals and one-time charges) 2 Adjustments reflect exclusion of Pharmaceuticals operating results and certain other non-recurring or event-specific items recognized in the period in accordance with GAAP.1 Includes Pharmaceuticals operating results. Reflects operating results in accordiance with generally accepted accounting principles (GAAP).As Reported GAAP1Adjustments2Adjusted Non-GAAPRevenueRoyalties and license fees34,277$ (433)$ 33,844$ Product sales20,184(2,820)17,364$ Research and development15,437(12,239)3,198$ Total revenue69,898(15,493)54,405Operating costs and expensesProduct costs9,425(2,620)6,805Customer research and development18,147(15,615)2,532Other research and development17,916(1,559)16,357Selling, general and administrative18,451(5,942)12,509Asset impairment charges4,896(4,896)0Restructuring charges1,306(1,306)0Goodwill impairment charges13,810(13,810)0Total operating expenses83,951(45,748)38,203Operating income(14,053)30,25516,202Other income (loss)Investment income1,3371,337Impairment loss on investments(7,943)7,9430Other income (loss)(6,606)7,9431,337(Loss) income before income taxes(20,659)38,19817,539Income tax benefit (provision)(430)(6,665)Net (loss) income(21,089)$ 38,198$ 10,874$ Basic net (loss) income per share(1.21)$ 0.63$ Diluted net (loss) income per share(1.21)$ 0.63$ Weighted average shares outstanding Basic17,37217,372 Diluted17,37217,372(Unaudited)SurModics, Inc.Supplemental Non-GAAP Continuing Operations InformationYear Ended September 30, 2010(in thousands, except per share data)