Attached files
| file | filename |
|---|---|
| 8-K - FORM 8-K - CHESAPEAKE UTILITIES CORP | c24790e8vk.htm |
Exhibit 99.1

| Rooted in TraditionBranching to New Opportunities November 15-16, 2011 Northeast Financial Community Meetings |
| 2 Safe Harbor Statement: Some of the Statements in this document concerning future company performance will be forward-looking within the meanings of the securities laws. Actual results may materially differ from those discussed in these forward-looking statements, and you should refer to the additional information contained in Chesapeake Utilities Corporation's 2010 Annual Report on Form 10-K filed with the SEC and our other SEC filings concerning factors that could cause those results to be different than contemplated in today's discussion.REG G Disclosure: Today's discussion includes certain non-GAAP financial measures as defined under SEC Regulation G. Although non-GAAP measures are not intended to replace the GAAP measures for evaluation of Chesapeake's performance, Chesapeake believes that the portions of the presentation, which include certain non-GAAP financial measures, provide helpful comparison for an investor's evaluation purposes.Gross Margin: Gross Margin is determined by deducting the cost of sales from operating revenue. Cost of sales includes the purchased fuel cost for natural gas, electric and propane distribution operations and the cost of labor spent on different revenue-producing activities. Other companies may calculate gross margin in a different manner. Forward Looking Statements and Other Disclosures |
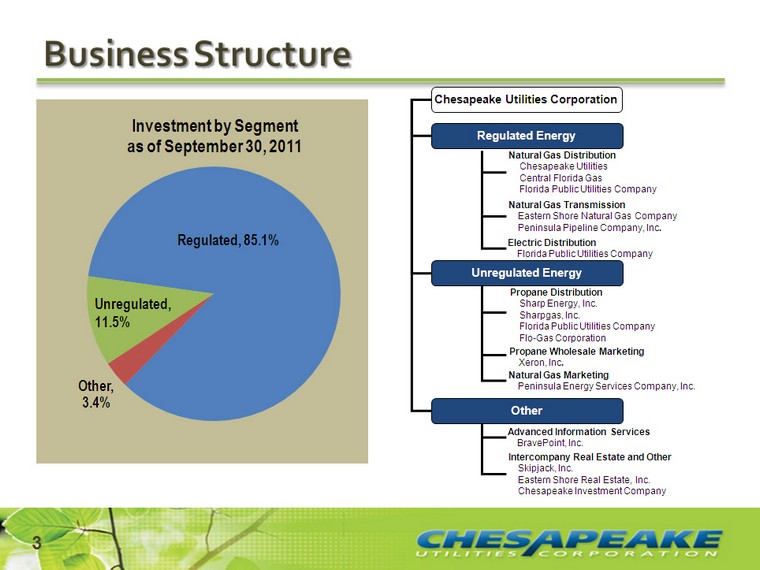
| Business Structure Electric DistributionFlorida Public Utilities Company (CHART) 3 |

| Geography Diversity (CHART) (CHART) (CHART) 4 We have sizable operations in two different geographic areas - on the Delmarva Peninsula and in Florida. This has created weather, customer, and regulatory diversification. |
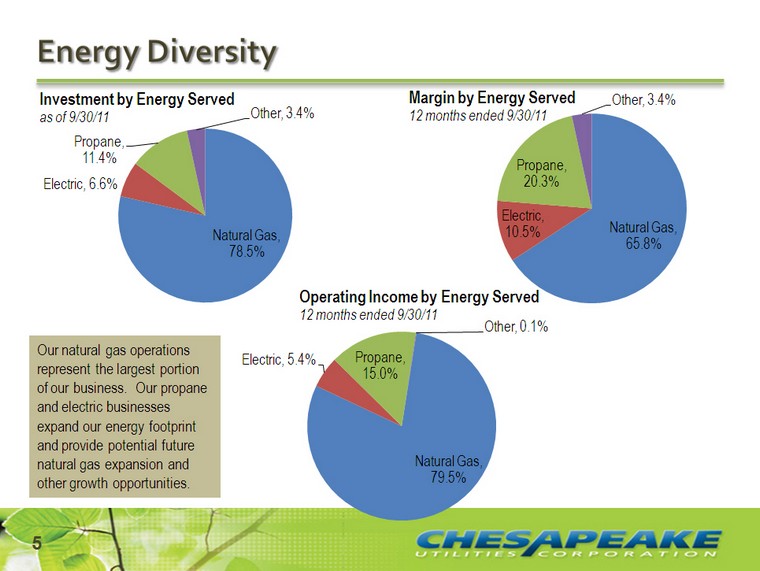
| Energy Diversity (CHART) (CHART) (CHART) 5 Our natural gas operations represent the largest portion of our business. Our propane and electric businesses expand our energy footprint and provide potential future natural gas expansion and other growth opportunities. |
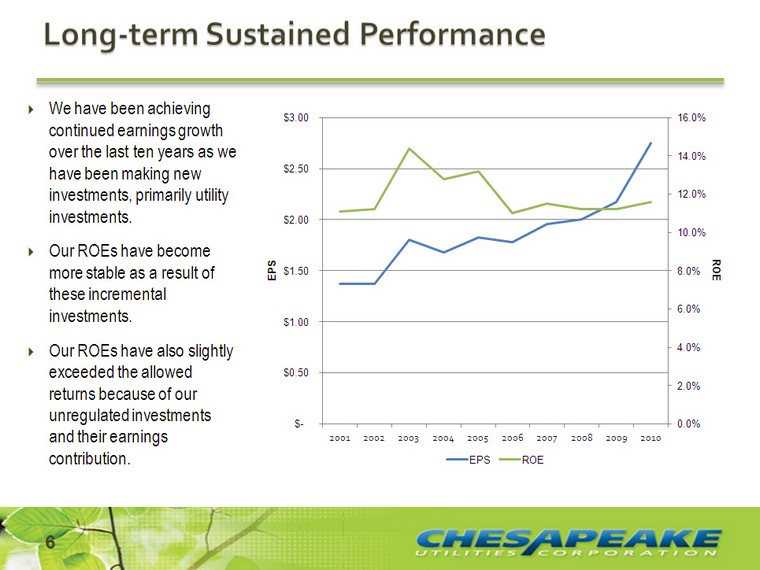
| We have been achieving continued earnings growth over the last ten years as we have been making new investments, primarily utility investments.Our ROEs have become more stable as a result of these incremental investments.Our ROEs have also slightly exceeded the allowed returns because of our unregulated investments and their earnings contribution. 6 Long-term Sustained Performance (CHART) |
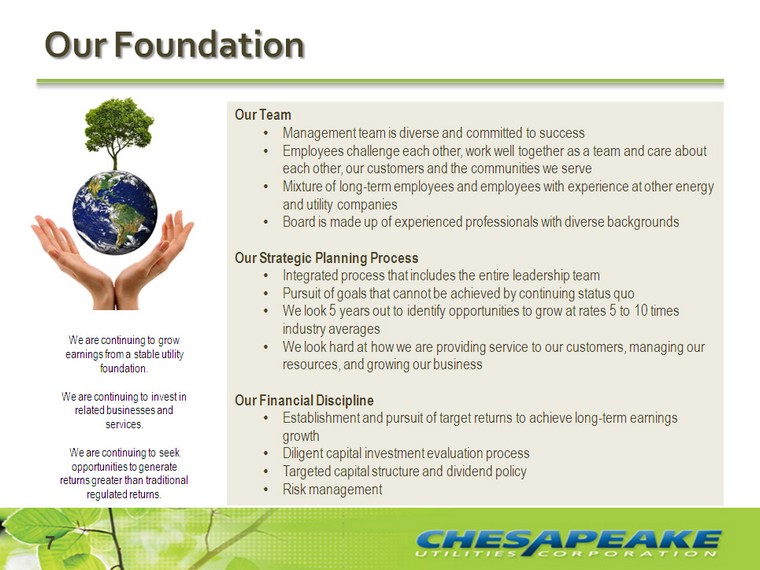
| 7 Our Foundation Our TeamManagement team is diverse and committed to successEmployees challenge each other, work well together as a team and care about each other, our customers and the communities we serveMixture of long-term employees and employees with experience at other energy and utility companiesBoard is made up of experienced professionals with diverse backgroundsOur Strategic Planning ProcessIntegrated process that includes the entire leadership teamPursuit of goals that cannot be achieved by continuing status quoWe look 5 years out to identify opportunities to grow at rates 5 to 10 times industry averagesWe look hard at how we are providing service to our customers, managing our resources, and growing our businessOur Financial DisciplineEstablishment and pursuit of target returns to achieve long-term earnings growthDiligent capital investment evaluation processTargeted capital structure and dividend policyRisk management We are continuing to grow earnings from a stable utility foundation.We are continuing to invest in related businesses and services.We are continuing to seek opportunities to generate returns greater than traditional regulated returns. |
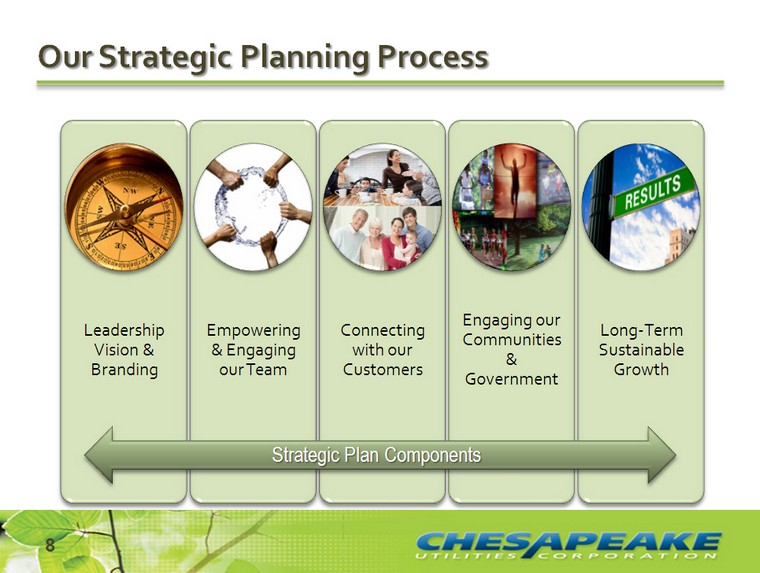
| 8 Our Strategic Planning Process Strategic Plan Components |
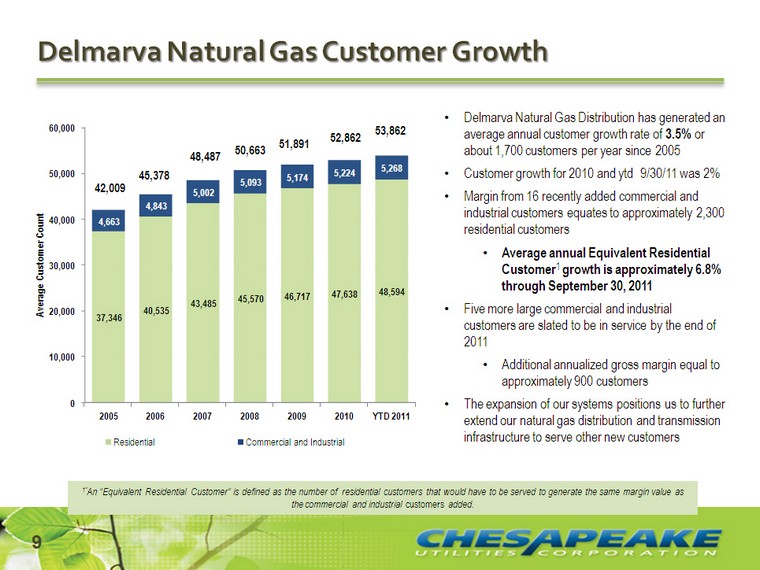
| (CHART) Delmarva Natural Gas Customer Growth 1"An "Equivalent Residential Customer" is defined as the number of residential customers that would have to be served to generate the same margin value as the commercial and industrial customers added. Delmarva Natural Gas Distribution has generated an average annual customer growth rate of 3.5% or about 1,700 customers per year since 2005 Customer growth for 2010 and ytd 9/30/11 was 2%Margin from 16 recently added commercial and industrial customers equates to approximately 2,300 residential customersAverage annual Equivalent Residential Customer1 growth is approximately 6.8% through September 30, 2011Five more large commercial and industrial customers are slated to be in service by the end of 2011Additional annualized gross margin equal to approximately 900 customersThe expansion of our systems positions us to further extend our natural gas distribution and transmission infrastructure to serve other new customers 42,009 45,378 48,487 50,663 51,891 52,862 9 53,862 |

| 10 Natural Gas Transmission Growth (CHART) Eastern Shore Natural Gas has been serving Delmarva since 1958.Owns and operates 398 miles of natural gas pipelineConstructed over 100 miles of natural gas pipeline infrastructure over the last 10 yearsExpansions over the last 10 years extended natural gas service to Eastern Sussex County, DelawareNew expansion projects will generate $1,172,000 in 2011New transportation services as a result of the 8 miles mainline extension to interconnect with Texas Eastern were initiated in 20113-year phase-in of the new transportation servicesEstimated annual gross margin of approximately $2.0 millionIn November 2012, additional annual gross margin of $263,000 will be generated from the phase- in of new services |
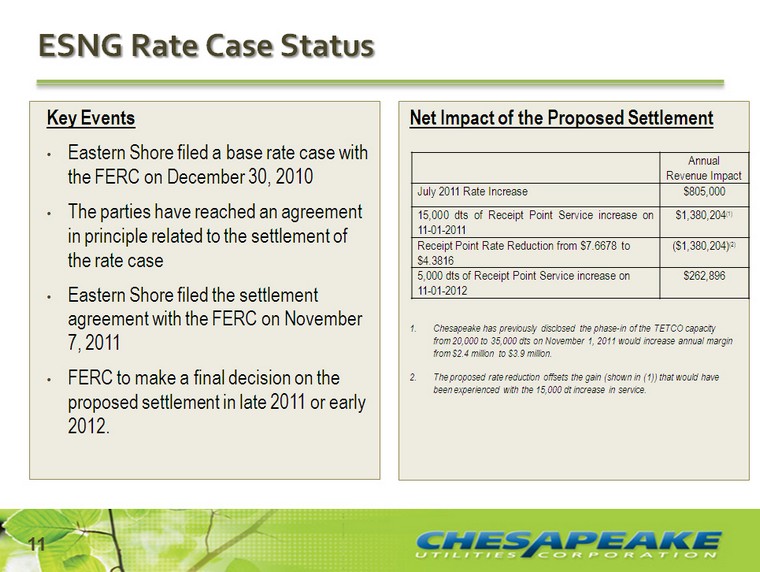
| 11 ESNG Rate Case Status Key EventsEastern Shore filed a base rate case with the FERC on December 30, 2010The parties have reached an agreement in principle related to the settlement of the rate caseEastern Shore filed the settlement agreement with the FERC on November 7, 2011FERC to make a final decision on the proposed settlement in late 2011 or early 2012. Net Impact of the Proposed Settlement Chesapeake has previously disclosed the phase-in of the TETCO capacity from 20,000 to 35,000 dts on November 1, 2011 would increase annual margin from $2.4 million to $3.9 million.The proposed rate reduction offsets the gain (shown in (1)) that would have been experienced with the 15,000 dt increase in service. Annual Revenue Impact July 2011 Rate Increase $805,000 15,000 dts of Receipt Point Service increase on 11-01-2011 $1,380,204(1) Receipt Point Rate Reduction from $7.6678 to $4.3816 ($1,380,204)(2) 5,000 dts of Receipt Point Service increase on 11-01-2012 $262,896 |
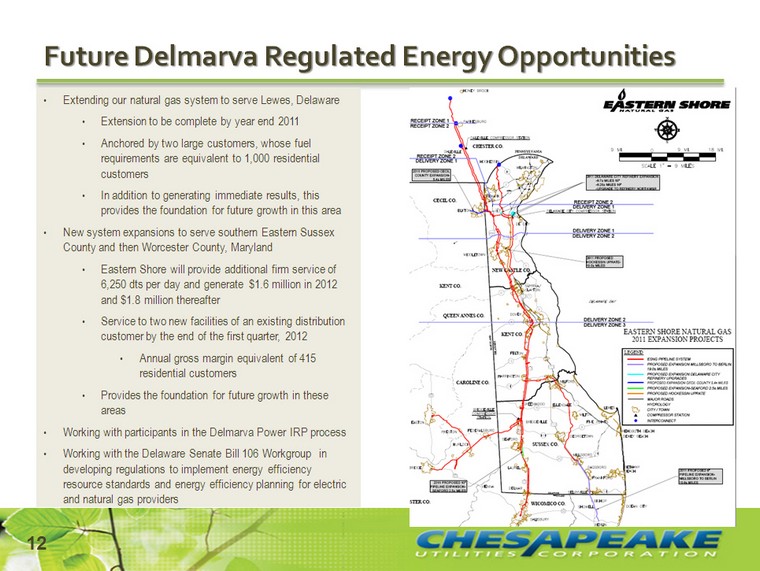
| Extending our natural gas system to serve Lewes, DelawareExtension to be complete by year end 2011Anchored by two large customers, whose fuel requirements are equivalent to 1,000 residential customersIn addition to generating immediate results, this provides the foundation for future growth in this area New system expansions to serve southern Eastern Sussex County and then Worcester County, MarylandEastern Shore will provide additional firm service of 6,250 dts per day and generate $1.6 million in 2012 and $1.8 million thereafterService to two new facilities of an existing distribution customer by the end of the first quarter, 2012Annual gross margin equivalent of 415 residential customersProvides the foundation for future growth in these areasWorking with participants in the Delmarva Power IRP processWorking with the Delaware Senate Bill 106 Workgroup in developing regulations to implement energy efficiency resource standards and energy efficiency planning for electric and natural gas providers Future Delmarva Regulated Energy Opportunities 12 |
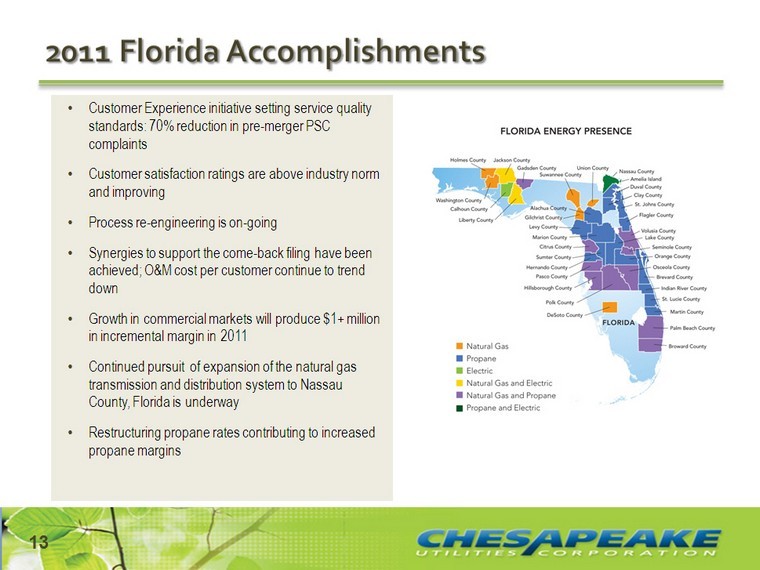
| 2011 Florida Accomplishments Customer Experience initiative setting service quality standards: 70% reduction in pre-merger PSC complaintsCustomer satisfaction ratings are above industry norm and improvingProcess re-engineering is on-goingSynergies to support the come-back filing have been achieved; O&M cost per customer continue to trend downGrowth in commercial markets will produce $1+ million in incremental margin in 2011Continued pursuit of expansion of the natural gas transmission and distribution system to Nassau County, Florida is underwayRestructuring propane rates contributing to increased propane margins 13 |
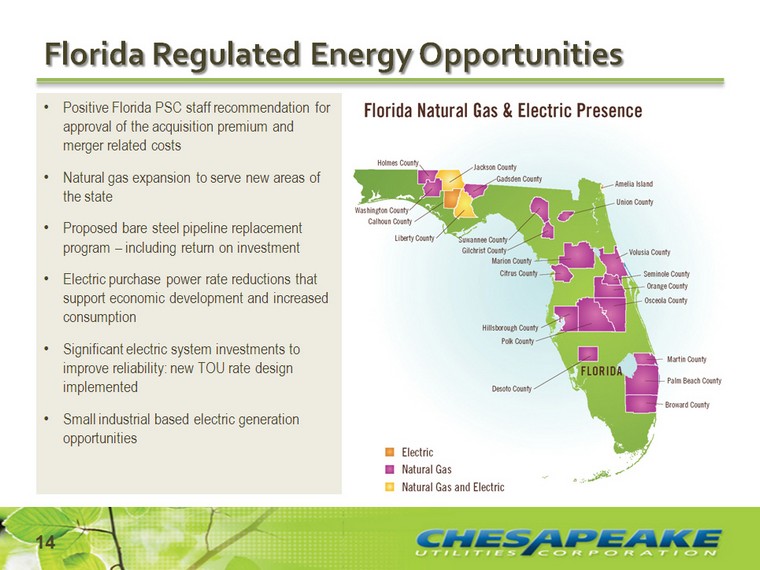
| 14 Positive Florida PSC staff recommendation for approval of the acquisition premium and merger related costsNatural gas expansion to serve new areas of the stateProposed bare steel pipeline replacement program - including return on investmentElectric purchase power rate reductions that support economic development and increased consumptionSignificant electric system investments to improve reliability: new TOU rate design implementedSmall industrial based electric generation opportunities Florida Regulated Energy Opportunities |
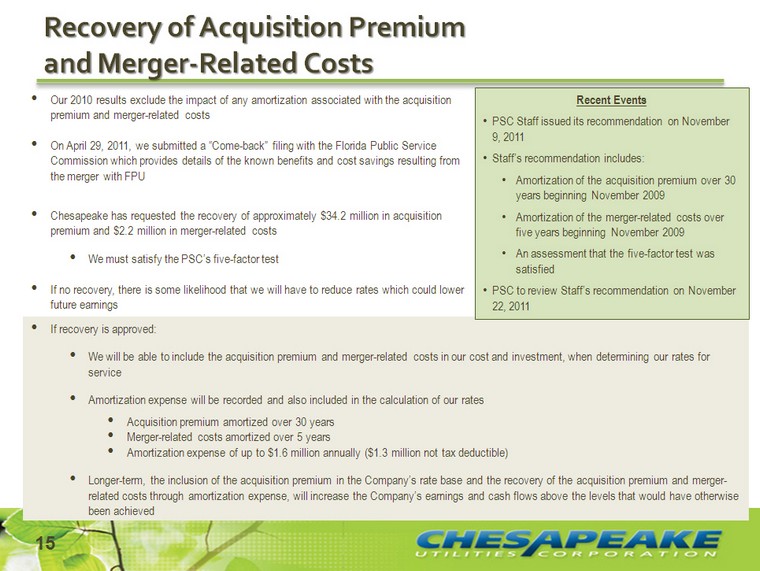
| If recovery is approved:We will be able to include the acquisition premium and merger-related costs in our cost and investment, when determining our rates for serviceAmortization expense will be recorded and also included in the calculation of our ratesAcquisition premium amortized over 30 yearsMerger-related costs amortized over 5 yearsAmortization expense of up to $1.6 million annually ($1.3 million not tax deductible)Longer-term, the inclusion of the acquisition premium in the Company's rate base and the recovery of the acquisition premium and merger- related costs through amortization expense, will increase the Company's earnings and cash flows above the levels that would have otherwise been achieved 15 Recovery of Acquisition Premiumand Merger-Related Costs Our 2010 results exclude the impact of any amortization associated with the acquisition premium and merger-related costsOn April 29, 2011, we submitted a "Come-back" filing with the Florida Public Service Commission which provides details of the known benefits and cost savings resulting from the merger with FPUChesapeake has requested the recovery of approximately $34.2 million in acquisition premium and $2.2 million in merger-related costsWe must satisfy the PSC's five-factor testIf no recovery, there is some likelihood that we will have to reduce rates which could lower future earnings Recent EventsPSC Staff issued its recommendation on November 9, 2011Staff's recommendation includes:Amortization of the acquisition premium over 30 years beginning November 2009Amortization of the merger-related costs over five years beginning November 2009An assessment that the five-factor test was satisfiedPSC to review Staff's recommendation on November 22, 2011 |
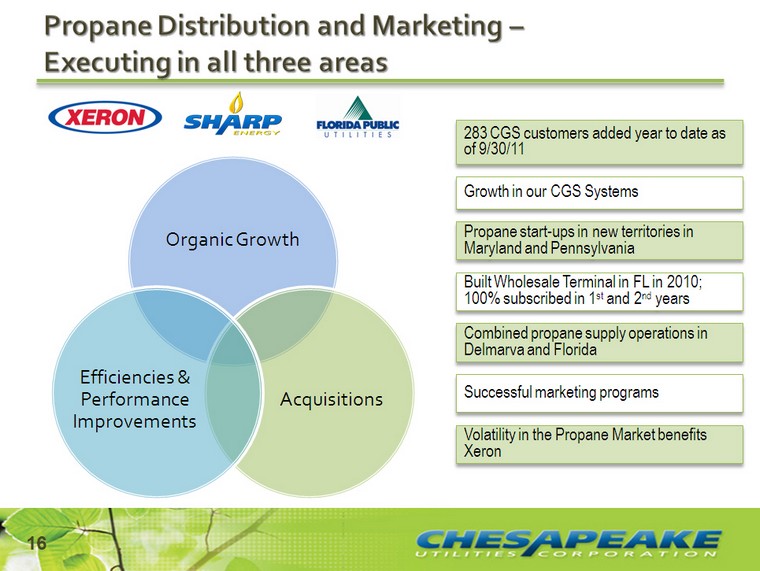
| Propane Distribution and Marketing - Executing in all three areas Executing in all three areas Executing in all three areas Growth in our CGS Systems Propane start-ups in new territories in Maryland and Pennsylvania Successful marketing programs 283 CGS customers added year to date as of 9/30/11 Combined propane supply operations in Delmarva and Florida Built Wholesale Terminal in FL in 2010; 100% subscribed in 1st and 2nd years 16 Volatility in the Propane Market benefits Xeron |
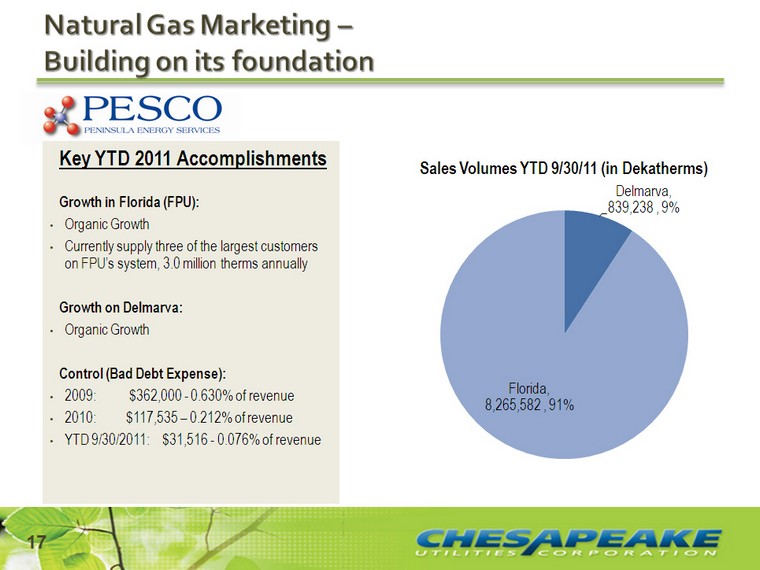
| Natural Gas Marketing - Building on its foundation Key YTD 2011 AccomplishmentsGrowth in Florida (FPU):Organic GrowthCurrently supply three of the largest customers on FPU's system, 3.0 million therms annuallyGrowth on Delmarva:Organic Growth Control (Bad Debt Expense):2009: $362,000 - 0.630% of revenue2010: $117,535 - 0.212% of revenueYTD 9/30/2011: $31,516 - 0.076% of revenue(CHART) 17 |

| Advanced Information Services Core is Strong; TM Launch Successfully Underway Key YTD 2011 AccomplishmentsCoreManaged services continues to growBI Practice also continues to growOpportunities for Application Evolution(tm) continue to surfaceThree implementations completeTwo other executed contracts with implementations in December 2011/January 2012Other proposals under consideration by potential customers Monthly Managed Services Growth 18 TM Operating IncomeYtd 9/30/2011 (CHART) (CHART) |
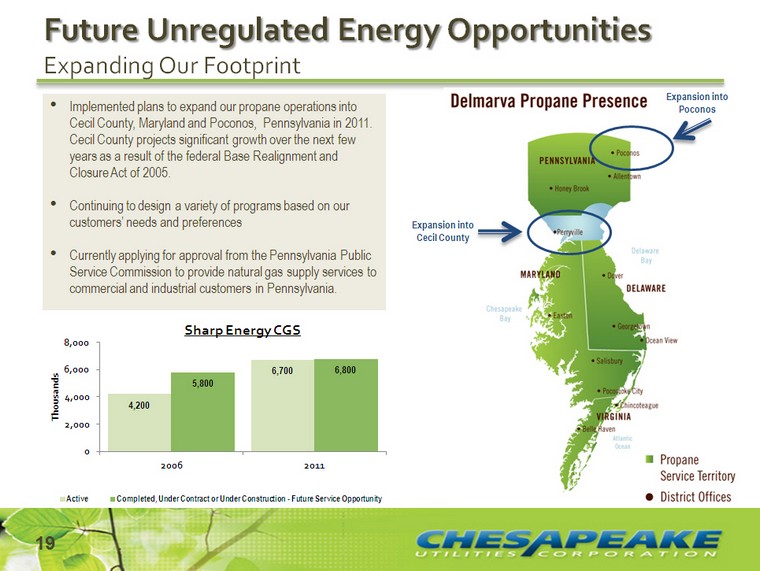
| 19 Implemented plans to expand our propane operations into Cecil County, Maryland and Poconos, Pennsylvania in 2011. Cecil County projects significant growth over the next few years as a result of the federal Base Realignment and Closure Act of 2005. Continuing to design a variety of programs based on our customers' needs and preferencesCurrently applying for approval from the Pennsylvania Public Service Commission to provide natural gas supply services to commercial and industrial customers in Pennsylvania. Future Unregulated Energy OpportunitiesExpanding Our Footprint (CHART) Expansion intoCecil County Expansion intoPoconos |
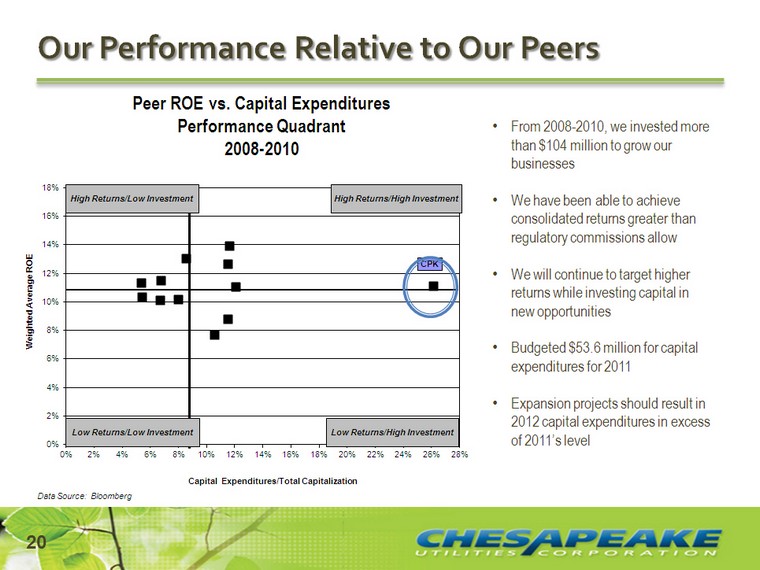
| Peer ROE vs. Capital ExpendituresPerformance Quadrant2008-2010 Data Source: Bloomberg Our Performance Relative to Our Peers (CHART) From 2008-2010, we invested more than $104 million to grow our businessesWe have been able to achieve consolidated returns greater than regulatory commissions allowWe will continue to target higher returns while investing capital in new opportunitiesBudgeted $53.6 million for capital expenditures for 2011Expansion projects should result in 2012 capital expenditures in excess of 2011's level 20 |
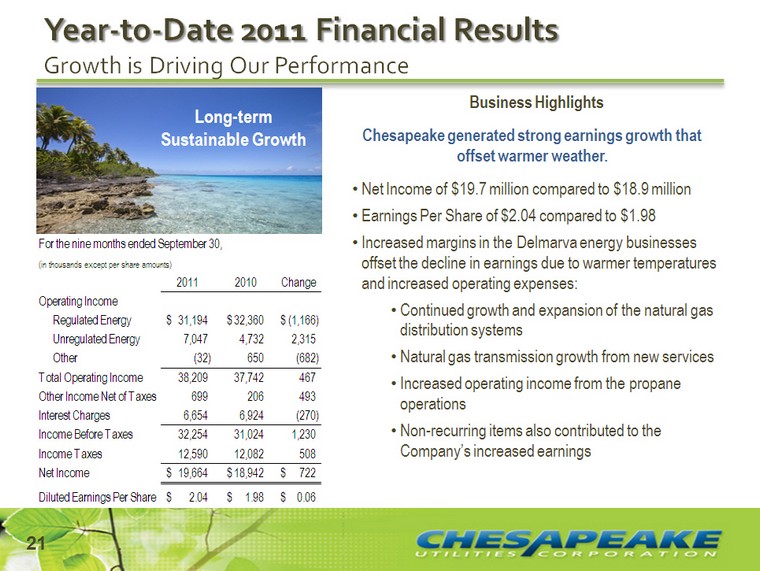
| 21 Year-to-Date 2011 Financial ResultsGrowth is Driving Our Performance Business HighlightsChesapeake generated strong earnings growth that offset warmer weather. Net Income of $19.7 million compared to $18.9 millionEarnings Per Share of $2.04 compared to $1.98Increased margins in the Delmarva energy businesses offset the decline in earnings due to warmer temperatures and increased operating expenses: Continued growth and expansion of the natural gas distribution systems Natural gas transmission growth from new servicesIncreased operating income from the propane operationsNon-recurring items also contributed to the Company's increased earnings Long-term Sustainable Growth |
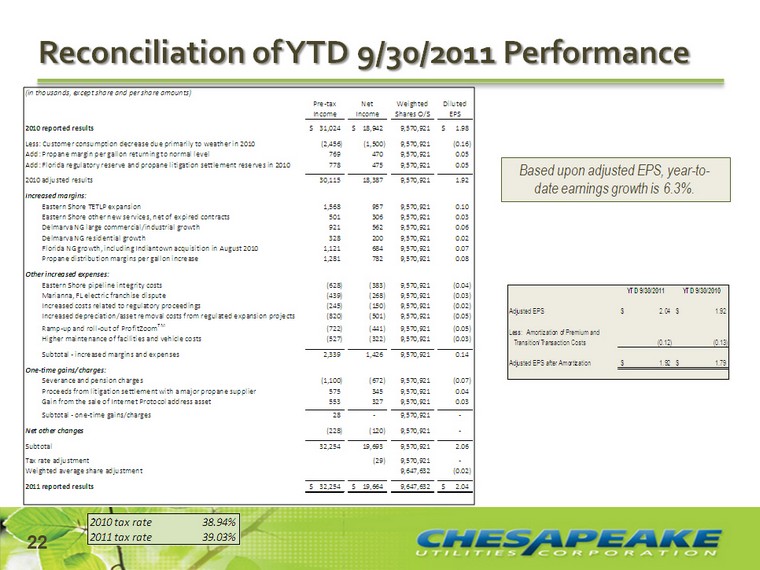
| 22 Reconciliation of YTD 9/30/2011 Performance Sustainability Based upon adjusted EPS, year-to- date earnings growth is 6.3%. |
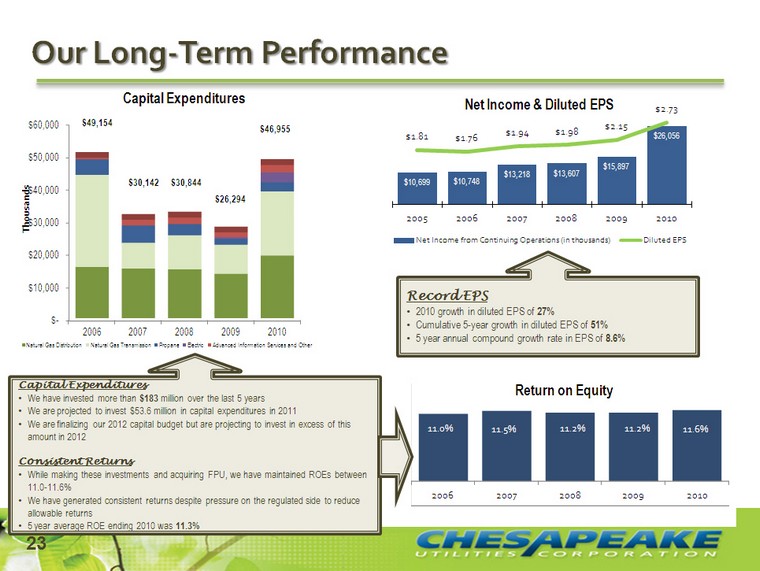
| 23 (CHART) (CHART) Our Long-Term Performance (CHART) Record EPS2010 growth in diluted EPS of 27%Cumulative 5-year growth in diluted EPS of 51%5 year annual compound growth rate in EPS of 8.6% Capital ExpendituresWe have invested more than $183 million over the last 5 yearsWe are projected to invest $53.6 million in capital expenditures in 2011We are finalizing our 2012 capital budget but are projecting to invest in excess of this amount in 2012Consistent ReturnsWhile making these investments and acquiring FPU, we have maintained ROEs between 11.0-11.6%We have generated consistent returns despite pressure on the regulated side to reduce allowable returns5 year average ROE ending 2010 was 11.3% |
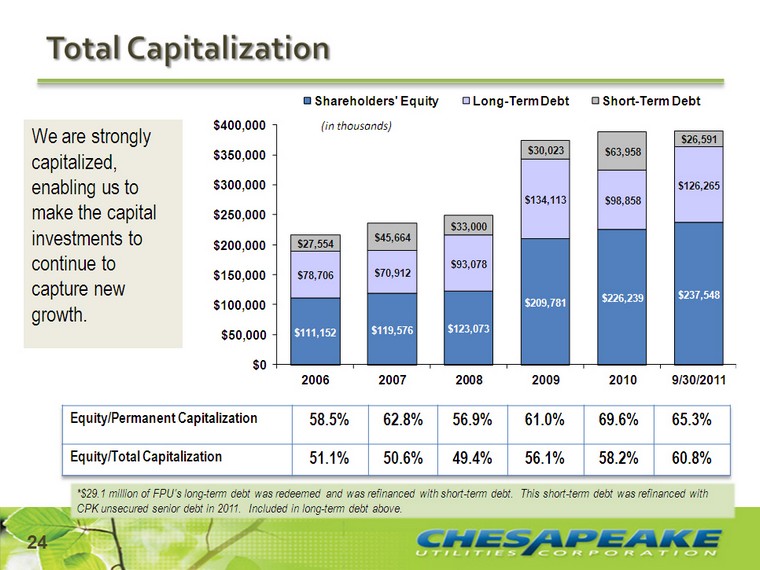
| Total Capitalization Equity/Permanent Capitalization 58.5% 62.8% 56.9% 61.0% 69.6% 65.3% Equity/Total Capitalization 51.1% 50.6% 49.4% 56.1% 58.2% 60.8% We are strongly capitalized, enabling us to make the capital investments to continue to capture new growth. *$29.1 million of FPU's long-term debt was redeemed and was refinanced with short-term debt. This short-term debt was refinanced with CPK unsecured senior debt in 2011. Included in long-term debt above. 24 |
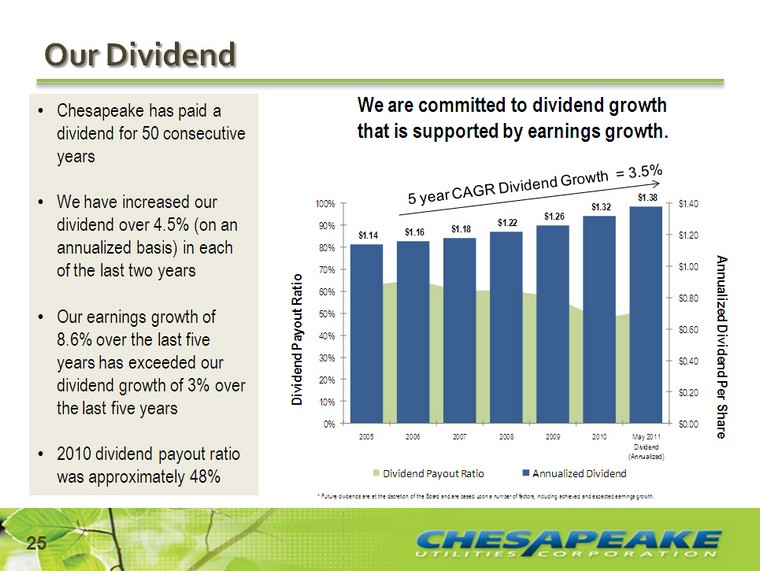
| Chesapeake paid a dividend for 50 consecutive yearsWe have increased our dividend over 4.5% (on an annualized basis) in each of the last two years Our earnings growth of 8.6% over the last five years has exceeded our dividend growth of 3% over the last five years 2010 dividend payout ratio was approximately 48% 25 Chesapeake has paid a dividend for 50 consecutive yearsWe have increased our dividend over 4.5% (on an annualized basis) in each of the last two years Our earnings growth of 8.6% over the last five years has exceeded our dividend growth of 3% over the last five years 2010 dividend payout ratio was approximately 48% Our Dividend * Future dividends are at the discretion of the Board and are based upon a number of factors, including achieved and expected earnings growth. 5 year CAGR Dividend Growth = 3.5% We are committed to dividend growth that is supported by earnings growth. |
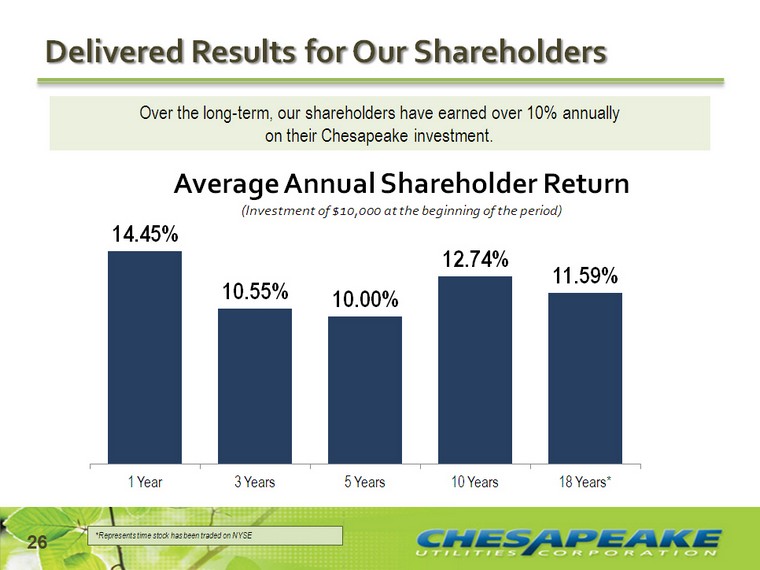
| 26 Delivered Results for Our Shareholders (CHART) Over the long-term, our shareholders have earned over 10% annually on their Chesapeake investment. *Represents time stock has been traded on NYSE |
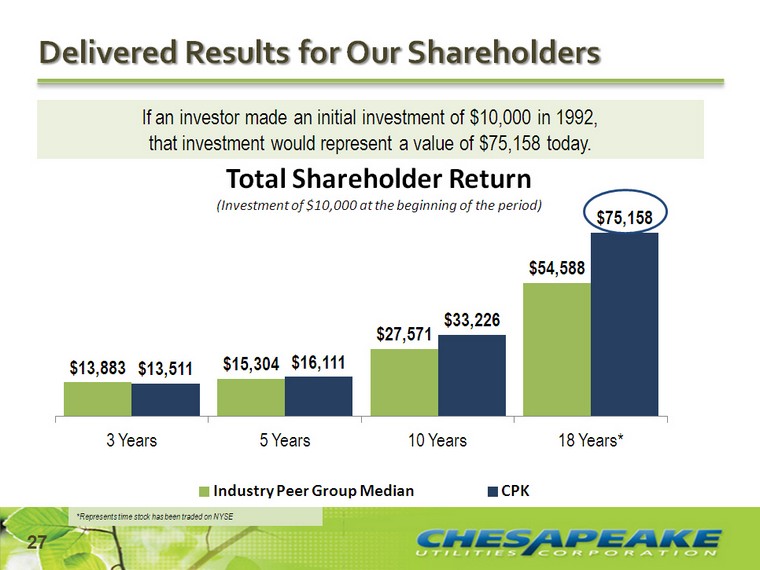
| 27 Delivered Results for Our Shareholders *Represents time stock has been traded on NYSE (CHART) If an investor made an initial investment of $10,000 in 1992, that investment would represent a value of $75,158 today. |
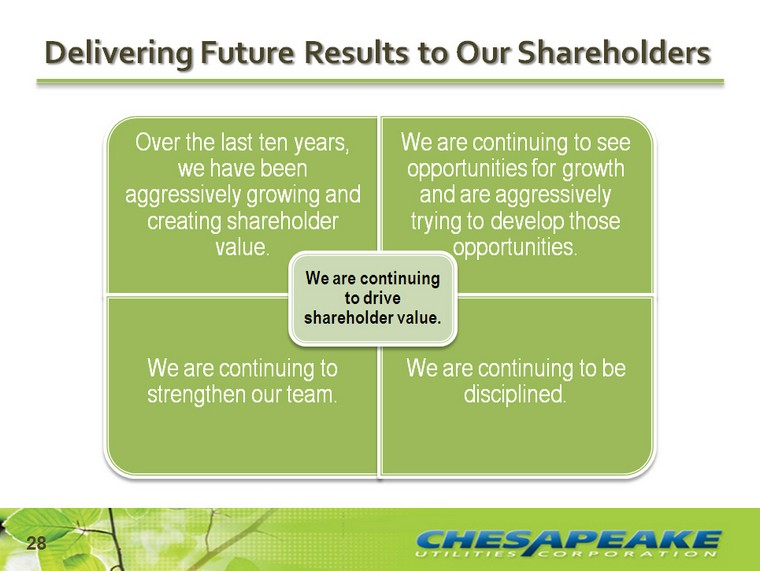
| 28 Delivering Future Results to Our Shareholders |

| 29 Thank you. Questions? |