Attached files
| file | filename |
|---|---|
| 8-K - 8-K - Dine Brands Global, Inc. | a11-29813_18k.htm |
Exhibit 99.1
|
|
Investor Presentation November 2011 |
|
|
Forward-Looking Information Statements contained in this presentation may constitute forward-looking statements within the meaning of the Private Securities Litigation Reform Act of 1995. You can identify these forward-looking statements by words such as "may," "will," "should," "expect," "anticipate," "believe," "estimate," "intend," "plan" and other similar expressions. These statements involve known and unknown risks, uncertainties and other factors, which may cause actual results to be materially different from those expressed or implied in such statements. These factors include, but are not limited to: the effect of general economic conditions; the Company's substantial indebtedness; risk of future impairment charges; the Company's results in any given period differing from guidance provided to the public; the highly competitive nature of the restaurant business; the Company's business strategy failing to achieve anticipated results; risks associated with the restaurant industry; shortages or interruptions in the supply or delivery of food; changing health or dietary preferences; harm to our brands' reputation; litigation; environmental liability; liability relating to employees; failure to comply with applicable laws and regulations; failure to effectively implement restaurant development plans; concentration of Applebee's franchised restaurants in a limited number of franchisees; credit risk from IHOP franchisees operating under our previous business model; termination or non-renewal of franchise agreements; franchisees breaching their franchise agreements; changes in the number and quality of franchisees; inability of franchisees to fund capital expenditures; third-party claims with respect to intellectual property assets; heavy dependence on information technology; failure to protect the integrity and security of individually identifiable information; and other factors discussed from time to time in the Company's Annual and Quarterly Reports on Forms 10-K and 10-Q and in the Company's other filings with the Securities and Exchange Commission. The forward-looking statements contained in this presentation are made as of the date hereof and the Company assumes no obligation to update or supplement any forward-looking statements. 2 ©2011 DineEquity, Inc. All rights reserved. |
|
|
Business Overview Julia Stewart Chairman and Chief Executive Officer 3 ©2011 DineEquity, Inc. All rights reserved. |
|
|
Key DineEquity Investment Highlights Two long-standing restaurant brands with #1 market share in their respective categories Franchise model results in strong cash flow from high margins and low capital needs Segment profitability and operating cash flow maintained during economic downturn The strength of the Company’s fully-franchised business model is that it somewhat mitigates earnings fluctuations based on restaurant sales National presence with strong consumer awareness Committed franchisee base with commitments to open more than 300 restaurants Substantial free cash flow for deleveraging over time Strong management team with significant industry experience 4 ©2011 DineEquity, Inc. All rights reserved. |
|
|
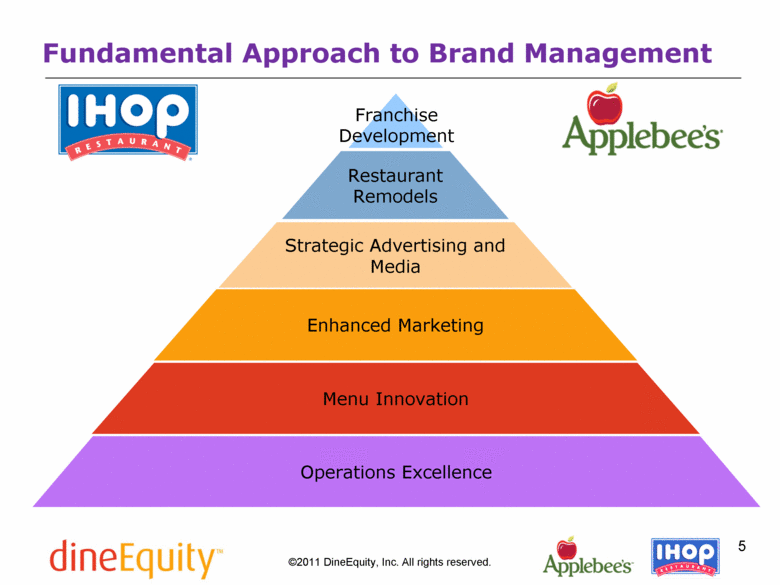
Fundamental Approach to Brand Management Menu Innovation Strategic Advertising and Media Enhanced Marketing Restaurant Remodels Operations Excellence Franchise Development 5 ©2011 DineEquity, Inc. All rights reserved. |
|
|
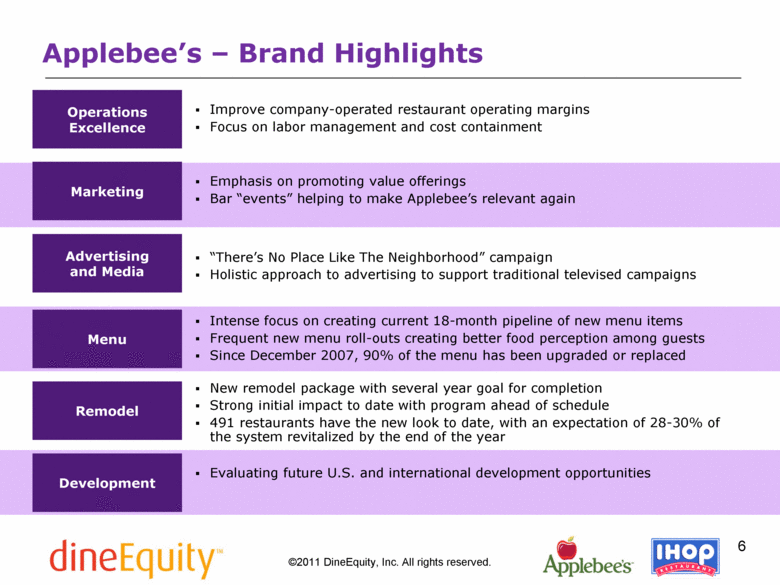
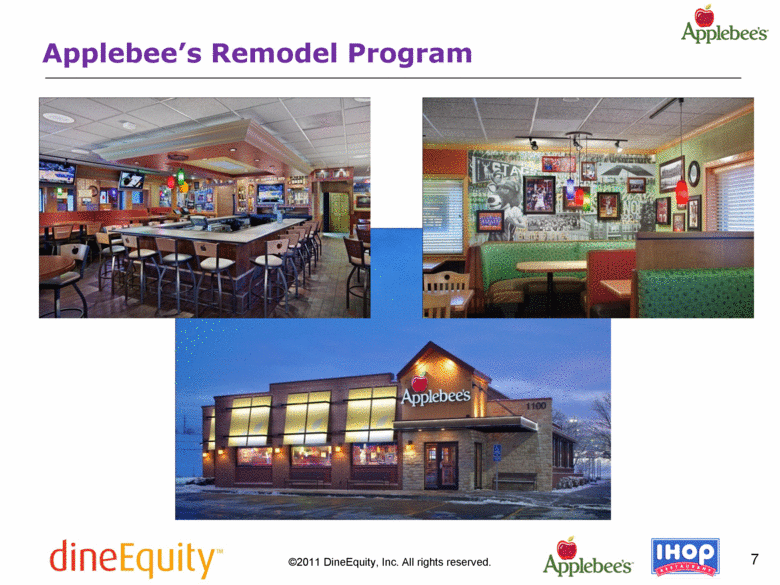
Marketing Advertising and Media Menu Operations Excellence Development Emphasis on promoting value offerings Bar “events” helping to make Applebee’s relevant again “There’s No Place Like The Neighborhood” campaign Holistic approach to advertising to support traditional televised campaigns Intense focus on creating current 18-month pipeline of new menu items Frequent new menu roll-outs creating better food perception among guests Since December 2007, 90% of the menu has been upgraded or replaced Remodel New remodel package with several year goal for completion Strong initial impact to date with program ahead of schedule 491 restaurants have the new look to date, with an expectation of 28-30% of the system revitalized by the end of the year Improve company-operated restaurant operating margins Focus on labor management and cost containment Evaluating future U.S. and international development opportunities Applebee’s – Brand Highlights 6 ©2011 DineEquity, Inc. All rights reserved. |
|
|
Applebee’s Remodel Program 7 ©2011 DineEquity, Inc. All rights reserved. |
|
|
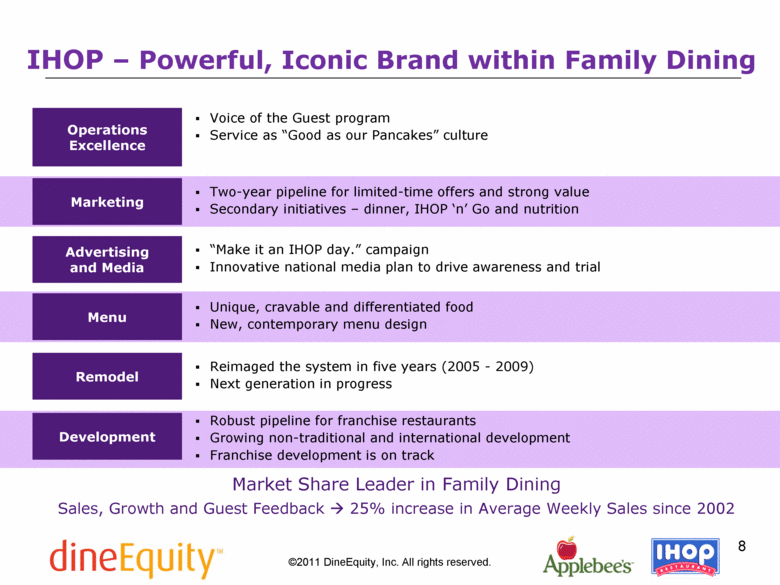
Marketing Advertising and Media Menu Operations Excellence Development Two-year pipeline for limited-time offers and strong value Secondary initiatives – dinner, IHOP ‘n’ Go and nutrition “Make it an IHOP day.” campaign Innovative national media plan to drive awareness and trial Unique, cravable and differentiated food New, contemporary menu design Remodel Reimaged the system in five years (2005 - 2009) Next generation in progress Voice of the Guest program Service as “Good as our Pancakes” culture Robust pipeline for franchise restaurants Growing non-traditional and international development Franchise development is on track Market Share Leader in Family Dining Sales, Growth and Guest Feedback 25% increase in Average Weekly Sales since 2002 IHOP – Powerful, Iconic Brand within Family Dining 8 ©2011 DineEquity, Inc. All rights reserved. |
|
|
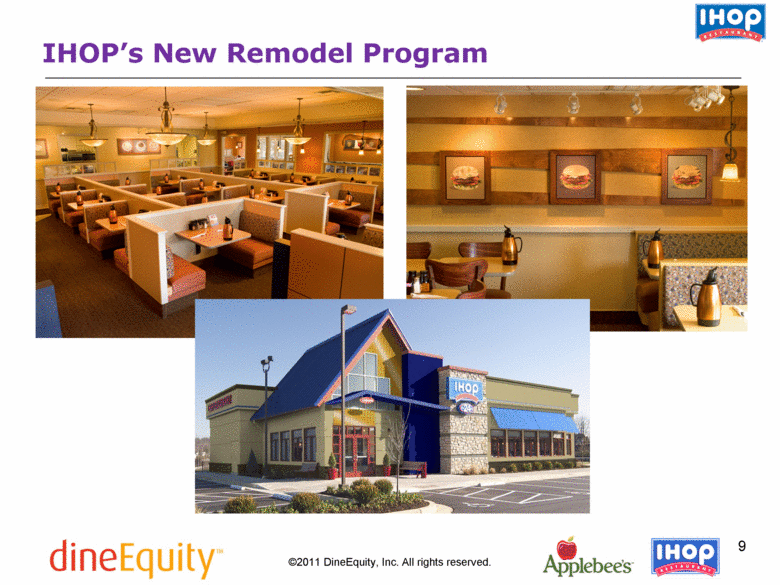
IHOP’s New Remodel Program 9 ©2011 DineEquity, Inc. All rights reserved. |
|
|
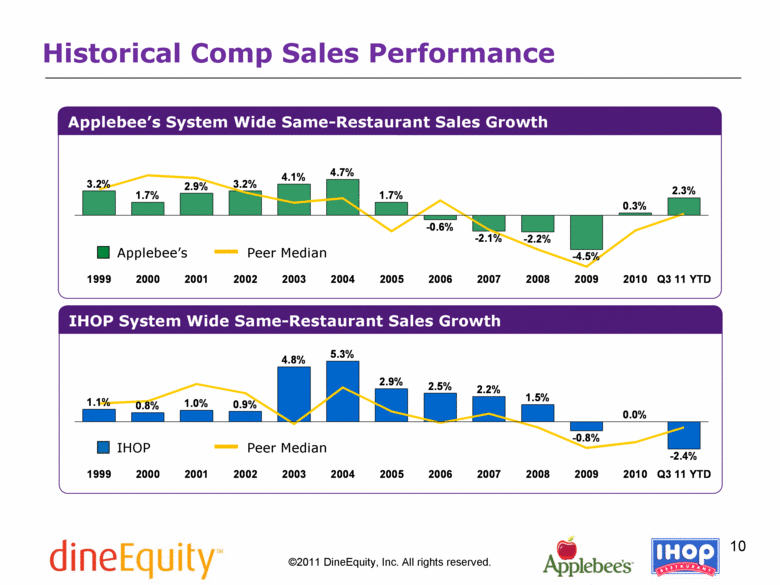
Applebee’s System Wide Same-Restaurant Sales Growth IHOP System Wide Same-Restaurant Sales Growth IHOP Peer Median Applebee’s Peer Median 10 Historical Comp Sales Performance ©2011 DineEquity, Inc. All rights reserved. 1999 1.1% 2000 0.8% 2001 1.0% 2002 0.9% 2003 4.8% 2004 5.3% 2005 2.9% 2006 2.5% 2007 2.2% 2008 1.5% 2009 -0.8% 2010 0.0% Q3 11 YTD -2.4% 1999 3.2% 2000 1.7% 2001 2.9% 2002 3.2% 2003 4.1% 2004 4.7% 2005 1.7% 2006 -0.6% 2007 -2.1% 2008 -2.2% 2009 -4.5% 2010 0.3% Q3 11 YTD 2.3% |
|
|
DineEquity Advantage Versus Competitive Set Unwavering focus on brand differentiation integrated throughout all aspects of innovative marketing, menu, remodel and operations approach Compelling value propositions, not discounting, essential to driving traffic while protecting the brands Ensuring that brands remain relevant to guest needs and enhancing occasion-based appeal Dedicated to development of new food and beverage pipelines at both brands to deliver unique, differentiated offerings Shared services approach allows brands to focus on traffic-driving marketing, menu and operations efforts Franchise approach necessitates collaboration and fosters better brand management as well as effective decision making 11 ©2011 DineEquity, Inc. All rights reserved. |
|
|
Financial Overview Tom Emrey Chief Financial Officer 12 ©2011 DineEquity, Inc. All rights reserved. |
|
|
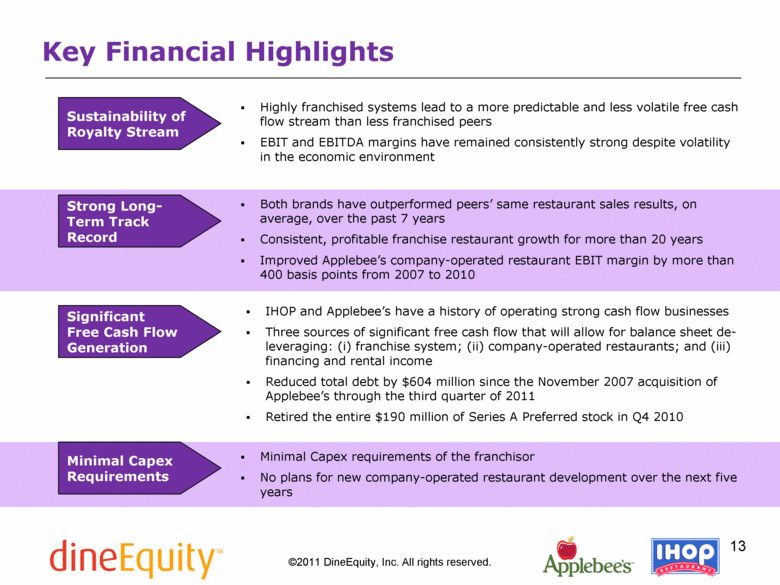
Significant Free Cash Flow Generation Sustainability of Royalty Stream Minimal Capex Requirements Strong Long-Term Track Record IHOP and Applebee’s have a history of operating strong cash flow businesses Three sources of significant free cash flow that will allow for balance sheet de-leveraging: (i) franchise system; (ii) company-operated restaurants; and (iii) financing and rental income Reduced total debt by $604 million since the November 2007 acquisition of Applebee’s through the third quarter of 2011 Retired the entire $190 million of Series A Preferred stock in Q4 2010 Highly franchised systems lead to a more predictable and less volatile free cash flow stream than less franchised peers EBIT and EBITDA margins have remained consistently strong despite volatility in the economic environment Minimal Capex requirements of the franchisor No plans for new company-operated restaurant development over the next five years Both brands have outperformed peers’ same restaurant sales results, on average, over the past 7 years Consistent, profitable franchise restaurant growth for more than 20 years Improved Applebee’s company-operated restaurant EBIT margin by more than 400 basis points from 2007 to 2010 Key Financial Highlights 13 ©2011 DineEquity, Inc. All rights reserved. |
|
|
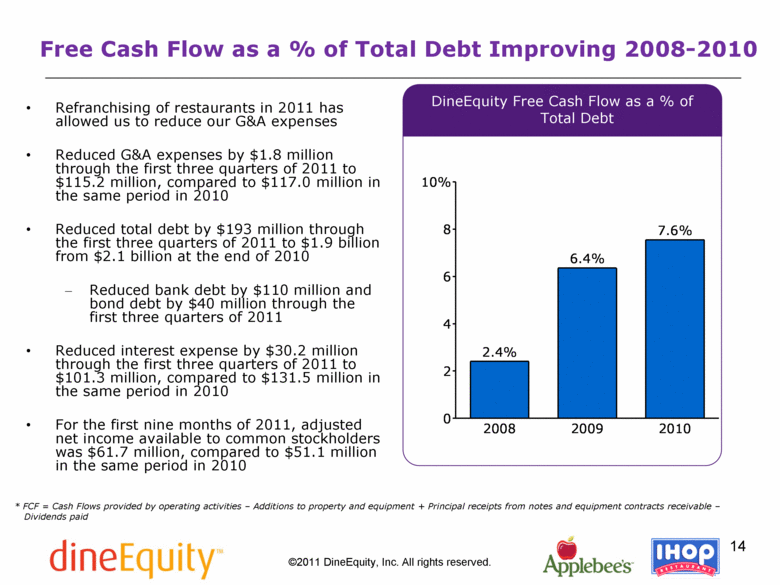
Free Cash Flow as a % of Total Debt Improving 2008-2010 * FCF = Cash Flows provided by operating activities – Additions to property and equipment + Principal receipts from notes and equipment contracts receivable – Dividends paid DineEquity Free Cash Flow as a % of Total Debt Refranchising of restaurants in 2011 has allowed us to reduce our G&A expenses Reduced G&A expenses by $1.8 million through the first three quarters of 2011 to $115.2 million, compared to $117.0 million in the same period in 2010 Reduced total debt by $193 million through the first three quarters of 2011 to $1.9 billion from $2.1 billion at the end of 2010 Reduced bank debt by $110 million and bond debt by $40 million through the first three quarters of 2011 Reduced interest expense by $30.2 million through the first three quarters of 2011 to $101.3 million, compared to $131.5 million in the same period in 2010 For the first nine months of 2011, adjusted net income available to common stockholders was $61.7 million, compared to $51.1 million in the same period in 2010 14 ©2011 DineEquity, Inc. All rights reserved. 0 2 4 6 8 10% 2008 2.4% 2009 6.4% 2010 7.6% |
|
|
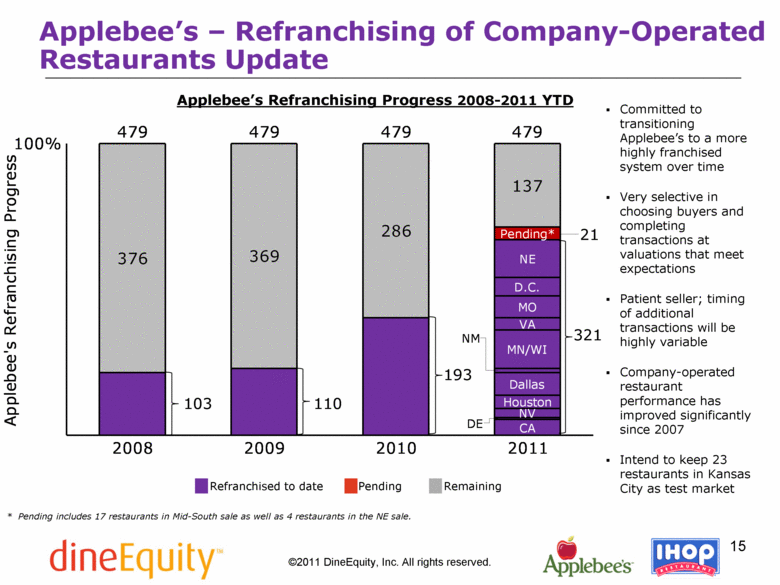
Applebee’s – Refranchising of Company-Operated Restaurants Update * Pending includes 17 restaurants in Mid-South sale as well as 4 restaurants in the NE sale. 103 110 193 321 Applebee’s Refranchising Progress 2008-2011 YTD 21 Committed to transitioning Applebee’s to a more highly franchised system over time Very selective in choosing buyers and completing transactions at valuations that meet expectations Patient seller; timing of additional transactions will be highly variable Company-operated restaurant performance has improved significantly since 2007 Intend to keep 23 restaurants in Kansas City as test market 15 ©2011 DineEquity, Inc. All rights reserved. Refranchised to date Remaining Pending 100% 2008 376 479 2009 369 479 2010 286 479 2011 Houston Dallas CA NV MN/WI NE Pending* 137 VA MO D.C. 479 Applebee's Refranchising Progress NM DE |
|
|
Flexible Capital Structure with Attractive Terms $809 million senior secured credit facility Seven-year $734 million term loan + five-year $75 million revolving credit facility Term loan: LIBOR + 300 basis points with 125 basis point LIBOR floor $785 million eight-year senior unsecured notes with a coupon of 9.5% per annum DineEquity redeemed all of its $190 million of Series A perpetual preferred stock in 2010 October 2010 refinancing accretive to earnings based on a combined reduction of interest expense and preferred dividends Bank debt re-pricing completed in February 2011 reduced interest rate by 175 basis points Flexible covenants currently in effect Leverage ratio: 7.5x Net Debt (maximum cash of $75M) Interest coverage ratio: 1.5x EBITDA Thresholds are subject to step-downs or step-ups, as applicable, over time Will continue to dedicate free cash flow and asset sale proceeds to retire bank debt and look opportunistically at retiring bonds 16 ©2011 DineEquity, Inc. All rights reserved. |

