Attached files
| file | filename |
|---|---|
| 8-K - FORM 8-K - PROVIDENT FINANCIAL SERVICES INC | d253629d8k.htm |
 Sandler O’Neill & Partners
East Coast Financial Services Conference
November 10, 2011
Exhibit 99.1 |
 Certain statements contained herein are "forward-looking statements"
within the meaning of Section 27A of the Securities Act of 1933 and Section
21E of the Securities Exchange Act of 1934. Such forward-looking
statements may be identified by reference to a future period or periods, or by the use
of forward-looking terminology, such as "may," "will,"
"believe," "expect," "estimate,"
"anticipate," "continue," or similar terms or variations on
those terms, or the negative of those terms. Forward- looking statements
are subject to numerous risks and uncertainties, including, but not limited to, those
related to the economic environment, particularly in the market areas in which
Provident Financial Services, Inc. (the “Company”) operates,
competitive products and pricing, fiscal and monetary policies of the U.S.
Government, changes in government regulations affecting financial institutions,
including regulatory fees and capital requirements, changes in prevailing interest
rates, acquisitions and the integration of acquired businesses, credit risk
management, asset-liability management, the financial and securities
markets and the availability of and costs associated with sources of liquidity.
The Company cautions readers not to place undue reliance on any such
forward-looking statements which speak only as of the date made. The
Company also advises readers that the factors listed above
could
affect
the
Company's
financial
performance
and
could
cause
the
Company's
actual
results for future periods to differ materially from any opinions or statements
expressed with respect to future periods in any current statements. The
Company does not undertake and specifically declines any obligation to
publicly release the result of any revisions which may be made to any
forward-looking statements to reflect events or circumstances after the date of
such statements or to reflect the occurrence of anticipated or unanticipated
events. Forward Looking Statements |
 Christopher Martin
Chairman, President &
Chief Executive Officer |
 NYSE
Symbol
-
PFS
$7.0 billion in assets
Headquartered in Jersey City, NJ
Holding company for The Provident Bank, the oldest NJ bank
(chartered in 1839)
Converted to stock form in 2003
82 branch locations throughout northern and central NJ
Two Loan Production Offices in NJ
Consolidated administrative operations to Metro Park (Iselin) in
March 2011 –
Sale of two buildings to close Q4
Did not participate in TARP, No TRUPS
CORPORATE PROFILE |
 Market Capitalization: $806 million
60.0 million Shares Outstanding
11.04% Insider Ownership (includes 7.67% held by ESOP)
including 22,060 shares purchased by CEO/CFO & Directors
in 2011
64.71% Institutional Ownership
3.60% Dividend Yield
137% Price/TBV
84.9% Price/BV
13.5x P/E
13.0x Price/2012 Est. Earnings
Market Data –
10/28/11 |
 Senior management team has, on average, over 25 years of
relationship banking experience with large commercial banks
& thrifts in our primary markets
Extremely knowledgeable and results-oriented
Conservative business practices
Culture of accountability, efficiency and integrity
Majority of officers have been with publicly-traded
organizations
Ongoing leadership development throughout organization to
ensure management succession and performance
Executive Leadership Team |
 New
Strategic
Plan
in
place
September
2011
Challenge: Increase revenue in difficult environment
Focus on Relationships by defined target customer segments
Community Bank with commercial emphasis
Ongoing SBA Initiative
Reduce marginally accretive asset classes
Expand non-interest income with concentration on Wealth
Management
Aggressively manage credit quality
Continue Branch rationalization/relocations
Continue to evaluate acquisition opportunities
Seeking Out Strategic Organic Growth & Opportunities
|
 Current Retail Franchise
82 Branches in 11 New Jersey Counties |
   Market
Demographics (as of 6/30/11) Source: FDIC-Summary of Deposit &
SNL Provident Financial Services, Inc. (NYSE: PFS)
New Jersey (NJ)
Middlesex
5
25
1,595,709
7.16
794,605
78,561
Hudson
4
14
933,095
3.48
607,650
52,525
Morris
9
10
777,042
3.83
496,157
104,165
Essex
12
7
479,377
2.21
783,531
55,914
Monmouth
10
11
462,256
2.60
649,429
82,974
Bergen
28
3
197,111
0.51
910,386
84,344
Somerset
9
4
193,594
2.26
333,075
101,044
Ocean
13
4
159,815
1.22
578,728
60,936
Union
20
2
131,607
0.76
531,112
73,602
Mercer
20
1
59,980
0.53
371,697
75,009
Passaic
21
1
25,979
0.26
500,140
62,332
NJ Totals
82
5,015,565
6,556,510
Weighted Average: New Jersey Franchise
76,203
Aggregate: Entire State of New Jersey
8,822,373
72,519
Aggregate: National
311,212,863
54,442
County
Market
Rank
Number
of
Branches
Company
Deposits
in Market
($000)
Deposit
Market
Share
(%)
Total
Population
2010
(Actual)
Median
HH
Income
2010
($) |
 Asset
Composition – At 9/30/11
Total cash & cash
equivalents
1.8%
Total investments
24.2%
Net loans
64.2%
Foreclosed assets
0.1%
Premises &
equipment
1.1%
Accrued interest
receivable
0.3%
Intangible assets
5.2%
Bank
-owned life
insurance
2.0%
Other assets
1.1% |
 Loan
Portfolio – At 9/30/11
($ in thousands)
Owner Occupied loans totaled $453,738M at 9/30/11 and are included under the Commercial loan portfolio
total of $814,112M. Net total of $3,819M representing premiums,
discounts & deferred fees, has not been included in the outstanding loan
totals. |
 CRE
Portfolio by Industry – At 9/30/11
Total CRE Loans = $1,733 MM |
 C
& I Loan Portfolio – At 9/30/11
C&I Loans= $814 MM
Primary Property Type
($ in thousands) |
 Construction Loan Portfolio –
At 9/30/11
Total Construction Loans = $117 MM
Construction loan balance does not reflect unfunded commitments of $60MM. No
loans are located outside of NJ/NY/PA.
Primary Property Type
($ in thousands) |
 Loan
Originations Note: Does not include loan purchases or renewals.
|
 Loan
Quality by Portfolio As of 9/30/11
Net
total
of
$3.8
MM
representing
premiums,
discounts
&
deferred
fees,
has
not
been
included
in
the
outstanding
loan totals.
($ in thousands)
TOTAL
LOAN PORTFOLIO BALANCE
1,848,645
$
814,112
$
553,670
$
1,347,973
$
4,564,400
$
NON-PERFORMING LOANS
47,115
$
29,732
$
8,438
$
40,048
$
125,333
$
% OF PORTFOLIO
2.55%
3.65%
1.52%
2.97%
2.75%
% OF TOTAL LOANS
1.03%
0.65%
0.18%
0.88%
2.75%
NET CHARGE-OFFS (YTD)
1,678
$
6,429
$
5,935
$
3,925
$
17,967
$
0.13%
1.09%
1.41%
0.38%
0.53%
CRE/CONST
C & I
CONSUMER
1-4 FAMILY
ANNUALIZED
NET
CHARGE-
OFFS
AS % OF AVG. O/S |
 NPAs
& 90+ day Delinquencies / Loans & REO Peer Group : BNCL, CBU,
FNB, FCF, FFIC, INDB, ISBC, NPBC, NBTB, NWBI, STBA, SASR, SUSQ, UBSI, VLY,
WSBC, WSFS
Source: SNL
2.83%
2.78%
2.99%
2.94%
3.35%
2010Q3
2010Q4
2011Q1
2011Q2
2011Q3
Other Assets Owned
Consumer
Commercial Loans
Construction Loans
Commercial Real Estate
1-4 Family 1st Mortgages
Peer Mean |
 Investment Securities –
At 9/30/11
Note:
78% are Available for Sale.
Weighted
Avg. Life
AFS
2.6 yrs.
HTM
3.8 yrs.
Total
2.9 yrs. |
 Deposit Composition –
At 9/30/11
Total Deposits= $5,074 MM
77% Core
Total Cost of Deposits: 0.81%
Savings
18%
MMA
21%
NOW
15%
NIB
13%
CDs
23%
Muni
10% |
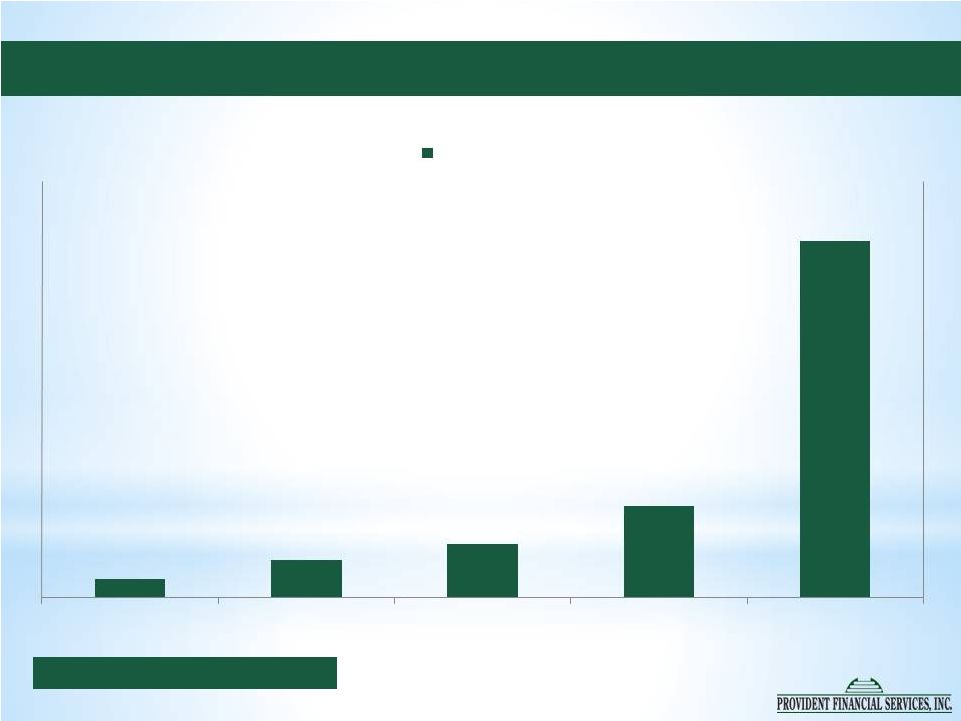
 ($
in thousands) $218,023
$614,181
$130,628
$98,157
$117,835
0.84%
1.01%
2.76%
3.05%
2.39%
Time Deposit Maturities
Time Deposit Maturities –
At 9/30/11
Note: % = Weighted Avg. Cost |
 Borrowings –
At 9/30/11
Note: % = Weighted Avg. Cost
($ in thousands)
$27,400
$54,100
$77,587
$132,793
$514,338
2011
2012
2013
2014
Thereafter
Borrowings
4.05%
3.76%
2.72%
2.37%
2.51% |
 Thomas M. Lyons
Executive Vice President &
Chief Financial Officer |
 Financial
Highlights ($ in thousands)
BALANCE SHEET:
9/30/11
12/31/10
Total assets
$6,997,359
$6,824,528
Total loans
4,568,220
4,409,813
Total deposits
5,074,293
4,877,734
Total investments
1,695,372
1,763,232
Total borrowed funds
912,567
969,683
Total stockholders' equity
949,397
921,687 |
 Financial Highlights
($ in thousands except
Earnings per Share)
INCOME STATEMENT:
9/30/11
9/30/10
Net Income
$42,474
$37,590
Diluted Earnings per Share
$0.75
$0.66
ROATE
9.76%
9.16%
ROAA
0.83%
0.74%
Net Interest Margin
3.51%
3.45%
Efficiency Ratio
57.13%
57.18%
Nine Months Ended |
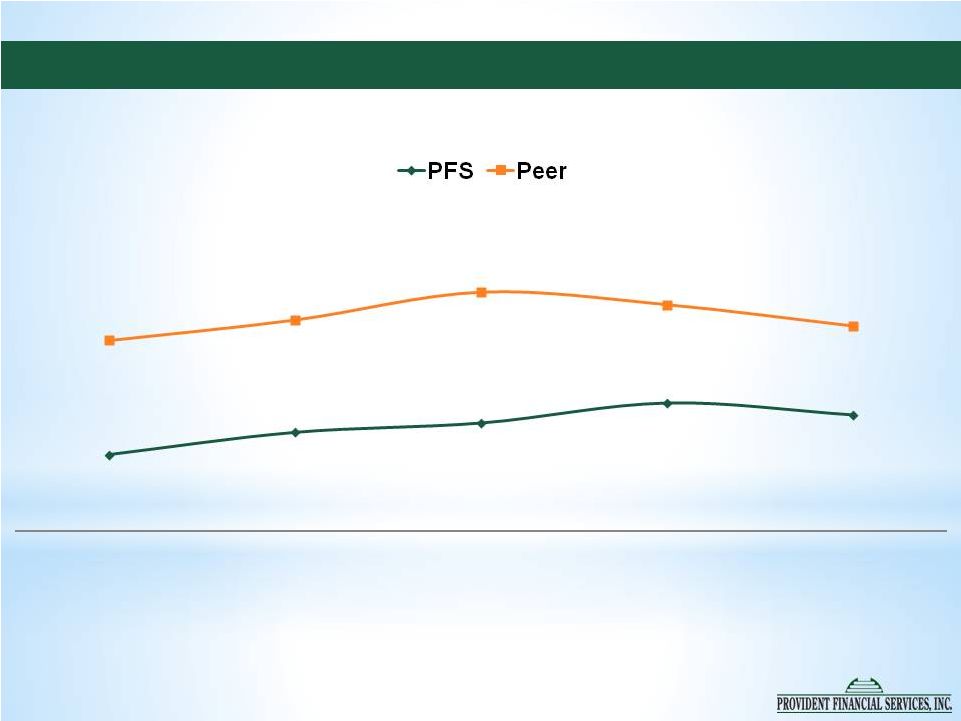
 Return on Average Assets (%)
Peer Group : BNCL, CBU, FNB, FCF, FFIC, INDB, ISBC,
NPBC, NBTB, NWBI, STBA, SASR, SUSQ, UBSI, VLY,
WSBC, WSFS
Source: SNL
0.80
0.71
0.76
0.82
0.90
0.71
0.76
0.73
0.84
0.91 |
 Pre-Provision Net Interest Income |
 Net
Interest Margin (%) Peer Group : BNCL, CBU, FNB, FCF, FFIC, INDB, ISBC,
NPBC, NBTB, NWBI, STBA, SASR, SUSQ, UBSI, VLY,
WSBC, WSFS
Source: SNL |
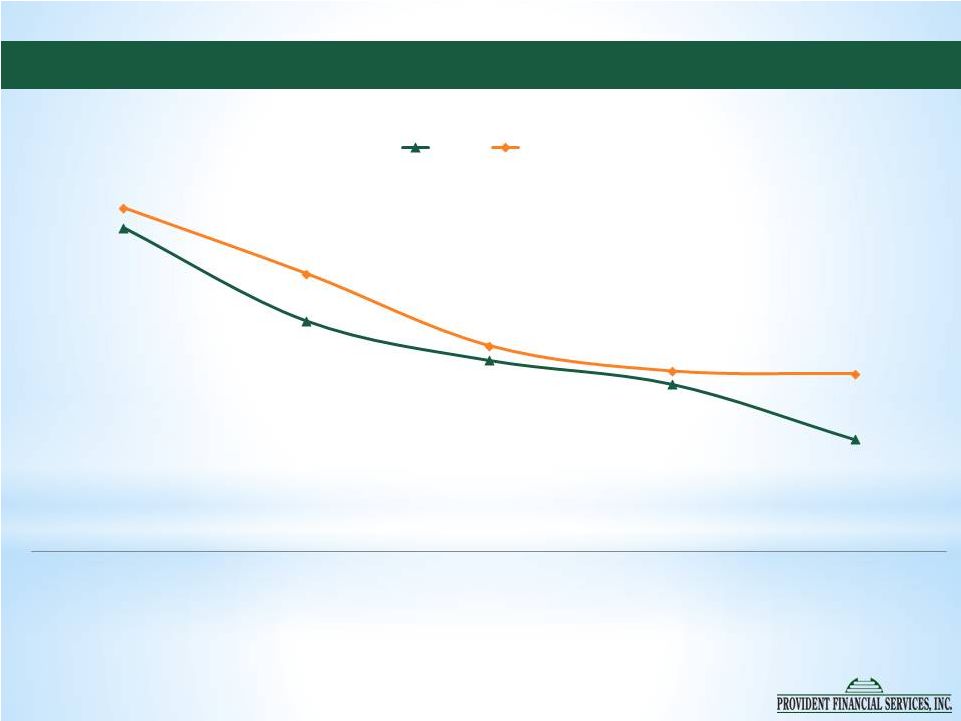 Cost
of Deposits (%) Peer Group : BNCL, CBU, FNB, FCF, FFIC, INDB, ISBC,
NPBC, NBTB, NWBI, STBA, SASR, SUSQ, UBSI, VLY,
WSBC, WSFS
Source: SNL
2010Q3
2010Q4
2011Q1
2011Q2
2011Q3
PFS
Peer
0.95
0.85
0.81
0.78
0.72
0.97
0.90
0.82
0.79
0.79 |
 Cost
of Funds (%) Peer Group : BNCL, CBU, FNB, FCF, FFIC, INDB, ISBC,
NPBC, NBTB, NWBI, STBA, SASR, SUSQ, UBSI, VLY,
WSBC, WSFS
Source: SNL
2010Q3
2010Q4
2011Q1
2011Q2
2011Q3
1.30
1.17
1.10
1.07
1.00
1.36
1.25
1.17
1.13
1.08
PFS
Peer |
 Interest Rate Sensitivity
Net Interest Income
Change in Interest
Rates in Basis
Points (Rate
Ramp)
Dollar Amount
(in thousands)
Dollar Change
Percent Change %
-100
206,213
(5,845)
(2.8)
Static
212,058
—
—
+100
212,468
410
0.2
+200
208,989
(3,069)
(1.4)
+300
206,284
(5,774)
(2.7) |
 Asset
Quality (%) Peer Group : BNCL, CBU, FNB, FCF, FFIC, INDB, ISBC,
NPBC, NBTB, NWBI, STBA, SASR, SUSQ, UBSI, VLY,
WSBC, WSFS
Source: SNL
1.58
1.56
1.63
1.62
1.61
1.76
1.71
1.73
1.71
1.65
2010Q3
2010Q4
2011Q1
2011Q2
2011Q3
Loan Loss Reserve / Loans |
 Asset
Quality (%) Peer Group : BNCL, CBU, FNB, FCF, FFIC, INDB, ISBC,
NPBC, NBTB, NWBI, STBA, SASR, SUSQ, UBSI, VLY,
WSBC, WSFS
Source: SNL
2.45
2.38
2.83
3.06
2.74
2.37
2.34
2.55
2.54
2.38
2010Q3
2010Q4
2011Q1
2011Q2
2011Q3
Non Performing Loans/Loans
PFS
Peer |
 Asset
Quality (%) Peer Group : BNCL, CBU, FNB, FCF, FFIC, INDB, ISBC,
NPBC, NBTB, NWBI, STBA, SASR, SUSQ, UBSI, VLY,
WSBC, WSFS
Source: SNL
Cumulative for the
period
PFS
0.51
Peer
0.84
Net Charge-offs/Avg. Loans |
 Net
Operating Exp / Avg Assets (%) Peer Group : BNCL, CBU, FNB, FCF, FFIC,
INDB, ISBC, NPBC, NBTB, NWBI, STBA, SASR, SUSQ, UBSI, VLY,
WSBC, WSFS
Source: SNL
1.51
1.52
1.57
1.57
1.56
1.56
1.56
1.61
1.61
1.59
2010Q3
2010Q4
2011Q1
2011Q2
2011Q3 |
 Efficiency Ratio (%)
Peer Group : BNCL, CBU, FNB, FCF, FFIC, INDB, ISBC,
NPBC, NBTB, NWBI, STBA, SASR, SUSQ, UBSI, VLY,
WSBC, WSFS
Source: SNL
54.77
55.44
55.73
56.33
55.97
58.23
58.85
59.69
59.31
58.67
2010Q3
2010Q4
2011Q1
2011Q2
2011Q3 |
 Diluted EPS / Annualized ROATE
$0.24
$0.21
$0.23
$0.25
$0.27
9.48%
8.41%
9.13%
9.63%
10.48%
0.00%
2.00%
4.00%
6.00%
8.00%
10.00%
12.00%
$0.00
$0.05
$0.10
$0.15
$0.20
$0.25
$0.30
2010Q3
2010Q4
2011Q1
2011Q2
2011Q3
Diluted EPS
Annl. ROATE |
 Capital –
At 9/30/11
Amount
Ratio
Amount
Ratio
Regulatory Tier 1 leverage capital
261,461
$
4.00%
571,567
$
8.74%
Tier 1 risk-based capital
177,900
$
4.00%
571,567
$
12.85%
Total risk-based capital
355,800
$
8.00%
627,384
$
14.11%
REQUIRED
ACTUAL
(Dollars in thousands)
The Company continues to exceed all current
regulatory requirements and is “well capitalized.”
|
 Capital Flexibility
Tangible Common Equity/ Tangible Assets = 8.86%
Never a reduction in the quarterly dividend rate
Increased dividend 9% in 2011, to $0.12 per quarter
Targeted payout ratio 45-55%
1.9 million shares eligible for repurchase under current authorization
Ability to grow through acquisition |
 Looking Forward
Expand relationships while money center banks remain dislocated
Cultivate and reward existing relationships to defend from competition
Assess acquisition opportunities in our contiguous markets where accretive
Implement process improvements to achieve efficiency target and achieve Line of
Business profitability targets
Challenge our strategic assumptions, stress test our business lines and
accurately assess risks
Continue to enhance branch franchise
Adapt to new regulations from Dodd-Frank and SEC
Improve net interest income while managing risk
Provide tax-efficient return to stockholders
Clear Strategy and Effective Execution with an Economic
Backdrop of Uncertainty |