Attached files
| file | filename |
|---|---|
| 8-K - HANCOCK HOLDING CO 8-K 11-9-2011 - HANCOCK WHITNEY CORP | form8k.htm |
EXHIBIT 99.1

Sandler O’Neill
Sandler O’Neill
East Coast Financial Services
Conference
Conference
East Coast Financial Services
Conference
Conference
November 10, 2011
November 10, 2011

Carl J. Chaney
President & CEO
President & CEO
Carl J. Chaney
President & CEO
President & CEO

Forward-Looking Statements
Forward-Looking Statements
During this presentation we may make forward-looking statements.
During this presentation we may make forward-looking statements.
Forward-looking statements provide projections of results of operations or of financial
condition or state other forward-looking information, such as expectations about
future conditions and descriptions of plans and strategies for the future. Hancock’s
ability to accurately project results or predict the effects of future plans or strategies is
inherently limited.
condition or state other forward-looking information, such as expectations about
future conditions and descriptions of plans and strategies for the future. Hancock’s
ability to accurately project results or predict the effects of future plans or strategies is
inherently limited.
We believe that the expectations reflected in the forward-looking statements are based
on reasonable assumptions, but actual results and performance could differ materially
from those set forth in the forward-looking statements. Factors that could cause
actual results to differ from those expressed in the Company's forward-looking
statements include, but are not limited to, those outlined in Hancock's SEC filings,
including the “Risk Factors” section of the Company’s form 10-K and 10-Q.
Hancock does not intend, and undertakes no obligation, to update or revise any
forward-looking statements, and you are cautioned not to place undue reliance on
such forward-looking statements.
forward-looking statements, and you are cautioned not to place undue reliance on
such forward-looking statements.

Hancock Holding
Hancock Holding
The Premier Gulf South Financial Services Franchise
üLeadership position in the Gulf South
üDiversified revenue stream with strong earnings momentum
üLoyal customer base and attractive deposit funding
üCommanding presence in attractive markets that we know
üHighly accretive upon realization of identified cost savings
üPotentially significant revenue synergies from Insurance, Cash
Management, Trust, etc.
Management, Trust, etc.
üMaintaining a very strong balance sheet - capital / liquidity
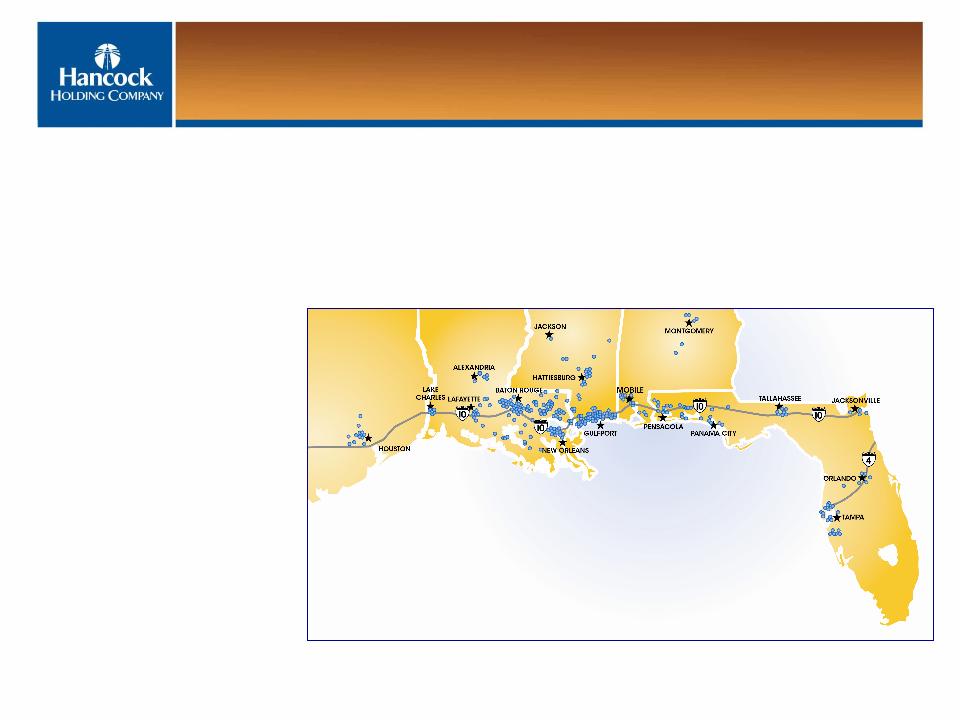
Diversified Footprint Across The Gulf South
As of September 30, 2011
Leading Position In Key Markets;
Building A Presence In Other Attractive Markets
Building A Presence In Other Attractive Markets
• 2-bank Holding Company
– Hancock Bank
– Whitney Bank
• 5-state footprint
• $19B in assets
• $11B in loans
• $15B in deposits
• ~300 branches
• ~400 ATMs
• ~4,800 employees

Whitney Acquisition
Whitney Acquisition
• Closed June 4, 2011
• Purchase price $1.6B
• Added $11.7B in assets, $6.5B in loans and
$9.2B in deposits
$9.2B in deposits
• Integration continues to progress as scheduled
• Main systems conversion scheduled for 1Q12
• Total pre-tax restructuring charge approximately $125 million
• Customer and employee retention remains a priority
• Outlook is very positive and exciting

Branch Divestiture Complete
Branch Divestiture Complete
• Required by the Department of Justice to resolve branch concentration
concerns
concerns
• Completed on September 16, 2011
• Sold eight Whitney branches
– 7 on the Mississippi Gulf Coast
– 1 in Bogalusa, Louisiana
• Sale included approximately $47 million in loans and approximately
$180 million in deposits
$180 million in deposits
• Premium received on the branch sale effectively reduced goodwill at
acquisition
acquisition
– No gain was recorded since branches divested were recorded at fair market value
at acquisition date
at acquisition date
As of September 30, 2011
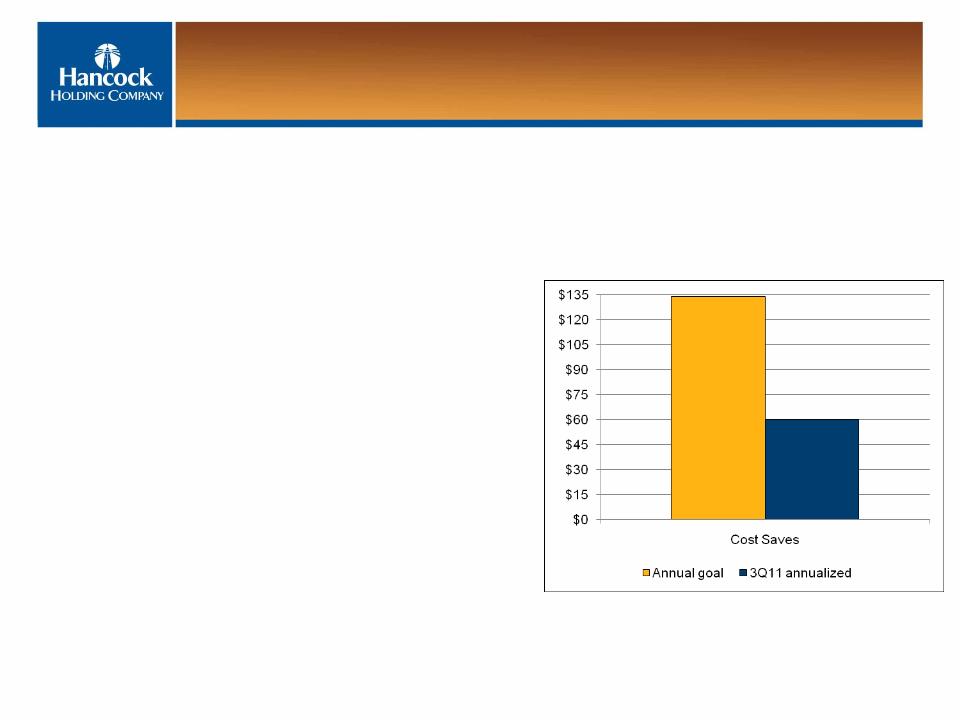
Harvesting Cost Synergies
ü Realized approximately $15 million in
cost synergies in 3Q11 compared to
proforma 3Q10
cost synergies in 3Q11 compared to
proforma 3Q10
– 45% of target (annualized)
ü Synergies will level out over the next
couple of quarters until systems
conversion is completed
couple of quarters until systems
conversion is completed
ü Remain confident we will meet total
projected annual cost saves of $134
million for 2013
projected annual cost saves of $134
million for 2013
As of September 30, 2011

Cultivating Revenue Prospects
Cultivating Revenue Prospects
• Opportunities for cross-selling legacy Hancock and Whitney products
are being cultivated
are being cultivated
• Key lines of business are:
– Treasury Management
– International Banking
– Insurance and Private Banking
• Successfully added new business across the footprint since merger
completed
completed
• Systems conversion in 1Q12 will enhance revenue sales opportunities

Michael M. Achary
CFO
CFO
Michael M. Achary
CFO
CFO
3Q11 Earnings Summary
3Q11 Earnings Summary
* A reconciliation of net income to operating income and pre-tax, pre-provision income is included in the appendix.
** Noninterest expense as a percent of total revenue (TE) before amortization of purchased intangibles, securities transactions and merger expenses.
|
($s in millions; except per share data)
|
3Q11
|
2Q11
|
|
Operating Income*
|
$45.2
|
$26.6
|
|
Operating E.P.S. (diluted)*
|
$.53
|
$.48
|
|
Return on Assets (operating)*
|
0.92%
|
0.92%
|
|
Merger Costs
|
$22.8
|
$22.2
|
|
Net Income
|
$30.4
|
$12.1
|
|
Earnings Per Share (diluted)
|
$.36
|
$.22
|
|
Pre-Tax, Pre-Provision Income*
|
$73.9
|
$49.5
|
|
Net Interest Margin
|
4.32%
|
4.11%
|
|
Net Charge-offs
|
0.28%
|
0.49%
|
|
Tangible Common Equity
|
8.56%
|
8.11%
|
|
Efficiency Ratio**
|
66.98%
|
65.62%
|
As of September 30, 2011
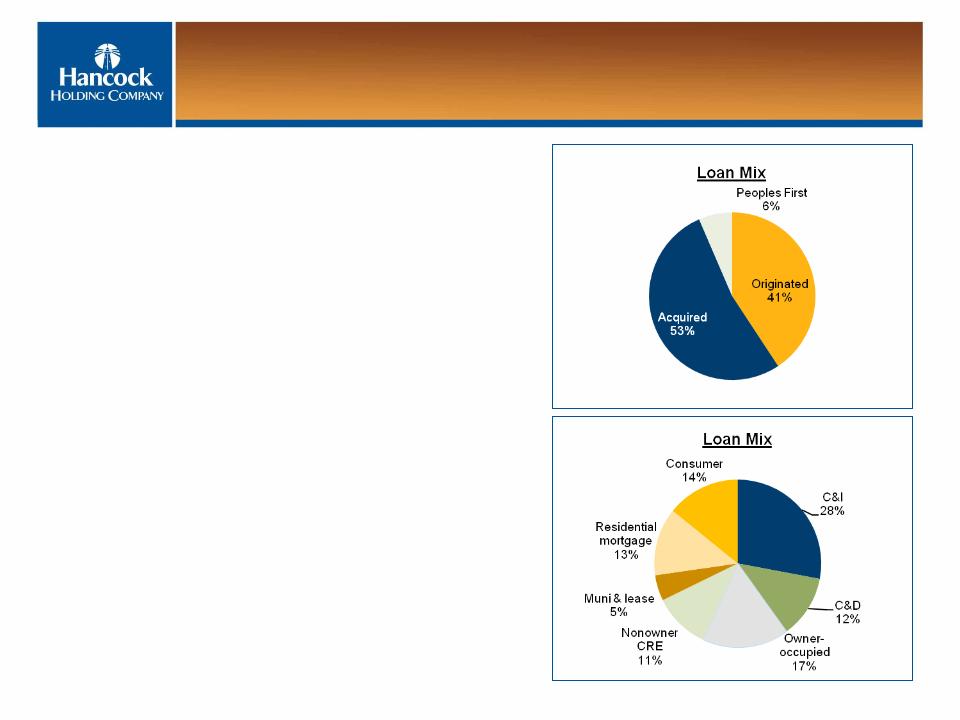
Customer Retention Remains A Priority
• Total loans $11.1B
• Balanced portfolio
– C&I Exposure 45%
– CRE Exposure 28%
– Mortgage & Consumer Exposure 27%
• Decline of $147 million, or 1%,
linked-quarter
linked-quarter
– Approximately $47 million related to branch divestiture
– Approximately $60 million related to the
resolution of problem credits
resolution of problem credits
– Approximately $26 million related to the covered Peoples
First loss share portfolio
First loss share portfolio
• Positioned for rising rates
As of September 30, 2011

Strong Core Deposit Funding
• Total deposits $15.3B
• Decline of $296 million linked-quarter
– Approximately $180 million related to branch divestiture
– Approximately $73 million related to runoff in the
Peoples First CD portfolio
Peoples First CD portfolio
– Approximately $160 million decline in seasonal
public fund deposits
public fund deposits
• Funding mix remained strong
– Low cost of funds (50bps)
– Noninterest bearing demand deposits (DDA) comprised 33% of
total period-end deposits compared to 31% at June 30, 2011
total period-end deposits compared to 31% at June 30, 2011
• Approximately $2.1B in CDs maturing
over the next 3 quarters at average rate of
1.45%
over the next 3 quarters at average rate of
1.45%
As of September 30, 2011
4Q11
1.41%
1.41%
1Q12
1.49%
1.49%
2Q12
1.45%
1.45%

Improved Net Interest Margin
• 3Q11 net interest margin 4.32% up 21bps
linked-quarter
linked-quarter
– Approximately 24bps of the NIM was related to net
accretion of purchase accounting adjustments (8bps in
2Q11)
accretion of purchase accounting adjustments (8bps in
2Q11)
– Accretion of the loan discount and amortization of the
fair value adjustments on the securities and CD
portfolios will continue to impact the NIM and net
interest income in future quarters and will decline
over time
fair value adjustments on the securities and CD
portfolios will continue to impact the NIM and net
interest income in future quarters and will decline
over time
• Reflects a favorable shift in funding
sources and a decline in funding costs,
partly offset by a less favorable shift in
earning asset mix
sources and a decline in funding costs,
partly offset by a less favorable shift in
earning asset mix
• Deployment of excess liquidity and CD
repricing will further benefit the NIM
repricing will further benefit the NIM
As of September 30, 2011
* Excludes impact of purchase accounting adjustments
** Impact of purchase accounting adjustments.

Credit Quality Metrics Remain Solid
• Allowance for loan losses was $118 million,
up from $112 million at June 30, 2011
up from $112 million at June 30, 2011
• Provision for loan losses was $9.3 million
– $9.1 million for non-covered loans
– $0.2 million for FDIC covered loans
• Net charge-offs totaled $7.8 million
• ALLL/loans was 1.86%
(excluding the impact of the Whitney acquired loans and FDIC covered loans)
(excluding the impact of the Whitney acquired loans and FDIC covered loans)
• Nonperforming assets declined $27 million linked-quarter
– NPLs declined $20 million
– ORE declined $7 million
• Whitney’s legacy classified portfolio declined 15% linked-quarter
As of September 30, 2011
Declining NPAs

Cross-Sell Opportunities
• Noninterest income totaled $65 million in 3Q11
– No significant changes to recurring sources of income
• Impact from new interchange rates related to the Durbin amendment
could lower noninterest income by:
could lower noninterest income by:
– Approximately $2 - $3 million for the remainder of 2011
– Approximately $15 - $18 million in 2012
– Do not anticipate charging customers a per item or monthly debit card
service fee
service fee
– Reviewing opportunities to offset loss of income
• Cross-sell opportunities expected to generate additional fee income
As of September 30, 2011

Focused On Efficiency Targets
• Noninterest expense totaled $194 million in 3Q11
– Merger-related expenses totaled $22.8 million
– Amortization of intangibles totaled $7.1 million
• Realized approximately $15 million in cost synergies in 3Q11
compared to proforma 3Q10
compared to proforma 3Q10
– 45% of target (annualized)
• Efficiency ratio 66.98% in 3Q11*
– Short term target: 62-63% (impact from 100% of cost saves)
– Longer term target: less than 60%
As of September 30, 2011
* Noninterest expense as a percent of total revenue (TE) before amortization of purchased
intangibles and securities transactions and merger expenses
intangibles and securities transactions and merger expenses

Working Towards ROA Target
Ø ROA target in 2013 of 1.20%+ included:
– 3% annual asset growth
– $134 million annual cost saves
Ø Proforma 3Q11 assuming 100%
quarterly cost saves = 1.17% ROA
quarterly cost saves = 1.17% ROA
Ø ROA target did not include:
– Investment of excess liquidity
– Increase in interest rates
– Additional CDs repricing
– Increased loan/deposit ratio
– Revenue synergies
– Additional strategic investments
As of September 30, 2011
|
$s in millions
|
3Q11
GAAP |
3Q11
Operating |
Proforma
3Q11 Operating plus additional quarterly cost savings |
|
Net interest income
|
177.0
|
177.0
|
177.0
|
|
Provision for loan losses
|
9.3
|
9.3
|
9.3
|
|
Noninterest income
|
65.0
|
65.0
|
65.0
|
|
Noninterest expense
|
194.0
|
194.0
|
194.0
|
|
Merger costs
|
--
|
(22.8)
|
(22.8)
|
|
Additional quarterly cost
saves |
--
|
--
|
(18.5)
|
|
Net income before tax
|
38.7
|
61.5
|
80.0
|
|
Taxes
|
8.3
|
16.3
|
22.8
|
|
Net income
|
30.4
|
45.2
|
57.2
|
|
|
|
|
|
|
Average Assets
|
19,555.7
|
19,555.7
|
19,555.7
|
|
ROAA
|
.62%
|
.92%
|
1.17%
|

Carl J. Chaney
President & CEO
President & CEO
Carl J. Chaney
President & CEO
President & CEO

n Conservative approach to banking since 1899
― 50 years of continuous profitability
― Never missed or lowered our dividend
n Our culture defines how we run our bank
― Commitment to strong capital
― Superior asset quality
― Superior liquidity / low loan to deposit ratio
― No exotic securities
― Did not take TARP
n Experienced and stable management team
n A safe harbor in times of distress
Honor & Integrity
Strength & Stability
Commitment
to Service
Teamwork
Personal
Responsibility
Proud History of Conservative Banking
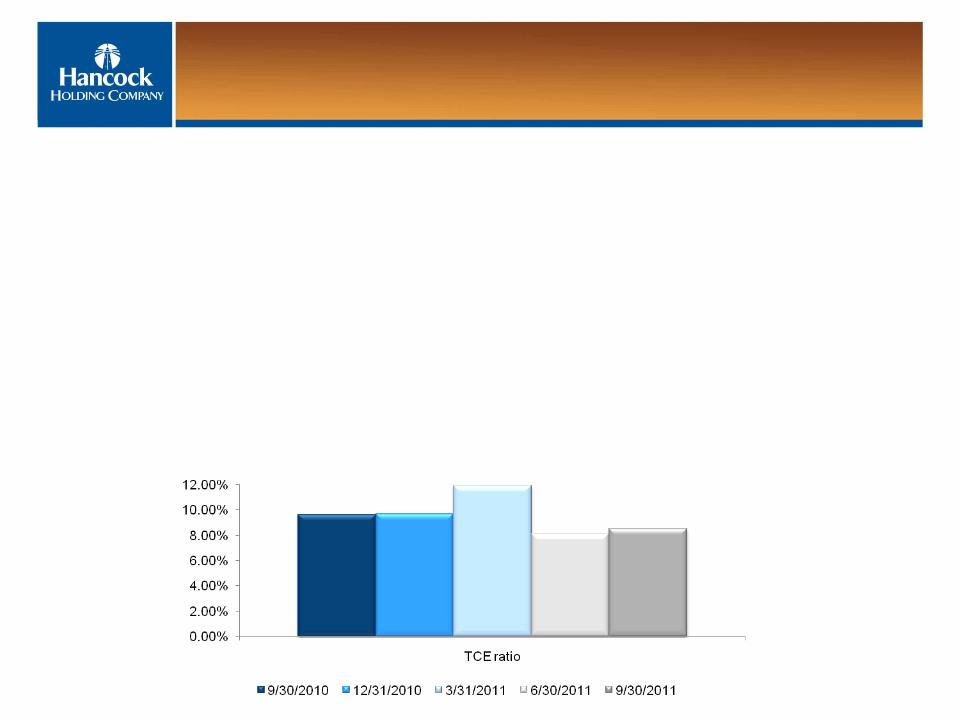
Ø Total equity $2.4 billion at September 30
Ø TCE ratio improved 45bps to 8.56% linked-quarter
Ø Expect to build capital in the near term
– Current focus is on completing Whitney integration
Ø TCE ratio target: 8% minimum
Ø Will review opportunities to deploy excess capital post integration
Ample Capital
As of September 30, 2011
Capital
raise
raise
Whitney
acquisition
acquisition

Well Positioned For The Future
Ø Creates dominant Gulf South leader
Ø History of effective capital management
Ø Superior liquidity
Ø Excellent asset quality and conservative culture
Ø Management and leadership in place
Ø Focused on integration
Ø Enhanced earnings potential
Ø Well positioned for future growth
Ø Focused on shareholder value creation
Notes:
1. As of 9/30/2011
2. KRX index of 50 regional U.S. banks
3. BKX index of 24 large-cap U.S. banks
10-Year Total Return (1)
10-Year Total Return (1)
Large Cap
Peers (3)
Peers (3)
Regional
Peers (2)
Peers (2)
S&P 500
Index
Index
149%
32%
10%
(17%)
(50)
0
50
100
150
200

Sandler O’Neill
Sandler O’Neill
East Coast Financial Services
Conference
Conference
East Coast Financial Services
Conference
Conference
November 10, 2011
November 10, 2011

Appendix
Appendix

Purchase Accounting Items
• Impact of the acquisition is reflected in 2Q11 financial
information from the acquisition date, or only 26 days
information from the acquisition date, or only 26 days
• Whitney’s balance sheet was “marked” to fair value at acquisition
• Whitney’s allowance for loan losses at acquisition date of $208
million was not carried forward and the loan portfolio was
reduced, or “marked” $463 million
million was not carried forward and the loan portfolio was
reduced, or “marked” $463 million
• Total nonaccrual loans and past due accruing loans do not include
purchased credit impaired loans which were written down to fair
value
purchased credit impaired loans which were written down to fair
value
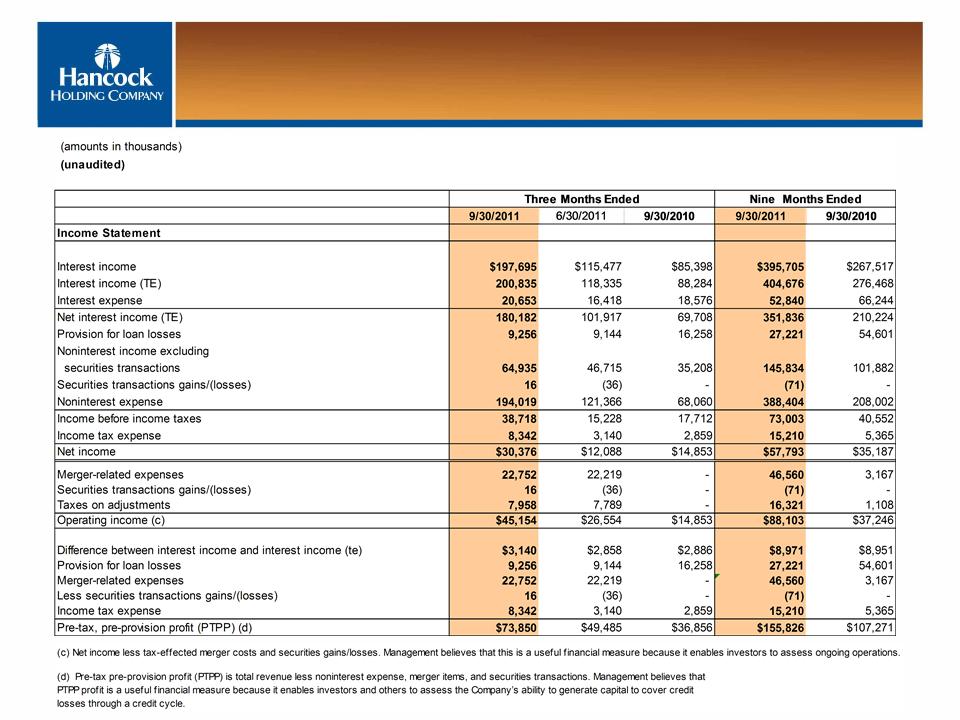
Non-GAAP Reconciliation
Non-GAAP Reconciliation

Investor Contacts
Investor Contacts
Carl J. Chaney - President & CEO
carl_chaney@hancockbank.com
Michael M. Achary - EVP & CFO
michael_achary@hancockbank.com
Trisha Voltz Carlson - SVP, Investor Relations
trisha_carlson@hancockbank.com
Hancock Holding Company
P.O. Box 4019, Gulfport, MS 39502
Phone: 228.868.4000 or 1.800.522.6542
HancockBank.com