Attached files
| file | filename |
|---|---|
| 8-K - FORM 8-K - BANC OF CALIFORNIA, INC. | d254861d8k.htm |
 Q3
Earnings Results November 10, 2011
Exhibit 99.1 |
 1
Executing on Growth
Important Disclosures
Executing on Growth
Forward-Looking Statements
Additional Information About the FPTB / Beach Business Bank Transaction
This presentation includes forward-looking statements within the meaning of the
"Safe-Harbor" provisions of the Private Securities Litigation Reform Act of 1995. These
statements are necessarily subject to risk and uncertainty, and actual results could differ
materially from those anticipated due to various factors, including those set forth from
time to time in filings by First PacTrust Bancorp, Inc. (“FPTB,” “First
PacTrust,” “we,” “us” or “our”) with the Securities and Exchange Commission (the “SEC”). Such risks and
uncertainties include, but are not limited to, (1) the occurrence of any event, change or
other circumstances that could give rise to the termination of the stock purchase
agreement for First PacTrust’s pending acquisition of Gateway Bancorp
(“Gateway”) or the merger agreement for First PacTrust’s pending acquisition of Beach Business Bank
(“Beach”); (2) the outcome of any legal proceedings that may be instituted against
First PacTrust, Gateway or Beach; (3) the inability to complete the Gateway or Beach
transaction due to the failure to satisfy each transaction's respective conditions to
completion, including the receipt of regulatory approvals and, in the case of the Beach
transaction, the receipt of the approval of Beach's stockholders; (4) risks that the Gateway
or Beach transaction disrupts current plans and operations and the potential
difficulties in customer and employee retention as a result of the proposed transactions; (5)
the amount of the costs, fees, expenses and charges related to the proposed
transactions; (6) deterioration in the financial condition of borrowers resulting in
significant increases in loan losses and provisions for those losses; (7) continuation of the
historically low short-term interest rate environment; (8) changes in loan underwriting,
credit review or loss reserve policies associated with economic conditions, examination
conclusions or regulatory developments; (9) increased levels of non-performing and
repossessed assets that may result in future losses; (10) greater than anticipated
deterioration or lack of sustained growth in the national or local economies; (11) changes in
state and federal legislation, regulations or policies applicable to banks or other
financial service providers, including regulatory or legislative developments, like the
Dodd-Frank Wall Street Reform and Consumer Protection Act; (12) the results of regulatory
examinations; and (13) increased competition with other financial institutions. You should not
place undue reliance on forward-looking statements, and First PacTrust undertakes
no obligation to update any such statements to reflect circumstances or events that occur after the date on which the forward-looking statement is made.
First PacTrust will be filing a proxy statement/prospectus and other relevant documents
concerning the Beach merger with the SEC. This communication does not constitute an
offer to sell or the solicitation of an offer to buy any securities or a solicitation of any
vote or approval. WE URGE INVESTORS TO READ THE PROXY STATEMENT/PROSPECTUS AND ANY
OTHER DOCUMENTS TO BE FILED WITH THE SEC IN CONNECTION WITH THE BEACH MERGER OR INCORPORATED BY REFERENCE IN THE PROXY
STATEMENT/PROSPECTUS BECAUSE THEY WILL CONTAIN IMPORTANT INFORMATION. Investors will be able
to obtain these documents free of charge at the SEC's Web site (www.sec.gov). In
addition, documents filed with the SEC by First PacTrust will be available free of charge from First PacTrust by contacting Richard Herrin, Corporate Secretary
of First PacTrust, at (619) 691-1519. The directors, executive officers and certain other
members of management and employees of First PacTrust may be deemed to be participants
in the solicitation of proxies in favor of the Beach merger from the stockholders of Beach. Information about the directors and executive officers of First PacTrust is
included in the proxy statement for its 2011 annual meeting of stockholders, which was filed
with the SEC on April 25, 2011. The directors, executive officers and certain other
members of management and employees of Beach may also be deemed to be participants in the
solicitation of proxies in favor of the Beach merger from the stockholders of Beach.
Information about the directors and executive officers of Beach is included in the proxy statement for its 2010 annual meeting of stockholders, which is available on
Beach's website at www.beachbusinessbank.com by clicking on "Investor Relations" and
then "SEC Filings." Additional information regarding the interests of such participants
will be included in the proxy statement/prospectus and the other relevant documents filed with
the SEC when they become available. |
 2
Executing on Growth
Review of Q3 Results
•
First PacTrust Bancorp earned net income of $0.6 million and net income available to
common shareholders of $0.5 million
•
Earned
$1.1
million
in
core
earnings
for
the
quarter
or
$0.10
per
share
of
common
stock,
excluding
$0.5 million of non-core transaction related expenses (change of control payments and
professional fees), on an after tax basis.
•
PacTrust experienced a reduction in the level of non-performing loans by $5.9 million or
41.4%, to $8.3 million (1.19% of gross loans) as of September 30, 2011.
•
PacTrust experienced a reduction in the level of Classified loans, which fell 16.2% to $29.8
million. •
Pre-tax
pre-provision
income,
adjusted
for
OREO
charges
,
increased
to
$3.3
million
from
$2.8
million, linked quarters, driven primarily by a $24 million increase in PacTrust Bank’s
loan portfolio, a $26 million increase in PacTrust Bank’s total deposits and a 5
basis point expansion in the Bank’s net interest margin.
•
Bancorp increased its quarterly dividend to $0.115 per share, its fourth consecutive
quarterly dividend increase.
1
Please see appendices regarding non-GAAP Financial Information
1
1 |
 3
Executing on Growth
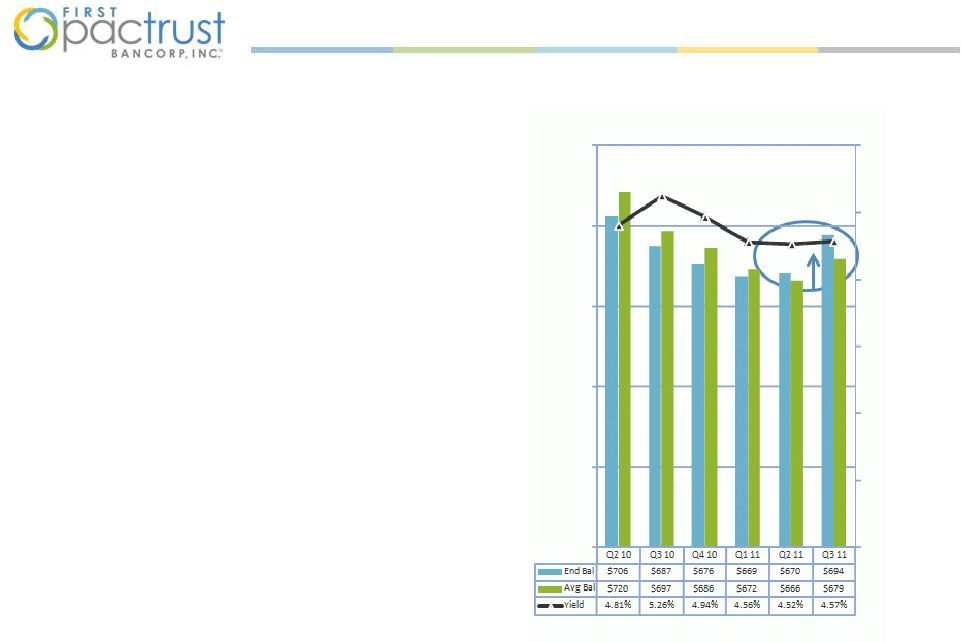
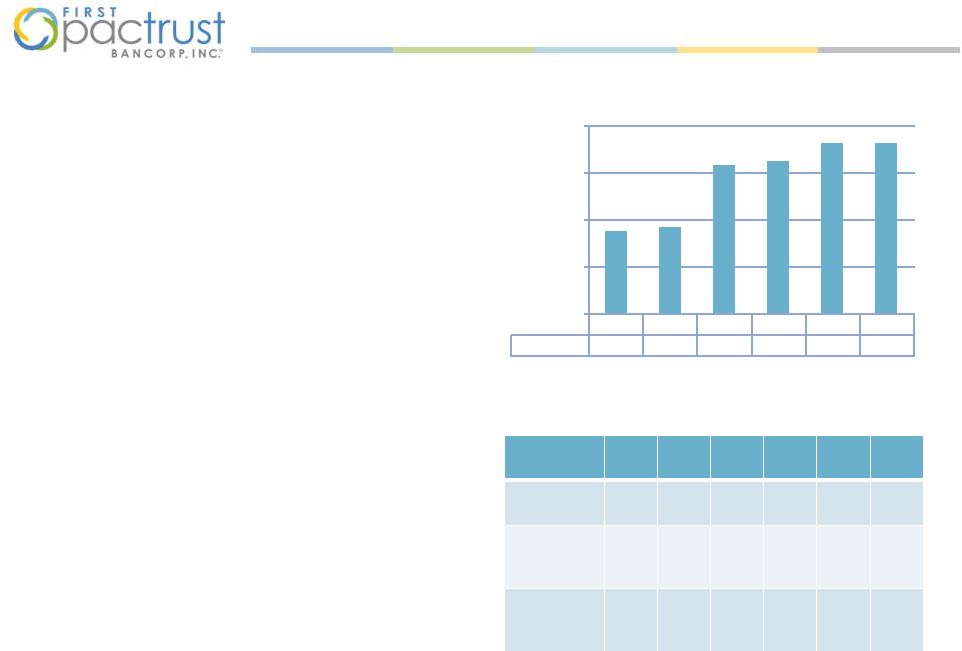
Loans and yield
•
Q3 2011 quarter end balance increased
after consecutive quarters of decline
•
Loan production grew 115% linked quarters
to $68.7 million
•
Loan yields during Q2 2011 experienced a 5
basis point growth linked quarters
–
5.14% average rate on new loan
production
–
Improved credit metrics reduced NPA
interest income drag
–
Offset slightly by ARM resets to lower
coupons
0.00%
1.00%
2.00%
3.00%
4.00%
5.00%
6.00%
$500
$550
$600
$650
$700
$750
Outstanding Loan Balances
(amounts in $ millions / % annualized) |
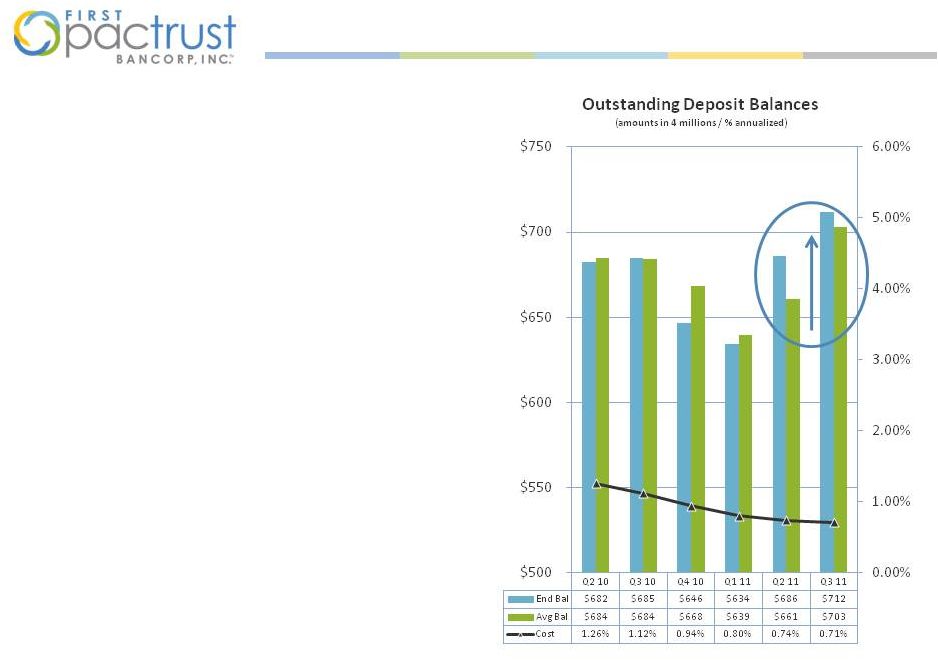 •
Q3 2011 ending deposit balance grew by
$25 million from Q2 2011’s $686 million to
$712 million
–
San Marcos (de novo) branch added
$10 million; opened in June 2011
–
Growth from La Jolla (de novo) branch
accounted for $5 million of Q3 2011
increase ($29 million YTD)
•
Q2 2011 cost of deposits saw a favorable
decline to 71 basis points
–
Re-pricing of higher rate CDs
–
Low cost state deposits
–
Impact of checking and savings
account sales focus
Deposits and cost of deposits
4
Executing on Growth |
 5
Executing on Growth
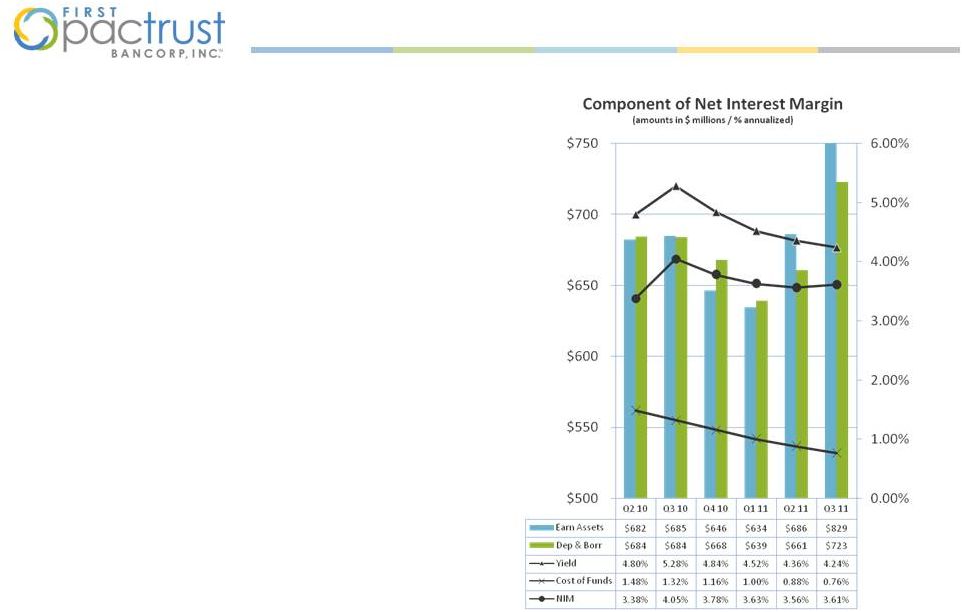
Net interest margin
•
Net interest margin for Q2 2011 rose by 5
basis point linked quarters
•
Resulted in $476 thousand or 6.8% increase
in net interest income, before provision
•
Average Earning Assets for Q3 2011 grew
$42 million or 5.3% versus prior linked
quarter, outpacing growth in liabilities
–
Yield on earning assets declined 12
basis point s compared to Q1 2011
–
Decline was largely driven by lower
yield on investments due to sale of
higher yielding impaired investments
•
Interest bearing liabilities for Q2 2011 grew
$13 million or 1.8% versus prior linked
quarter
–
Costs of funds declined 12 basis points
compared to Q2 2011
–
Decline was driven by 3 basis point
drop in cost of deposits and the
repayment of high rate FHLB
borrowings |
 6
Executing on Growth
Non-interest income
•
Q3 2011 non-interest income was $2.012
million; compares favorably against Q2 2011
non-interest income of $1.635 million
•
Excluding gain on sale of securities, linked
quarter non-interest income increased $45
thousand or 8.7% from $517 thousand in Q2
2011 to $562 thousand in Q3 2011
–
A $23 thousand increase in customer
service fees accounted for 51% of the
increase in non-interest income; the
increase benefited from disciplined
sales activity
–
Prepayment penalties assessed on
customer loans that paid off during Q3
2011 added $28 thousand of income
$250
$275
$300
$325
$350
$375
$400
Customer Service
Fees
(amounts in $ thousands)
Q2 10
Q3 10
Q4 10
Q1 11
Q2 11
Q3 11
Customer Service Fees
$345
$336
$341
$338
$373
$396 |
  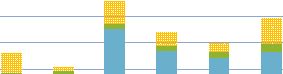 7
Executing on Growth
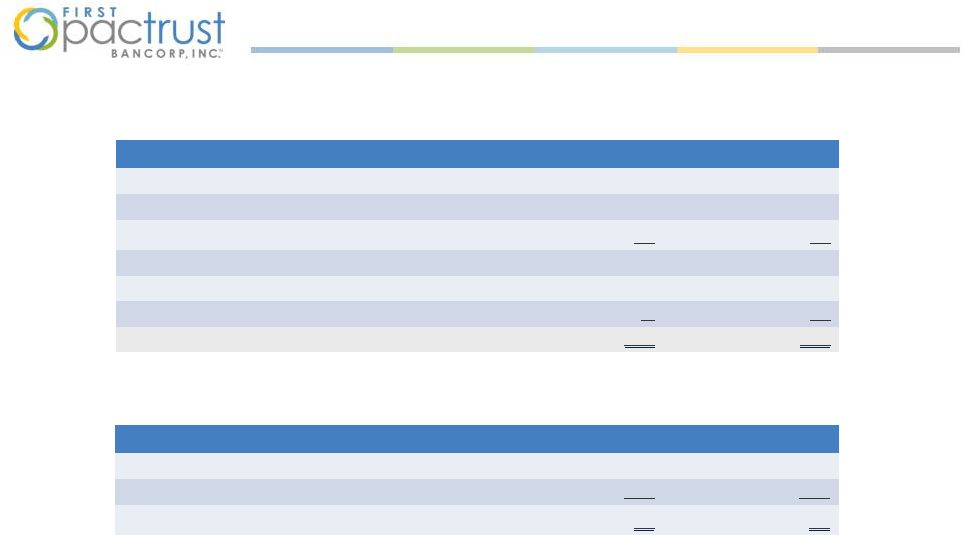
Non-interest expense
•
Non-interest expense increased by $1.7
million from $6.0 million during Q2 2011 to
current quarter’s $7.7 million
–
difference is due to $1.3 million in
additional OREO charges, change in
control expenses booked during Q3 2011
of $0.2 million and $0.3 million
incremental expenses associated with
strategic initiatives, including
acquisitions
•
Selected expenses
–
Q4 2010 and Q1 & Q3 2011 salaries &
employee benefits were impacted by
change of control payments; 2011 also
reflects additions in branch & loan
production personnel to drive organic
growth
–
Prior quarter professional services
expense was impacted by private
placement; today reflects acquisition
activity
–
OREO and related expenses fluctuate
driven by completion of current asset
resolution activities
Q2 10
Q3 10
Q4 10
Q1 11
Q2 11
Q3 11
Non-interest Expense
$4,925
$3,846
$9,187
$6,816
$5,999
$7,661
$-
$2,000
$4,000
$6,000
$8,000
$10,000
Non-interest Expense
(amounts in $ thousands)
Q2 10
Q3 10
Q4 10
Q1 11
Q2 11
Q3 11
REO/FrclsurExp
$1,546
$277
$1,738
$1,131
$720
$1,994
Prof Srvcs
$141
$238
$400
$335
$414
$667
Salaries
$1,536
$1,614
$5,088
$3,381
$2,856
$3,251
$-
$2,000
$4,000
$6,000
$8,000
$10,000
Selected Expenses
(amounts in $ thousands) |
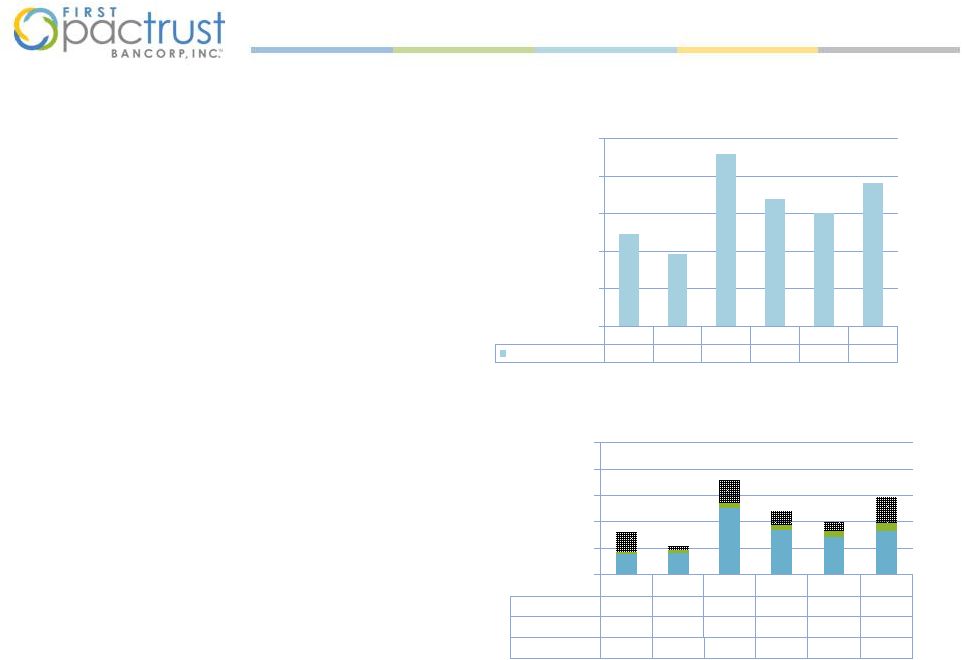
 8
Executing on Growth
Credit quality and provision
•
Early delinquencies at lowest level during
past 6 quarters
•
NPLs at lowest level during past 6 quarters
•
OREO increased as resolution activity
matures
•
ALLL coverage as a % of non-accrual loans is
largest in 6 quarter
Early DQ
NPL
OREO
Q2 10
$29.2
$8.3
Q3 10
$27.0
$22.0
$7.8
Q4 10
$31.5
$19.9
$6.6
Q1 11
$27.2
$27.6
$6.4
Q2 11
$20.1
$14.2
$15.0
Q3 11
$9.0
$9.2
$20.6
$0
$10
$20
$30
$40
Early Delinquencies & NPA Components
(amounts in $ millions)
ALLL
$17.7
$17.6
$14.6
$11.9
$8.4
$9.0
as a % of Non
Accrual Loans
40.2%
46.0%
41.3%
38.8%
38.2%
82.4%
0.0%
10.0%
20.0%
30.0%
40.0%
50.0%
60.0%
70.0%
80.0%
90.0%
$-
$2.0
$4.0
$6.0
$8.0
$10.0
$12.0
$14.0
$16.0
$18.0
$20.0
Allowance for Loan & Lease Losses
(amounts in $ millions / %)
Q2
10
Q3
10
Q4
10
Q1
11
Q2
11
Q3
11
$22.9 |
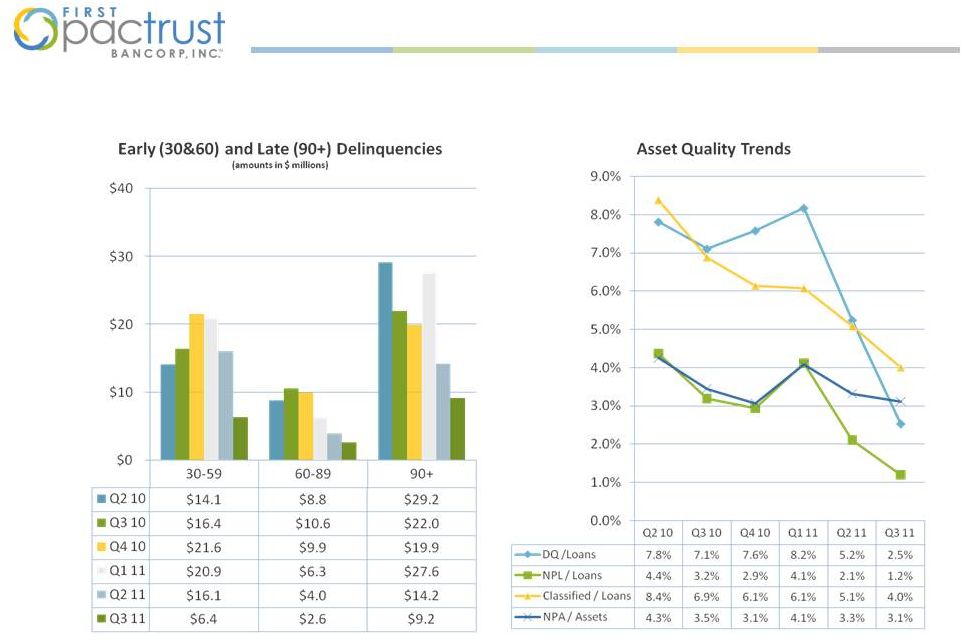 9
Executing on Growth
Credit metrics
Credit metrics
Improved asset quality |
 10
Executing on Growth
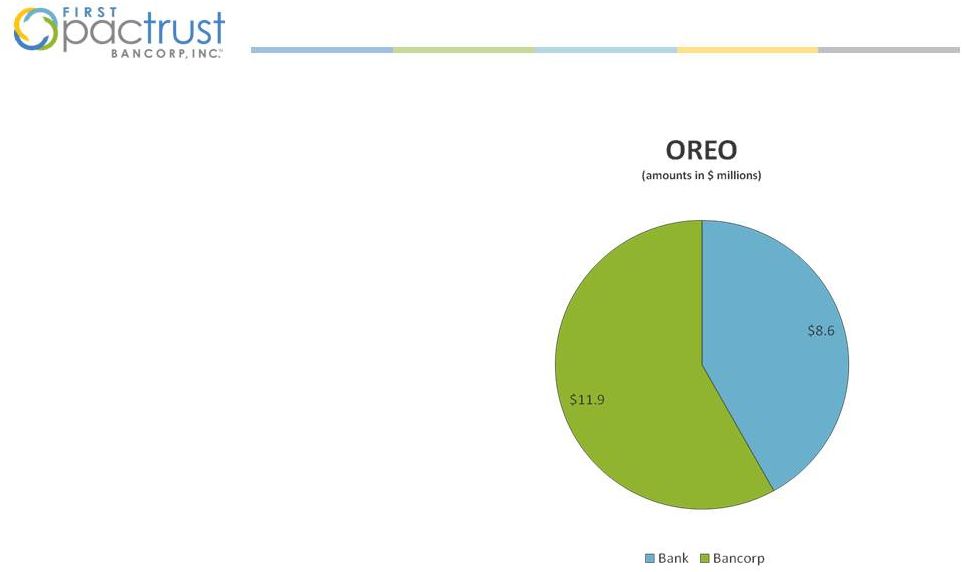
OREO
•
OREO rose to $20.6 million as of
September 30, 2011 versus $15.0 million at
June 30, 2011; the Company saw $2.4
million reductions to OREO properties and
added 9 properties totaling $8.0 million
•
Growth in OREO was expected as Company
cleared out NPAs
•
OREO balances are concentrated at the
holding company or in a special purpose
subsidiary of the holding company, which
combined, total $11.9 million or 58% of
total OREO; includes 3 construction/land
loans that have been written down to less
than 20% of original loan amounts
•
Expect reductions in OREO during the next
few quarters with completion of property
sales and fewer migration of remaining
NPLs into OREO |
 11
Executing on Growth
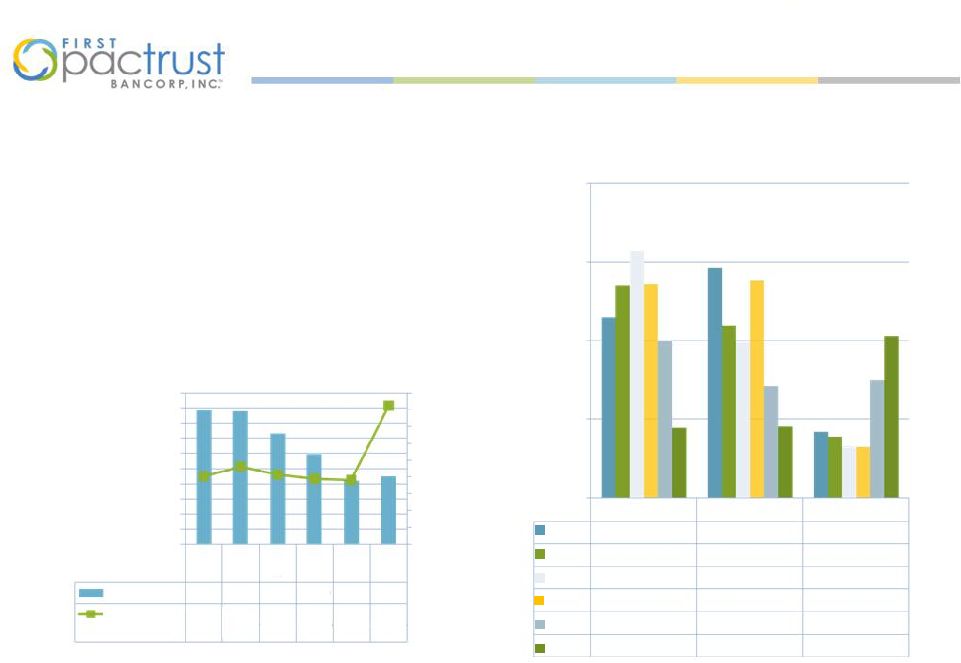
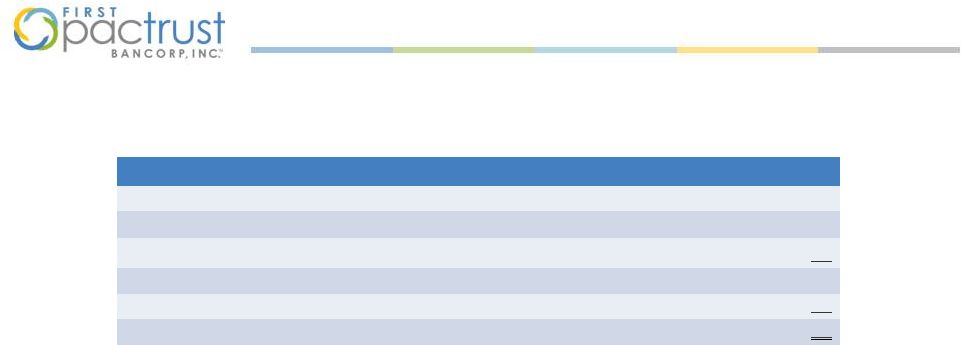
Capital
•
Strong capital position made stronger
through $32 million SBLF preferred equity
raise
•
FPTB’s tangible common equity to asset
ratio remains at 18.2%
–
FPTB maintains sufficient equity to
support M&A commitments and
organic growth
•
Strong capital position at Pacific Trust Bank
–
Q3 2011 total core capital to adjusted
tangible assets stands at 14.3% and
total risk-based capital ratio stands at
20.8%
Ratio
Q2
10
Q3
10
Q4
10
Q1
11
Q2
11
Q3
11
Total Core
Capital
9.2%
9.8%
11.1%
12.1%
11.6%
14.3%
Tier 1 Risk-
based Capital
12.1%
12.9%
14.9%
16.0%
16.0%
19.7%
Total Risk-
based Capital
13.4%
14.2%
16.2%
17.3%
17.2%
20.8%
Pacific Trust Bank Regulatory Capital Ratios
Q2 10
Q3 10
Q4 10
Q1 11
Q2 11
Q3 11
TCE to Assets
8.8%
9.2%
15.8%
16.3%
18.2%
18.2%
0.0%
5.0%
10.0%
15.0%
20.0%
TCE to Assets |
 12
Executing on Growth
Other items
Gateway merger
•
Merger and integration activities are
underway
•
Awaiting OCC approval
•
Expect to file waiver with FRB
•
On track for Q4 2011 close
Beach merger
•
S-4 filing
•
FRB notified of BANC’s intention to become
a multi-bank holding company
•
On track for Q1 2012 close
Liquidity
•
FPTB and Pacific Trust Bank have sufficient
on-balance sheet liquidity to fund daily
activities
•
Cash and equivalents total $75 million or
8.1% of assets
•
Securities total $65 million or 7.0% of
assets; generates approximately $4 million
in cash flow a month
Regulatory Update
•
OCC conducting initial safety and soundness
exam |
 13
Executing on Growth
Summary
Delivering earnings while building for growth
$1.0 million in core earnings to common in the Q3 2011 (excluding non-core transaction
expenses);
Pre-tax pre-provision of $3.1 million, adjusted for OREO charges
Improved credit quality
Improved quality of earnings
Lending platforms produced $69 million of production and strong pricing
New branches delivering organic funding growth
Opportunity for further NIM expansion as higher-cost CDs mature in 2011
Strong capital position
Strong liquidity position |
 Appendices |
 15
Executing on Growth
Non-GAAP Financial Information
6/30/2010
9/30/2010
12/31/2010
3/31/2011
6/30/2011
9/30/2011
Stockholders’equity
$
96,413
$
98,867 $
136,009 $
135,650 $
160,475 $
191,488
Less: Intangible assets
0
0
0
0
0
0
Less: Preferred stock
0
0
0
0
0
31,940
Tangible common equity
$
96,413
$
98,867 $ 136,009
$ 135,650
$ 160,475
$
159,548
This presentation contains certain financial information determined by methods other than in
accordance with accounting principles generally accepted in the United States
(“GAAP”). These non-GAAP financial measures include tangible common equity, tangible
common equity per share pre-tax pre-provision income, non-interest income excluding
gain-on-sale of securities and core earnings. Tangible common equity and tangible common equity per share are calculated by excluding preferred
equity from stockholders’ equity and excluding any intangible assets (of which we
currently have none) from assets. We believe that this is consistent with the treatment
by our regulatory agency, which excludes any intangible assets from the calculation of risk-based capital ratios.
Accordingly, management believes that these non-GAAP financial measures provide information to
investors that is useful in understanding the basis of our risk-based capital ratios.
Management also believes that core earnings is a useful measure of assessing our operating
performance. Pre-tax pre-provision profit is total revenue less non-interest expense and pre-tax
pre-provision profit , adjusted for OREO charges, is total revenue less non-interest
expense plus OREO-valuation allowance plus loss on sale of OREO. Management believes that
these two additional non-GAAP financial measures are useful because it enables investors and
other to assess the Company’s ability to generate capital to cover losses through a credit
cycle. Reconciliations of the non-GAAP measures to the comparable GAAP measures are provided below.
The following table presents a reconciliation of tangible common equity to stockholders’ equity
(dollars in thousands):
|
 16
Executing on Growth
Non-GAAP Financial Information
(Continued)
6/30/2011
9/30/2011
Net income
$
1,549
$
644
Add: Income tax expense (benefit)
644
368
Add: Provision for loan losses
451
823
Pre-tax pre-provision income
$
2,644
$
1,835
Add: OREO-valuation allowance
137
1,329
Add: Loss on sale of OREO
51
105
Pre-tax pre-provision income, adjusted for OREO charges
$
2,832
$
3,269
The
following
table
presents
a
reconciliation
of
pre-tax
pre-provision
income
to
net
income
(dollars
in
thousands):
6/30/2011
9/30/2011
Non-interest income
$
1,635
$
2,012
Less: Gain-on-sale of securities
1,118
1,450
Non-interest income, excluding gain-on-sale of securities
517
562
The following table presents a reconciliation of non-interest income to
non-interest income, excluding gain-on-sale of securities
(dollars in thousands): |
 17
Executing on Growth
Non-GAAP Financial Information
(Continued)
9/30/11
Net income
$
644
Add: Non-core change of control payment (net of tax)
155
Add: Non-core professional service & other expense (net of tax)
302
Core earnings
$
1,101
Less: Preferred dividend
138
Core earnings to common
$
963
The following table presents a reconciliation of core earnings to net income
(dollars in thousands): |