Attached files
| file | filename |
|---|---|
| EX-99.1 - PRESS RELEASE - GEORESOURCES INC | d252612dex991.htm |
| 8-K - FORM 8-K - GEORESOURCES INC | d252612d8k.htm |
 Corporate Profile
November, 2011
Exhibit 99.2 |
 Forward-Looking Statements
Information
included
herein
contains
forward-looking
statements
that
involve
significant
risks
and
uncertainties,
including
our
need
to
replace
production
and
acquire
or
develop
additional
oil
and
gas
reserves,
intense
competition
in
the
oil
and
gas
industry,
our
dependence
on
our
management,
volatile
oil
and
gas
prices
and
costs,
uncertain
effects
of
hedging
activities
and
uncertainties
of
our
oil
and
gas
estimates
of
proved
reserves
and
resource
potential,
all
of
which
may
be
substantial.
In
addition,
past
performance
is
no
guarantee
of
future
performance
or
results.
All
statements
or
estimates
made
by
the
Company,
other
than
statements
of
historical
fact,
related
to
matters
that
may
or
will
occur
in
the
future
are
forward-looking
statements.
Readers
are
encouraged
to
read
our
December
31,
2010
Annual
Report
on
Form
10-K
and
any
and
all
of
our
other
documents
filed
with
the
SEC
regarding
information
about
GeoResources
for
meaningful
cautionary
language
in
respect
of
the
forward-looking
statements
herein.
Interested
persons
are
able
to
obtain
copies
of
filings
containing
information
about
GeoResources,
without
charge,
at
the
SEC’s
internet
site
(http://www.sec.gov).
There
is
no
duty
to
update
the
statements
herein.
2 |
 3
Company Highlights
Value Creation
Balanced Portfolio
Long-Term
Growth
–
71,000
net
acres
in
two
premier
U.S.
liquids
resource
plays
Strong
Current
Cash
Flow/Profitability
–
5,545
Boe/d
of
production
in
3Q
2011
(65%
oil)
24
Mmboe
proved
reserves;
60%
oil
(1)
Substantial Eagle Ford Position
25,000
net
acres
(primarily
operated)
Successful
recent
drilling
has
de-risked
acreage
and
have
proved
commerciality
of
play
Two
dedicated
rigs
under
contract
Significant Producing Bakken Position
46,000
net
acres
(33,200
operated)
Continually
leasing
Two
dedicated
rigs
currently
running
on
operated
position
(1)
Does
not
include
interests
in
affiliated
partnerships.
Reserves
based
on
SEC
pricing
as
of
1/1/11.
See
Additional
Disclosures
in
Appendix.
3 |
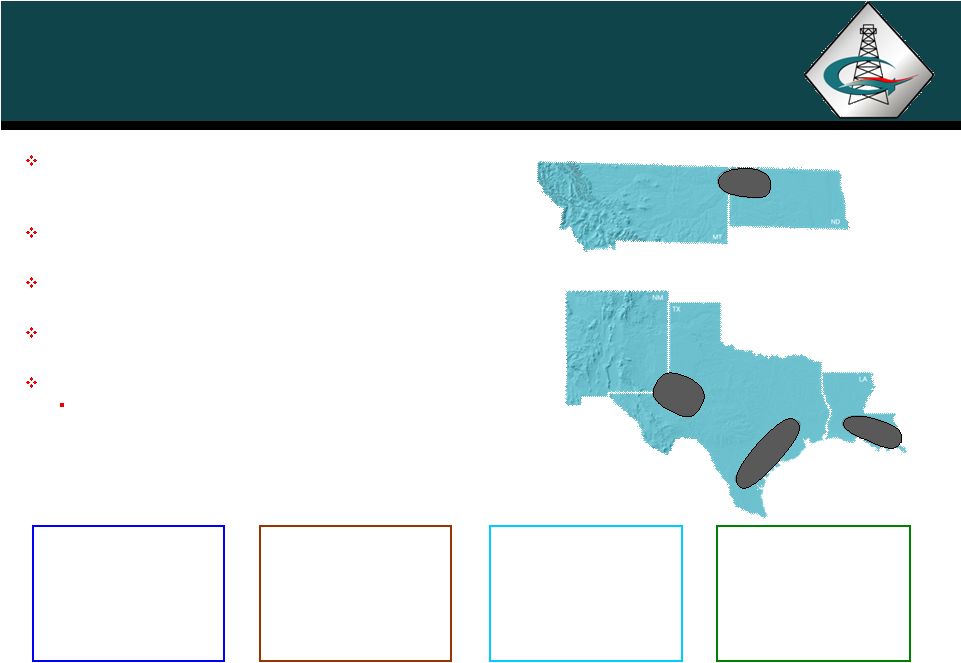
 Company Overview
(1)
Reserve
data
as
of
January
1,
2011
and
production
data
is
for
3Q
2011.
Data
excludes
interests
in
two
affiliated
partnerships.
Reserves
based
on
SEC
pricing
for
2010.
See
Additional
Disclosures
in
Appendix.
(2)
Adjusted
EBITDAX
is
a
non-GAAP
financial
measure.
Please
see
Appendix
for
a
definition
of
Adjusted
EBITDAX
and
a
reconciliation
to
net
income.
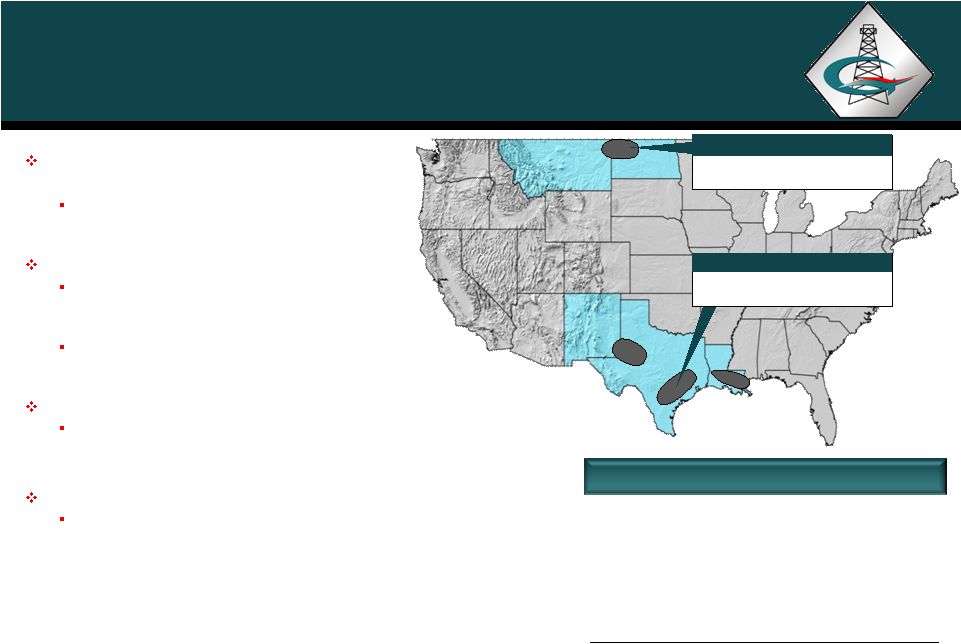
Bakken
46,000 net acres
Reserve and Production Snapshot
(1)
Operations focused in Texas, Gulf Coast
and Williston Basin
Oil-weighted
production
and
reserves
from
primarily
operated
properties
Growing production profile
Significant
low-risk
drilling
inventory
in
two
leading
oil-rich
resource
plays
(Bakken,
Eagle
Ford)
Additional
upside
in
legacy
HBP
positions
(Austin
Chalk,
South
Louisiana,
Permian)
Strong cash flow generation
Adjusted
EBITDAX
of
$78
MM
(2)
for
twelve
month
period
ended
September
30,
2011
Significant liquidity
$216MM
of
cash
and
revolver
availability
Eagle Ford
25,000 net acres
4
01/01/11 Proved Reserves (MMBOE)
24.0
Oil % (Reserves)
60%
Proved Developed %
74%
3Q 2011 Production (Boe/d)
5,545
Oil % (Production)
65%
Operated Production
75% |
 Proved Reserves (MMBOE)
(2)
Average Daily Production (BOE/d)
Reserves and Production
Current Proved Reserves –
24.0 MMBOE
(1)
(1)
As of January 1, 2011. Excludes partnership interests.
(2)
2006 –
2010 proved reserves based on SEC guidelines.
(3)
2008 reserves reflect lower prices and divestitures. See Additional
Disclosures in Appendix. 5 |
 Oil
Weighted Development GeoResources Asset Overview
6 |
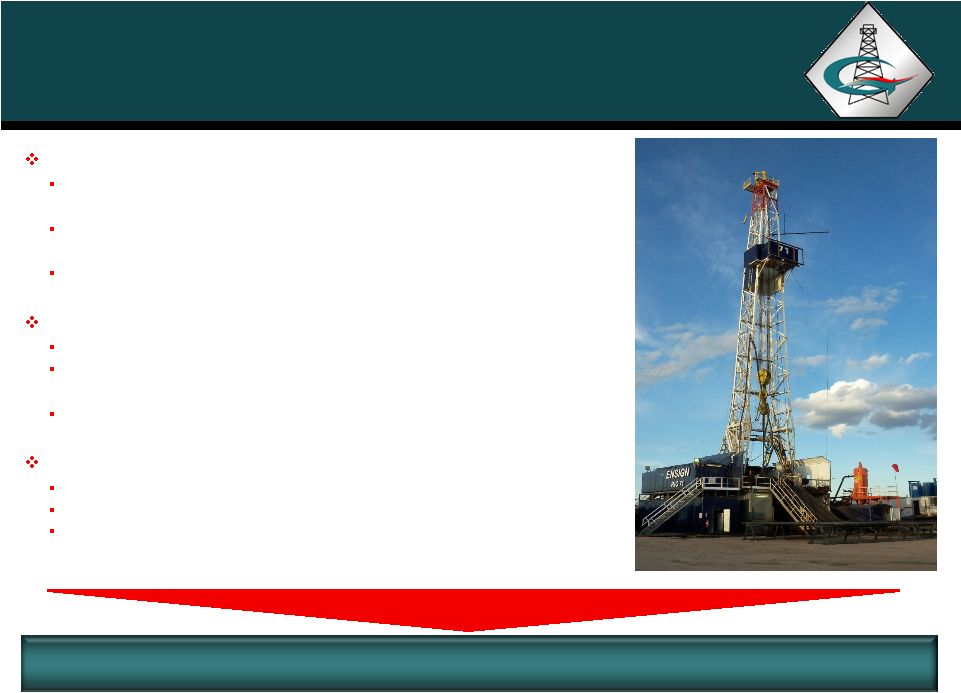
 Eagle
Ford Shale Overview 25,000 net acres primarily Southwest
Fayette County, TX
Will spud 8 -
9 gross wells in 2011 and 21 -
24 in 2012
2011 & 2012 drilling programs average 40%
-
45% WI
Eagle
Ford
AMI
Ramshorn Investments, Inc., an affiliate of
Nabors Industries, Ltd. purchased a 50%
interest
o
Upfront cash payment
o
Agreed to fund 100% of cost of first six
horizontal wells
GEOI retains 50% WI and operations
Leasehold continues to increase
Fayette County: 20,300 net acres
Gonzales County: 2,700 net acres
Atascosa & McMullen counties
combined: 1,800 net acres
Note:
Information
as
of
November,
2011.
7 |
 Note:
Third
party
Peak
Month
Avg.
rate
calculated
as
maximum
average
daily
production
rate
of
first
four
calendar
months
of
production.
Source
of
third
party
production
data
is Drilling
Info
and/or
HPDI.
Source
of
GeoResources’
data
is
internal
figures.
Information
as
of
November,
2011.
Eagle Ford Shale
Concentrated
23,000
net
acre
block
in
volatile
oil
window
Multi-year
drilling
inventory
Two
dedicated
rigs
under
contract
Successful
initial
drilling
has
de-risked
acreage
408
boe/d
30-day
average
rate
for
first
three
wells
Recently
drilled
two
additional
wells
-
Awaiting
frac
Positive
offset
operator
activity
Magnum
Hunter
Resources
Penn
Virginia
EOG
Austin
Chalk
upside
on
acreage
block
Recently participated in oily Chalk well that
averaged
388
boe/d
for
first
19
days
(14.8
% WI)
Additional
chalk
drilling
planned
for
2012
8
MHR Gonzo North #1H
Peak Month Avg.: 471 Boe/d
GEOI Flatonia East #1H
30 day Avg. Rate: 391 Boe/d
GEOI Flatonia East #2H
30 day Avg. Rate: 465 Boe/d
PVA Munson Ranch #3H
Peak Month Avg.: 728 Boe/d
MHR Gonzo Hunter #1H
Peak Month Avg.: 341 Boe/d
MHR Geo Hunter #1H
Peak Month Avg.: 504 Boe/d
PVA Gardner El Al #1H
Peak Month Avg.: 852 Boe/d
PVA Hawn Holt #9H
Peak Month Avg.: 951 Boe/d
GEOI Peebles #1H
Awaiting Frac
GEOI Black Jack Springs #1H
30 day Avg. Rate: 369 Boe/d
GEOI Ring “A”
To Be Spud By Yr. End
GEOI Newtonville #1H
To Be Spud By Yr. End
GEOI Arnim “A”
1
st
pad Location
#1H: Awaiting Frac
#2H: Drilling |
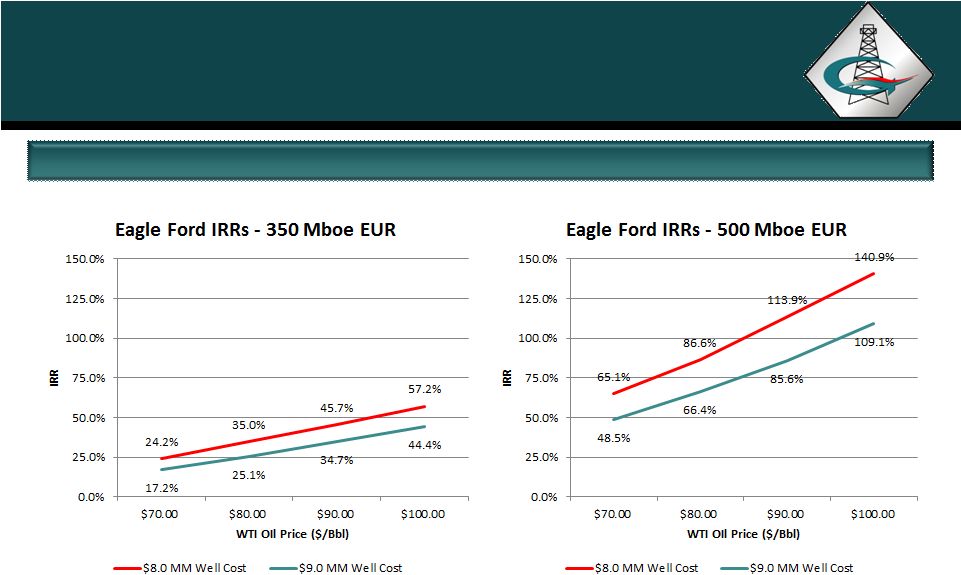 Eagle
Ford Development Economics Development Economics (~5,000 ft.
Lateral) (1)(2)
(1)
Assumes oil differentials of (5%) and assumes gas shrinkage of (15%). Natural gas
price held constant at $5/Mcf with a +20% gas differential. (2)
EUR refers to management’s internal estimates of reserves potentially
recoverable from successful drilling of wells. See Additional Disclosures in Appendix.
9
9 |
 Eagle
Ford Illustrative Resource Potential Resource Potential
(1)
(1)
Data is for illustrative purposes only and is based on management
assumptions. EUR refers to management’s internal estimates of reserves potentially recoverable
from successful drilling of wells. See Additional Disclosures in
Appendix. 10
10
Undeveloped Eagle Ford Acreage Provides Net
Resource Potential of ~60 to ~80 MMboe
Eagle Ford Shale (Fayette Co., Texas)
350 Mboe
500 Mboe
Assumed Spacing Unit Size (Acres)
900
900
# Wells per Spacing Unit
6
6
# Acres per Well (Spacing Unit / # Wells per Unit)
150
150
GeoResources Net Undeveloped Acres
25,000
25,000
Number of Potential Net Drilling Locations
167
167
Estimated EUR per Well (Mboe)
350
500
Unrisked Illustrative Resource Potential (Mboe)
58,333
83,333 |
   11
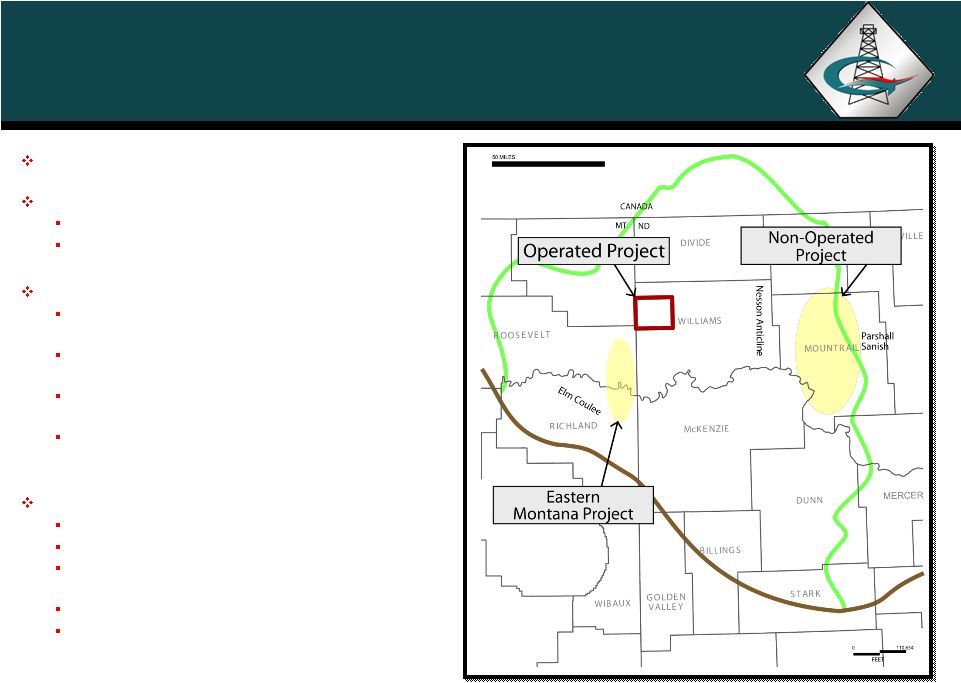
Bakken Shale Overview
46,000 total net acres in three project areas
Williams County Project (Operated)
Concentrated 25,000 net acre block
6 wells drilled and completed
Eastern Montana Project (Primarily Operated)
8,200 operated / 1,800 non-operated acres in
Roosevelt/Richland County, MT
WI range from 25% to 100% with an average WI of
~50%
Recently
completed
1
st
operated
Bakken
well,
Olson #1-21-16H –
flowing back after frac
Participated in four other successful non-op wells to
date
Mountrail County Project (Non-Op)
Partnered with Slawson Exploration Company
11,000 net acres primarily Mountrail County, ND
WI range from 1% to 18% with an average WI of
~8%
Drilled over 100 wells to date; 100% success
4-5 rigs currently running
Note:
Information
as
of
November,
2011.
11 |
 Williams County Project
Concentrated 25,000 net acre block
in NW Williams Co., ND
Will spud 10 -
11 gross wells in 2011
and 23 –
26 gross wells in 2012
2011 & 2012 drilling programs average
25% -30% WI
Multi-year drilling inventory
2 dedicated rigs currently running
Bakken AMI
Partnered with Resolute Energy
Retained 47.5% WI in project
Successful initial drilling has de-
risked acreage
288 bo/d peak month average rate
12
Note:
Information
as
of
November,
2011.
Peak
Month
Avg.
rate
calculated
as
maximum
average
daily
production
rate
of
first
four
calendar
months
of
production
and
excludes months
with
less
than
20
days
of
production.
Source
of
all
production
data
is
NDIC
website.
408 bo/d
(6 Wells)
333 bo/d
(5 Wells)
264 bo/d
(3 Wells)
268 bo/d
(4 Wells)
309 bo/d
(2 Wells)
262 bo/d
(1 Well)
245 bo/d
(1 Well)
345 bo/d
(3 Wells)
Peak Month Average Rates In Project Area
MARATHON |
 Williams County Development Economics
Development Economics (1,280 Acre Unit)
(1)(2)
(1)
Assumes oil differential of (15%) and assumes gas shrinkage of (10%). Natural gas
price held constant at $5/Mcf with no gas differential. (2)
EUR refers to management’s internal estimates of reserves potentially
recoverable from successful drilling of wells. See Additional Disclosures in Appendix.
13
13 |
 Bakken Illustrative Resource Potential
Resource Potential
(1)
(1)
Data is for illustrative purposes only and is based on management
assumptions. EUR refers to management’s internal estimates of reserves potentially recoverable
from successful drilling of wells. See Additional Disclosures in
Appendix. 14
14
Undeveloped Bakken Acreage Provides Net Resource
Potential of ~35 to ~50 MMboe
Bakken (Williams Co. & Montana)
Bakken (Mountrail County)
350 Mboe
500 Mboe
400 MBOE
600 MBOE
Assumed Spacing Unit Size (Acres)
1,280
1,280
1,280
1,280
Estimated Remaining # Wells per Spacing Unit (Bakken Only)
3.0
3.0
1.5
1.5
# Acres per Well (Spacing Unit / # Wells per Unit)
427
427
853
853
GeoResources Net Acres
35,000
35,000
11,000
11,000
Number of Potential Net Drilling Locations
82
82
13
13
Estimated EUR per Well (Mboe)
350
500
400
600
Unrisked Illustrative Resource Potential (Mboe)
28,711
41,016
5,156
7,734 |
 Focused on Improving Economics
15
15
Eagle Ford
Bakken
Improving drilling efficiencies
Drilling without intermediate casing
Pad drilling
Walking rigs
Improving frac efficiencies
Simultaneous / back-to-back frac jobs
300 feet or less between frac stages
Optimizing proppant size and volume
Resin-coated sand
Enhancing knowledge
Taking cores
Micro-seismic
Pilot holes
Monitoring peer activity
Improving drilling efficiencies
Efforts to date have reduced drilling time from
~30 to ~20 days resulting in cost savings of
~$900K in last three wells vs. first three wells
Additional cost savings expected with future pad
drilling and walking rigs
Improving frac efficiencies
Simultaneous / back-to-back frac jobs
Mass sliding sleeves
Infrastructure development
Oil and gas gathering agreement executed
Saltwater disposal wells being developed
Enhancing knowledge
Taking cores
Micro-seismic
Monitoring peer activity
Efforts underway to reduce well costs by $500K to $1.0MM per well
|
 Financial Overview |
 Capital Plan and Production Guidance
2012 Capital Budget
2011 capital plan of approximately $120 MM
2012 capital plan of $188 MM to $223 MM
Current project allocations favor lower-risk, high
cash flow oil-weighted projects primarily in
Bakken and Eagle Ford
Capital Allocation
17
17
Production Guidance
Year Ending December 31, 2011
5,000 to 5,500 boe/d estimated daily rate
61% to 65% oil
Year Ending December 31, 2012
6,500 to 7,500 boe/d estimated daily rate
70% to 75% oil
($ in millions)
Low
(1)
High
(2)
Notes
Bakken Operated (Williams County and Montana)
$61
$73
23 to 26 gross wells (~31% W.I.)
Bakken Non-Operated (Primarily Mountrail County)
23
23
42 gross wells with Slawson (8% W.I.); 12 with others (1% W.I.)
Eagle Ford (Fayette and Gonzales Counties)
74
86
21 to 24 gross wells (~40% W.I.)
Other Drilling
11
11
Williston basin conventional, St. Martinville and Chalk drilling
Acreage and Seismic
15
25
Primarily Eagle Ford and Bakken
Infrastructure and Other
4
5
Saltwater disposal and other infrastructure and equipment
Total Expected 2012 Capital Expenditures
$188
$223
(1) Assumes GEOI grows to 3 drilling rigs in both the Bakken and Eagle Ford in 2012 with gross well
costs of $8.0 million on GEOI operated Bakken wells and $8.5 million on GEOI operated Eagle
Ford wells. (2) Assumes GEOI grows to 4 drilling rigs in both the Bakken and Eagle Ford by late
2012 with gross well costs of $8.5 million on GEOI operated Bakken wells and $9.0 million on
GEOI operated Eagle Ford wells. |
 $0.0
$10.0
$20.0
$30.0
$40.0
$50.0
$60.0
$70.0
$80.0
2008
2009
2010
Twelve Mos.
Ended
9/30/11
$49.0
$45.8
$66.7
$77.6
-
0.2
0.4
0.6
0.8
1.0
1.2
1.4
1.6
2008
2009
2010
3Q 2011
0.8x
1.5x
1.3x
0.0x
18
Adjusted EBITDAX
(1)
Debt / Trailing 12 Mos. Adj. EBITDAX
(1)
Conservative use of leverage to maintain strong balance sheet
Ability to fund 2012 capital budget with cash flow and undrawn debt capacity
Twelve months ended 9/30/11 EBITDAX
(1)
= $77.6 MM
$216 MM of liquidity
-
Undrawn revolver with $180 MM borrowing base (commitment received in October
2011) -
September 30, 2011 cash balance of $36 MM
Strong Financial Position
($ in millions)
(1)
Adjusted EBITDAX is a non-GAAP financial measure. See reconciliation of
net income to Adjusted EBITDAX following in Appendix. 18
|
 Investment Highlights
Value Creation
Significant upside from Eagle Ford and Bakken positions
Eagle Ford Shale -
25,000 net acres
Bakken Shale -
46,000 net acres
Ongoing leasing program to further expand acreage
Solid proved reserve and production base
24
MMBOE
of
proved
reserves
(1)
with
bias
towards
liquids
High level of operating control
Additional gas and oil upside identified in conventional assets
Strong financial position to execute development plans
Significant free cash flow from existing assets to invest in resource plays
Unlevered balance sheet
Experienced management and technical team with large ownership stake
Successful
track
record
of
creating
value
and
liquidity
for
shareholders
Cost
effective
operator
with
significant
operating
experience
in
unconventional
resource
plays
Board
and
management
own
approximately
20%
of
the
company
(1)
Does not include interests in affiliated partnerships. Reserves based on SEC
pricing as of 1/1/11. See Additional Disclosures in Appendix. 19
|
 Appendix |
 21
Giddings Field –
Austin Chalk
29,000 net acres held
17 wells drilled –
100% success
WI ranges from 37% -
53%
Operating control
Majority of acreage held-by-production
Assets represent value option on gas
prices
Multiple additional drilling locations
(primarily gas weighted)
20%+ IRR at $4.00 gas with 60%+ IRR at
$6.00 gas
Additional upside includes:
Eagle Ford, Georgetown and Yegua
potential
Rate increase potential on existing wells
from slick water fracture stimulations
Recently completed drilling W. Cannon
Unit in northwest Grimes County
(43.4% WI)
1,014 Boe/d rate for first 60 days
67% oil
APACHE
APACHE
APACHE
APACHE
APACHE
CWEI
CWEI
MAGNUM-HUNTER
Lee
Washington
Waller
Fayette
Austin
Colorado
Milam
Brazos
Grimes
Burleson
Giddings Field Acreage
Eagle Ford AMI
21
GEOI West Cannon Unit
60 Day Avg.: 1,014 Boe/d |
 22
Management History
2004-
2007
Southern Bay Energy, LLC
Gulf Coast, Permian Basin
REVERSE MERGED INTO
GEORESOURCES, INC.
1992-1996
Hampton Resources Corp
Gulf Coast
SOLD TO BELLWETHER
EXPLORATION
Preferred investors –
30% IRR
Initial investors –
7x return
1997-2001
Texoil Inc.
Gulf Coast, Permian Basin
SOLD TO OCEAN ENERGY
Preferred investors –
2.5x return
Follow-on investors –
3x return
Initial investors –
10x return
2001-2004
AROC Inc.
Gulf Coast, Permian Basin, Mid-Con.
DISTRESSED ENTITY TURNED
AROUND AND MONETIZED
Preferred investors –
17% IRR
Initial investors –
4x return
Track record of creating value and liquidity for
shareholders
Extensive industry and financial relationships
Significant technical and financial experience
Multiple long-term repeat shareholders
Cohesive management and technical staff
Team has been together for up to 23 years through
multiple entities
22 |
 23
Quarterly Production By Area
Diverse production base from multiple areas
Bakken and Eagle Ford production are growing
Oil-weighted production continues to accelerate
23
Daily Production by Area
(Boe/d)
3 Mos Ended 9/30/11
3 Mos Ended 6/30/11
Rate
% Oil
Rate
% Oil
Growth
Bakken
1,582
92%
1,255
92%
26%
Eagle Ford
281
98%
33
100%
755%
Austin Chalk
1,513
20%
1,326
18%
14%
Other
2,169
72%
2,135
70%
2%
Total
5,545
65%
4,749
61%
17% |
 Bakken AMI Drilling Locations
24
Note:
Information
as
of
November,
2011.
GEOI
operated
wells
are
labeled
with
well
names.
Black
labels
represent
GEOI
wells
that
have
been
spud,
red
labels
represent
GEOI
wells
that
have
been
surveyed
but
not
yet
spud.
A
green
dot
indicates
that
the
well
is
producing,
a
solid
blue
dot
indicates
the
well
is
drilling/completing,
and
a
blue
open
circle
means
that
it
is
a
location
to
be
spud
in
the
future.
Marathon Wells |
 Development Economics Table
Development Economics
(2)
(1)
Assumes Bakken and Eagle Ford oil differentials of (15%) and (5%), respectively.
Assumes Bakken and Eagle Ford gas shrinkage of (10%) and (15%), respectively.
Natural gas price held constant at $5/Mcf with an assumed differential of +20% in
the Eagle Ford and no differential in the Bakken. (2)
EUR refers to management’s internal estimates of reserves potentially
recoverable from successful drilling of wells. These estimates do not necessarily represent reserves
as defined under SEC rules and by their nature and accordingly are more speculative
and substantially less certain of recovery and no discount or risk adjustment is
included in the presentation. Actual locations drilled and quantities that may be
ultimately recovered from the Company’s interests could differ substantially.
25
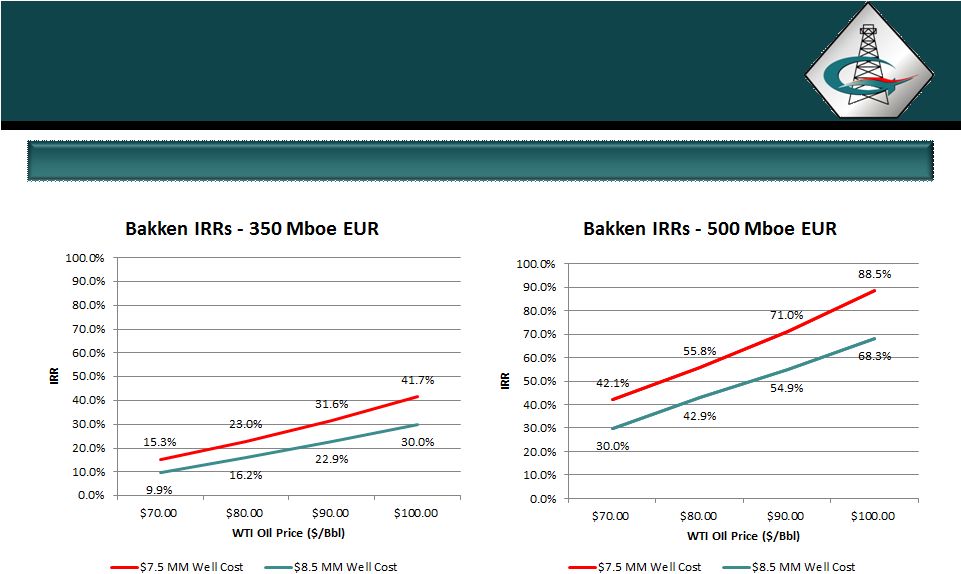
Bakken Shale (Williams Co., North Dakota)
Eagle Ford Shale (Fayette Co., Texas)
350 Mboe
500 Mboe
350 Mboe
500 Mboe
Well Assumptions
Drilling & Completion Cost ($M)
$8,500
$8,500
$9,000
$9,000
Lateral Length (feet)
10,000
10,000
5,000
5,000
WI
100%
100%
100%
100%
NRI
80.0%
80.0%
82.5%
82.5%
First 30 Day Average Oil IP (Bopd)
441
689
448
847
GOR (Scf/bbl)
600
600
1,000
1,000
Economics @ $80/bbl and $5/Mcf
(1)
NPV @ 10%
$1,335
$5,715
$2,979
$7,847
IRR
16.2%
42.9%
25.1%
66.4%
Payout (Yrs)
4.0
1.9
2.7
1.3
ROI
1.7
2.4
1.8
2.5
Price Sensivity (IRR)
(1)
$100/Bbl (WTI)
30.0%
68.3%
44.4%
109.1%
$90/Bbl (WTI)
22.9%
54.9%
34.7%
85.6%
$80/Bbl (WTI)
16.2%
42.9%
25.1%
66.4%
$70/Bbl (WTI)
9.9%
30.0%
17.2%
48.5% |
 26
Proved Reserves
(1)
PV-10% is a non-GAAP financial measure. See reconciliation of SEC PV
10% to standardized measure in Appendix. (2)
Utilizing five year NYMEX forward prices at 1/1/11. See Additional
Disclosures in Appendix. ($ in millions)
Oil
Gas
Total
% of
Corporate Interests
MMBO
BCF
MMBOE
Total
PV-10
PDP
8.9
33.0
14.4
60.0%
$239.6
PDNP
2.3
6.1
3.4
14.2%
68.5
PUD
3.2
18.4
6.2
25.8%
70.2
Total Proved Corporate Interests
14.4
57.6
24.0
100.0%
378.3
Partnership Interests
0.1
8.0
1.4
12.0
Total Proved Corporate and Partnerships
14.5
65.6
25.4
$390.3
26
Proved Reserves –
SEC Pricing at 1/1/11
Proved Reserves –
Forward Strip Pricing at 1/1/11
($ in millions)
Oil
Gas
Total
% of
Corporate Interests
MMBO
BCF
MMBOE
Total
PV-10
PDP
9.2
35.2
15.1
60.2%
$303.6
PDNP
2.4
6.3
3.4
13.5%
83.7
PUD
3.3
19.6
6.6
26.3%
98.5
Total Proved Corporate Interests
14.9
61.1
25.1
100.0%
485.8
Partnership Interests
0.1
8.3
1.4
15.9
Total Proved Corporate and Partnerships
15.0
69.4
26.5
$501.7
(1)
(2) |
 Hedge
Portfolio Oil Hedges
GEOI uses commodity price risk management in order to execute its business plan
throughout commodity price cycles
Natural Gas Hedges
$85 .00 to
$110.00
27
Weighted Average Gas Hedge Price
2011
2012
2013
$6.76
$5.48
$4.85
Collar
Swap
Note:
2011
hedge
volume
and
weighted
average
price
data
is
as
of
10/1/2011.
Weighted Average Oil Hedge Price
2011
2012
2013
$85.11
$90.76
$101.85 |
 28
Operating Performance
Historical Operating Data
12 Mos Ended
Years Ended December 31,
9/30/2011
2010
2009
2008
Key Data:
Average realized oil price ($/Bbl)
83.45
$
70.33
$
61.09
$
82.42
$
Avg. realized natural gas price ($/Mcf)
5.30
$
5.30
$
3.97
$
8.12
$
Oil production (MBbl)
1,127
1,060
851
743
Natural gas production (MMcf)
4,219
4,789
4,944
2,962
% Oil
62%
57%
51%
60%
($ in millions except per share data)
Total revenue
123.7
$
107.0
$
81.0
$
94.6
$
Reported net income attributable to GeoResources
29.8
$
23.3
$
9.8
$
13.5
$
Adjusted net income
(1)
29.7
$
24.3
$
10.9
$
16.3
$
Adjusted earnings
(1)
per share (diluted)
1.22
$
1.21
$
0.66
$
1.03
$
Adjusted EBITDAX
(1)
77.6
$
66.7
$
45.8
$
49.0
$
28
(1)
Adjusted Net Income and Adjusted EBITDAX are non-GAAP financial
measures. See reconciliation of net income to Adjusted Net Income and Adjusted EBITDAX in Appendix.
28 |
 29
Reconciliation of non-GAAP Measures
(1) As used herein, Adjusted EBITDAX is calculated as net income
attributable to GeoResources, Inc. before interest, income taxes, depreciation,
depletion and amortization, and exploration expense and further excludes
non-cash compensation, impairments, hedge ineffectiveness and income or
loss on derivative contracts. Adjusted EBITDAX should not be
considered as an alternative to net income (as an indicator of operating
performance) or as an alternative to cash flow (as a measure of liquidity or ability to service debt obligations) and is
not in accordance with, nor superior to, generally accepted accounting
principles, but provides additional information for evaluation of our
operating performance. 29
12 Mos Ended
Years Ended December 31,
9/30/2011
2010
2009
2008
($ in millions)
Net Income Attributable to GeoResources
29.8
$
23.3
$
9.8
$
13.5
$
Adjustments:
(Gain) on sale of property and equipment
(1.5)
$
(1.0)
$
(1.4)
$
(4.4)
$
Interest and other income
(0.6)
$
(1.5)
$
(1.0)
$
(0.8)
$
Interest Expense
2.3
$
4.7
$
5.0
$
4.8
$
Income Taxes
18.5
$
11.9
$
5.1
$
7.8
$
Depreciation, depletion and amortization
25.5
$
24.7
$
22.4
$
16.0
$
Unrealized (gain) / loss on hedge and derivatives
0.6
$
(0.9)
$
0.3
$
0.4
$
Non-cash Compensation
1.7
$
1.1
$
1.4
$
0.6
$
Exploration
0.6
$
0.8
$
1.4
$
2.6
$
Impairments
0.7
$
3.4
$
2.8
$
8.3
$
Adjusted EBITDAX
(1)
77.6
$
66.7
$
45.8
$
49.0
$
Adjusted EBITDAX Reconciliation |
 30
Reconciliation of non-GAAP Measures
30
12 Mos Ended
Years Ended December 31,
9/30/2011
2010
2009
2008
($ in millions)
Net Income Attributable to GeoResources
29.8
$
23.3
$
9.8
$
13.5
$
Adjustments:
Unrealized (gain) / loss on hedge and derivatives
0.6
$
(0.9)
$
0.3
$
0.4
$
Impairments
0.7
$
3.4
$
2.8
$
8.3
$
(Gain) on sale of property and equipment
(1.5)
$
(1.0)
$
(1.4)
$
(4.4)
$
Tax impact
0.1
$
(0.6)
$
(0.7)
$
(1.7)
$
Adjusted Net Income
29.7
$
24.3
$
10.9
$
16.3
$
Adjusted Net Income Reconciliation
(1) Tax impact is estimated as 38.1% and 37.6% of the pre-tax adjustment
amounts for 2011 and prior years respectively. (2) As used
herein, adjusted net income is calculated as net income attributable to GeoResources, Inc. excluding (gains) and losses on property sales, impairment of proved and unproved
properties
and
an
unrealized
(gains)
and
losses
related
to
hedge
ineffectiveness
and
income
or
loss
on
derivative
contracts.
Adjusted
net
income
should
not
be
considered
as
an
alternative
to
net
income
(as
an
indicator
of
operating
performance)
or
as
an
alternative
to
cash
flow
(as
a
measure
of
liquidity
or
ability
to
service
debt
obligations)
and
is
not
in
accordance
with,
nor
superior to, generally accepted accounting principles, but provides additional
information for evaluation of our operating performance. (1)
(2) |
 Standardized Measure
SEC PV-10 Reconciliation to Standardized Measure
(1)
(1)
PV-10% is not a measure of financial or operating performance under
GAAP, nor should it be considered in isolation or as a substitute for the
standardized measure of discounted future net cash flows as defined under
GAAP. (2)
Through two affiliated partnerships.
($ in millions)
1/1/2011
Direct interest in oil and gas reserves:
Present value of estimated future net revenues (PV-10%)
$378.3
Future income taxes at 10%
(101.3)
Standardized measure of discounted future net cash flows
$277.0
Indirect interest in oil and gas reserves:
Present value of estimated future net reserves (PV-10%)
$12.0
Future income taxes at 10%
(4.0)
Standardized measure of discounted future net cash flows
$8.0
31
(2) |
 The disclosures below apply to the contents of this presentation:
In
April
2007,
GeoResources,
Inc.
(“GEOI”
or
the
“Company”)
merged
with
Southern
Bay
Oil
&
Gas,
L.P.
(“Southern
Bay”)
and
a
subsidiary
of
Chandler
Energy,
LLC
and
acquired
certain
oil
and
gas
properties
(collectively,
the
“Merger”).
The
Merger
was
accounted
for
as
a
reverse
acquisition
of
GEOI
by
Southern
Bay.
Therefore,
any
information
prior
to
2007
relates
solely
to
Southern
Bay.
Cautionary
Statement
–
The
SEC
has
established
specific
guidelines
related
to
reserve
disclosures,
including
prices
used
in
calculating
PV
10%
and
the
standardized
measure
of
discounted
future
net
cash
flows.
PV
10%
is
not
a
measure
of
financial
or
operating
performance
under
General
Accepted
Accounting
Principles
(GAAP),
nor
should
it
be
considered
in
isolation
or
as
a
substitute
for
the
standardized
measure
of
discounted
future
net
cash
flows
as
defined
under
GAAP.
In
addition,
alternate
pricing
methodologies,
such
as
the
NYMEX
forward
strip
price
curve,
are
not
provided
for
under
SEC
guidelines
and
therefore
do
represent
GAAP.
PV-10%
is
not
a
measure
of
financial
or
operating
performance
under
GAAP,
nor
should
it
be
considered
in
isolation
or
as
a
substitute
for
the
standardized
measure
of
discounted
future
net
cash
flows
as
defined
under
GAAP.
PV-10
%
for
SEC
price
calculations
are
based
on
the
12-month
unweighted
average
prices
at
year-end
2010
of
$79.43
per
Bbl
for
oil
and
$4.37
per
Mmbtu
for
natural
gas.
These
prices
were
adjusted
for
transportation,
quality,
geographical
differentials,
marketing
bonuses
or
deductions
and
other
factors
affecting
wellhead
prices
received.
For
the
Strip
Price
reserve
case,
five
year
NYMEX
strip
pricing
at
12/30/10
was
utilized
for
2011
–
2015.
NYMEX
oil
strip
ranged
from
$93.85
per
Bbl
to
$92.48
per
Bbl
and
then
constant
thereafter.
NYMEX
gas
strip
ranged
from
$4.59
per
Mmbtu
to
$5.64
per
Mmbtu
and
then
held
constant
thereafter.
These
prices
were
adjusted
for
transportation,
quality,
geographical
differentials,
marketing
bonuses
or
deductions
and
other
factors
affecting
wellhead
prices
received.
Actual
realized
prices
will
likely
vary
materially
from
the
NYMEX
strip.
The
Company’s
independent
engineers
are
Cawley,
Gillespie
&
Associates,
Inc.
BOE
is
defined
as
barrel
of
oil
equivalent,
determined
using
a
ratio
of
six
MCF
of
natural
gas
equal
to
one
barrel
of
oil
equivalent.
IP
(BO/d
or
BOE/d)
(24
hour
rate)
is
defined
as
the
peak
oil
volume
produced
on
a
daily
basis
through
permanent
production
facilities
that
occur
within
the
first
few
days
of
initial
production
from
the
well.
EUR
estimates
do
not
necessarily
represent
reserves
as
defined
under
SEC
rules
and
by
their
nature
and
accordingly
are
more
speculative
and
substantially
less
certain
of
recovery
and
no
discount
or
risk
adjustment
is
included
in
the
presentation.
Actual
locations
drilled
and
quantities
that
may
be
ultimately
recovered
from
the
Company’s
interests
could
differ
substantially.
32
Additional Disclosures
32 |