Attached files
| file | filename |
|---|---|
| EX-99.1 - EX-99.1 - EnergySolutions, Inc. | a11-29448_1ex99d1.htm |
| 8-K - 8-K - EnergySolutions, Inc. | a11-29448_18k.htm |
Exhibit 99.2
|
|
November 8, 2011 |
|
|
This presentation is made in conjunction with the third quarter 2011 conference call which may contain forward-looking statements that involve substantial risks and uncertainties. You can identify forward-looking statements by words such as anticipate, believe, could, estimate, expect, intend, may, plan, should, will, would or similar words. You should consider these statements carefully because they discuss our plans, targets, strategies, prospects and expectations concerning our business, operating results, financial condition and other similar matters. We believe that it is important to communicate our future expectations to our investors. There may be events in the future, however, that we are not able to predict accurately or control. Our actual results may differ materially from the expectations we describe in our forward looking statements. Factors or events that could cause our actual results to materially differ may emerge from time to time, and it is not possible for us to accurately predict all of them. Before you invest in our common stock, you should be aware that the occurrence of any such event could have a material adverse effect on our business, results of operation and financial position. Any forward-looking statement made by us in this presentation speaks only as of the date on which we make it. We undertake no obligation to update or revise any forward-looking statements, whether as a result of new information, future events or otherwise, except as required by law. 2 Forward-looking statements disclaimer |
|
|
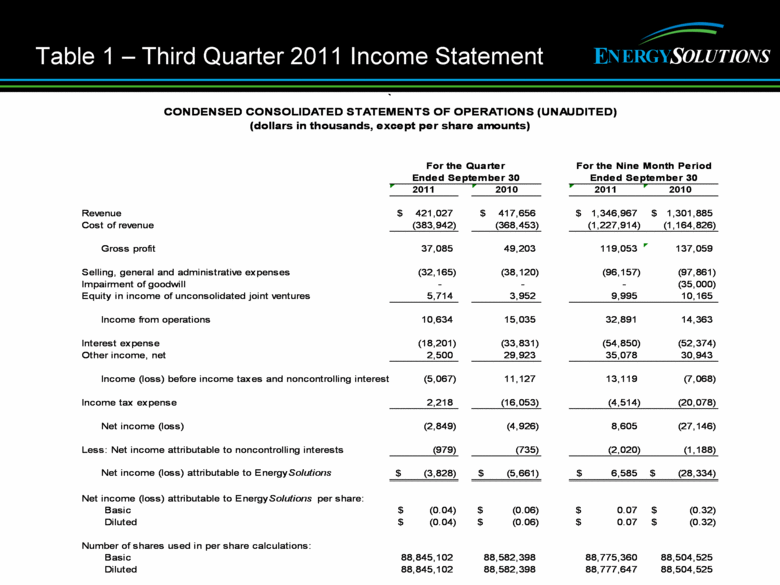
Table 1 – Third Quarter 2011 Income Statement 2011 2010 2011 2010 Revenue 421,027 $ 417,656 $ 1,346,967 $ 1,301,885 $ Cost of revenue (383,942) (368,453) (1,227,914) (1,164,826) Gross profit 37,085 49,203 119,053 137,059 Selling, general and administrative expenses (32,165) (38,120) (96,157) (97,861) Impairment of goodwill - - - (35,000) Equity in income of unconsolidated joint ventures 5,714 3,952 9,995 10,165 Income from operations 10,634 15,035 32,891 14,363 Interest expense (18,201) (33,831) (54,850) (52,374) Other income, net 2,500 29,923 35,078 30,943 Income (loss) before income taxes and noncontrolling interests (5,067) 11,127 13,119 (7,068) Income tax expense 2,218 (16,053) (4,514) (20,078) Net income (loss) (2,849) (4,926) 8,605 (27,146) Less: Net income attributable to noncontrolling interests (979) (735) (2,020) (1,188) Net income (loss) attributable to Energy Solutions (3,828) $ (5,661) $ 6,585 $ (28,334) $ Net income (loss) attributable to Energy Solutions per share: Basic (0.04) $ (0.06) $ 0.07 $ (0.32) $ Diluted (0.04) $ (0.06) $ 0.07 $ (0.32) $ Number of shares used in per share calculations: Basic 88,845,102 88,582,398 88,775,360 88,504,525 Diluted 88,845,102 88,582,398 88,777,647 88,504,525 For the Quarter Ended September 30 ` CONDENSED CONSOLIDATED STATEMENTS OF OPERATIONS (UNAUDITED) (dollars in thousands, except per share amounts) For the Nine Month Period Ended September 30 |
|
|
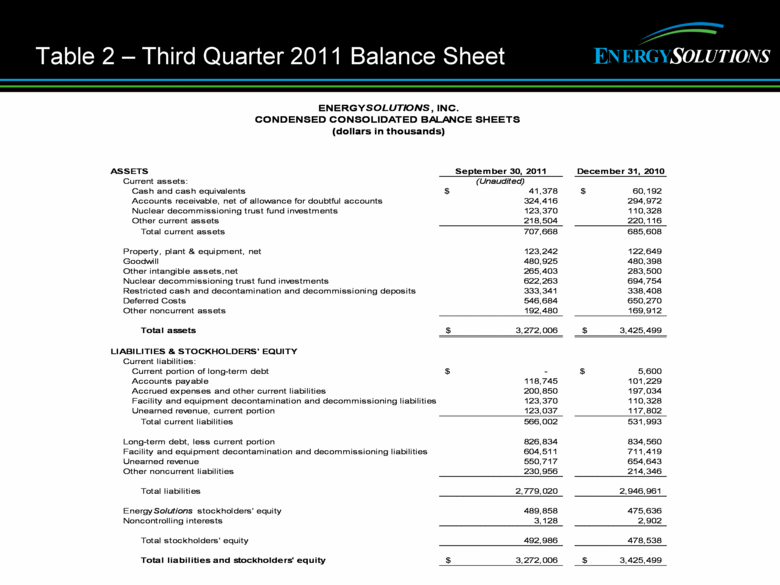
Table 2 – Third Quarter 2011 Balance Sheet ASSETS September 30, 2011 December 31, 2010 Current assets: (Unaudited) Cash and cash equivalents 41,378 $ 60,192 $ Accounts receivable, net of allowance for doubtful accounts 324,416 294,972 Nuclear decommissioning trust fund investments 123,370 110,328 Other current assets 218,504 220,116 Total current assets 707,668 685,608 Property, plant & equipment, net 123,242 122,649 Goodwill 480,925 480,398 Other intangible assets,net 265,403 283,500 Nuclear decommissioning trust fund investments 622,263 694,754 Restricted cash and decontamination and decommissioning deposits 333,341 338,408 Deferred Costs 546,684 650,270 Other noncurrent assets 192,480 169,912 Total assets 3,272,006 $ 3,425,499 $ LIABILITIES & STOCKHOLDERS' EQUITY Current liabilities: Current portion of long-term debt - $ 5,600 $ Accounts payable 118,745 101,229 Accrued expenses and other current liabilities 200,850 197,034 Facility and equipment decontamination and decommissioning liabilities 123,370 110,328 Unearned revenue, current portion 123,037 117,802 Total current liabilities 566,002 531,993 Long-term debt, less current portion 826,834 834,560 Facility and equipment decontamination and decommissioning liabilities 604,511 711,419 Unearned revenue 550,717 654,643 Other noncurrent liabilities 230,956 214,346 Total liabilities 2,779,020 2,946,961 Energy Solutions stockholders' equity 489,858 475,636 Noncontrolling interests 3,128 2,902 Total stockholders' equity 492,986 478,538 Total liabilities and stockholders' equity 3,272,006 $ 3,425,499 $ ENERGY SOLUTIONS , INC. CONDENSED CONSOLIDATED BALANCE SHEETS (dollars in thousands) |
|
|
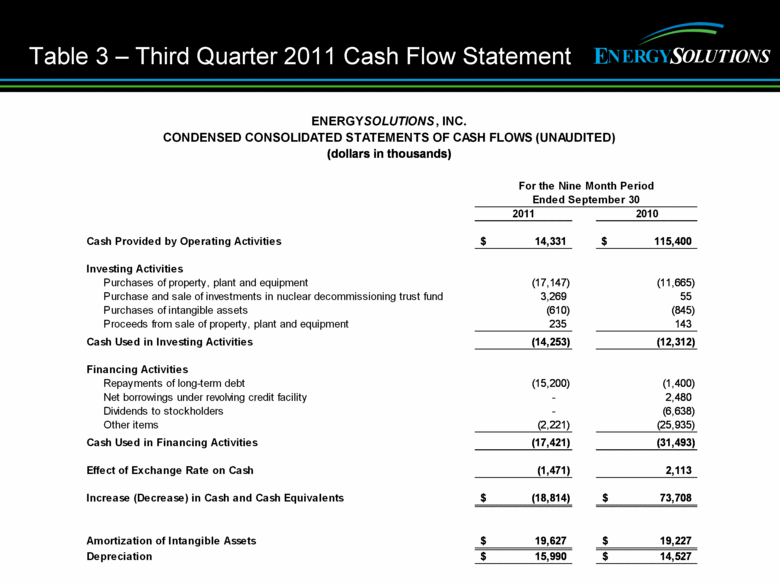
Table 3 – Third Quarter 2011 Cash Flow Statement 2011 2010 Cash Provided by Operating Activities 14,331 $ 115,400 $ Investing Activities Purchases of property, plant and equipment (17,147) (11,665) Purchase and sale of investments in nuclear decommissioning trust fund 3,269 55 Purchases of intangible assets (610) (845) Proceeds from sale of property, plant and equipment 235 143 Cash Used in Investing Activities (14,253) (12,312) Financing Activities Repayments of long-term debt (15,200) (1,400) Net borrowings under revolving credit facility - 2,480 Dividends to stockholders - (6,638) Other items (2,221) (25,935) Cash Used in Financing Activities (17,421) (31,493) Effect of Exchange Rate on Cash (1,471) 2,113 Increase (Decrease) in Cash and Cash Equivalents (18,814) $ 73,708 $ Amortization of Intangible Assets 19,627 $ 19,227 $ Depreciation 15,990 $ 14,527 $ ENERGY SOLUTIONS , INC. Ended September 30 (dollars in thousands) CONDENSED CONSOLIDATED STATEMENTS OF CASH FLOWS (UNAUDITED) For the Nine Month Period |
|
|
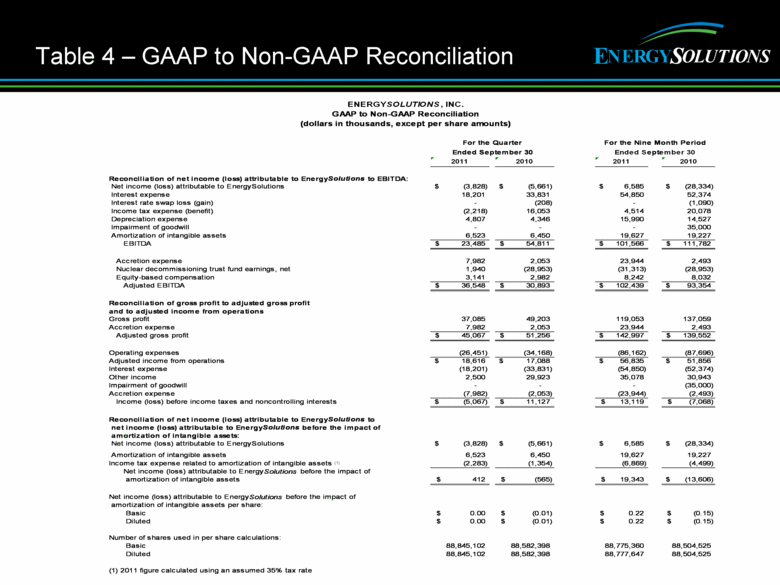
Table 4 – GAAP to Non-GAAP Reconciliation For the Quarter For the Nine Month Period Ended September 30 Ended September 30 2011 2010 2011 2010 Reconciliation of net income (loss) attributable to Energy Solutions to EBITDA: Net income (loss) attributable to EnergySolutions (3,828) $ (5,661) $ 6,585 $ (28,334) $ Interest expense 18,201 33,831 54,850 52,374 Interest rate swap loss (gain) - (208) - (1,090) Income tax expense (benefit) (2,218) 16,053 4,514 20,078 Depreciation expense 4,807 4,346 15,990 14,527 Impairment of goodwill - - - 35,000 Amortization of intangible assets 6,523 6,450 19,627 19,227 EBITDA 23,485 $ 54,811 $ 101,566 $ 111,782 $ Accretion expense 7,982 2,053 23,944 2,493 Nuclear decommissioning trust fund earnings, net 1,940 (28,953) (31,313) (28,953) Equity-based compensation 3,141 2,982 8,242 8,032 Adjusted EBITDA 36,548 $ 30,893 $ 102,439 $ 93,354 $ Reconciliation of gross profit to adjusted gross profit and to adjusted income from operations Gross profit 37,085 49,203 119,053 137,059 Accretion expense 7,982 2,053 23,944 2,493 Adjusted gross profit 45,067 $ 51,256 $ 142,997 $ 139,552 $ Operating expenses (26,451) (34,168) (86,162) (87,696) Adjusted income from operations 18,616 $ 17,088 $ 56,835 $ 51,856 $ Interest expense (18,201) (33,831) (54,850) (52,374) Other income 2,500 29,923 35,078 30,943 Impairment of goodwill - - - (35,000) Accretion expense (7,982) (2,053) (23,944) (2,493) Income (loss) before income taxes and noncontrolling interests (5,067) $ 11,127 $ 13,119 $ (7,068) $ Reconciliation of net income (loss) attributable to Energy Solutions to net income (loss) attributable to Energy Solutions before the impact of amortization of intangible assets: Net income (loss) attributable to EnergySolutions (3,828) $ (5,661) $ 6,585 $ (28,334) $ Amortization of intangible assets 6,523 6,450 19,627 19,227 Income tax expense related to amortization of intangible assets (1) (2,283) (1,354) (6,869) (4,499) Net income (loss) attributable to Energy Solutions before the impact of amortization of intangible assets 412 $ (565) $ 19,343 $ (13,606) $ Net income (loss) attributable to Energy Solutions before the impact of amortization of intangible assets per share: Basic 0.00 $ (0.01) $ 0.22 $ (0.15) $ Diluted 0.00 $ (0.01) $ 0.22 $ (0.15) $ Number of shares used in per share calculations: Basic 88,845,102 88,582,398 88,775,360 88,504,525 Diluted 88,845,102 88,582,398 88,777,647 88,504,525 (1) 2011 figure calculated using an assumed 35% tax rate ENERGY SOLUTIONS , INC. GAAP to Non-GAAP Reconciliation (dollars in thousands, except per share amounts) |
|
|
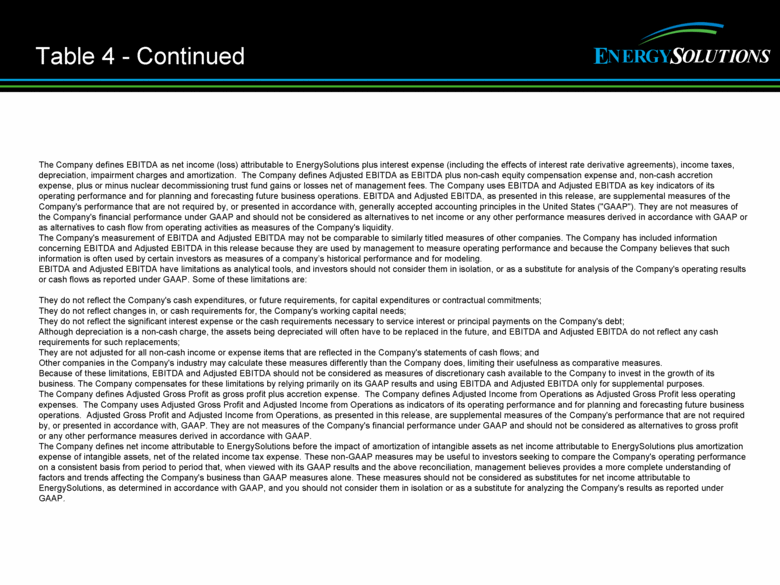
Table 4 - Continued The Company defines EBITDA as net income (loss) attributable to EnergySolutions plus interest expense (including the effects of interest rate derivative agreements), income taxes, depreciation, impairment charges and amortization. The Company defines Adjusted EBITDA as EBITDA plus non-cash equity compensation expense and, non-cash accretion expense, plus or minus nuclear decommissioning trust fund gains or losses net of management fees. The Company uses EBITDA and Adjusted EBITDA as key indicators of its operating performance and for planning and forecasting future business operations. EBITDA and Adjusted EBITDA, as presented in this release, are supplemental measures of the Company's performance that are not required by, or presented in accordance with, generally accepted accounting principles in the United States ("GAAP"). They are not measures of the Company's financial performance under GAAP and should not be considered as alternatives to net income or any other performance measures derived in accordance with GAAP or as alternatives to cash flow from operating activities as measures of the Company's liquidity. The Company's measurement of EBITDA and Adjusted EBITDA may not be comparable to similarly titled measures of other companies. The Company has included information concerning EBITDA and Adjusted EBITDA in this release because they are used by management to measure operating performance and because the Company believes that such information is often used by certain investors as measures of a company’s historical performance and for modeling. EBITDA and Adjusted EBITDA have limitations as analytical tools, and investors should not consider them in isolation, or as a substitute for analysis of the Company's operating results or cash flows as reported under GAAP. Some of these limitations are: They do not reflect the Company's cash expenditures, or future requirements, for capital expenditures or contractual commitments; They do not reflect changes in, or cash requirements for, the Company's working capital needs; They do not reflect the significant interest expense or the cash requirements necessary to service interest or principal payments on the Company's debt; Although depreciation is a non-cash charge, the assets being depreciated will often have to be replaced in the future, and EBITDA and Adjusted EBITDA do not reflect any cash requirements for such replacements; They are not adjusted for all non-cash income or expense items that are reflected in the Company's statements of cash flows; and Other companies in the Company's industry may calculate these measures differently than the Company does, limiting their usefulness as comparative measures. Because of these limitations, EBITDA and Adjusted EBITDA should not be considered as measures of discretionary cash available to the Company to invest in the growth of its business. The Company compensates for these limitations by relying primarily on its GAAP results and using EBITDA and Adjusted EBITDA only for supplemental purposes. The Company defines Adjusted Gross Profit as gross profit plus accretion expense. The Company defines Adjusted Income from Operations as Adjusted Gross Profit less operating expenses. The Company uses Adjusted Gross Profit and Adjusted Income from Operations as indicators of its operating performance and for planning and forecasting future business operations. Adjusted Gross Profit and Adjusted Income from Operations, as presented in this release, are supplemental measures of the Company's performance that are not required by, or presented in accordance with, GAAP. They are not measures of the Company's financial performance under GAAP and should not be considered as alternatives to gross profit or any other performance measures derived in accordance with GAAP. The Company defines net income attributable to EnergySolutions before the impact of amortization of intangible assets as net income attributable to EnergySolutions plus amortization expense of intangible assets, net of the related income tax expense. These non-GAAP measures may be useful to investors seeking to compare the Company's operating performance on a consistent basis from period to period that, when viewed with its GAAP results and the above reconciliation, management believes provides a more complete understanding of factors and trends affecting the Company's business than GAAP measures alone. These measures should not be considered as substitutes for net income attributable to EnergySolutions, as determined in accordance with GAAP, and you should not consider them in isolation or as a substitute for analyzing the Company's results as reported under GAAP. |
|
|
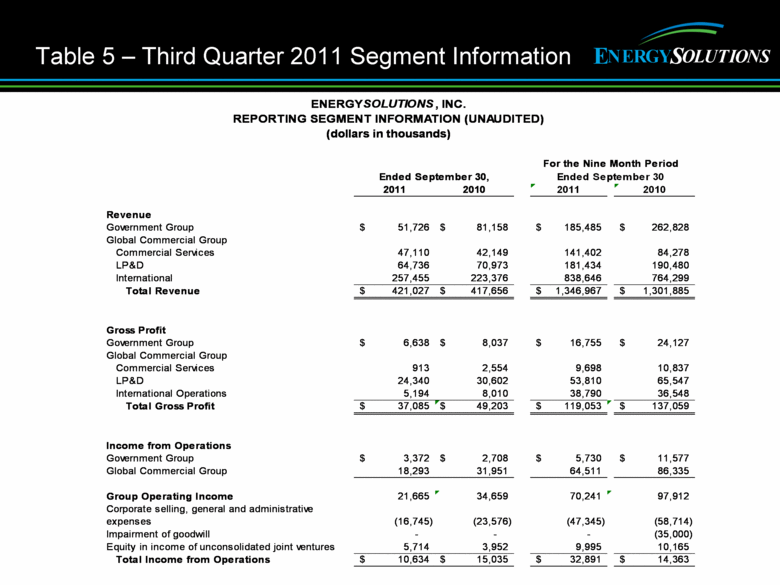
Table 5 – Third Quarter 2011 Segment Information For the Nine Month Period Ended September 30 2011 2010 2011 2010 Revenue Government Group 51,726 $ 81,158 $ 185,485 $ 262,828 $ Global Commercial Group Commercial Services 47,110 42,149 141,402 84,278 LP&D 64,736 70,973 181,434 190,480 International 257,455 223,376 838,646 764,299 Total Revenue 421,027 $ 417,656 $ 1,346,967 $ 1,301,885 $ Gross Profit Government Group 6,638 $ 8,037 $ 16,755 $ 24,127 $ Global Commercial Group Commercial Services 913 2,554 9,698 10,837 LP&D 24,340 30,602 53,810 65,547 International Operations 5,194 8,010 38,790 36,548 Total Gross Profit 37,085 $ 49,203 $ 119,053 $ 137,059 $ Income from Operations Government Group 3,372 $ 2,708 $ 5,730 $ 11,577 $ Global Commercial Group 18,293 31,951 64,511 86,335 Group Operating Income 21,665 34,659 70,241 97,912 Corporate selling, general and administrative expenses (16,745) (23,576) (47,345) (58,714) Impairment of goodwill - - - (35,000) Equity in income of unconsolidated joint ventures 5,714 3,952 9,995 10,165 Total Income from Operations 10,634 $ 15,035 $ 32,891 $ 14,363 $ Ended September 30, ENERGY SOLUTIONS , INC. REPORTING SEGMENT INFORMATION (UNAUDITED) (dollars in thousands) |
|
|
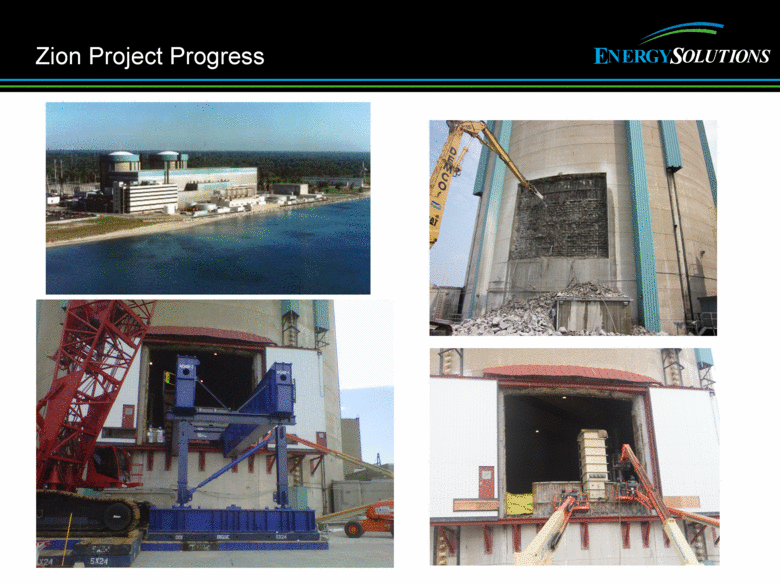
Zion Project Progress |
|
|
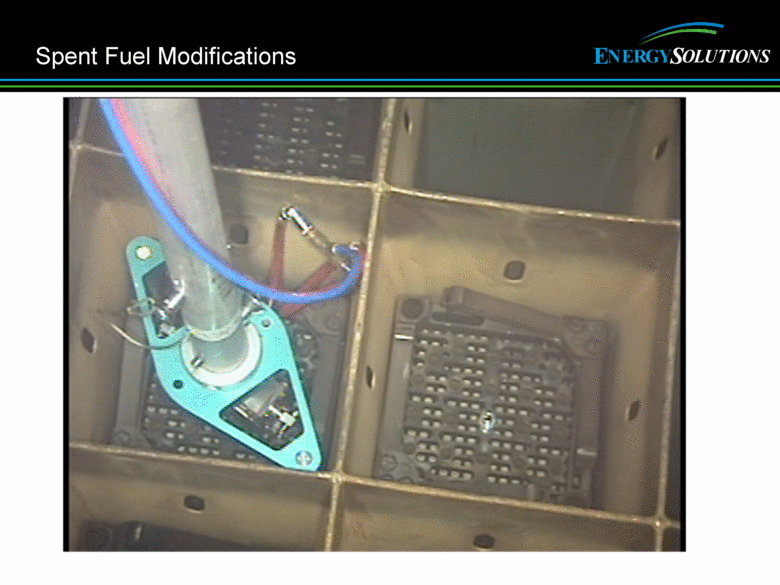
Spent Fuel Modifications |
|
|
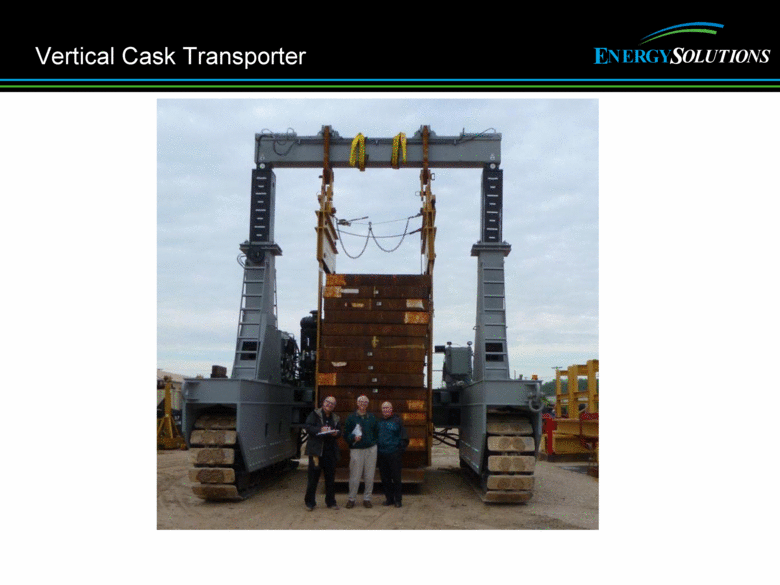
Vertical Cask Transporter |
|
|
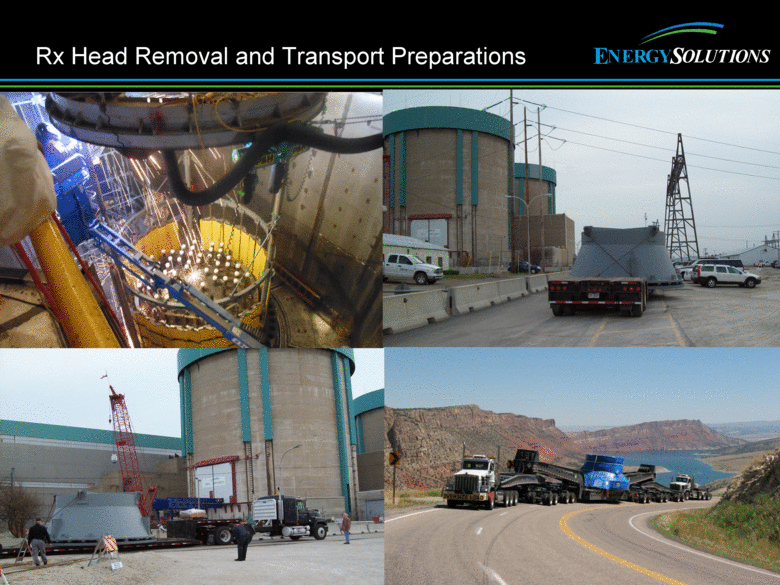
Rx Head Removal and Transport Preparations |
|
|
[LOGO] |

