Attached files
| file | filename |
|---|---|
| 8-K - 8-K - KAPSTONE PAPER & PACKAGING CORP | a11-28686_18k.htm |
| EX-99.1 - EX-99.1 - KAPSTONE PAPER & PACKAGING CORP | a11-28686_1ex99d1.htm |
Exhibit 99.2
|
|
Third Quarter 2011 Financial Highlights Roger W. Stone Chairman and Chief Executive Officer Andrea K. Tarbox Vice President and Chief Financial Officer November 2, 2011 |
|
|
Forward Looking Statements The information in this presentation and statements made during this presentation may contain certain forward-looking statements within the meaning of federal securities laws. These statements reflect management’s expectations regarding future events and operating performance. These forward-looking statements involve a number of risks and uncertainties. A list of the factors that could cause actual results to differ materially from those expressed in, or underlying, any forward-looking statements can be found in the Company’s filings with the Securities and Exchange Commission, such as its annual and quarterly reports. The Company disclaims any obligation to revise or update such statements to reflect the occurrence of events after the date of this presentation. This presentation refers to non-U.S. GAAP financial information. For a reconciliation to U.S. GAAP financial measures, please refer to the appendix. Forward-Looking Statements Non-GAAP Financial Measures Risk Factors 2 |
|
|
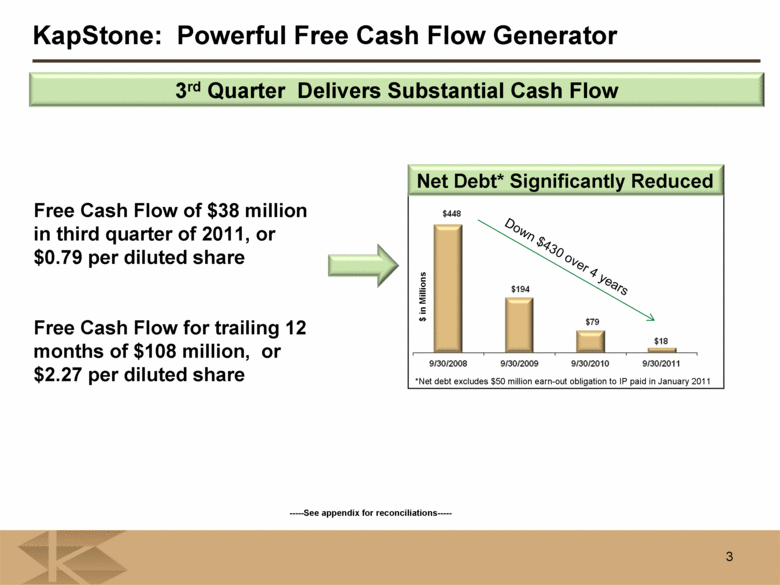
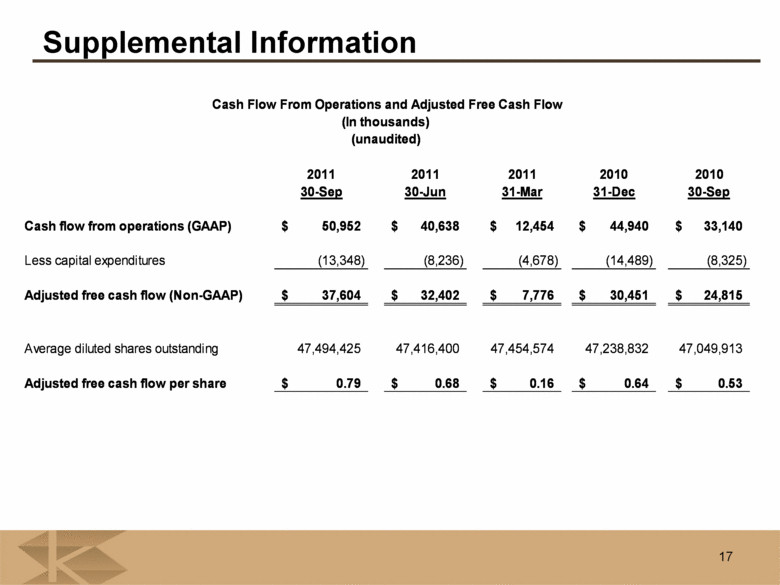
3 Net Debt* Significantly Reduced -See appendix for reconciliations- KapStone: Powerful Free Cash Flow Generator $ in Millions Free Cash Flow of $38 million in third quarter of 2011, or $0.79 per diluted share Free Cash Flow for trailing 12 months of $108 million, or $2.27 per diluted share 3rd Quarter Delivers Substantial Cash Flow Down $430 over 4 years *Net debt excludes $50 million earn-out obligation to IP paid in January 2011 |
|
|
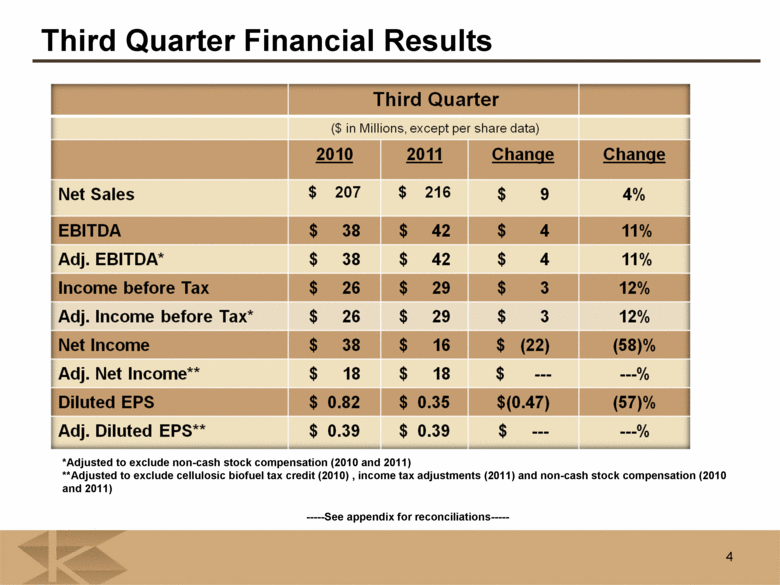
Third Quarter Financial Results *Adjusted to exclude non-cash stock compensation (2010 and 2011) **Adjusted to exclude cellulosic biofuel tax credit (2010) , income tax adjustments (2011) and non-cash stock compensation (2010 and 2011) -See appendix for reconciliations- 4 |
|
|
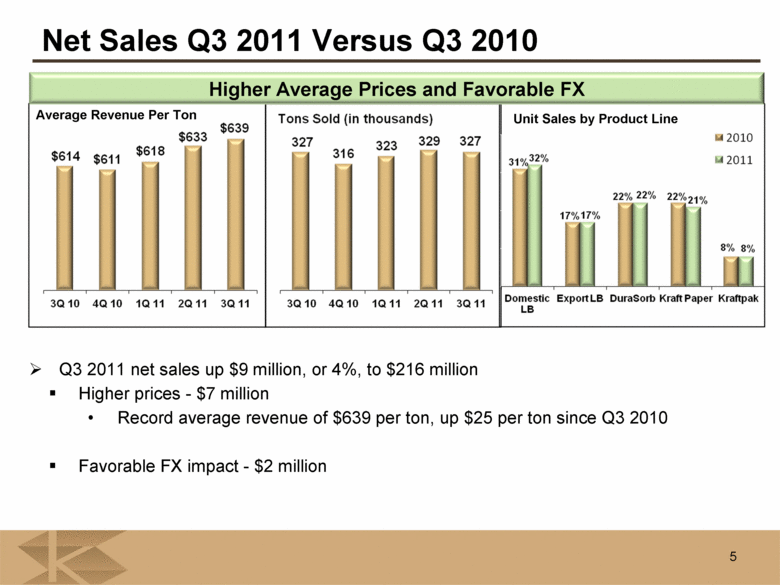
Net Sales Q3 2011 Versus Q3 2010 Q3 2011 net sales up $9 million, or 4%, to $216 million Higher prices - $7 million Record average revenue of $639 per ton, up $25 per ton since Q3 2010 Favorable FX impact - $2 million Higher Average Prices and Favorable FX 5 Average Revenue Per Ton Unit Sales by Product Line |
|
|
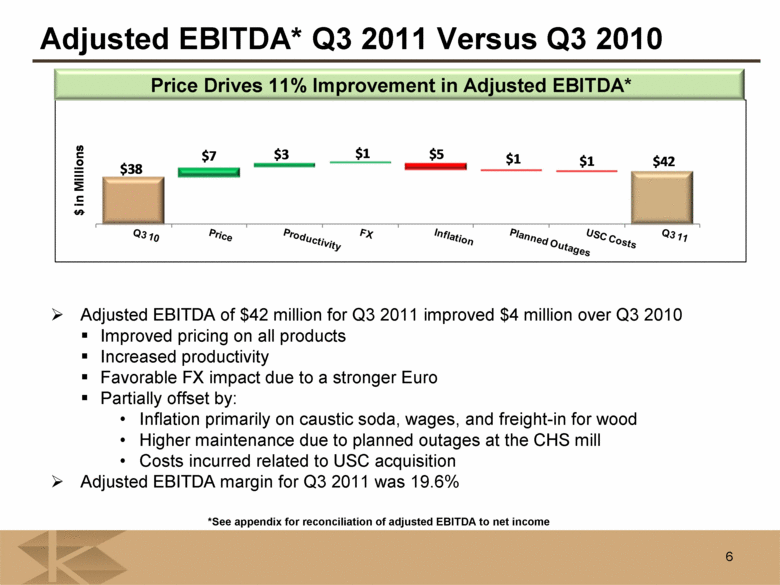
Adjusted EBITDA* Q3 2011 Versus Q3 2010 *See appendix for reconciliation of adjusted EBITDA to net income Adjusted EBITDA of $42 million for Q3 2011 improved $4 million over Q3 2010 Improved pricing on all products Increased productivity Favorable FX impact due to a stronger Euro Partially offset by: Inflation primarily on caustic soda, wages, and freight-in for wood Higher maintenance due to planned outages at the CHS mill Costs incurred related to USC acquisition Adjusted EBITDA margin for Q3 2011 was 19.6% Price Drives 11% Improvement in Adjusted EBITDA* 6 $38 $7 $3 $1 $5 $1 $1 $42 $ in Millions |
|
|
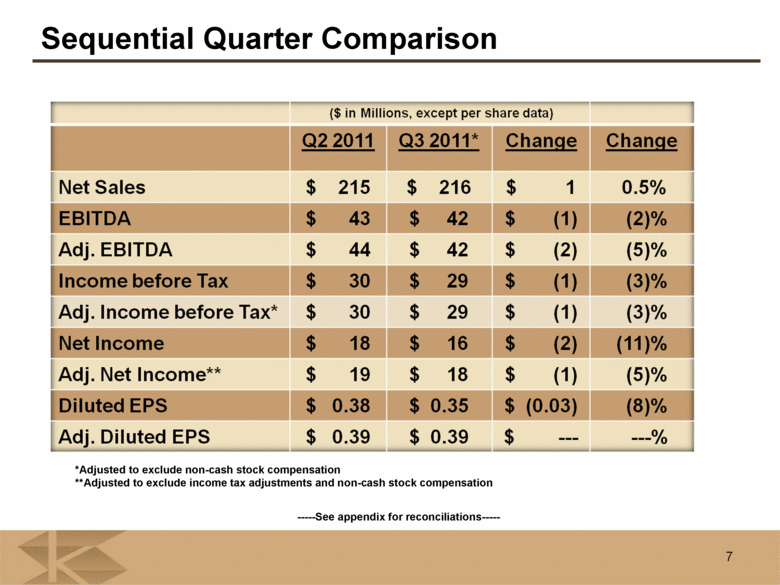
Sequential Quarter Comparison -See appendix for reconciliations- *Adjusted to exclude non-cash stock compensation **Adjusted to exclude income tax adjustments and non-cash stock compensation 7 |
|
|
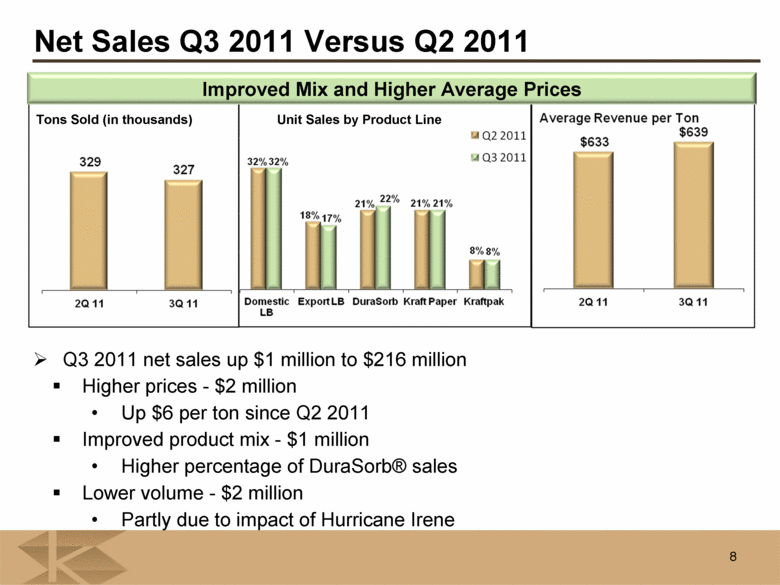
Net Sales Q3 2011 Versus Q2 2011 Q3 2011 net sales up $1 million to $216 million Higher prices - $2 million Up $6 per ton since Q2 2011 Improved product mix - $1 million Higher percentage of DuraSorb® sales Lower volume - $2 million Partly due to impact of Hurricane Irene Improved Mix and Higher Average Prices 8 Tons Sold (in thousands) Unit Sales by Product Line |
|
|
Adjusted EBITDA* Q3 2011 Versus Q2 2011 *See appendix for reconciliation of adjusted EBITDA to net income Adjusted EBITDA* Decreases to $42 Million Adjusted EBITDA decreased $2 million in Q3 2011 to $42 million Higher maintenance costs due to planned outages at Charleston Inflation on caustic soda and energy costs Currency transaction losses due to a stronger US Dollar USC acquisition costs Partially offset by higher prices and improved mix 9 $1 $1 $1 $44 $2 $1 $2 $42 2Q 11 Price Mix Maintenance Inflation FX USC Costs 3Q 11 $ in Millions |
|
|
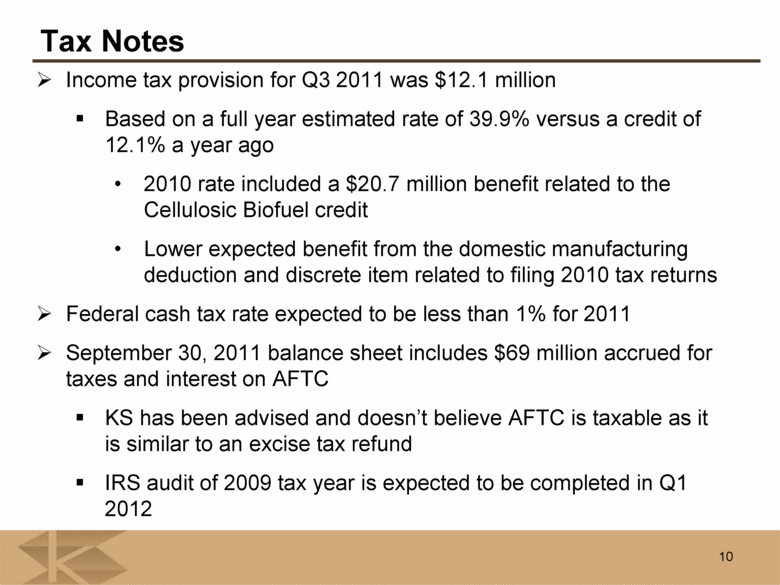
Income tax provision for Q3 2011 was $12.1 million Based on a full year estimated rate of 39.9% versus a credit of 12.1% a year ago 2010 rate included a $20.7 million benefit related to the Cellulosic Biofuel credit Lower expected benefit from the domestic manufacturing deduction and discrete item related to filing 2010 tax returns Federal cash tax rate expected to be less than 1% for 2011 September 30, 2011 balance sheet includes $69 million accrued for taxes and interest on AFTC KS has been advised and doesn’t believe AFTC is taxable as it is similar to an excise tax refund IRS audit of 2009 tax year is expected to be completed in Q1 2012 Tax Notes 10 |
|
|
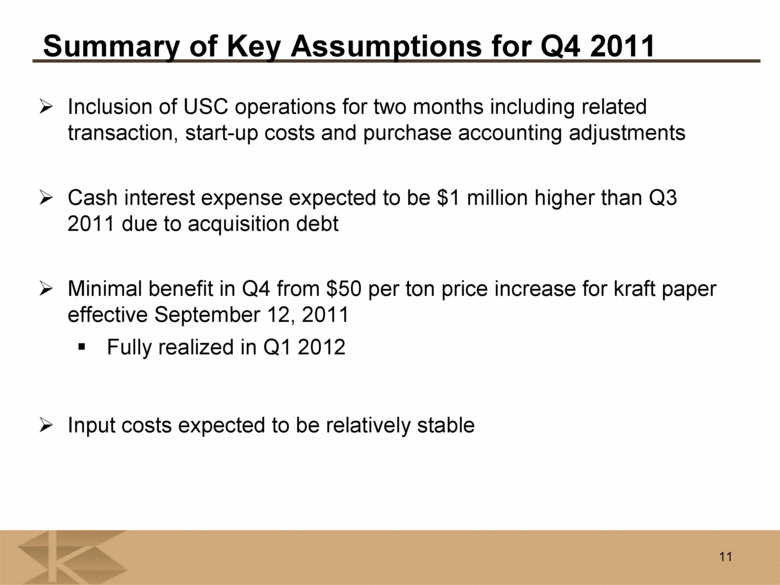
Summary of Key Assumptions for Q4 2011 Inclusion of USC operations for two months including related transaction, and start-up costs and purchase accounting adjustments Cash interest expense expected to be $1 million higher than Q3 2011 due to acquisition debt Minimal benefit in Q4 from $50 per ton price increase for kraft paper effective September 12, 2011 Fully realized in Q1 2012 Input costs expected to be relatively stable 11 |
|
|
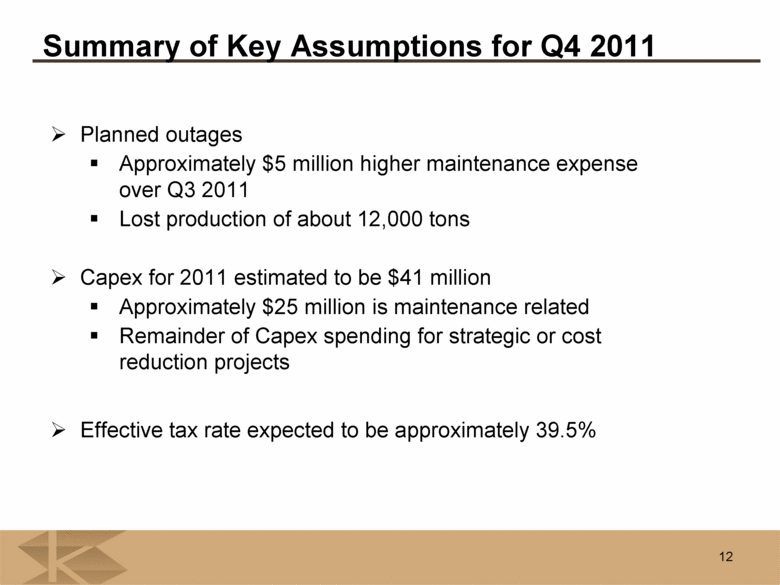
Summary of Key Assumptions for Q4 2011 Planned outages Approximately $5 million higher maintenance expense over Q3 2011 Lost production of about 12,000 tons Capex for 2011 estimated to be $41 million Approximately $25 million is maintenance related Remainder of Capex spending for strategic or cost reduction projects Effective tax rate expected to be approximately 39.5% 12 |
|
|
APPENDIX |
|
|
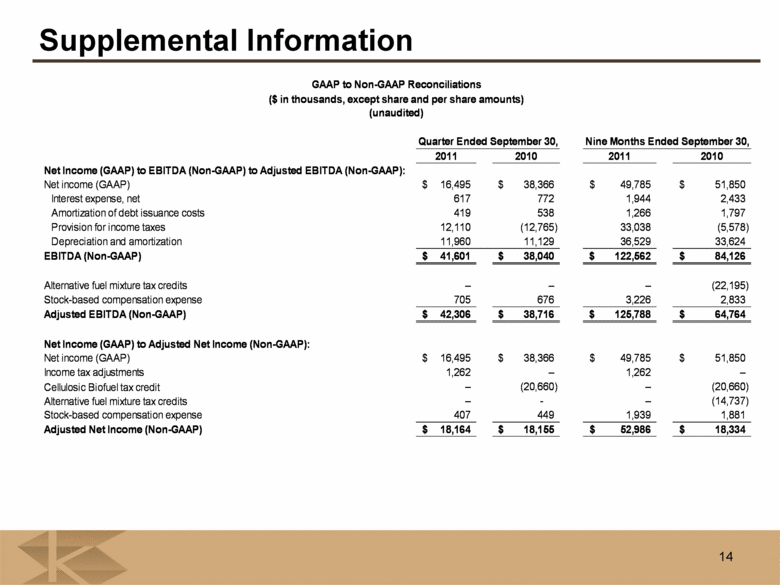
14 Supplemental Information 2011 2010 2011 2010 Net Income (GAAP) to EBITDA (Non-GAAP) to Adjusted EBITDA (Non-GAAP): Net income (GAAP) 16,495 $ 38,366 $ 49,785 $ 51,850 $ Interest expense, net 617 772 1,944 2,433 Amortization of debt issuance costs 419 538 1,266 1,797 Provision for income taxes 12,110 (12,765) 33,038 (5,578) Depreciation and amortization 11,960 11,129 36,529 33,624 EBITDA (Non-GAAP) 41,601 $ 38,040 $ 122,562 $ 84,126 $ Alternative fuel mixture tax credits – – – (22,195) Stock-based compensation expense 705 676 3,226 2,833 Adjusted EBITDA (Non-GAAP) 42,306 $ 38,716 $ 125,788 $ 64,764 $ Net Income (GAAP) to Adjusted Net Income (Non-GAAP): Net income (GAAP) 16,495 $ 38,366 $ 49,785 $ 51,850 $ Income tax adjustments 1,262 – 1,262 – Cellulosic Biofuel tax credit – (20,660) – (20,660) Alternative fuel mixture tax credits – - – (14,737) Stock-based compensation expense 407 449 1,939 1,881 Adjusted Net Income (Non-GAAP) 18,164 $ 18,155 $ 52,986 $ 18,334 $ Nine Months Ended September 30, GAAP to Non-GAAP Reconciliations ($ in thousands, except share and per share amounts) (unaudited) Quarter Ended September 30, |
|
|
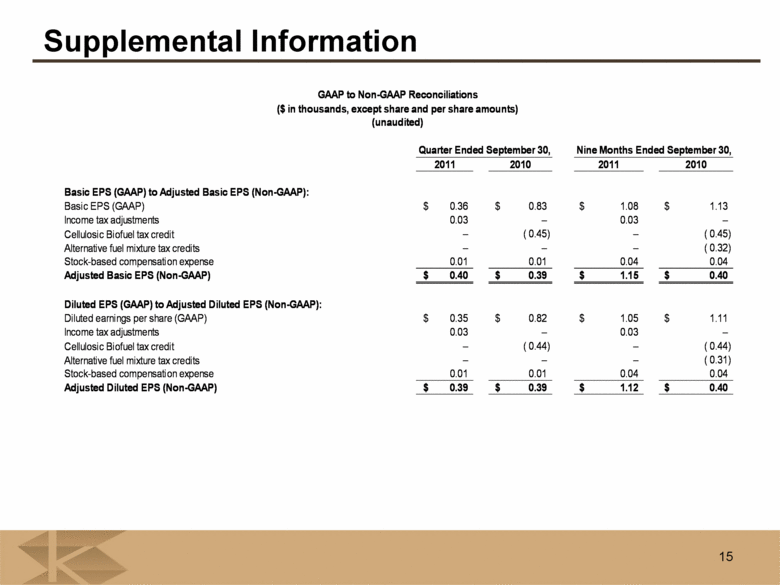
15 Supplemental Information 2011 2010 2011 2010 Basic EPS (GAAP) to Adjusted Basic EPS (Non-GAAP): Basic EPS (GAAP) 0.36 $ 0.83 $ 1.08 $ 1.13 $ Income tax adjustments 0.03 – 0.03 – Cellulosic Biofuel tax credit – ( 0.45) – ( 0.45) Alternative fuel mixture tax credits – – – ( 0.32) Stock-based compensation expense 0.01 0.01 0.04 0.04 Adjusted Basic EPS (Non-GAAP) 0.40 $ 0.39 $ 1.15 $ 0.40 $ Diluted EPS (GAAP) to Adjusted Diluted EPS (Non-GAAP): Diluted earnings per share (GAAP) 0.35 $ 0.82 $ 1.05 $ 1.11 $ Income tax adjustments 0.03 – 0.03 – Cellulosic Biofuel tax credit – ( 0.44) – ( 0.44) Alternative fuel mixture tax credits – – – ( 0.31) Stock-based compensation expense 0.01 0.01 0.04 0.04 Adjusted Diluted EPS (Non-GAAP) 0.39 $ 0.39 $ 1.12 $ 0.40 $ Nine Months Ended September 30, GAAP to Non-GAAP Reconciliations ($ in thousands, except share and per share amounts) (unaudited) Quarter Ended September 30, |
|
|
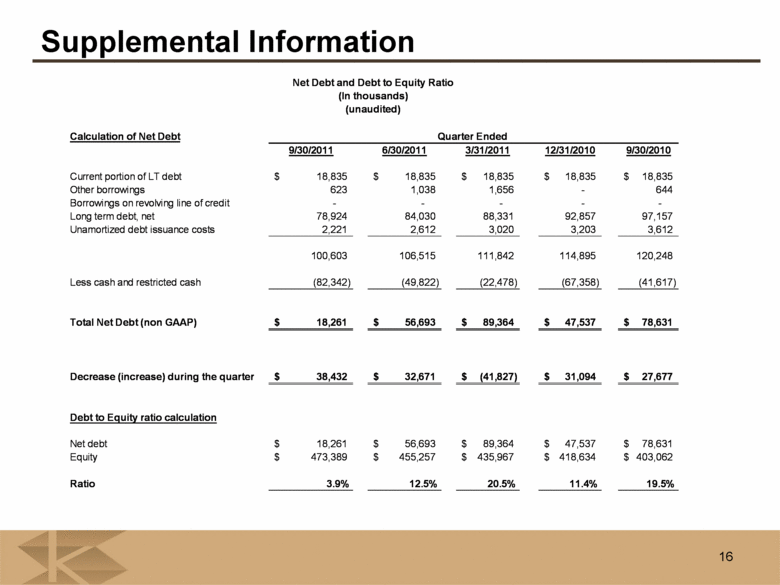
16 Supplemental Information Calculation of Net Debt 9/30/2011 6/30/2011 3/31/2011 12/31/2010 9/30/2010 Current portion of LT debt 18,835 $ 18,835 $ 18,835 $ 18,835 $ 18,835 $ Other borrowings 623 1,038 1,656 - 644 Borrowings on revolving line of credit – – – – - Long term debt, net 78,924 84,030 88,331 92,857 97,157 Unamortized debt issuance costs 2,221 2,612 3,020 3,203 3,612 100,603 106,515 111,842 114,895 120,248 Less cash and restricted cash (82,342) (49,822) (22,478) (67,358) (41,617) Total Net Debt (non GAAP) 18,261 $ 56,693 $ 89,364 $ 47,537 $ 78,631 $ Decrease (increase) during the quarter 38,432 $ 32,671 $ (41,827) $ 31,094 $ 27,677 $ Debt to Equity ratio calculation Net debt 18,261 $ 56,693 $ 89,364 $ 47,537 $ 78,631 $ Equity 473,389 $ 455,257 $ 435,967 $ 418,634 $ 403,062 $ Ratio 3.9% 12.5% 20.5% 11.4% 19.5% Quarter Ended Net Debt and Debt to Equity Ratio (unaudited) (In thousands) |
|
|
17 Supplemental Information 2011 2011 2011 2010 2010 30-Sep 30-Jun 31-Mar 31-Dec 30-Sep Cash flow from operations (GAAP) 50,952 $ 40,638 $ 12,454 $ 44,940 $ 33,140 $ Less capital expenditures (13,348) (8,236) (4,678) (14,489) (8,325) Adjusted free cash flow (Non-GAAP) 37,604 $ 32,402 $ 7,776 $ 30,451 $ 24,815 $ Average diluted shares outstanding 47,494,425 47,416,400 47,454,574 47,238,832 47,049,913 Adjusted free cash flow per share 0.79 $ 0.68 $ 0.16 $ 0.64 $ 0.53 $ Cash Flow From Operations and Adjusted Free Cash Flow (In thousands) (unaudited) |

