Attached files
| file | filename |
|---|---|
| 8-K - FORM 8-K - PUBLIC SERVICE ELECTRIC & GAS CO | d249294d8k.htm |
| EX-99 - PRESS RELEASE - PUBLIC SERVICE ELECTRIC & GAS CO | d249294dex99.htm |
 Public Service Enterprise Group
PSEG Earnings Conference Call
3
rd
Quarter 2011
November 1, 2011
EXHIBIT 99.1 |
| 1
Forward-Looking Statement
Readers are cautioned that statements contained in this presentation about our and our subsidiaries'
future performance, including future revenues, earnings, strategies, prospects, consequences and
all other statements that are not purely historical, are forward-looking statements for purposes of the safe harbor
provisions under The Private Securities Litigation Reform Act of 1995. When used herein, the
words “will”, “anticipate”, “intend”, “estimate”, “believe”, “expect”,
“plan”, “should”, “hypothetical”, “potential”,
“forecast”, “project”, variations of such words and similar expressions are intended to identify forward-looking
statements. Although we believe that our expectations are based on reasonable assumptions, they
are subject to risks and uncertainties and we can give no assurance they will be
achieved. The results or developments projected or predicted in these statements may differ materially from what may actually occur.
Factors which could cause results or events to differ from current expectations include, but are not
limited to: • adverse changes in energy industry law, policies and regulation, including market structures
and a potential shift away from competitive markets toward subsidized market mechanisms,
transmission planning and cost allocation rules, including rules regarding how transmission is planned and who is permitted to build
transmission in the future, and reliability standards,
• any inability of our transmission and distribution businesses to obtain adequate and timely
rate relief and regulatory approvals from federal and state regulators,
• changes in federal and state environmental regulations that could increase our costs or limit
our operations, • changes in nuclear regulation and/or general developments in the nuclear power industry,
including various impacts from any accidents or incidents experienced at our facilities or by
others in the industry that could limit operations of our nuclear generating units,
• actions or activities at one of our nuclear units located on a multi-unit site that might
adversely affect our ability to continue to operate that unit or other units located at the
same site, • any inability to balance our energy obligations, available supply and trading risks,
• any deterioration in our credit quality, or the credit quality of our counterparties, including
in our leveraged leases, • availability of capital and credit at commercially reasonable terms and conditions and our
ability to meet cash needs, • any inability to realize anticipated tax benefits or retain tax credits,
• changes in the cost of, or interruption in the supply of, fuel and other commodities necessary
to the operation of our generating units, • delays in receipt of necessary permits and approvals for our construction and development
activities, • delays or unforeseen cost escalations in our construction and development activities,
• adverse changes in the demand for or price of the capacity and energy that we sell into
wholesale electricity markets, • increase in competition in energy markets in which we compete,
• challenges associated with recruitment and/or retention of a qualified workforce,
• adverse performance of our decommissioning and defined benefit plan trust fund investments and
changes in discount rates and funding requirements, and • changes in technology and customer usage patterns.
For further information, please refer to our Annual Report on Form 10-K, including Item 1A. Risk
Factors, and subsequent reports on Form 10-Q and Form 8-K filed with the Securities and
Exchange Commission. These documents address in further detail our business, industry issues and other factors that could
cause actual results to differ materially from those indicated in this presentation. In
addition, any forward-looking statements included herein represent our estimates only
as of today and should not be relied upon as representing our estimates as of any subsequent date. While we may elect to update forward-
looking statements from time to time, we specifically disclaim any obligation to do so, even if our
internal estimates change, unless otherwise required by applicable securities laws. |
| 2
GAAP Disclaimer
PSEG presents Operating Earnings in addition to its Net Income reported in
accordance with accounting principles generally accepted in the United
States (GAAP). Operating Earnings is a non-GAAP financial measure that
differs from Net Income because it excludes gains or losses associated with
Nuclear Decommissioning Trust (NDT), Mark-to-Market (MTM) accounting,
and other material one-time items. PSEG presents Operating Earnings
because management believes that it is appropriate for investors
to
consider results excluding these items in addition to the results reported in
accordance with GAAP. PSEG believes that the non-GAAP financial
measure of Operating Earnings provides a consistent and comparable
measure of performance of its businesses to help shareholders understand
performance trends.
This information is not
intended to be viewed as an
alternative to GAAP information. The last two slides in this presentation
include a list of items excluded from Income from Continuing Operations to
reconcile to Operating Earnings, with a reference to that slide included on
each of the slides where the non-GAAP information appears.
|
 PSEG
2011 Q3 Review
Ralph Izzo
Chairman, President and Chief Executive Officer |
 4
Q3 2011 Earnings Summary
20
29
Discontinued Operations, Net of Tax
$ 1.03
$ 0.83
EPS from Operating Earnings*
$ 567
$ 294
Net Income
547
265
Income from Continuing Operations
26
(155)
Reconciling Items, Net of Tax
$ 521
$ 420
Operating Earnings
2010
2011
$ millions (except EPS)
Quarter Ended September 30
* See page 37 for Items excluded from Income from Continuing Operations to
reconcile to Operating Earnings. |
 5
YTD Earnings Summary
15
96
Discontinued Operations, Net of Tax
$ 2.53
$ 2.27
EPS from Operating Earnings*
$ 1,282
$ 1,143
Net Income
1,267
1,047
Income from Continuing Operations
(14)
(105)
Reconciling Items, Net of Tax
$ 1,281
$ 1,152
Operating Earnings
2010
2011
$ millions (except EPS)
Nine Months Ended September 30
* See page 37 for Items excluded from Income from Continuing Operations to
reconcile to Operating Earnings. |
 6
PSEG –
Q3 2011: Company Execution Strong in Quarter
Q3 2011 results
Solid Q3 operating earnings per share of $0.83 versus
$1.03 in Q3 2010, despite considerable challenges
Hurricane Irene was the worst storm in company history; caused
service interruptions to over 800,000 customers throughout NJ
Fuel flexibility and active coal management
Continued focus on operational goals
Market conditions
EPA air requirements expected to influence markets
NJBPU continued hearings on need for additional subsidized capacity
Federal
district
court
will
allow
PSEG’s
LCAPP
suit
to
proceed
(denied BPU’s motion to dismiss on October 19)
Company position continues to receive recognition
2011 Dow Jones Sustainability Index -
World Index
Leveraged lease reserve
Energy
Holdings
fully
reserved
its
$264
million
gross
investment
in
a
lease receivable from Dynegy resulting in an after-tax charge of
$170 million, or $0.34 per share |
 Over
6,000 PSEG employees supported restoration efforts in the aftermath of
Hurricane Irene |
 8
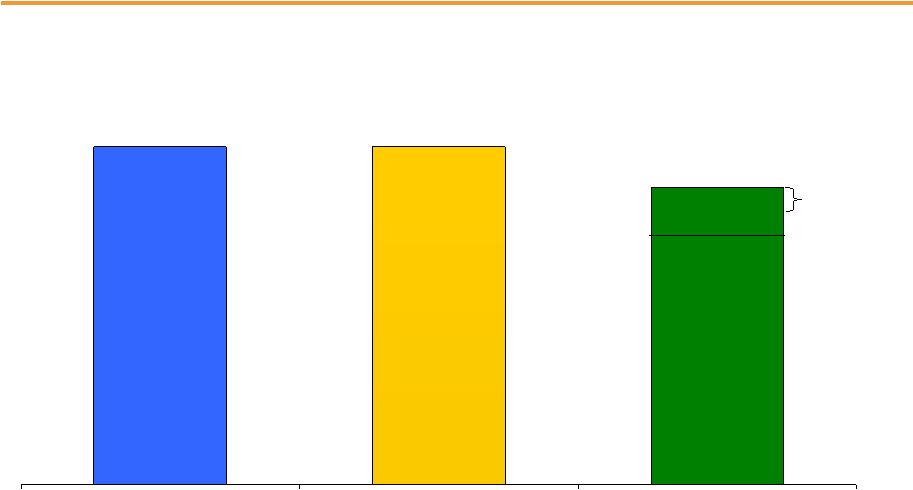
2009 Operating Earnings*
2010 Operating Earnings*
2011 Guidance
$2.50 -
$2.75E
PSEG –
Maintaining 2011 EPS Guidance
$3.09
* See page 38 for Items excluded from Income from Continuing Operations to
reconcile to Operating Earnings.
$3.12
$2.27
EPS
YTD
Actual
$2.75
to
$2.50
Strong 9-month results support full-year 2011 EPS at upper end of
guidance. |
 PSEG
2011 Q3 Operating Company Review
Caroline Dorsa
Executive Vice President and Chief Financial Officer |
 10
Q3 Operating Earnings by Subsidiary
$ 521
4
24
155
$ 338
2010
$ 420
4
4
154
$ 258
2011
Operating Earnings
Earnings per Share
0.01
0.01
Enterprise
$ 1.03
$ 0.83
Operating Earnings*
0.05
0.01
PSEG Energy Holdings
0.30
0.30
PSE&G
$ 0.67
$ 0.51
PSEG Power
2010
2011
$ millions (except EPS)
Quarter Ended September 30
* See page 37 for Items excluded from Income from Continuing Operations to
reconcile to Operating Earnings. |
 11
YTD Operating Earnings by Subsidiary
$ 1,281
12
43
347
$ 879
2010
$ 1,152
14
6
422
$ 710
2011
Operating Earnings
Earnings per Share
0.02
0.03
Enterprise
$ 2.53
$ 2.27
Operating Earnings*
0.09
0.01
PSEG Energy Holdings
0.69
0.83
PSE&G
$ 1.73
$ 1.40
PSEG Power
2010
2011
$ millions (except EPS)
Nine Months Ended September 30
* See page 37 for Items excluded from Income from Continuing Operations to
reconcile to Operating Earnings. |
 12
$1.03
(0.16)
0.0
(0.04)
$0.83
0.00
0.20
0.40
0.60
0.80
1.00
1.20
PSEG EPS Reconciliation –
Q3 2011 versus Q3 2010
Q3 2011
Operating
Earnings*
Q3 2010
Operating
Earnings*
Lower Pricing (0.14)
Lower Generating
Volumes (0.02)
Coal Optimization
0.03
WPT 0.03
D&A (0.02)
Interest (0.01)
O&M (0.01)
Other (0.02)
PSEG Power
Margins
Renewables
and
Capital Stimulus 0.02
Transmission 0.01
O&M (0.01)
D&A (0.01)
Other (0.01)
PSE&G
PSEG Energy
Holdings
Absence of Gain
on Lease Sales
(0.03)
Other (0.01)
•See page 37 for Items excluded from Income from Continuing Operations to
reconcile to Operating Earnings. |
 13
$2.53
(0.33)
0.14
(0.08)
0.01
$2.27
1.00
1.25
1.50
1.75
2.00
2.25
2.50
2.75
PSEG EPS Reconciliation –
YTD 2011 versus YTD 2010
Nine Months
Ended 9/30/2010
Operating
Earnings*
Interest
Lower Pricing (0.22)
Lower Generating
Volumes (0.03)
Migration (0.02)
Coal Optimization 0.06
O&M (0.06)
D&A and
Interest (0.06)
WPT 0.02
Other (0.02)
PSEG Power
Margins:
Rate Relief 0.04
Transmission 0.03
Renewables, Capital
Stimulus and Other
0.06
O&M 0.04
Weather 0.03
D&A (0.03)
Taxes (0.02)
Other (0.01)
PSE&G
PSEG Energy
Holdings
Enterprise
Absence of Gain on
Lease Sales and
Impairments (0.04)
ES&P Investment
Write-off (0.01)
Other (0.03)
* See
page
37
for
Items
excluded
from
Net
Income
to
reconcile
to
Operating
Earnings.
Nine Months
Ended 9/30/2011
Operating
Earnings* |
 PSEG
Power 2011 Q3 Review |
 15
PSEG Power –
Q3 2011 EPS Summary
(8)
16
8
Mark-to-Market, Net of Tax
(3)
10
7
NDT Funds Related
Activity,
Net of Tax
$ (125)
$ 1,523
$ 1,398
Operating Revenues
$ (0.16)
$ 0.67
$ 0.51
EPS from Operating Earnings*
$ (82)
$ 384
$ 302
Net Income
(80)
338
258
Operating Earnings
Variance
Q3 2010
Q3 2011
$ millions (except EPS)
* See page 37 for Items excluded from Income from Continuing Operations to
reconcile to Operating Earnings. |
 16
$0.51
(0.02)
(0.04)
(0.10)
$0.67
0.00
0.25
0.50
0.75
1.00
Lower Pricing
(0.14)
Lower Generating
Volume (0.02)
Coal Optimization
0.03
WPT 0.03
PSEG Power EPS Reconciliation –
Q3 2011 versus Q3 2010
Q3 2011
Operating
Earnings*
Q3 2010
Operating
Earnings*
Higher D&A
for BET and
Lower IDC
Offset (0.03)
O&M (0.01)
* See page 37 for Items excluded from Income from Continuing Operations to
reconcile to Operating Earnings. Other |
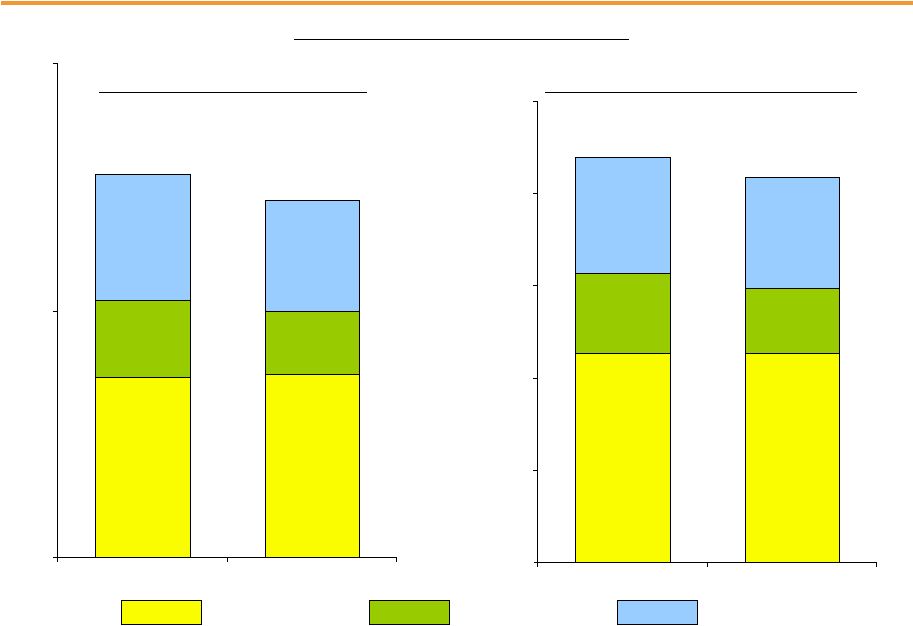 17
PSEG Power –
Generation Measures
7,309
7,417
3,131
2,536
5,073
4,473
0
10,000
20,000
2010
2011
Quarter Ended September 30
Total Nuclear
Total Coal*
Total Oil &
Natural Gas
* Includes figures for Pumped Storage.
PSEG Power –
Generation (GWh)
14,426
15,513
22,577
22,652
8,647
7,039
12,692
12,088
0
10,000
20,000
30,000
40,000
50,000
2010
2011
Nine Months Ended September 30
41,779
43,916 |
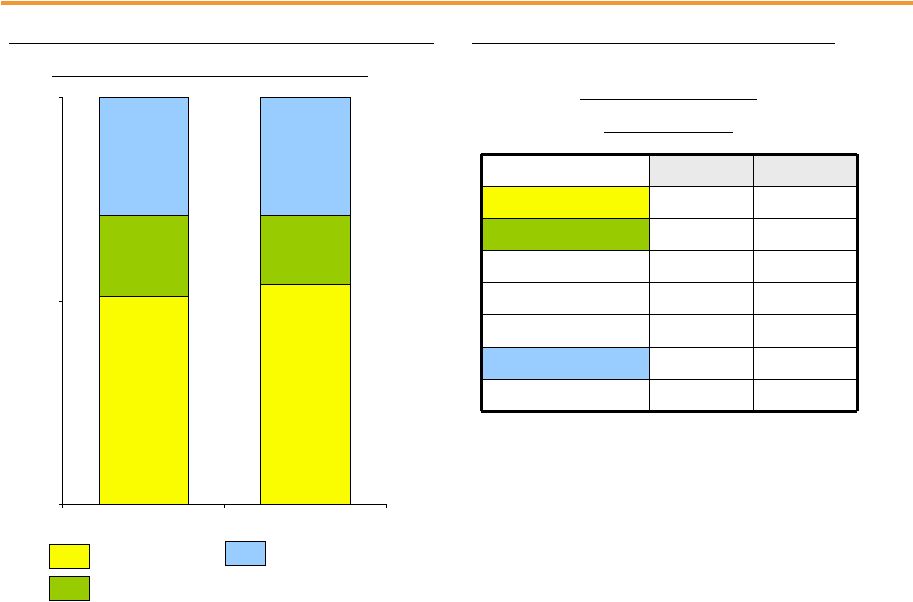 18
PSEG Power –
Generation Measures
51
54
20
17
29
29
0
50
100
2010
2011
Nine
Months
Ended
September
30
Total Nuclear
Total Coal*
Oil & Natural Gas
* Includes figures for Pumped Storage
PSEG
Power
–
%
Generation
Contribution
PSEG Power –
Capacity Factors (%)
2010
2011
Nuclear**
93.1%
93.3%
Coal
NJ
43%
33%
PA
86%
81%
CT
39%
19%
Combined
Cycle
PJM and NY
55%
54%
Nine
Months
Ended
September
30
**Total
Nuclear
Fleet
-
PS
Share |
 19
Hedging Update…
…
our strategy is to hedge our base load generation long term.
Contracted Energy*
2011
2012
2013
Oct - Dec
Volume TWh
8
36
36
Base Load
% Hedged
100%
80-85%
40-45%
(Nuclear and Base Load Coal)
Price $/MWh
$68**
$63
$61
Volume TWh
5
22
22
Intermediate Coal, Combined
% Hedged
46%
Cycle, Peaking
Price $/MWh
$68**
$63
$61
Volume TWh
13
58
58
Total
% Hedged
80%
50-55%
25-30%
Price $/MWh
$68**
$63
$61
* Hedge percentages and prices as of September 30, 2011 for the October 2011 and forward time
frame. ** Average price for full-year 2011. Revenues of full requirement load deals based on contract
price, including renewable energy credits, ancillary, and transmission components but excluding
capacity. Hedges include positions with MTM accounting treatment and options. |
 20
PSEG Power –
Fuel Costs
185
235
Oil & Gas
99
115
Coal
22.81
25.21
$ / MWh
14,426
15,513
Total Generation
(GWh)
329
391
Total Fuel Cost
45
41
Nuclear
Total Fossil
($ millions)
283
350
2011
2010
Quarter Ended September 30
PSEG Power –
Fuel Costs
530
603
Oil & Gas
272
328
Coal
22.43
24.00
$ / MWh
41,778
43,916
Total Generation
(GWh)
937
1,054
Total Fuel Cost
135
123
Nuclear
Total Fossil
($ millions)
802
931
2011
2010
Nine Months Ended
September 30 |
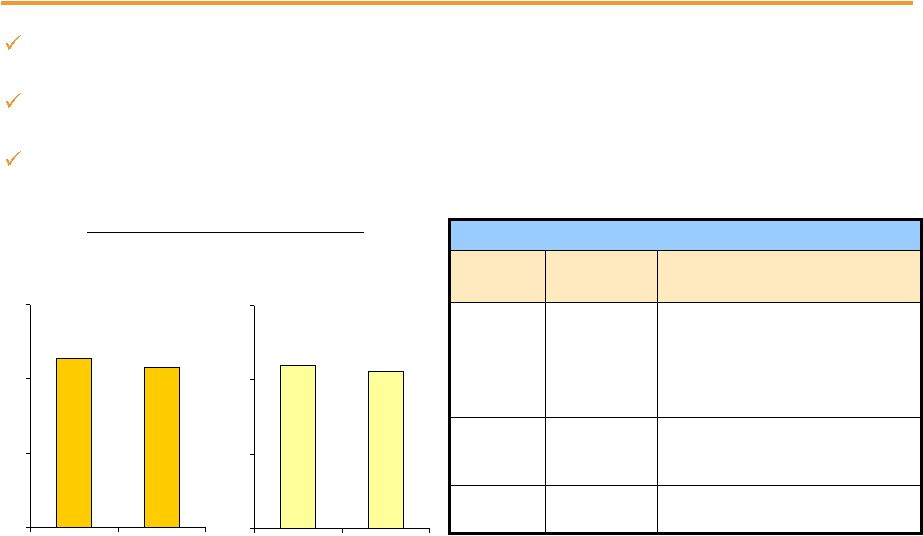 21
PSEG Power –
Gross Margin Performance
$0
$25
$50
$75
2010
2011
$0
$25
$50
$75
2010
2011
$54
$57
Quarter Ended
September 30
Nine Months Ended
September 30
$53
$55
In Q3, PJM total gross margin was influenced primarily by lower realized
energy and capacity prices
Customer migration away from BGS has slowed; full-year estimate reduced
to an average of 32%-33%, from 34%
Nuclear performed well in the quarter despite severe weather
Lower volumes and pricing.
$18
New York
Regional Performance
$29
$734
Gross
Margin ($M)
Q3 2011 Performance
Region
Lower pricing and volume offset by
active management of coal inventory.
New
England
Q3 contribution to gross margin
declined by ($122M) versus a year
ago. Lower realized prices resulting
from the roll off of higher priced BGS
hedges and lower capacity prices
combined with lower overall volumes.
PJM
PSEG Power Gross Margin ($/MWh)*
*Excludes Texas. |
 22
PSEG Power –
Q3 Operating Highlights
Nuclear fleet capacity factor of 90.6% for Q3 and 93.3% for YTD;
Salem 1 refueling outage underway
Combined cycle capacity factor of 58% in Q3 2011 vs. 61% in Q3 2010
Coal capacity factor of 46% in Q3 2011 vs. 56% in Q3 2010
Operations
Financial
Power markets affected by hot, early summer in NJ and the release
of CSAPR rules
Weak economy and low natural gas prices continue to dampen power
prices, as heat rates and spark spreads have improved
Actively managing coal inventory
Issued $250 million of 2.75% Senior Notes due September 2016 and
$250 million of 4.15% Senior Notes due September 2021
Debt as of September 30, 2011 at 38% of capitalization
Regulatory and Market
Environment |
 PSE&G
2011 Q3 Review |
 24
PSE&G –
Q3 2011 Earnings Summary
* See page 37 for Items excluded from Income from Continuing Operations to
reconcile to Operating Earnings. $ millions (except EPS)
Q3 2011
Q3 2010
Variance
Operating Revenues
$ 1,841
$ 2,007
$ (166)
Operating Expenses
Energy Costs
943
1,115
(172)
Operation & Maintenance
342
327
15
Depreciation & Amortization
197
209
(12)
Taxes Other than Income Taxes
31
31
-
Total Operating Expenses
1,513
1,682
(169)
Operating Earnings / Income from
Continuing Operations / Net Income
$ 154
$ 155
$ (1)
EPS from Operating Earnings*
$ 0.30
$ 0.30
- |
 25
$0.30
0.03
$0.30
(0.01)
(0.02)
0.00
0.10
0.20
0.30
PSE&G EPS Reconciliation –
Q3 2011
versus Q3 2010
Q3 2011
Operating
Earnings*
Q3 2010
Operating
Earnings*
O&M
* See page 37 for Items excluded from Income from Continuing Operations to
reconcile to Operating Earnings. Renewables
and
Capital Stimulus
0.02
Transmission 0.01
D&A (0.01)
Other (0.01) |
 26
56
33
26
147
55
27
0
50
100
150
200
250
2010
Normal
2011
July
August
September
Q3 2011 was warmer than normal but cooler than Q3 2010
Third
Quarter
Number
of
Hours
Where
the
Temperature
was
Equal
or
Greater
than
90
o
F
146
172
93
230
5
…and included the wettest August on record with 23 inches of rain in NJ. |
 27
PSE&G Capital Spending: 2011-2013
PSE&G Capital Spending: 2011-2013
$5,245
$1,780
$1,845
$1,620
Total
$640
$75
$235
$330
Renewables/EMP
$1,685
$425
$660
$600
Distribution
$2,920
$1,280
$950
$690
Transmission
2011-2013E
2013E
2012E
2011E
($ Millions)
Capital program provides growth in rate base of ~11% per year from
2010 base of $7.8 Billion
Transmission investment represents over 50% of planned capex over
2011-2013
Supportive regulatory treatment
*Estimate |
 28
PSE&G –
Q3 Operating Highlights
S-R line added to the new federal Rapid Response Team project list
EMP review ongoing; finalization expected early 2012
BPU reviewing utility performance related to Hurricane Irene response
PSE&G has deferred incremental, storm-related O&M costs of
approximately $29 million Issued $250 million of 0.85% Medium Term Notes due
August 2014 in August Filed
at
FERC,
under
its
formula
rate
mechanism,
for
an
increase
in
transmission
revenues
of $94 million on an annualized basis to be effective 1/1/2012
Operations
Financial
Hurricane Irene interrupted service to over 800,000 customers
Most customers were restored within 2 days
Economic indicators stalled
Temperature Humidity Index was 34% above normal but -0.6% below Q3 2010’s
record heat Regulatory and Market
Environment |
 PSEG
Energy Holdings 2011 Q3 Review |
 30
PSEG Energy Holdings –
Q3 2011 Earnings Summary
(170)
-
(170)
Reconciling Items Excluded from
Continuing Operations
$ (0.04)
$ 0.05
$ 0.01
EPS from Operating Earnings*
$ (190)
$ 24
$ (166)
Net Income (Loss)
$ (20)
$ 24
$ 4
Operating Earnings
Variance
Q3 2010
Q3 2011
$ millions (except EPS)
* See page 37 for Items excluded from Income from Continuing Operations to
reconcile to Operating Earnings. |
 31
$0.01
(0.01)
(0.03)
$0.05
0.00
0.01
0.02
0.03
0.04
0.05
0.06
PSEG Energy Holdings EPS Reconciliation –
Q3 2011 versus Q3 2010
Q3 2011
Operating
Earnings*
Q3 2010
Operating
Earnings*
Other
* See page 37 for Items excluded from Income from Continuing Operations to
reconcile to Operating Earnings. Absence of Gain on
Lease Sales |
 32
PSEG Energy Holdings –
Q3 Operating Highlights
Financial
Energy Holdings has fully reserved its $264 million gross investment
in the lease receivable from Dynegy, resulting in an after-tax
charge of $170 million, or $0.34 per share
Continuing to review opportunities for additional investments in
solar
under PPA arrangements |
 PSEG |
 34
PSEG 2011 Operating Earnings Guidance -
By Subsidiary
$ 3.12
$ 1,584
$ 14
$ 49
$ 430
$ 1,091
2010A
$ 2.50 –
$ 2.75
$ 1,265 –
$ 1,395
$ 5 –
$ 15
$ 0 –
$ 5
$ 495 –
$ 520
$ 765 –
$ 855
2011E
Enterprise
Earnings per Share
Operating Earnings*
PSEG Energy Holdings
PSE&G
PSEG Power
$ millions (except EPS)
* See page 38 for Items excluded from Income from Continuing Operations to
reconcile to Operating Earnings. |
 35
PSEG –
Q3 2011
Utility capital spending will result in ~11%
rate base growth CAGR –
primarily driven
by transmission investment
Migration impact on margin is declining as
discounts prove more challenging versus a
lower BGS price to beat
Forward price curve showing signs of
sustained strength with expanding heat rates
supporting higher pricing in outer years |
 36
PSEG Liquidity as of September 30, 2011
Expiration
Total
Available
Company
Facility
Date
Facility
Usage
Liquidity
($Millions)
PSE&G
5-year Credit Facility
Apr-16
$600
$0
$600
5-Year Credit Facility (Power)
Dec-12
$1,600
1
$120
$1,480
5-Year Credit Facility (Power)
Apr-16
$1,000
$0
$1,000
5-Year Bilateral - Credit Suisse (Power)
Sep-15
$100
$100
$0
5-year Credit Facility (PSEG)
Dec-12
$500
2
$14
$486
5-year Credit Facility (PSEG)
Apr-16
$500
$0
$500
Total
$4,300
$4,066
$958
PSE&G ST Investment
$215
Total Liquidity Available
$5,239
Total Parent / Power Liquidity
$4,424
1
Power Facility reduced by $75 million in 12/2011
2
PSEG Facility reduced by $23 million in 12/2011
PSEG /
Power
PSEG Money Pool ST Investment |
 37
Items Excluded from Income from Continuing Operations
to Reconcile to Operating Earnings
Please see Page 2 for an explanation of PSEG’s use of Operating Earnings as a
non-GAAP financial measure and how it differs from Net Income.
Pro-forma Adjustments, net of tax
2011
2010
2011
2010
Earnings Impact ($ Millions)
Gain (Loss) on Nuclear Decommissioning Trust (NDT)
Fund Related Activity (PSEG Power)
7
$
10
$
49
$
30
$
Gain (Loss) on Mark-to-Market (MTM) (PSEG Power)
8
16
16
28
Lease Transaction Reserves (Energy Holdings)
(170)
-
(170)
-
Market Transition Charge Refund (PSE&G)
-
-
-
(72)
Total Pro-forma adjustments
(155)
$
26
$
(105)
$
(14)
$
Fully Diluted Average Shares Outstanding (in Millions)
507
507
507
507
Per Share Impact (Diluted)
Gain (Loss) on NDT Fund Related Activity (PSEG Power)
0.01
$
0.02
$
0.10
$
0.06
$
Gain (Loss) on MTM (PSEG Power)
0.02
0.03
0.03
0.05
Lease Transaction Reserves (Energy Holdings)
(0.34)
-
(0.34)
-
Market Transition Charge Refund (PSE&G)
-
-
-
(0.14)
Total Pro-forma adjustments
(0.31)
$
0.05
$
(0.21)
$
(0.03)
$
September 30,
September 30,
For the Three Months Ended
For the Nine Months Ended
PUBLIC SERVICE ENTERPRISE GROUP INCORPORATED
Reconciling Items Excluded from Continuing Operations to Compute Operating Earnings
(Unaudited) |
 38
Items
Excluded
from
Income
from
Continuing
Operations
to
Reconcile
to Operating Earnings
Please see Page 2 for an explanation of PSEG’s use of Operating Earnings as a
non-GAAP financial measure and how it differs from Net Income.
Pro-forma Adjustments, net of tax
2010
2009
Earnings Impact ($ Millions)
Gain (Loss) on Nuclear Decommissioning Trust (NDT)
Fund Related Activity (PSEG Power)
46
$
9
$
Gain (Loss) on Mark-to-Market (MTM) (PSEG Power)
(1)
(11)
Net Reversal of Lease Transaction Reserves (Energy Holdings)
-
29
Market Transition Charge Refund (PSE&G)
(72)
-
Total Pro-forma adjustments
(27)
$
27
$
Fully Diluted Average Shares Outstanding (in Millions)
507
507
Per Share Impact (Diluted)
Gain (Loss) on NDT Fund Related Activity (PSEG Power)
0.09
$
0.02
$
Gain (Loss) on MTM (PSEG Power)
-
(0.02)
Net Reversal of Lease Transaction Reserves (Energy Holdings)
-
0.05
Market Transition Charge Refund (PSE&G)
(0.14)
-
Total Pro-forma adjustments
(0.05)
$
0.05
$
December 31,
PUBLIC SERVICE ENTERPRISE GROUP INCORPORATED
Reconciling Items Excluded from Continuing Operations to Compute Operating Earnings
(Unaudited)
For the Twelve Months Ended |