Attached files
| file | filename |
|---|---|
| 8-K - FORM 8-K - PUBLIC SERVICE ELECTRIC & GAS CO | d249294d8k.htm |
| EX-99.1 - SLIDESHOW PRESENTATION - PUBLIC SERVICE ELECTRIC & GAS CO | d249294dex991.htm |
EXHIBIT 99

|
Investor News | NYSE:PEG |
For further information, contact:
| • Kathleen A. Lally, Vice President – Investor Relations |
Phone: 973-430-6565 | |
| • Carlotta Chan Lane, Manager - Investor Relations |
Phone: 973-430-6596 | |
November 1, 2011
PSEG ANNOUNCES 2011 THIRD QUARTER RESULTS
$0.52 PER SHARE FROM CONTINUING OPERATIONS
$0.83 PER SHARE OF OPERATING EARNINGS
RESERVE RECOGNIZED FOR CERTAIN LEASES
2011 OPERATING EARNINGS EXPECTED TO BE AT UPPER END OF GUIDANCE
Public Service Enterprise Group (PSEG) today reported third quarter 2011 Income from continuing operations of $265 million or $0.52 per share as compared to $547 million or $1.08 per share for the third quarter of 2010. Income from continuing operations for the third quarter of 2011 includes an after-tax charge of $170 million ($0.34 per share) related to the reserve for Energy Holdings’ lease receivable from Dynegy. Including Income from Discontinued Operations, PSEG reported Net Income for the third quarter 2011 of $294 million or $0.58 per share versus $567 million or $1.12 per share for the third quarter 2010. Operating earnings for the third quarter of 2011 were $420 million or $0.83 per share compared to the third quarter of 2010 operating earnings of $521 million or $1.03 per share.
PSEG believes that the non-GAAP financial measure of “Operating Earnings” provides a consistent and comparable measure of performance of its businesses to help shareholders understand performance trends. Operating Earnings exclude the impact of returns/(losses) associated with Nuclear Decommissioning Trust (NDT), certain Mark-to-Market (MTM) accounting and other material one time items. The table below provides a reconciliation of PSEG’s Net Income to Operating Earnings (a non-GAAP measure) for the third quarter. See Attachment 12 for a complete list of items excluded from Income from Continuing Operations in the determination of Operating Earnings.
PSEG CONSOLIDATED EARNINGS (unaudited)
Third Quarter Comparative Results
2011 and 2010
| Income ($millions) |
Diluted Earnings Per Share |
|||||||||||||||
| 2011 | 2010 | 2011 | 2010 | |||||||||||||
| Operating Earnings |
$ | 420 | $ | 521 | $ | 0.83 | $ | 1.03 | ||||||||
| Less: Lease Transaction Reserve |
(170 | ) | — | (0.34 | ) | — | ||||||||||
| Add: Other Excluded Items |
15 | 26 | 0.03 | 0.05 | ||||||||||||
| Income from Continuing Operations |
$ | 265 | $ | 547 | $ | 0.52 | $ | 1.08 | ||||||||
| Income from Discontinued Operations |
29 | 20 | 0.06 | 0.04 | ||||||||||||
|
|
|
|
|
|
|
|
|
|||||||||
| Net Income |
$ | 294 | $ | 567 | $ | 0.58 | $ | 1.12 | ||||||||
|
|
|
|
|
|
|
|
|
|||||||||
| Shares |
507 | 507 | ||||||||||||||
“We reported solid operating earnings for the third quarter in spite of considerable challenges” said Ralph Izzo, chairman, chief executive officer and president. “We experienced an historic number of customer outages and level of system damage in the wake of Hurricane Irene. The dedication and teamwork exhibited by our employees supported the restoration of service to more than 800,000 customers within five days, and assured our generating units remained on line.”
He went on to say “based on our results for the first nine months of 2011, we expect operating earnings for the full year to be at the upper end of our forecast of $2.50 - $2.75 per share”.
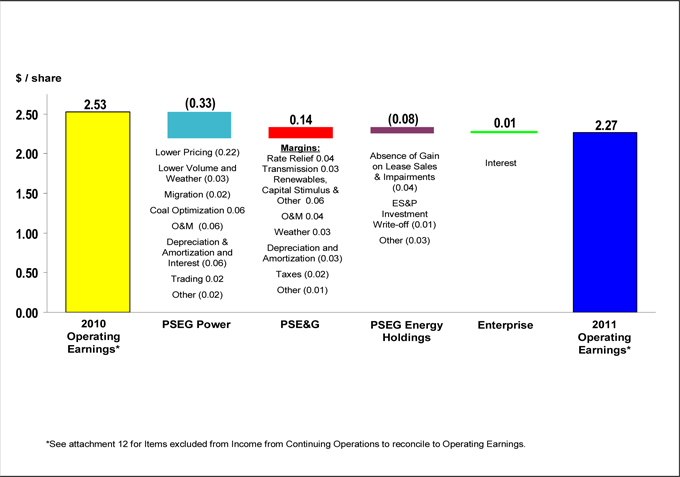
Operating Earnings guidance by company for the full year is as follows:
Operating Earnings
| 2011E | 2010A | |||||
| PSEG Power |
$765 - $855 | $ | 1,091 | |||
| PSE&G |
$495 - $520 | $ | 430 | |||
| PSEG Energy Holdings |
$0 - $5 | $ | 49 | |||
| Parent |
$5 - $15 | $ | 14 | |||
| Total |
$1,265 - $1,395 | $ | 1,584 | |||
| Earnings Per Share |
$2.50 - $2.75 | $ | 3.12 | |||
“PSEG’s success during this period of low commodity prices is primarily due to our employees continuing focus on meeting operational goals” said Izzo. “This provides the foundation of our future expectations. The investments we have made to replace inefficient, older generating units and upgrade the environmental profile of existing facilities improves the company’s competitive position as new environmental requirements become effective, and allows PSEG to direct its capital toward growth opportunities.”
Operating Earnings Review and Outlook by Operating Subsidiary
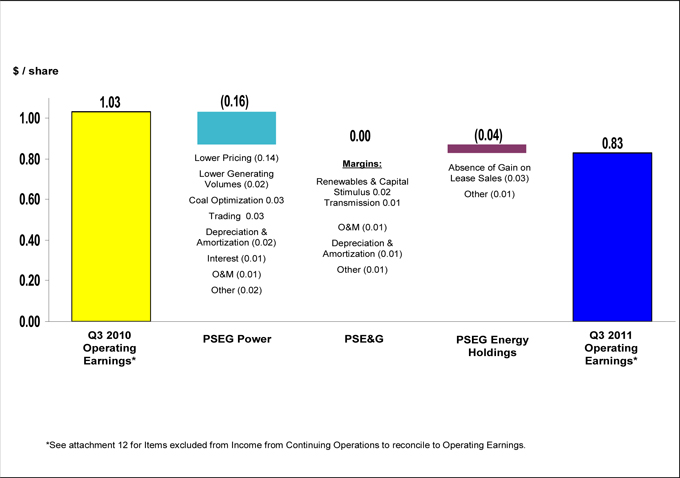
See Attachment 6 for detail regarding the quarter-over-quarter reconciliations for each of PSEG’s businesses.
PSEG Power
PSEG Power reported operating earnings of $258 million ($0.51 per share) for the third quarter of 2011 compared with operating earnings of $338 million ($0.67 per share) for the third quarter of 2010.
Power’s quarterly earnings were affected primarily by a quarter-over-quarter decline in realized energy and capacity prices. As reported, capacity prices declined to $110/MW-day on June 1, 2011 from $174/MW-day earlier in the year as a result of PJM’s RPM auction. This decline reduced Power’s earnings in the quarter by $0.07 per share. A decline in energy prices within the Basic Generation Service (BGS) contract to $94.30 per MWh, also effective on June 1, 2011, from the prior $111.50 per MWh, as well as the effect of other recontracting efforts, reduced earnings in the quarter by $0.07 per share. A 7% decline in volume lowered earnings comparisons by $0.02 per share. Higher depreciation expense coupled with lower capitalized interest reduced Power’s earnings by $0.03 per share. An increase in operation and maintenance expense due to the timing of planned outages at the fossil stations reduced earnings by $0.01 per share. Power’s earnings benefited from the absence of trading related losses in the prior year of $0.03 per share. Other miscellaneous items together reduced earnings by $0.01 per share.
2
The dispatch of Power’s intermediate-load coal units has been affected by a decline in dark spreads and low gas prices. Given the decline in current utilization, Power has taken advantage of the flexibility available under the terms of one of its coal contracts to sell supply on the open market. Power has also restructured the contract to more closely match supply with future coal requirements. The sale of coal in the third quarter of 2011 coupled with the absence of freight cancellation costs incurred in the year-ago quarter benefited Power’s third quarter 2011 earnings by $0.03 per share.
PSEG Power’s nuclear and fossil fleets performed strongly during the summer heat waves. PSEG Power’s nuclear fleet operated at an average capacity factor of 90.6% during the third quarter of 2011 compared to an average capacity factor of 89.4% in the year-ago quarter. The performance for the quarter resulted in a capacity factor for the first nine months of 2011 of 93.3% compared with a capacity factor of 93.1% for the year-ago period. Strong performance from the Hope Creek nuclear facility – which operated at a capacity factor slightly in excess of 97% during the quarter – offset the effects of a coolant system leak and hurricane-related debris in the Delaware River on the operation of the Salem units. The Salem 1 nuclear facility entered a planned refueling outage on October 23, 2011.
Customer migration represented 33% of BGS volumes at the end of the third quarter of 2011 compared with 26% at the end of September 2010. Although customer migration away from the BGS contract grew during the quarter versus year-ago levels, earnings were unaffected given a reduction in headroom. We have lowered our full year estimate of customer migration to an average of 32% -33% from 34%. Our updated estimate assumes year-end customer migration levels of 33% - 35% versus our previous forecast of 37% - 39%.
Power’s output for the remainder of 2011 is approximately 80% hedged for this period at an average price of $68 per MWh. For 2012, hedges are in place for approximately 50% - 55% of expected total 2012 generation of 58 TWh at an average price of $63 per MWh. For 2013, approximately 25% - 30% of expected total generation of 58 TWh is hedged at an average price of $61 per MWh.
PSE&G
PSE&G reported operating earnings of $154 million ($0.30 per share) for the third quarter of 2011 compared with operating earnings of $155 million ($0.30 per share) for the third quarter of 2010.
PSE&G’s results were affected by increased capital investment and the cost of responding to hurricane-related outages. An annualized increase in transmission revenue of $45 million effective on January 1, 2011 added $0.01 per share to results. A return on investments made under capital adjustment clauses supporting investment in renewables and electric and gas infrastructure programs added $0.02 per share to earnings. An increase in operation and maintenance expense reduced earnings by $0.01 per share. Storm-related costs and higher tree trimming expense in the quarter amounting to $0.03 per share partially offset a reduction in pension related costs during the quarter. An increase in depreciation expense and the absence of gains in the year-ago quarter reduced earnings by $0.02 per share.
PSE&G’s service territory experienced days of record breaking temperatures during the month of July. Although temperatures reached new highs during several days, the number of hours in the quarter experiencing peak temperatures was lower than the levels experienced in the year-ago period. Hence, weather had little impact on quarter-over-quarter earnings comparisons. Weather-normalized electric sales remain weak as residential customers conserve in response to economic conditions.
3
The Susquehanna-Roseland 500-kv transmission project has been placed on a list of projects for a new federal Rapid Response Team with the aim of coordinating and expediting the federal permitting process.
PSEG Energy Holdings
PSEG Energy Holdings reported operating earnings of $4 million ($0.01 per share) for the third quarter of 2011 versus operating earnings of $24 million ($0.05 per share) during the third quarter of 2010.
The decline in operating earnings for the quarter reflects the absence of gains in the third quarter of 2010 from the termination of leases.
Other Items
Energy Holdings’ has evaluated its likely recovery under the lease arrangements for the Roseton and Danskammer generating facilities leased to subsidiaries of Dynegy Holdings LLC (DH), a subsidiary of Dynegy, in light of Dynegy’s and DH’s financial condition and considering the overall value of the underlying assets subject to the leases. Energy Holdings, as a result, has fully reserved its $264 million gross investment which resulted in an after-tax charge of $170 million ($0.34 per share) in the third quarter. In the event of non-payment of the lease obligations, Energy Holdings intends to fully assert its claims against DH, its directors and Dynegy affiliates including its claims under a tax indemnity agreement designed to protect Energy Holdings from adverse tax consequences should the lease structure not be maintained.
Forward-Looking Statement
Readers are cautioned that statements contained in this presentation about our and our subsidiaries’ future performance, including future revenues, earnings, strategies, prospects, consequences and all other statements that are not purely historical, are forward-looking statements for purposes of the safe harbor provisions under The Private Securities Litigation Reform Act of 1995. When used herein, the words “will”, “anticipate”, “intend”, “estimate”, “believe”, “expect”, “plan”, “should”, “hypothetical”, “potential”, “forecast”, “project”, variations of such words and similar expressions are intended to identify forward-looking statements. Although we believe that our expectations are based on reasonable assumptions, they are subject to risks and uncertainties and we can give no assurance they will be achieved. The results or developments projected or predicted in these statements may differ materially from what may actually occur. Factors which could cause results or events to differ from current expectations include, but are not limited to:
| • | adverse changes in energy industry law, policies and regulation, including market structures and a potential shift away from competitive markets toward subsidized market mechanisms, transmission planning and cost allocation rules, including rules regarding how transmission is planned and who is permitted to build transmission in the future, and reliability standards, |
| • | any inability of our transmission and distribution businesses to obtain adequate and timely rate relief and regulatory approvals from federal and state regulators, |
| • | changes in federal and state environmental regulations that could increase our costs or limit our operations, |
| • | changes in nuclear regulation and/or general developments in the nuclear power industry, including various impacts from any accidents or incidents experienced at our facilities or by others in the industry that could limit operations of our nuclear generating units, |
| • | actions or activities at one of our nuclear units located on a multi-unit site that might adversely affect our ability to continue to operate that unit or other units located at the same site, |
| • | any inability to balance our energy obligations, available supply and trading risks, |
| • | any deterioration in our credit quality, or the credit quality of our counterparties, including in our leveraged leases, |
| • | availability of capital and credit at commercially reasonable terms and conditions and our ability to meet cash needs, |
| • | any inability to realize anticipated tax benefits or retain tax credits, |
| • | changes in the cost of, or interruption in the supply of, fuel and other commodities necessary to the operation of our generating units, |
| • | delays in receipt of necessary permits and approvals for our construction and development activities, |
| • | delays or unforeseen cost escalations in our construction and development activities, |
4
| • | adverse changes in the demand for or price of the capacity and energy that we sell into wholesale electricity markets, |
| • | increase in competition in energy markets in which we compete, |
| • | challenges associated with recruitment and/or retention of a qualified workforce, |
| • | adverse performance of our decommissioning and defined benefit plan trust fund investments and changes in discount rates and funding requirements, and |
| • | changes in technology and customer usage patterns. |
For further information, please refer to our Annual Report on Form 10-K, including Item 1A. Risk Factors, and subsequent reports on Form 10-Q and Form 8-K filed with the Securities and Exchange Commission. These documents address in further detail our business, industry issues and other factors that could cause actual results to differ materially from those indicated in this presentation. In addition, any forward-looking statements included herein represent our estimates only as of today and should not be relied upon as representing our estimates as of any subsequent date. While we may elect to update forward-looking statements from time to time, we specifically disclaim any obligation to do so, even if our internal estimates change, unless otherwise required by applicable securities laws.
5
Attachment 1
PUBLIC SERVICE ENTERPRISE GROUP INCORPORATED
Operating Earnings and Per Share Results by Subsidiary
(Unaudited)
| For the Three Months Ended | For the Nine Months Ended | |||||||||||||||
| September 30, | September 30, | |||||||||||||||
| 2011 | 2010 | 2011 | 2010 | |||||||||||||
| Earnings Results ($ Millions) | ||||||||||||||||
| PSEG Power |
$ | 258 | $ | 338 | $ | 710 | $ | 879 | ||||||||
| PSE&G |
154 | 155 | 422 | 347 | ||||||||||||
| PSEG Energy Holdings |
4 | 24 | 6 | 43 | ||||||||||||
| PSEG |
4 | 4 | 14 | 12 | ||||||||||||
|
|
|
|
|
|
|
|
|
|||||||||
| Operating Earnings |
$ | 420 | $ | 521 | $ | 1,152 | $ | 1,281 | ||||||||
|
|
|
|
|
|
|
|
|
|||||||||
| Reconciling Items(a) |
(155 | ) | 26 | (105 | ) | (14 | ) | |||||||||
|
|
|
|
|
|
|
|
|
|||||||||
| Income from Continuing Operations |
$ | 265 | $ | 547 | $ | 1,047 | $ | 1,267 | ||||||||
|
|
|
|
|
|
|
|
|
|||||||||
| Discontinued Operations |
29 | 20 | 96 | 15 | ||||||||||||
|
|
|
|
|
|
|
|
|
|||||||||
| Net Income |
$ | 294 | $ | 567 | $ | 1,143 | $ | 1,282 | ||||||||
|
|
|
|
|
|
|
|
|
|||||||||
| Fully Diluted Average Shares Outstanding (in Millions) |
507 | 507 | 507 | 507 | ||||||||||||
|
|
|
|
|
|
|
|
|
|||||||||
| Per Share Results (Diluted) | ||||||||||||||||
| PSEG Power |
$ | 0.51 | $ | 0.67 | $ | 1.40 | $ | 1.73 | ||||||||
| PSE&G |
0.30 | 0.30 | 0.83 | 0.69 | ||||||||||||
| PSEG Energy Holdings |
0.01 | 0.05 | 0.01 | 0.09 | ||||||||||||
| PSEG |
0.01 | 0.01 | 0.03 | 0.02 | ||||||||||||
|
|
|
|
|
|
|
|
|
|||||||||
| Operating Earnings |
$ | 0.83 | $ | 1.03 | $ | 2.27 | $ | 2.53 | ||||||||
|
|
|
|
|
|
|
|
|
|||||||||
| Reconciling Items(a) |
(0.31 | ) | 0.05 | (0.21 | ) | (0.03 | ) | |||||||||
|
|
|
|
|
|
|
|
|
|||||||||
| Income from Continuing Operations |
$ | 0.52 | $ | 1.08 | $ | 2.06 | $ | 2.50 | ||||||||
|
|
|
|
|
|
|
|
|
|||||||||
| Discontinued Operations |
0.06 | 0.04 | 0.19 | 0.03 | ||||||||||||
|
|
|
|
|
|
|
|
|
|||||||||
| Net Income |
$ | 0.58 | $ | 1.12 | $ | 2.25 | $ | 2.53 | ||||||||
|
|
|
|
|
|
|
|
|
|||||||||
| (a) | See attachment 12 for details of items excluded from Income from Continuing Operations to compute Operating Earnings. |
Note:
Income from Continuing Operations includes preferred stock dividends relating to PSE&G of $1 million for the nine months ended September 30, 2010.
Attachment 2
PUBLIC SERVICE ENTERPRISE GROUP INCORPORATED
Consolidating Statements of Operations
(Unaudited, $ Millions)
| For the Three Months Ended September 30, 2011 | ||||||||||||||||||||
| PSEG | OTHER(a) | PSEG POWER |
PSE&G | PSEG ENERGY HOLDINGS |
||||||||||||||||
| OPERATING REVENUES |
$ | 2,620 | $ | (372 | ) | $ | 1,398 | $ | 1,841 | $ | (247 | ) | ||||||||
| OPERATING EXPENSES |
||||||||||||||||||||
| Energy Costs |
1,167 | (373 | ) | 597 | 943 | — | ||||||||||||||
| Operation and Maintenance |
603 | (10 | ) | 262 | 342 | 9 | ||||||||||||||
| Depreciation and Amortization |
263 | 7 | 56 | 197 | 3 | |||||||||||||||
| Taxes Other Than Income Taxes |
31 | — | — | 31 | — | |||||||||||||||
|
|
|
|
|
|
|
|
|
|
|
|||||||||||
| Total Operating Expenses |
2,064 | (376 | ) | 915 | 1,513 | 12 | ||||||||||||||
|
|
|
|
|
|
|
|
|
|
|
|||||||||||
| OPERATING INCOME (LOSS) |
556 | 4 | 483 | 328 | (259 | ) | ||||||||||||||
| Income from Equity Method Investments |
1 | — | — | — | 1 | |||||||||||||||
| Other Income and (Deductions) |
34 | — | 27 | 6 | 1 | |||||||||||||||
| Other Than Temporary Impairments |
(8 | ) | — | (8 | ) | — | — | |||||||||||||
| Interest Expense |
(117 | ) | 2 | (42 | ) | (77 | ) | — | ||||||||||||
|
|
|
|
|
|
|
|
|
|
|
|||||||||||
| INCOME (LOSS) FROM CONTINUING OPERATIONS BEFORE INCOME TAXES |
466 | 6 | 460 | 257 | (257 | ) | ||||||||||||||
| Income Tax Benefit (Expense) |
(201 | ) | (2 | ) | (187 | ) | (103 | ) | 91 | |||||||||||
|
|
|
|
|
|
|
|
|
|
|
|||||||||||
| INCOME (LOSS) FROM CONTINUING OPERATIONS |
265 | 4 | 273 | 154 | (166 | ) | ||||||||||||||
| Discontinued Operations, net of tax |
29 | — | 29 | — | — | |||||||||||||||
|
|
|
|
|
|
|
|
|
|
|
|||||||||||
| NET INCOME (LOSS) |
$ | 294 | $ | 4 | $ | 302 | $ | 154 | $ | (166 | ) | |||||||||
|
|
|
|
|
|
|
|
|
|
|
|||||||||||
|
|
|
|||||||||||||||||||
| OPERATING EARNINGS (LOSS) |
$ | 420 | $ | 4 | $ | 258 | $ | 154 | $ | 4 | ||||||||||
| Lease Transaction Reserve |
(170 | ) | — | — | — | (170 | ) | |||||||||||||
| Other Reconciling Items Excluded from Continuing Operations(b) |
15 | — | 15 | — | — | |||||||||||||||
|
|
|
|
|
|
|
|
|
|
|
|||||||||||
| INCOME (LOSS) FROM CONTINUING OPERATIONS |
$ | 265 | $ | 4 | $ | 273 | $ | 154 | $ | (166 | ) | |||||||||
|
|
|
|
|
|
|
|
|
|
|
|||||||||||
| For the Three Months Ended September 30, 2010 | ||||||||||||||||||||
| PSEG | OTHER (a) | PSEG POWER |
PSE&G | PSEG ENERGY HOLDINGS |
||||||||||||||||
| OPERATING REVENUES |
$ | 3,114 | $ | (474 | ) | $ | 1,523 | $ | 2,007 | $ | 58 | |||||||||
| OPERATING EXPENSES |
||||||||||||||||||||
| Energy Costs |
1,261 | (474 | ) | 620 | 1,115 | — | ||||||||||||||
| Operation and Maintenance |
591 | 1 | 253 | 327 | 10 | |||||||||||||||
| Depreciation and Amortization |
260 | 4 | 43 | 209 | 4 | |||||||||||||||
| Taxes Other Than Income Taxes |
31 | — | — | 31 | — | |||||||||||||||
|
|
|
|
|
|
|
|
|
|
|
|||||||||||
| Total Operating Expenses |
2,143 | (469 | ) | 916 | 1,682 | 14 | ||||||||||||||
|
|
|
|
|
|
|
|
|
|
|
|||||||||||
| OPERATING INCOME |
971 | (5 | ) | 607 | 325 | 44 | ||||||||||||||
| Income from Equity Method Investments |
4 | — | — | — | 4 | |||||||||||||||
| Other Income and (Deductions) |
66 | 11 | 35 | 13 | 7 | |||||||||||||||
| Other Than Temporary Impairments |
(3 | ) | (1 | ) | (2 | ) | — | — | ||||||||||||
| Interest Expense |
(120 | ) | 3 | (37 | ) | (82 | ) | (4 | ) | |||||||||||
|
|
|
|
|
|
|
|
|
|
|
|||||||||||
| INCOME FROM CONTINUING OPERATIONS BEFORE INCOME TAXES |
918 | 8 | 603 | 256 | 51 | |||||||||||||||
| Income Tax Expense |
(371 | ) | (4 | ) | (239 | ) | (101 | ) | (27 | ) | ||||||||||
|
|
|
|
|
|
|
|
|
|
|
|||||||||||
| INCOME FROM CONTINUING OPERATIONS |
547 | 4 | 364 | 155 | 24 | |||||||||||||||
| Discontinued Operations, net of tax |
20 | — | 20 | — | — | |||||||||||||||
|
|
|
|
|
|
|
|
|
|
|
|||||||||||
| NET INCOME (LOSS) |
$ | 567 | $ | 4 | $ | 384 | $ | 155 | $ | 24 | ||||||||||
|
|
|
|
|
|
|
|
|
|
|
|||||||||||
| OPERATING EARNINGS (LOSS) |
$ | 521 | $ | 4 | $ | 338 | $ | 155 | $ | 24 | ||||||||||
| Reconciling Items Excluded from Continuing Operations (b) |
26 | — | 26 | — | — | |||||||||||||||
|
|
|
|
|
|
|
|
|
|
|
|||||||||||
| INCOME (LOSS) FROM CONTINUING OPERATIONS |
$ | 547 | $ | 4 | $ | 364 | $ | 155 | $ | 24 | ||||||||||
|
|
|
|
|
|
|
|
|
|
|
|||||||||||
| (a) | Primarily includes financing activities and donations at the parent and intercompany eliminations. |
| (b) | See attachment 12 for details of items excluded from Income from Continuing Operations to compute Operating Earnings. |
Attachment 3
PUBLIC SERVICE ENTERPRISE GROUP INCORPORATED
Consolidating Statements of Operations
(Unaudited, $ Millions)
| For the Nine Months Ended September 30, 2011 | ||||||||||||||||||||
| PSEG | OTHER (a) | PSEG POWER |
PSE&G | PSEG ENERGY HOLDINGS |
||||||||||||||||
| OPERATING REVENUES |
$ | 8,443 | $ | (1,719 | ) | $ | 4,650 | $ | 5,718 | $ | (206 | ) | ||||||||
| OPERATING EXPENSES |
||||||||||||||||||||
| Energy Costs |
3,740 | (1,719 | ) | 2,335 | 3,124 | — | ||||||||||||||
| Operation and Maintenance |
1,829 | (28 | ) | 810 | 1,014 | 33 | ||||||||||||||
| Depreciation and Amortization |
739 | 14 | 166 | 548 | 11 | |||||||||||||||
| Taxes Other Than Income Taxes |
102 | — | — | 102 | — | |||||||||||||||
|
|
|
|
|
|
|
|
|
|
|
|||||||||||
| Total Operating Expenses |
6,410 | (1,733 | ) | 3,311 | 4,788 | 44 | ||||||||||||||
|
|
|
|
|
|
|
|
|
|
|
|||||||||||
| OPERATING INCOME (LOSS) |
2,033 | 14 | 1,339 | 930 | (250 | ) | ||||||||||||||
| Income from Equity Method Investments |
8 | — | — | — | 8 | |||||||||||||||
| Other Income and (Deductions) |
137 | 2 | 119 | 14 | 2 | |||||||||||||||
| Other Than Temporary Impairments |
(13 | ) | (2 | ) | (10 | ) | (1 | ) | — | |||||||||||
| Interest Expense |
(361 | ) | 9 | (134 | ) | (234 | ) | (2 | ) | |||||||||||
|
|
|
|
|
|
|
|
|
|
|
|||||||||||
| INCOME (LOSS) FROM CONTINUING OPERATIONS BEFORE INCOME TAXES |
1,804 | 23 | 1,314 | 709 | (242 | ) | ||||||||||||||
| Income Tax Benefit (Expense) |
(757 | ) | (9 | ) | (539 | ) | (287 | ) | 78 | |||||||||||
|
|
|
|
|
|
|
|
|
|
|
|||||||||||
| INCOME (LOSS) FROM CONTINUING OPERATIONS |
1,047 | 14 | 775 | 422 | (164 | ) | ||||||||||||||
| Discontinued Operations, net of tax |
96 | — | 96 | — | — | |||||||||||||||
|
|
|
|
|
|
|
|
|
|
|
|||||||||||
| NET INCOME (LOSS) |
$ | 1,143 | $ | 14 | $ | 871 | $ | 422 | $ | (164 | ) | |||||||||
|
|
|
|
|
|
|
|
|
|
|
|||||||||||
|
|
|
|||||||||||||||||||
| OPERATING EARNINGS (LOSS) |
$ | 1,152 | $ | 14 | $ | 710 | $ | 422 | $ | 6 | ||||||||||
| Lease Transaction Reserve |
(170 | ) | — | — | — | (170 | ) | |||||||||||||
| Other Reconciling Items Excluded from Continuing Operations (b) |
65 | — | 65 | — | — | |||||||||||||||
|
|
|
|
|
|
|
|
|
|
|
|||||||||||
| INCOME (LOSS) FROM CONTINUING OPERATIONS |
$ | 1,047 | $ | 14 | $ | 775 | $ | 422 | $ | (164 | ) | |||||||||
|
|
|
|
|
|
|
|
|
|
|
|||||||||||
| For the Nine Months Ended September 30, 2010 | ||||||||||||||||||||
| PSEG | OTHER (a) | PSEG POWER |
PSE&G | PSEG ENERGY HOLDINGS |
||||||||||||||||
| OPERATING REVENUES |
$ | 9,048 | $ | (2,036 | ) | $ | 4,983 | $ | 5,987 | $ | 114 | |||||||||
| OPERATING EXPENSES |
||||||||||||||||||||
| Energy Costs |
4,021 | (2,034 | ) | 2,483 | 3,572 | — | ||||||||||||||
| Operation and Maintenance |
1,862 | (18 | ) | 764 | 1,084 | 32 | ||||||||||||||
| Depreciation and Amortization |
716 | 13 | 130 | 563 | 10 | |||||||||||||||
| Taxes Other Than Income Taxes |
101 | — | — | 101 | — | |||||||||||||||
|
|
|
|
|
|
|
|
|
|
|
|||||||||||
| Total Operating Expenses |
6,700 | (2,039 | ) | 3,377 | 5,320 | 42 | ||||||||||||||
|
|
|
|
|
|
|
|
|
|
|
|||||||||||
| OPERATING INCOME |
2,348 | 3 | 1,606 | 667 | 72 | |||||||||||||||
| Income from Equity Method Investments |
12 | — | — | — | 12 | |||||||||||||||
| Other Income and (Deductions) |
128 | 9 | 90 | 20 | 9 | |||||||||||||||
| Other Than Temporary Impairments |
(9 | ) | (1 | ) | (8 | ) | — | — | ||||||||||||
| Interest Expense |
(356 | ) | 10 | (119 | ) | (239 | ) | (8 | ) | |||||||||||
| Preferred Stock Dividends |
— | 1 | — | (1 | ) | — | ||||||||||||||
|
|
|
|
|
|
|
|
|
|
|
|||||||||||
| INCOME FROM CONTINUING OPERATIONS BEFORE INCOME TAXES (c) |
2,123 | 22 | 1,569 | 447 | 85 | |||||||||||||||
| Income Tax Expense |
(856 | ) | (10 | ) | (632 | ) | (172 | ) | (42 | ) | ||||||||||
|
|
|
|
|
|
|
|
|
|
|
|||||||||||
| INCOME FROM CONTINUING OPERATIONS |
1,267 | 12 | 937 | 275 | 43 | |||||||||||||||
| Discontinued Operations, net of tax |
15 | — | 15 | — | — | |||||||||||||||
|
|
|
|
|
|
|
|
|
|
|
|||||||||||
| NET INCOME (LOSS) |
$ | 1,282 | $ | 12 | $ | 952 | $ | 275 | $ | 43 | ||||||||||
|
|
|
|
|
|
|
|
|
|
|
|||||||||||
|
|
|
|||||||||||||||||||
| OPERATING EARNINGS (LOSS) |
$ | 1,281 | $ | 12 | $ | 879 | $ | 347 | $ | 43 | ||||||||||
| Market Transition Charge |
(72 | ) | — | — | (72 | ) | — | |||||||||||||
| Other Reconciling Items Excluded from Continuing Operations (b) |
58 | — | 58 | — | — | |||||||||||||||
|
|
|
|
|
|
|
|
|
|
|
|||||||||||
| INCOME (LOSS) FROM CONTINUING OPERATIONS |
$ | 1,267 | $ | 12 | $ | 937 | $ | 275 | $ | 43 | ||||||||||
|
|
|
|
|
|
|
|
|
|
|
|||||||||||
| (a) | Primarily includes financing activities and donations at the parent and intercompany eliminations. |
| (b) | See attachment 12 for details of items excluded from Income from Continuing Operations to compute Operating Earnings. |
| (c) | Includes preferred stock dividends relating to PSE&G. |
Attachment 4
PUBLIC SERVICE ENTERPRISE GROUP INCORPORATED
Capitalization Schedule
(Unaudited, $ Millions)
| September 30, 2011 |
December 31, 2010 |
|||||||
| DEBT |
||||||||
| Commercial Paper and Loans |
$ | — | $ | 64 | ||||
| Long-Term Debt |
7,925 | 7,748 | ||||||
| Securitization Debt |
998 | 1,145 | ||||||
| Project Level, Non-Recourse Debt |
46 | 47 | ||||||
|
|
|
|
|
|||||
| Total Debt |
8,969 | 9,004 | ||||||
| STOCKHOLDERS’ EQUITY |
||||||||
| Common Stock |
4,818 | 4,807 | ||||||
| Treasury Stock |
(601 | ) | (593 | ) | ||||
| Retained Earnings |
6,198 | 5,575 | ||||||
| Accumulated Other Comprehensive Loss |
(256 | ) | (156 | ) | ||||
|
|
|
|
|
|||||
| Total Common Stockholders’ Equity |
10,159 | 9,633 | ||||||
| Noncontrolling Interests - Equity Investments |
2 | 8 | ||||||
|
|
|
|
|
|||||
| Total Equity |
10,161 | 9,641 | ||||||
|
|
|
|
|
|||||
| Total Capitalization |
$ | 19,130 | $ | 18,645 | ||||
|
|
|
|
|
|||||
Attachment 5
PUBLIC SERVICE ENTERPRISE GROUP INCORPORATED
CONDENSED CONSOLIDATED STATEMENTS OF CASH FLOWS
(Unaudited, $ Millions)
| For the Nine Months Ended September 30, | ||||||||
| 2011 | 2010 | |||||||
| CASH FLOWS FROM OPERATING ACTIVITIES |
||||||||
| Net Income |
$ | 1,143 | $ | 1,282 | ||||
| Adjustments to Reconcile Net Income to Net Cash Flows From Operating Activities: |
1,266 | 57 | ||||||
|
|
|
|
|
|||||
| NET CASH PROVIDED BY OPERATING ACTIVITIES |
2,409 | 1,339 | ||||||
|
|
|
|
|
|||||
| NET CASH USED IN INVESTING ACTIVITIES |
(827 | ) | (1,096 | ) | ||||
|
|
|
|
|
|||||
| NET CASH USED IN FINANCING ACTIVITIES |
(620 | ) | (261 | ) | ||||
|
|
|
|
|
|||||
| Net Increase (Decrease) in Cash and Cash Equivalents |
962 | (18 | ) | |||||
| Cash and Cash Equivalents at Beginning of Period |
280 | 350 | ||||||
|
|
|
|
|
|||||
| Cash and Cash Equivalents at End of Period |
$ | 1,242 | $ | 332 | ||||
|
|
|
|
|
|||||
Attachment 6
PUBLIC SERVICE ENTERPRISE GROUP INCORPORATED
Quarter-over-Quarter EPS Reconciliation
September 30, 2011 vs. September 30, 2010
(Unaudited)
Attachment 7
PUBLIC SERVICE ENTERPRISE GROUP INCORPORATED
Year-over-Year EPS Reconciliation
September 30, 2011 vs. September 30, 2010
(Unaudited)
Attachment 8
PSEG POWER LLC
Generation Measures
(Unaudited)
| GWhr Breakdown | GWhr Breakdown | |||||||||||||||
| Three Months Ended September 30, |
Nine Months Ended September 30, |
|||||||||||||||
| 2011 | 2010 | 2011 | 2010 | |||||||||||||
| Nuclear - NJ |
5,276 | 5,146 | 15,583 | 15,517 | ||||||||||||
| Nuclear - PA |
2,141 | 2,163 | 7,069 | 7,060 | ||||||||||||
|
|
|
|
|
|
|
|
|
|||||||||
| Total Nuclear |
7,417 | 7,309 | 22,652 | 22,577 | ||||||||||||
| Fossil - Coal - NJ* |
897 | 1,130 | 2,469 | 3,302 | ||||||||||||
| Fossil - Coal - PA |
1,414 | 1,548 | 4,080 | 4,314 | ||||||||||||
| Fossil - Coal - CT |
225 | 453 | 490 | 1,031 | ||||||||||||
|
|
|
|
|
|
|
|
|
|||||||||
| Total Coal |
2,536 | 3,131 | 7,039 | 8,647 | ||||||||||||
| Fossil - Oil & Natural Gas - NJ |
3,211 | 3,700 | 8,843 | 9,204 | ||||||||||||
| Fossil - Oil & Natural Gas - NY |
1,218 | 1,272 | 3,188 | 3,366 | ||||||||||||
| Fossil - Oil & Natural Gas - CT |
44 | 101 | 57 | 122 | ||||||||||||
|
|
|
|
|
|
|
|
|
|||||||||
| Total Oil & Natural Gas |
4,473 | 5,073 | 12,088 | 12,692 | ||||||||||||
|
|
|
|
|
|
|
|
|
|||||||||
| 14,426 | 15,513 | 41,779 | 43,916 | |||||||||||||
| % Generation by Fuel Type | % Generation by Fuel Type | |||||||||||||||
| Three Months Ended | Nine Months Ended | |||||||||||||||
| September 30, | September 30, | |||||||||||||||
| 2011 | 2010 | 2011 | 2010 | |||||||||||||
| Nuclear - NJ |
36 | % | 33 | % | 37 | % | 35 | % | ||||||||
| Nuclear - PA |
15 | % | 14 | % | 17 | % | 16 | % | ||||||||
|
|
|
|
|
|
|
|
|
|||||||||
| Total Nuclear |
51 | % | 47 | % | 54 | % | 51 | % | ||||||||
| Fossil - Coal - NJ* |
6 | % | 7 | % | 6 | % | 8 | % | ||||||||
| Fossil - Coal - PA |
10 | % | 10 | % | 10 | % | 10 | % | ||||||||
| Fossil - Coal - CT |
2 | % | 3 | % | 1 | % | 2 | % | ||||||||
|
|
|
|
|
|
|
|
|
|||||||||
| Total Coal |
18 | % | 20 | % | 17 | % | 20 | % | ||||||||
| Fossil - Oil & Natural Gas - NJ |
22 | % | 24 | % | 21 | % | 21 | % | ||||||||
| Fossil - Oil & Natural Gas - NY |
9 | % | 8 | % | 8 | % | 8 | % | ||||||||
| Fossil - Oil & Natural Gas - CT |
0 | % | 1 | % | 0 | % | 0 | % | ||||||||
|
|
|
|
|
|
|
|
|
|||||||||
| Total Oil & Natural Gas |
31 | % | 33 | % | 29 | % | 29 | % | ||||||||
|
|
|
|
|
|
|
|
|
|||||||||
| 100 | % | 100 | % | 100 | % | 100 | % | |||||||||
| * | Includes Pumped Storage. Pumped Storage accounted for <1% of total generation for the three and nine months ended September 30, 2011 and 2010. |
Attachment 9
PUBLIC SERVICE ELECTRIC & GAS COMPANY
Retail Sales and Revenues
(Unaudited)
September 30, 2011
Electric Sales and Revenues
| Sales (millions kwh) |
Three Months Ended |
Change vs. 2010 |
Nine Months Ended |
Change vs. 2010 |
||||||||||||
| Residential |
4,683 | -1.8 | % | 11,119 | -1.6 | % | ||||||||||
| Commercial & Industrial |
7,874 | -2.6 | % | 21,868 | -1.3 | % | ||||||||||
| Street Lighting |
61 | -25.4 | % | 239 | -10.1 | % | ||||||||||
| Interdepartmental |
3 | -3.1 | % | 8 | 0.4 | % | ||||||||||
|
|
|
|
|
|
|
|
|
|||||||||
| Total |
12,621 | -2.5 | % | 33,234 | -1.5 | % | ||||||||||
|
|
|
|
|
|
|
|
|
|||||||||
| Revenue (in millions) |
||||||||||||||||
| Residential |
$ | 771 | -6.8 | % | $ | 1,846 | -2.5 | % | ||||||||
| Commercial & Industrial |
706 | -12.0 | % | 1,813 | -6.9 | % | ||||||||||
| Street Lighting |
17 | -4.1 | % | 54 | -3.6 | % | ||||||||||
| Other Operating Revenues* |
106 | -3.3 | % | 294 | 5.9 | % | ||||||||||
|
|
|
|
|
|
|
|
|
|||||||||
| Total |
$ | 1,600 | -8.9 | % | $ | 4,007 | -4.0 | % | ||||||||
|
|
|
|
|
|
|
|
|
|||||||||
| Weather Data |
Three Months Ended |
Change vs. 2010 |
Nine Months Ended |
Change vs. 2010 |
||||||||||||
|
|
|
|||||||||||||||
| THI Hours - Actual |
14,690 | 1.3 | % | 19,897 | -0.5 | % | ||||||||||
| THI Hours - Normal |
11,053 | 14,898 | ||||||||||||||
| * | Primarily sales of Non-Utility Generator energy to PJM and Transmission related revenues. |
Attachment 10
PUBLIC SERVICE ELECTRIC & GAS COMPANY
Retail Sales and Revenues
(Unaudited)
September 30, 2011
Gas Sold and Transported
| Three Months Ended |
Change vs. 2010 |
Nine Months Ended |
Change vs. 2010 |
|||||||||||||
| Sales (millions therms) |
||||||||||||||||
| Residential Sales |
92 | 9.0 | % | 939 | 6.0 | % | ||||||||||
| Commercial & Industrial - Firm Sales |
34 | 2.9 | % | 345 | 3.4 | % | ||||||||||
| Commercial & Industrial - Interr. & Cogen |
50 | -18.3 | % | 128 | -6.6 | % | ||||||||||
|
|
|
|
|
|
|
|
|
|||||||||
| Total |
176 | -1.5 | % | 1,412 | 4.1 | % | ||||||||||
|
|
|
|
|
|
|
|
|
|||||||||
| Gas Transported - Firm Sales |
64 | 15.5 | % | 392 | 20.8 | % | ||||||||||
| Gas Transported - Non-Firm |
284 | -1.2 | % | 713 | -2.2 | % | ||||||||||
| Revenue (in millions) |
||||||||||||||||
| Residential Sales |
$ | 57 | -10.7 | % | $ | 584 | -19.5 | % | ||||||||
| Commercial & Industrial - Firm Sales |
21 | -1.7 | % | 219 | -7.3 | % | ||||||||||
| Commercial & Industrial - Interr. & Cogen |
26 | -20.1 | % | 70 | -9.2 | % | ||||||||||
| Other Operating Revenues* |
41 | 13.8 | % | 116 | 4.1 | % | ||||||||||
|
|
|
|
|
|
|
|
|
|||||||||
| Total |
$ | 145 | -5.6 | % | $ | 989 | -14.0 | % | ||||||||
|
|
|
|
|
|
|
|
|
|||||||||
| Gas Transported |
96 | 0.1 | % | 722 | 9.3 | % | ||||||||||
| Three Months Ended |
Change vs. 2010 |
Nine Months Ended |
Change vs. 2010 |
|||||||||||||
| Weather Data |
||||||||||||||||
| Degree Days - Actual |
19 | ** | 2,994 | 8.6 | % | |||||||||||
| Degree Days - Normal |
35 | 3,068 | ||||||||||||||
| * | Primarily Appliance Service. |
| ** | There were only 2 degree days in 2010. |
Attachment 11
PUBLIC SERVICE ENTERPRISE GROUP INCORPORATED
Statistical Measures
(Unaudited)
| For the Three Months Ended September 30 |
For the Nine Months Ended September 30 |
|||||||||||||||
| 2011 | 2010 | 2011 | 2010 | |||||||||||||
| Weighted Average Common Shares Outstanding (000’s) |
||||||||||||||||
| Basic |
505,909 | 505,945 | 505,959 | 506,001 | ||||||||||||
| Diluted |
506,999 | 506,968 | 506,963 | 507,068 | ||||||||||||
| Stock Price at End of Period |
$ | 33.37 | $ | 33.08 | ||||||||||||
| Dividends Paid per Share of Common Stock |
$ | 0.3425 | $ | 0.3425 | $ | 1.0275 | $ | 1.0275 | ||||||||
| Dividend Payout Ratio* |
47.7 | % | 42.9 | % | ||||||||||||
| Dividend Yield |
4.1 | % | 4.1 | % | ||||||||||||
| Price/Earnings Ratio* |
11.6 | 10.4 | ||||||||||||||
| Rate of Return on Average Common Equity* |
14.7 | % | 17.8 | % | ||||||||||||
| Book Value per Common Share |
$ | 20.08 | $ | 18.89 | ||||||||||||
| Market Price as a Percent of Book Value |
166 | % | 175 | % | ||||||||||||
| Total Shareholder Return |
3.3 | % | 6.7 | % | 8.3 | % | 2.8 | % | ||||||||
| * | Calculation based on Operating Earnings for the 12 month period ended. |
Attachment 12
PUBLIC SERVICE ENTERPRISE GROUP INCORPORATED
Reconciling Items Excluded from Continuing Operations to Compute Operating Earnings
(Unaudited)
| For the Three Months Ended | For the Nine Months Ended | |||||||||||||||
| September 30, | September 30, | |||||||||||||||
| Pro-forma Adjustments, net of tax |
2011 | 2010 | 2011 | 2010 | ||||||||||||
| Earnings Impact ($ Millions) | ||||||||||||||||
| Gain (Loss) on Nuclear Decommissioning Trust (NDT) |
||||||||||||||||
| Fund Related Activity (PSEG Power) |
$ | 7 | $ | 10 | $ | 49 | $ | 30 | ||||||||
| Gain (Loss) on Mark-to-Market (MTM) (PSEG Power) |
8 | 16 | 16 | 28 | ||||||||||||
| Lease Transaction Reserves (Energy Holdings) |
(170 | ) | — | (170 | ) | — | ||||||||||
| Market Transition Charge Refund (PSE&G) |
— | — | — | (72 | ) | |||||||||||
|
|
|
|
|
|
|
|
|
|||||||||
| Total Pro-forma adjustments |
$ | (155 | ) | $ | 26 | $ | (105 | ) | $ | (14 | ) | |||||
|
|
|
|
|
|
|
|
|
|||||||||
| Fully Diluted Average Shares Outstanding (in Millions) |
507 | 507 | 507 | 507 | ||||||||||||
|
|
|
|
|
|
|
|
|
|||||||||
| Per Share Impact (Diluted) | ||||||||||||||||
| Gain (Loss) on NDT Fund Related Activity (PSEG Power) |
$ | 0.01 | $ | 0.02 | $ | 0.10 | $ | 0.06 | ||||||||
| Gain (Loss) on MTM (PSEG Power) |
0.02 | 0.03 | 0.03 | 0.05 | ||||||||||||
| Lease Transaction Reserves (Energy Holdings) |
(0.34 | ) | — | (0.34 | ) | — | ||||||||||
| Market Transition Charge Refund (PSE&G) |
— | — | — | (0.14 | ) | |||||||||||
|
|
|
|
|
|
|
|
|
|||||||||
| Total Pro-forma adjustments |
$ | (0.31 | ) | $ | 0.05 | $ | (0.21 | ) | $ | (0.03 | ) | |||||
|
|
|
|
|
|
|
|
|
|||||||||