Attached files
| file | filename |
|---|---|
| 8-K - FORM 8-K - GAIN Capital Holdings, Inc. | d247665d8k.htm |
| EX-99.1 - PRESS RELEASE OF GAIN CAPITAL HOLDINGS, INC., OCTOBER 27, 2011 - GAIN Capital Holdings, Inc. | d247665dex991.htm |
 3
rd
Quarter 2011
Financial and Operating Results
October 27, 2011
Exhibit 99.2 |
 Special Note Regarding Forward-Looking Information
In addition to historical information, this presentation contains
"forward-looking" statements that reflect management's
expectations for the future. A variety of important factors could cause
results to differ materially from such statements. These factors are
noted
throughout
GAIN
Capital’s
annual
report
on
Form
10-K,
as
filed with the Securities
and
Exchange
Commission
on
March
30,
2011,
and
include,
but are not limited to, the
actions
of
both
current
and
potential
new
competitors,
fluctuations in market trading
volumes,
financial
market
volatility,
evolving
industry
regulations,
errors or malfunctions in
our systems or technology, rapid changes in technology, effects of inflation,
customer trading patterns, the success of our products and service
offerings, our ability to continue to innovate and meet the demands of our
customers for new or enhanced products, our ability to successfully
integrate assets and companies we have acquired, changes in tax policy or
accounting rules, fluctuations in foreign exchange rates, adverse changes or
volatility in interest rates, as well as general economic, business, credit and
financial market
conditions,
internationally or nationally, and our ability to continue paying a
quarterly dividend in light of future financial performance and financing needs.
The forward-looking statements included herein represent GAIN
Capital’s views as of the date of
this
release.
GAIN
Capital
undertakes
no
obligation
to
revise
or
update
publicly
any
forward-looking statement for any reason unless required by law.
2 |
 Overview
Glenn Stevens, CEO |
 3Q
2011 Overview •
Q3 market conditions conducive to FX trading
•
High levels of client activity and engagement throughout
the quarter
•
Strong financial and operating results, with year-over-
year net revenue growth of approximately 5% and an
EBITDA margin of approximately 29% |
 3 Quarter 2011 Results Overview
5
•
3Q 2011 Financial Summary
•
Net Revenue: $53.9 million
•
EBITDA
(1)
: $15.6 million (29% margin)
•
Adjusted Net Income
(2)
: $9.3 million (17% margin)
•
Adjusted EPS (Diluted)
(3)
: $0.24
•
GAAP EPS (Diluted): $0.20
•
Operating Metrics
(4)
•
Total trading volume up 99% to $708 billion
•
Retail volume increased 44% to $448 billion
•
Institutional volume grew to $260 billion
•
Traded retail accounts for trailing 12 months up 8% to 65,401
•
Funded retail accounts up 9% to 77,013
•
Client assets of $286 million, up 29%
rd
Note: All growth compared to 3Q 2010.
(1)
EBITDA is a non-GAAP financial measure that represents our earnings before interest, taxes,
depreciation and amortization. A reconciliation of net income to EBITDA and EBITDA margin is available in the appendix to this presentation.
(2)
Adjusted net income is a non-GAAP financial measure that prior to the closing of our initial public
offering in December 2010 represented our net income/(loss) excluding the change in fair value of the embedded derivative in our preferred stock
and purchase intangible amortization. With the consummation of our IPO, all outstanding shares of
our preferred stock converted into common stock and in 2011 and in future periods adjusted net income will no longer reflect an adjustment
related to the embedded derivative. A reconciliation of net income to adjusted net income and adjusted
net income margin is available in the appendix to this presentation.
(3)
Reconciliation of EPS to adjusted EPS available in appendix.
(4)
Definitions for all our operating metrics are available in the appendix to this presentation.
|
 Retail
Trading
Volume
by
Geography
(1)
6
9 Mos. Ended 9/30/10
9 Mos. Ended 9/30/11
Note: Dollars in billions.
(1)
Definitions for all our operating metrics are available in the appendix to this
presentation. (2)
Source: Sankar, S. Retail FX: Entering a Phase of Mature Growth.
Boston: Celent, 2011. Global Retail FX Market (FY 2010)
(2)
Americas
56%
Europe
15%
Rest of World
1%
Americas
23%
Europe
16%
Rest of World
2%
Americas
20%
Asia-Pacific
40%
Europe
30%
Rest of
World
10%
Asia-Pacific
59%
Asia-Pacific
28%
Country/Region
9 Mos. 9/30/10
9 Mos. 9/30/11
% Growth
Americas
$537.9
$283.0
(47%)
Asia-Pacific
265.3
712.0
168%
Europe
145.8
191.5
31%
Rest of World
9.4
21.0
122%
Total Retail Trading Volume
$958.5
$1,207.5
26% |
 International Expansion
•
Middle East
–
Enhanced Arabic offering
–
Increased indirect sales team
–
268% growth in volume (to $97B)
•
China Region
–
Hong Kong presence
–
CBRC license; new Beijing representative office
–
307% growth in volume (to $77B)
•
Korea
–
Seoul representative office
–
Expansion primarily via omnibus white-labels
–
124% growth in volume (to $109B)
•
Japan
–
Tokyo operation
–
125% growth in volume (to $169B)
•
Australia/NZ
–
Sydney office
–
98% growth in volume (to $64B)
•
Europe
–
Expanding
to
other
large,
high-growth
European
markets
i.e.
Germany
7
Note: Volume growth compared to 9 months ended September 2010.
|
 New
Products & Services –
GAIN GTX specialty execution desk operational
–
Metals & NDFs now offered on GTX institutional ECN
–
New commodity CFD products introduced via FOREX.com
•
Range of CFDs now available to international retail customers -
Equity
Indices, Energies, Metals, Softs/Ags
•
Approximately 25% of active accounts traded CFDs in September 2011
–
iPad app released
•
Nearly 600% increase in mobile trading volume over last 12 months
•
Mobile trades represented 12% of volume and 14% of all retail trades in
September
8
•
15% of international retail volume |
 Transparent Pricing & Execution
9
•
Execution Scorecard updated monthly;
2011 Scorecard now available with nine
months of historical data
•
Internal focus on improving execution
quality –
recent technology investments
reduced average execution speed by
30% to .05 seconds
September
2011
(1)
(1)
FOREX.com's
execution
statistics
represent
orders
executed
on
FOREX.com's
FOREXTrader
platforms
during
market
hours
between
August
31,
2011
17:00
ET
and
September
30,
2011
17:00
ET
We
believe
our
voluntary
execution
and
pricing
stats
demonstrate
our
execution
advantage and provide customers with greater transparency
|
 New
Transparency Initiative 10
•
Compares FOREX.com midpoint
prices to an independent FX rate
feed from Interactive Data
Corporation, GTIS
•
GTIS is a proxy for the larger FX
market -
represents the best bid
and offer from over 150 global
contributors, including many of the
world's leading banks
•
Complements FOREX.com’s
existing pricing info and execution
scorecard
Third party price comparison demonstrates the accuracy of
FOREX.com pricing relative to the larger OTC FX marketplace
|
 Strong Liquidity and Capital Allocation
•
$61mm
of
average
excess
net
capital
(1)
•
Increased revolver availability from $20mm to
$50mm
•
850,121 shares repurchased for
approximately $5mm to date at an average
price of $5.88
•
$0.05 per share quarterly dividend
announced
–
Record Date: December 10
–
Payment Date: December 23
11
(1)
For the quarter ended September 30, 2011. |
 Financial and Operating Metric Review
Henry Lyons, CFO |
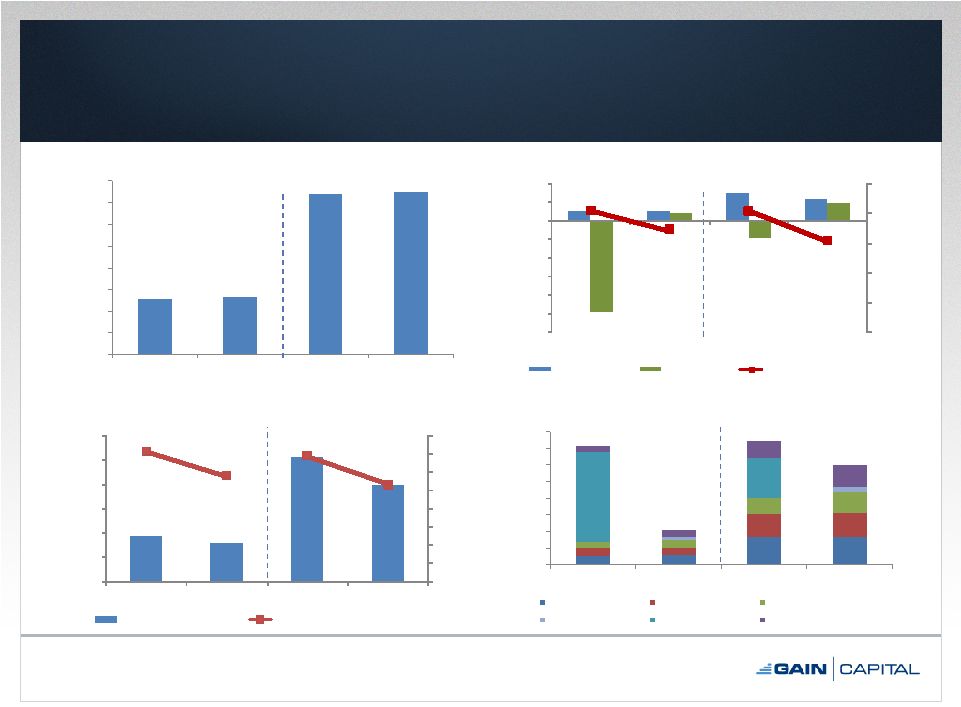 Financial Results
13
Note: Dollars in millions.
(1)
Reconciliation
of
net
income
to
adjusted
net
income
and
adjusted
net income margin available in appendix.
(2)
Adjusted
EBITDA
is
a
non-GAAP
financial
measure
that
prior
to
the
closing
of
our
initial
public
offering
in
December
2010
represented
our
earnings
before
interest, taxes,
depreciation and amortization and excluded the change in fair value of the embedded
derivative in our preferred stock. With the consummation of our IPO, all outstanding shares of
our
preferred
stock
converted
into
common
stock.
Accordingly,
in
2011
we
no
longer
adjusted
EBITDA
for
the
embedded
derivative.
A reconciliation of net income to adjusted
EBITDA and adjusted EBITDA margin is available in the appendix to this presentation.
$51.5
$53.9
$148.1
$149.9
$0.0
$20.0
$40.0
$60.0
$80.0
$100.0
$120.0
$140.0
$160.0
2010
2011
2010
2011
Revenue
$11.4
$11.6
$34.0
$34.9
$9.2
$8.8
$27.7
$28.0
$6.3
$9.9
$18.6
$25.5
$2.7
$6.4
$109.2
$48.9
$7.4
$9.2
$20.0
$25.1
$143.5
$42.2
$149.2
$119.9
$0.0
$20.0
$40.0
$60.0
$80.0
$100.0
$120.0
$140.0
$160.0
2010
2011
2010
2011
Total Expenses
Comp & Benefits
Marketing
Trading
Purchase Intangible Amort.
Embedded Derivative
All Other
Q3
9 Months
Q3
Q3
9 Months
Q3
9 Months
Q2
Q2
$10.5
$9.3
$30.0
$23.0
($98.7)
$7.6
($18.9)
$19.0
20%
17%
20%
15%
0%
5%
10%
15%
20%
25%
(120.0)
(100.0)
(80.0)
(60.0)
(40.0)
(20.0)
-
20.0
40.0
2010
2011
2010
2011
GAAP & Adjusted Net Income & Margin %
(1)
Adjusted Net Income
GAAP Net Income
Adjusted Net Income Margin %
$18.4
$15.6
$51.3
$39.7
36%
29%
34%
26%
0%
5%
10%
15%
20%
25%
30%
35%
40%
$0.0
$10.0
$20.0
$30.0
$40.0
$50.0
$60.0
2010
2011
2010
2011
EBITDA (Adjusted EBITDA in 2010) & Margin %
(2)
EBITDA/Adjusted EBITDA
EBITDA/Adjusted EBITDA Margin %
9 Months |
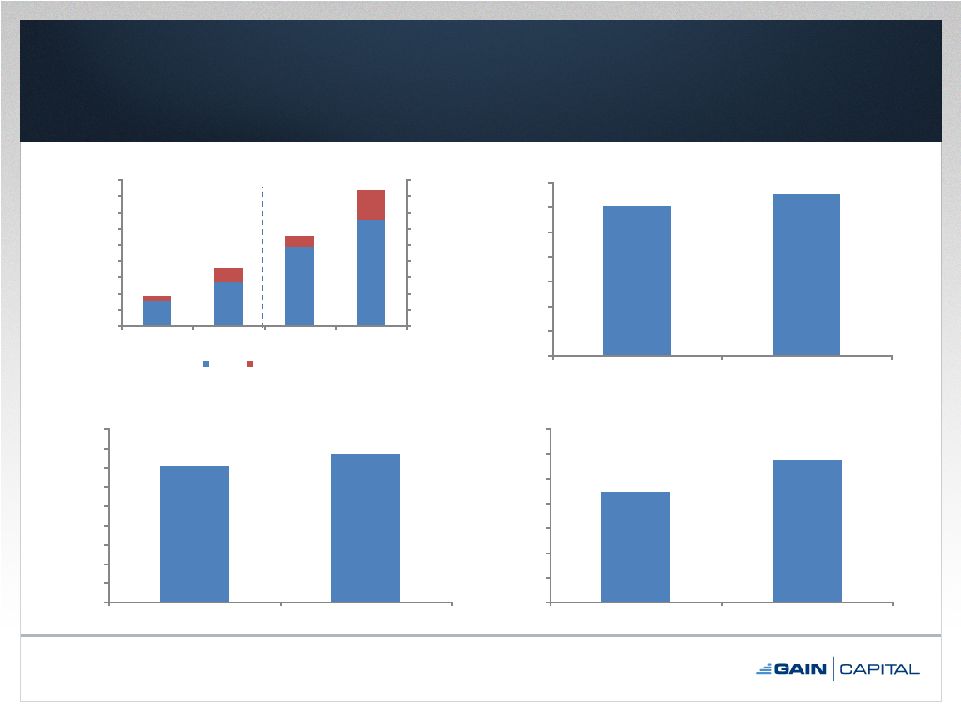 14
Note: Trading volume in billions. Client assets in millions.
(1)
Definitions for all our operating metrics are available in the appendix to this
presentation. (2)
For periods ending September 30.
(3)
As of September 30.
Q3
9 Months
$311.6
$447.9
$958.5
$1,207.5
$43.3
$260.0
$135.4
$467.5
$354.9
$707.9
$1,093.9
$1,675.0
$0.0
$200.0
$400.0
$600.0
$800.0
$1,000.0
$1,200.0
$1,400.0
$1,600.0
$1,800.0
$0.0
$200.0
$400.0
$600.0
$800.0
$1,000.0
$1,200.0
$1,400.0
$1,600.0
$1,800.0
2010
2011
2010
2011
Total Trading Volume
Retail
Institutional
60,359
65,401
-
10,000
20,000
30,000
40,000
50,000
60,000
70,000
2010
2011
Traded Retail Accounts (Last 12 Months)
70,858
77,013
0
10,000
20,000
30,000
40,000
50,000
60,000
70,000
80,000
90,000
2010
2011
Funded Retail Accounts
$222.4
$286.4
$0.0
$50.0
$100.0
$150.0
$200.0
$250.0
$300.0
$350.0
2010
2011
Client Assets
(3)
(2)
(2)
(3)
Operating Metrics
(1) |
 Operating Metrics (cont.)
(1)
15
Note: Trades in millions.
(1)
Definitions for all our operating metrics are available in the appendix to this
presentation. (2)
For periods ending September 30.
7.5
10.9
23.6
29.3
-
5.0
10.0
15.0
20.0
25.0
30.0
35.0
2010
2011
2010
2011
Trades
(2)
Q3
9 Months
$0.0
$20.0
$40.0
$60.0
$80.0
$100.0
$120.0
$140.0
$160.0
$180.0
Retail Trading Revenue per Million (Quarterly)
Retail Trading Revenue per Million (Last Twelve Months)
Retail Trading Revenue per Million
(2)
$121.6
$164.2
$116.4
$130.4
$146.2
$118.0
Q3 09
Q4 09
Q1 10
Q2 10
Q3 10
Q4 10
Q1 11
Q2 11
Q3 11 |
 Closing Remarks
•
Continued financial and operational strength as
evidenced Q3 data
•
Ongoing international expansion
•
New products being developed and released
•
Providing customers increased transparency into our
business
•
Strong balance sheet for M&A and shareholder return
16 |
 Appendix |
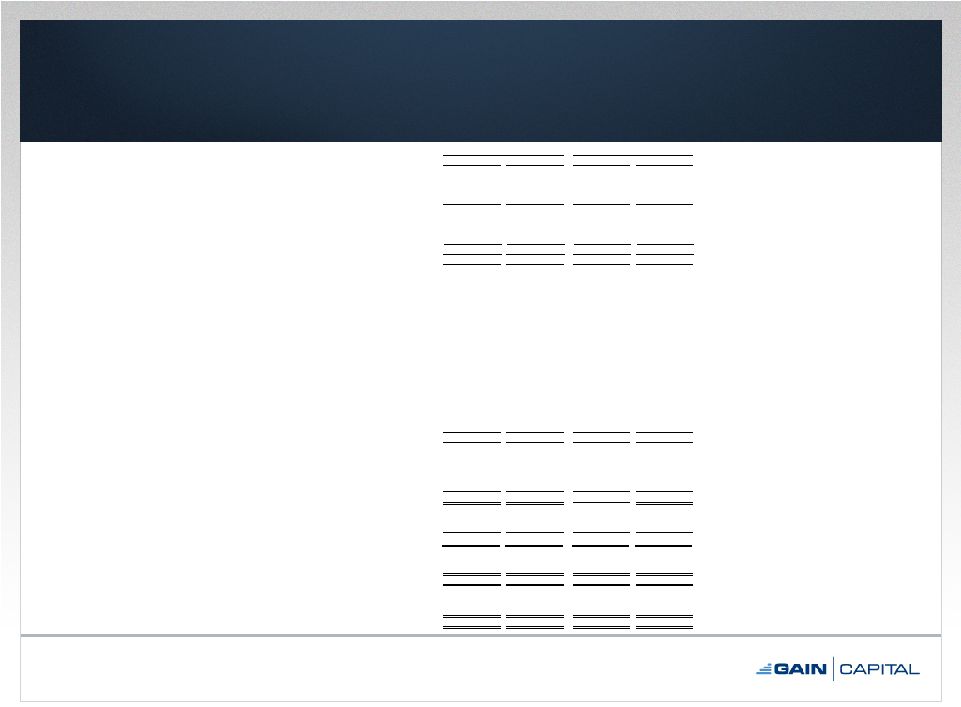 Condensed Consolidated Statements of Operations
18
2011
2010
2011
2010
Revenue
Trading revenue
52.2
$
51.2
$
146.1
$
147.7
$
Other revenue
2.0
0.7
4.6
1.9
Total non-interest revenue
54.2
51.9
150.7
149.6
Interest revenue
0.1
0.1
0.3
0.2
Interest expense
(0.4)
(0.5)
(1.1)
(1.7)
Total net interest expense
(0.3)
(0.4)
(0.8)
(1.5)
Net Revenue
53.9
51.5
149.9
148.1
Expenses
Compensation and benefits
11.6
11.4
34.9
34.0
Selling and marketing
8.8
9.2
28.0
27.7
Trading expenses and commissions
9.9
6.3
25.5
18.6
Bank fees
1.3
1.0
3.4
3.2
Depreciation and amortization
1.0
0.9
2.9
2.5
Purchase intangible amortization
2.7
-
6.4
-
Communication and data processing
0.7
0.8
2.1
2.2
Occupancy and equipment
1.2
1.1
3.5
3.0
Bad debt provision
0.2
0.2
0.8
0.5
Professional fees
1.9
0.5
3.8
1.5
Product development, software and maintenance
1.0
0.9
3.0
2.5
Change in fair value of convertible,
redeemable preferred stock embedded
derivative
(1)
-
109.2
-
48.9
Other
1.9
2.0
5.6
4.6
Total
42.2
143.5
119.9
149.2
Income before income tax expense
and equity in earnings of equity method
investment
11.7
(92.0)
30.0
(1.1)
Income tax expense
4.1
6.7
11.0
18.2
Net income
7.6
(98.7)
19.0
(19.3)
Net loss applicable to
non-controlling interest
-
-
-
(0.4)
Net income applicable to GAIN
Capital Holdings,Inc.
7.6
$
(98.7)
$
19.0
$
(18.9)
$
Earnings per share
(2)
:
Basic
0.22
$
(32.38)
$
0.55
$
(6.31)
$
Diluted
0.20
$
(32.38)
$
0.49
$
(6.31)
$
Weighted averages shares outanding
(2)
Basic
34,625,525
3,047,974
34,313,987
3,001,057
Diluted
38,916,038
38,839,487
39,025,699
37,375,690
Three Months Ended September 30,
Nine Months Ended September 30,
Note: Dollars in millions.
(1)
For the periods prior to the closing of our initial public offering in December 2010, in accordance
with Financial Accounting Standards Board Accounting Standards Codification 815, Derivatives and Hedging, we accounted for an
embedded derivative liability attributable to the redemption feature of our previously outstanding
preferred stock and amortization of purchase intangibles. This redemption feature and the associated embedded derivative liability was no
longer required to be recognized following the conversion of all of our preferred stock to common stock
in connection with our IPO. (2)
In connection with the completion of our initial public offering in December 2010 (the
“IPO”), the our board of directors approved a 2.29-for-1 stock split of our common stock to be effective immediately prior to the completion of the IPO.
The 2.29-for-1 stock split, after giving effect to the receipt by us of 407,692 shares of
common stock from all of our pre-IPO common stockholders (on a pro-rata basis) in satisfaction of previously outstanding obligations owed by such
stockholders to us, resulted in an effective stock split of 2.26-for-1. Accordingly, all
references to share and per share data have been retroactively restated for the three and nine months ended September 30, 2010 to reflect the effective
2.26-for-1 stock split.
: |
 Balance Sheet
19
Note: Dollars in millions.
September 30,
December 31,
2011
2010
Assets
Cash
and
cash
equivalents
371.2
$
284.2
$
Short term investments
0.1
0.1
Trading securities
-
20.1
Receivables from brokers
78.6
98.1
Property and
equipment, net
7.3
7.3
Prepaid assets
10.4
9.9
Goodwill
3.1
3.1
Intangible
assets,
net
13.0
9.1
Other
assets
11.5
11.2
Total
assets
495.2
$
443.1
$
Liabilities
and
shareholders'
equity
Payables to brokers, dealers, FCM'S and other regulated entities
15.6
$
6.1
$
Payable to customers
270.9
250.6
Accrued compensation & benefits payable
3.1
5.1
Accrued expenses and other liabilities
16.6
10.5
Income tax payable
7.0
2.6
Notes payable
10.5
18.4
Total
liabilities
323.7
$
293.3
$
Shareholders' equity
171.5
149.8
Total
liabilities
and
shareholders' equity
495.2
$
443.1
$ |
 Adjusted Net Income / Margin Reconciliation
20
Note: Dollars in millions.
(1)
In connection with the completion of our initial public offering in
December 2010 (the “IPO”), the our board of directors approved a 2.29-for-1 stock split of our common stock to be
effective immediately prior to the completion of the IPO. The
2.29-for-1 stock split, after giving effect to the receipt by us of 407,692 shares of common stock from all of our pre-IPO
common stockholders (on a pro-rata basis) in satisfaction of
previously outstanding obligations owed by such stockholders to us, resulted in an effective stock split of 2.26-for-1.
Accordingly, all references to share and per share data have been
retroactively restated for the three and nine months ended September 30, 2010 to reflect the effective 2.26-for-1
stock split.
Three Months Ended September 30,
Nine Months Ended September 30,
2011
2010
2011
2010
Revenue
53.9
$
51.5
$
149.9
$
148.1
$
Net income/(loss) applicable to GAIN
Capital Holdings, Inc.
7.6
(98.7)
19.0
(18.9)
Change in fair value of convertible,
redeemable preferred stock embedded
derivative
-
109.2
-
48.9
Plus: Purchase intangible amortization (net of tax)
1.7
-
4.0
-
Adjusted Net Income
9.3
$
10.5
$
23.0
$
30.0
$
Adjusted Earnings per Share
(1)
Basic
0.27
$
3.46
$
0.67
$
10.01
$
Diluted
0.24
$
0.27
$
0.59
$
0.80
$
Net Income Margin %
14%
NM
13%
NM
Adjusted Net Income Margin %
17%
20%
15%
20% |
 EBITDA / Adjusted EBITDA / Margin Reconciliation
21
Note: Dollars in millions.
(1)
EBITDA is not adjusted in 2011 since the embedded derivative relating to our
previously outstanding preferred stock was extinguished in connection with
our IPO. Three Months Ended September 30,
Nine Months Ended September 30,
2011
2010
2011
2010
Revenue
53.9
$
51.5
$
149.9
$
148.1
$
Interest on Note Payable
0.2
0.3
0.4
1.0
Revenue (ex. Interest on Note)
54.1
$
51.8
$
150.3
$
149.1
$
Net income/(loss) applicable to GAIN
Capital Holdings, Inc.
7.6
$
(98.7)
$
19.0
$
(18.9)
$
Change in fair value of convertible,
redeemable preferred stock embedded
derivative
-
109.2
-
48.9
Plus: Depreciation & amortization
1.0
0.9
2.9
2.5
Plus: Purchase intangible amortization
2.7
-
6.4
-
Plus: Interest expense of note payable
0.2
0.3
0.4
1.0
Plus: Income tax expense
4.1
6.7
11.0
18.2
Less: Net loss applicable to
non-controlling interest
-
-
-
(0.4)
EBITDA/Adjusted EBITDA
(1)
15.6
$
18.4
$
39.7
$
51.3
$
EBITDA/Adjusted EBITDA Margin %
(1)
29%
36%
26%
34% |
 Adjusted EPS (Diluted) Reconciliation
22
(1)
Net of tax.
(2)
In
connection
with
the
completion
of
our
initial
public
offering
in
December
2010
(the
“IPO”),
the
our
board
of
directors
approved
a
2.29-for-1
stock
split
of
our
common
stock
to
be
effective immediately prior to the completion of the IPO. The
2.29-for-1 stock split, after giving effect to the receipt by us of 407,692 shares of common stock from all of our pre-IPO
common stockholders (on a pro-rata basis) in satisfaction of previously
outstanding obligations owed by such stockholders to us, resulted in an effective stock split of 2.26-for-1.
Accordingly, all references to share and per share data have been retroactively
restated for the three and nine months ended September 30, 2010 to reflect the effective 2.26-for-1
stock split.
Three Months Ended September 30,
Nine Months Ended September 30,
2011
2010
2011
2010
GAAP Earnings per Share (Diluted)
0.20
$
(32.38)
$
0.49
$
(6.31)
$
Change in fair value of convertible,
redeemable preferred stock embedded
derivative
-
32.65
-
7.11
Plus: Purchase intangible amortization
(1)
0.04
-
0.10
-
Adjusted Earnings per Share (Diluted)
(2)
0.24
$
0.27
$
0.59
$
0.80
$
|
 Q3
2011 Financial Summary 23
Note: Dollars in millions, except per share data.
(1)
See page 21 for a reconciliation of GAAP net income to adjusted EBITDA.
EBITDA is not adjusted in 2011 since the embedded derivative relating to our
previously outstanding preferred stock was extinguished in connection with our IPO.
(2)
See page 20 for a reconciliation of GAAP net income to adjusted net income.
(3)
See page 22 for a reconciliation of GAAP EPS to adjusted EPS.
3 Mos. Ended September 30,
9 Mos. Ended September 30,
'11 v '10 % Change
2011
2010
2011
2010
Q3
YTD
Revenue
$53.9
$51.5
$149.9
$148.1
5%
1%
Interest Expense on Note Payable
0.2
0.3
0.4
1.0
(47%)
(55%)
Revenue (ex. Interest on Note)
$54.1
$51.8
$150.3
$149.1
4%
1%
Operating Expenses
38.5
33.4
110.6
97.8
15%
13%
EBITDA/Adjusted
EBITDA
(1)
$15.6
$18.4
$39.7
$51.3
(15%)
(23%)
GAAP Net Income
$7.6
($98.7)
$19.0
($18.9)
(108%)
(201%)
Adjusted Net Income
(2)
9.3
10.5
23.0
30.0
(11%)
(23%)
GAAP EPS (Diluted)
$0.20
($32.38)
$0.49
($6.31)
(101%)
(108%)
Adjusted EPS (Diluted)
(3)
0.24
0.27
0.59
0.80
(12%)
(26%)
EBITDA/Adjusted EBITDA Margin %
(1)
29%
36%
26%
34%
(7 pts)
(8 pts)
Net Income Margin %
14%
NM
13%
NM
NA
NA
Adjusted Net Income Margin %
(2)
17%
20%
15%
20%
(3 pts)
(5 pts) |
 Q3
2011 Operating Metrics 24
Note: Dollars in millions, except retail trading revenue per million.
(1)
Average calculated using excess net capital balance at month-end.
3rd Quarter
9 Months
'11 v '10 % Change
2011
2010
2011
2010
Q3
YTD
For Period Ending September 30,
Total Trading Volume (billions)
$707.9
$354.9
$1,675.0
$1,093.9
99%
53%
Retail
447.9
311.6
1,207.5
958.5
44%
26%
Institutional
260.0
43.3
467.5
135.4
500%
245%
Traded Retail Accounts (Period)
36,927
32,976
56,247
52,467
12%
7%
Traded Retail Accounts (Last 12 Months)
65,401
60,359
65,401
60,359
8%
8%
New Retail Accounts
7,852
8,879
24,764
29,493
(12%)
(16%)
Net Deposits from Retail Customers
$64.8
$68.7
$189.9
$206.4
(6%)
(8%)
Trades
10,949,800
7,535,907
29,339,268
23,586,007
45%
24%
Retail Trading Revenue per Million
$116.4
$164.2
$121.0
$154.1
(29%)
(21%)
As of September 30,
Funded Retail Accounts
77,013
70,858
77,013
70,858
9%
9%
Client Assets
$286.4
$222.4
$286.4
$222.4
29%
29%
Average Excess Net Capital
(1)
$60.7
$63.7
$55.5
$61.2
(5%)
(9%) |
 Monthly
Operating
Metrics
(1)
25
Note: Dollars in millions.
(1)
Definitions for all our operating metrics are available in the appendix to this
presentation. (2)
As of period ended.
(3)
For period ended.
(4)
Excludes 13,091 accounts from GAIN Capital’s acquisition of CMS Forex.
(5)
Excludes 1,650 accounts from GAIN Capital’s acquisition of dbFX.
Funded
New Retail
Client
Month
Retail Accts.
(2)
Accounts
(3)
Assets
(2)
Oct 2010
81,793
3,345
(4)
$241.6
Nov 2010
84,985
3,054
263.2
Dec 2010
85,562
2,525
256.7
Jan 2011
86,236
2,902
277.0
Feb 2011
87,049
2,874
286.3
Mar 2011
85,698
3,132
283.0
Apr 2011
80,915
2,801
239.2
May 2011
79,623
2,775
(5)
290.8
Jun 2011
78,379
2,428
293.1
Jul 2011
78,082
2,350
283.4
Aug 2011
77,140
2,886
303.7
Sep 2011
77,013
2,616
286.4
|
 Quarterly
Operating
Metrics
(1)
26
Note: For period ended. Volume in billions. Net deposits in
millions. (1)
Definitions for all our operating metrics are available in the appendix to this
presentation. Net Deposits
Volume
Traded Retail
From Retail
Quarter
Retail
Institutional
Accts. (Period)
Customers
Trades
Q4 10
$366.3
$103.9
36,241
$61.4
8,161,012
Q1 11
402.5
110.1
36,570
60.7
9,025,828
Q2 11
357.2
97.4
36,868
64.3
9,363,640
Q3 11
447.9
260.0
36,927
64.8
10,949,800
|
 Definition of Metrics
•
Total Trading Volume
–
Represents the U.S. dollar equivalent of notional amounts traded
•
Traded Retail Accounts
–
Retail accounts who executed a transaction during a given period
•
Funded Retail Accounts
–
Retail accounts who maintain a cash balance
•
Client Assets
–
Represents amounts due to clients, including customer deposits and unrealized
gains or losses arising from open positions
•
New Retail Accounts
–
The number of customer accounts that have initially opened and funded their
accounts •
Net Deposits from Retail Customers
–
Represents
customers’
deposits
less
withdrawals
for
a
given
period
•
Trades
–
The
number
of
transactions
retail
customers
have
completed
for
a
given
period
•
Retail Trading Revenue per Million
–
The revenue we realize from our forex, CFDs and metals trading activities per one
million of U.S. dollar-equivalent trading volume
•
Excess Net Capital
–
Represents the excess funds held over the regulatory minimum capital requirements,
as defined by the regulatory bodies that regulate our operating
subsidiaries 27 |
 3 Quarter 2011
Financial and Operating Results
October 27, 2011
rd |