Attached files
| file | filename |
|---|---|
| 8-K - 8-K - TOTAL SYSTEM SERVICES INC | d246540d8k.htm |
| EX-99.1 - EX-99.1 - TOTAL SYSTEM SERVICES INC | d246540dex991.htm |
 2011
Third Quarter Results October 25, 2011
©
2011 Total System Services, Inc.®.
Proprietary. All rights reserved worldwide.
Exhibit 99.2 |
 Forward-Looking Statements
This presentation and comments made by management contain
forward-looking statements including, among others, statements
regarding the expected future operating results of TSYS. These
statements are based on management’s current expectations and
assumptions and are subject to risks, uncertainties and changes in
circumstances. Forward-looking statements include all statements
that are not historical facts and can be identified by the use of
forward- looking
terminology
such
as
the
words
“believe,”
“expect,”
“anticipate,”
“intend,”
“plan,”
“estimate”
or similar expressions. Actual results may
differ materially from those set forth in the forward-looking statements
due to a variety of factors. More information about these risks,
uncertainties and factors may be found in TSYS’
2010 Annual Report
on Form 10-K, Quarterly Reports on Form 10-Q and Current Reports
on Form 8-K. TSYS does not assume any obligation to update any
forward-looking statements as a result of new information, future
developments or otherwise.
2
©2011 Total System Services, Inc.®
. Proprietary. All rights reserved worldwide. |
 Use of
Non-GAAP Financial Measures This slide presentation contains certain
non-GAAP financial measures determined by methods other than in
accordance with generally accepted accounting principles. Such non-GAAP
financial measures include the following: revenues before reimbursable
items; operating margin excluding reimbursable items; revenues
measured
on
a
constant
currency
basis;
the
impact
of
termination
fees
on
total
revenues, operating income, income from continuing operations, and earnings per
share from continuing operations; free cash flow; and EBITDA. The most
comparable GAAP measures to these measures are revenues; operating margin;
revenues; revenues, operating income, income from continuing operations and
earnings per share from continuing operations; cash flows from operating
activities; and net income, respectively. Management uses these non-GAAP
financial measures to assess the performance of TSYS’
core business. TSYS believes that
these non-GAAP financial measures provide meaningful additional information
about TSYS to assist investors in evaluating TSYS’
operating results. These non-
GAAP
financial
measures
should
not
be
considered
as
a
substitute
for
operating
results determined in accordance with GAAP and may not be comparable to other
similarly titled measures of other companies. The computations of the
non-GAAP financial
measures
used
in
this
slide
presentation
are
set
forth
in
the
Appendix
to
this slide presentation.
3
©2011 Total System Services, Inc.®.
Proprietary. All rights reserved worldwide. |
 Phil
Tomlinson Chairman and Chief Executive Officer
©
2011 Total System Services, Inc.®.
Proprietary. All rights reserved worldwide. |
 Jim
Lipham Chief Financial Officer
©
2011 Total System Services, Inc.®.
Proprietary. All rights reserved worldwide. |
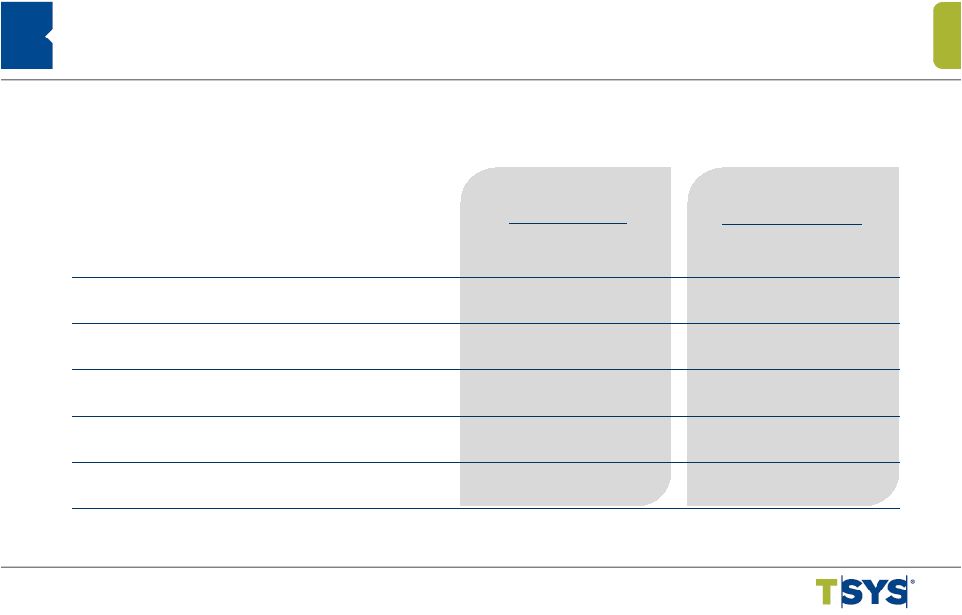
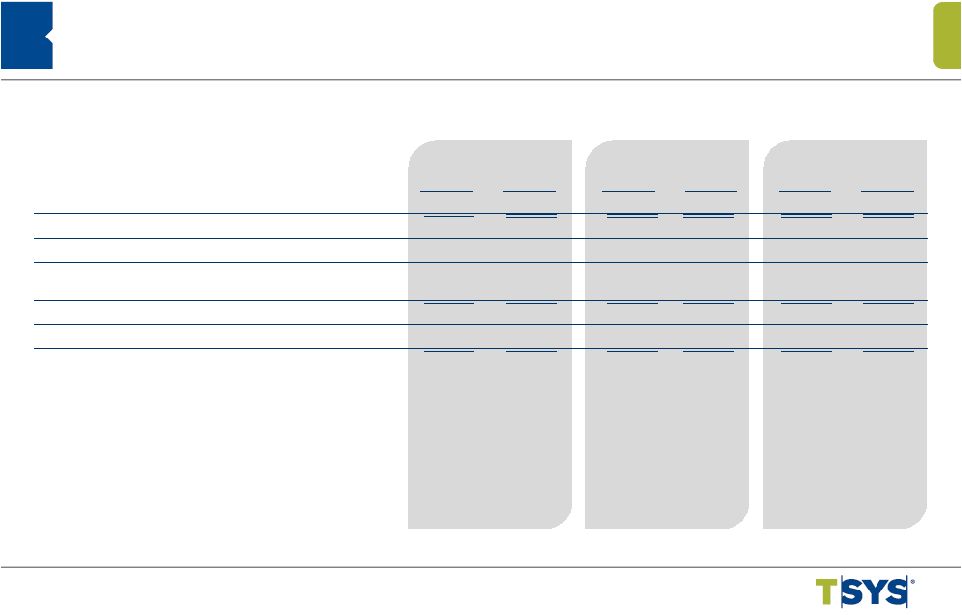
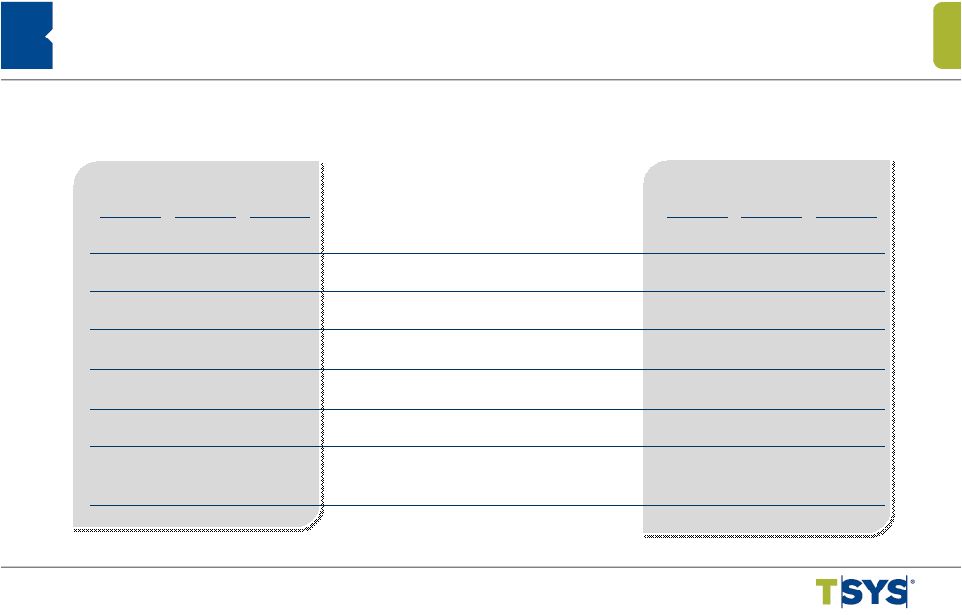   Consolidated Selected Financial Highlights
6
©2011 Total System Services, Inc.®
Proprietary. All rights reserved worldwide.
$ 459,747
$ 433,236
6.1%
Total Revenues
$ 1,336,732
$ 1,277,586
4.6%
390,161
363,192
7.4
Revenues Before Reimbursable Items
1,133,015
1,068,592
6.0
81,180
78,914
2.9
Operating Income
232,738
238,455
(2.4)
58,148
48,206
20.6
Income from Continuing Operations to
TSYS Common Shareholders
160,684
149,937
7.2
58,148
45,743
27.1
Net Income Attributable to TSYS Common
Shareholders
160,684
146,773
9.5
2,233.3
1,981.2
12.7
Total Cardholder Transactions (in millions)
6,321.8
5,582.2
13.3
$0.30
$0.25
23.9
Earnings Per Share from Continuing
Operations Attributable to TSYS Common
Shareholders
$0.83
$0.76
9.7
YTD
2011
YTD
2010
Percent
Change
(in thousands, except per share data)
3rd Qtr
2011
3rd Qtr
2010
Percent
Change |
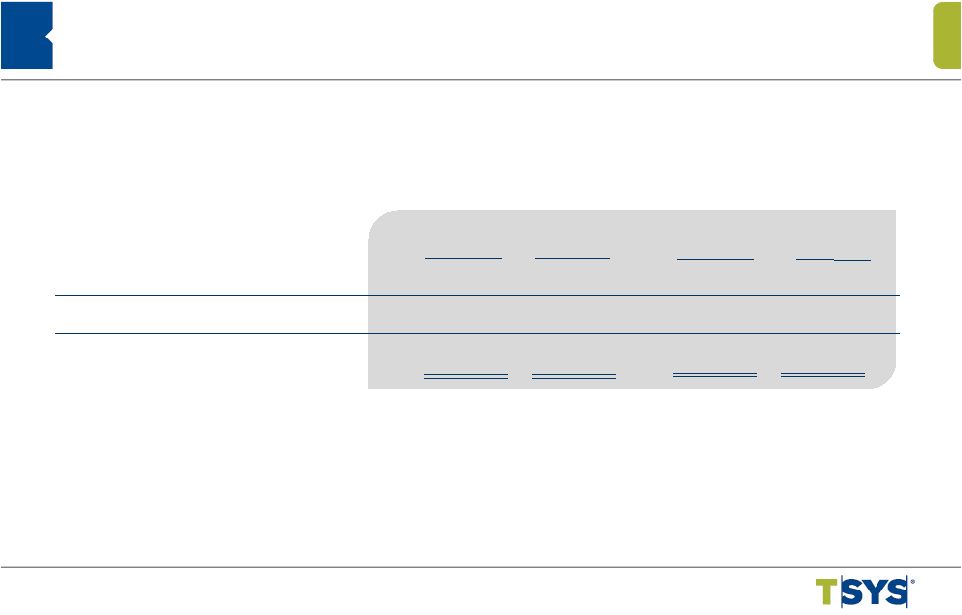
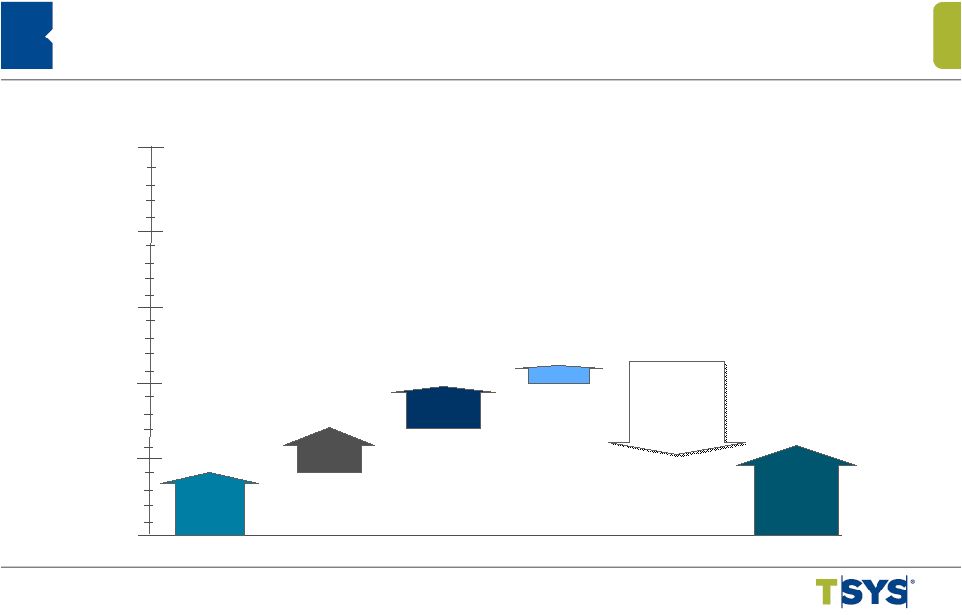  2011 YTD
Revenue Change Revenues Before Reimbursable Items
7
©2011 Total System Services, Inc.®
Proprietary. All rights reserved worldwide.
10%
25%
5%
0%
4.1%
Internal
Growth
New
Clients
2.6%
Acquisitions
3.6%
Lost
Business,
Non-recurring
Items and
Price
Compression
(5.8%)
Reported
6.0%
Currency
20%
15%
1.5% |
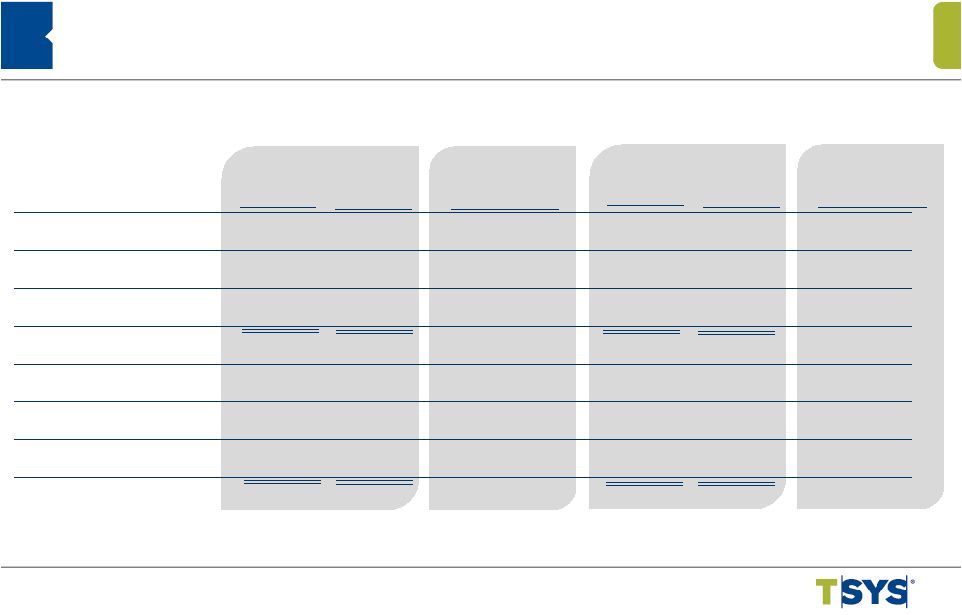
 Consolidated Accounts on
File Portfolio Summary
Consumer Credit
194.2
180.2
7.7
194.2
187.6
3.5
Government
Services
32.6
26.9
21.4
32.6
30.0
8.7
Retail
23.2
23.1
0.2
23.2
23.7
(2.4)
Total Consumer
250.0
230.2
8.6
250.0
241.3
3.6
Commercial
59.6
51.9
14.7
59.6
55.2
7.9
Other
7.0
5.7
23.6
7.0
6.7
4.9
Subtotal
316.6
287.8
10.0
316.6
303.2
4.4
Prepaid /
Stored Value
75.8
51.4
47.7
75.8
72.8
4.1
Total AOF
392.4
339.2
15.7
392.4
376.0
4.3
(in millions)
Sep
2011
Sep
2011
Sep
2010
Sep
2010
%
Change
%
Change
Sep
2011
Sep
2011
Jun
2011
Jun
2011
%
Change
%
Change
8
©2011 Total System Services, Inc.®
Proprietary. All rights reserved worldwide. |
 Key
Drivers 3Q 2011 Year Over Year
Segment Financial Highlights
•
Strong organic growth
•
Increased volumes
•
Volumes
–
Accounts on file were 341.9 million
–
Total cardholder transactions were 1,872.8 million,
an increase of 12.9%
Revenues
$243.9 million
Excluding Reimbursables
$206.1 million
Operating Income
$68.0 million
Operating Margin
27.9%
Excluding Reimbursables
33.0%
Same Client Transactions
1,867.6 million
Increase of 12.7%
North America
Services
9
©2011 Total System Services, Inc.®
Proprietary. All rights reserved worldwide. |
 Key
Drivers 3Q 2011 Year Over Year
Segment Financial Highlights
•
Favorable currency impact on revenues of
$4.9 million
•
Conversion of new clients
•
Volumes
–
Accounts on file were 50.5 million
–
Total cardholder transactions were 360.5 million, an
increase of 11.7%
10
©2011 Total System Services, Inc.®
Proprietary. All rights reserved worldwide.
Revenues
$99.9 million
Constant currency basis
$95.0 million
Operating Income
$8.3 million
Operating Margin
8.3%
Excluding Reimbursables
8.6%
Same Client Transactions
347.5 million
Increase of 7.8%
International
Services |
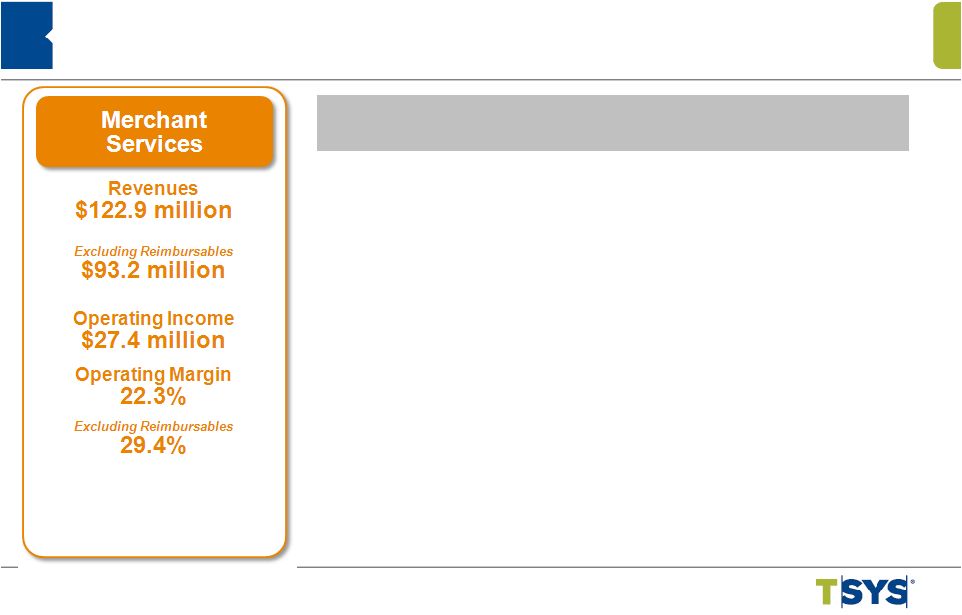 Key
Drivers 3Q 2011 Year Over Year
Segment Financial Highlights
•
Acquisition of TermNet
•
Decline in revenues associated with
deconverted clients
•
Volumes
–
Point-of-Sale Transactions were 1,263.3 million, a
decrease of 6.1%
–
Excluding deconverted clients, Point-of-Sale
Transactions increased 5.1%
11
©2011 Total System Services, Inc.®
Proprietary. All rights reserved worldwide. |
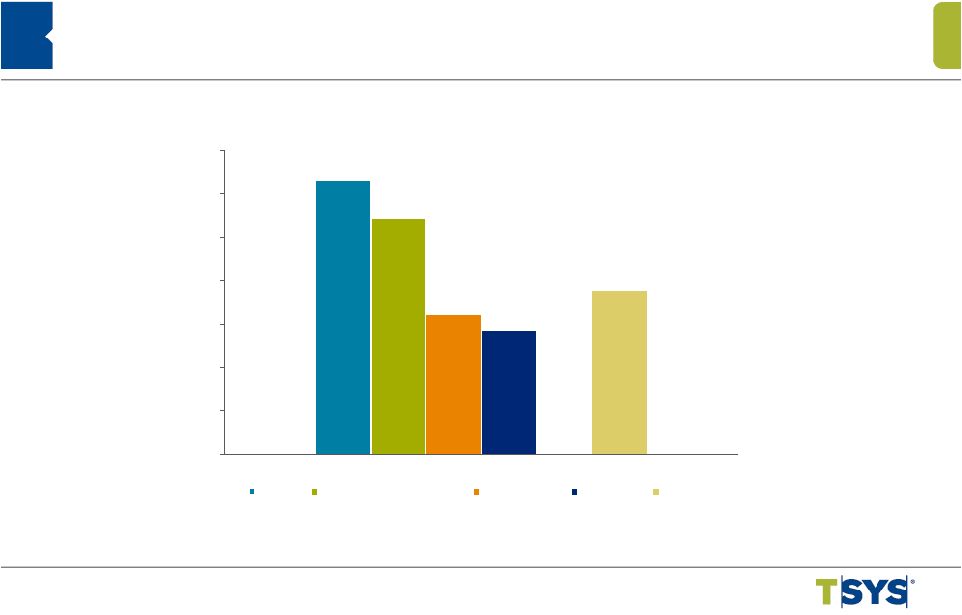 Cash
Flow Strength: 2011 TTM Consolidated Financial Highlights
$473
$407
$240
$213
$281
$0
$75
$150
$225
$300
$375
$450
$525
EBITDA
Cash flow from operations
Free cash flow
Net income
Ending cash
(in millions)
TTM = Trailing Twelve Months
12
©2011 Total System Services, Inc.®
Proprietary. All rights reserved worldwide. |
 Revised 2011 Guidance
©2011 Total System Services, Inc.®
Proprietary. All rights reserved worldwide.
13
Range
Change
Range
Percent Change
Total Revenues
$1,786
to
$1,800
4 %
to
5%
Reimbursable Items
266
to
270
(3)
to
(2)
Revenues Before Reimbursable Items
1,520
to
1,530
5
to
6
Income from Continuing Operations Available
to TSYS Common Shareholders
219
to
221
11
to
12
Earnings per Share from Continuing
Operations
$1.14
to
$1.15
14
to
15
Average Shares
192.0
(in millions, except per share data)
|
 Appendix
©
2011 Total System Services, Inc.®.
Proprietary. All rights reserved worldwide. |
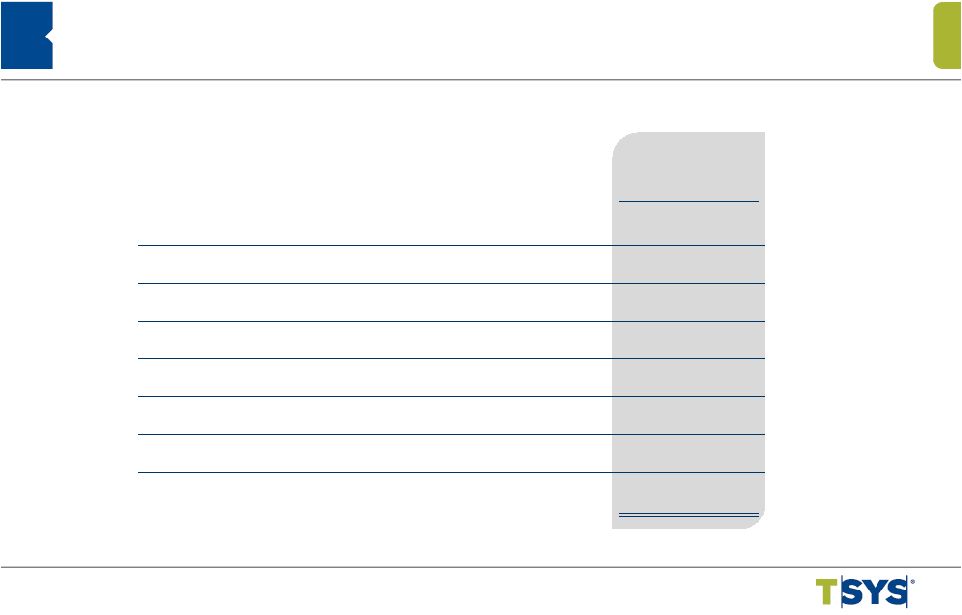
 Appendix Non-GAAP Reconciliation –
Revenues Before Reimbursable Items
Three Months Ended
Nine Months Ended
9/30/11
9/30/10
9/30/11
9/30/10
Total Revenues
$ 459,747 $ 433,236
$ 1,336,732 $
1,277,586 Reimbursable Items
69,586
70,044
203,717
208,994
Revenues Before Reimbursable Items
$ 390,161
$ 363,192
$ 1,133,015
$ 1,068,592
(in thousands)
15
©2011 Total System Services, Inc.®
Proprietary. All rights reserved worldwide. |
 Three Months Ended
9/30/11 9/30/10
Three Months Ended
9/30/11 9/30/10
Three Months Ended
9/30/11 9/30/10
Operating Income (a)
$ 68,016
$ 52,645
$ 8,279
$ 12,305
$ 27,398
$ 31,439
Total Revenues (b)
243,899
231,547
99,891
85,327
122,933
125,178
Reimbursable Items
37,812
38,647
3,751
3,078
29,713
30,144
Revenues Before
Reimbursable Items(c)
206,087
192,900
96,140
82,249
93,220
95,034
Operating Margin (a)/(b)
27.89%
22.74%
8.29%
14.42%
22.29%
25.12%
Operating Margin Excluding Reimbursables (a)/(c)
33.00%
27.29%
8.61%
14.96%
29.39%
33.08%
Appendix Non-GAAP Reconciliation –
Segment
Operating Margin Excluding Reimbursable Items
North America
International
Merchant
(in thousands)
16
©2011 Total System Services, Inc.®
Proprietary. All rights reserved worldwide. |
 Nine
Months Ended
9/30/11 9/30/10
Percentage
Change
Three
Months Ended
9/30/11 9/30/10
Percentage
Change
Appendix Non-GAAP Reconciliation –
Constant Currency
(1) Reflects current period results on a non-GAAP basis as if foreign currency
rates did not change from the comparable prior year period. (2) Reflects the
impact of calculated changes in foreign currency rates from the comparable period.
(in thousands)
Consolidated:
Constant Currency (1)
$ 454,852
$ 433,236
5.0%
$ 1,319,653
$ 1,277,586
3.3%
Foreign Currency (2)
4,895
---
17,079
---
Total Revenues
459,747
433,236
6.1%
1,336,732
1,277,586
4.6%
International Services:
Constant Currency (1)
$ 94,974
$ 85,327
11.3%
$ 271,137
$242,706
11.7%
Foreign Currency (2)
4,916
---
17,134
---
Total Revenues
$99,891
$85,327
17.1%
$288,271
$242,706
18.8%
17
©2011 Total System Services, Inc.®
Proprietary. All rights reserved worldwide. |
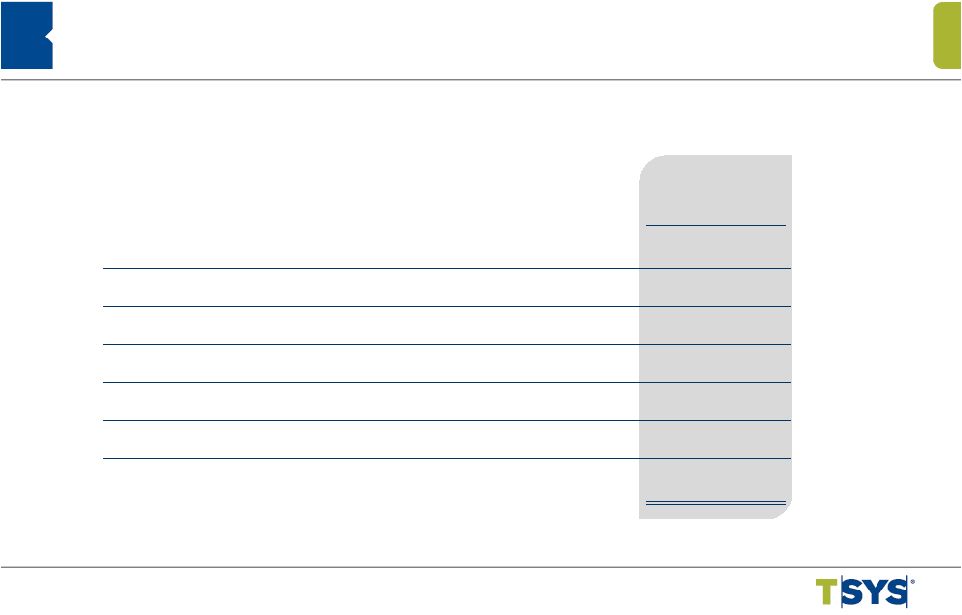
 Appendix Non-GAAP Reconciliation –
EBITDA
Trailing Twelve
Months Ended
9/30/2011
Net Income
$ 213,385
Adjusted for:
Add: Discontinued Operations
81
Deduct: Equity in Income of Equity Investments
(10,254)
Add: Income Taxes
94,921
Add: Nonoperating expense
5,578
Add: Depreciation and Amortization
169,407
EBITDA
$ 473,118
(in thousands)
18
©2011 Total System Services, Inc.®
Proprietary. All rights reserved worldwide. |
 Appendix Non-GAAP Reconciliation –
Free Cash Flow
Trailing Twelve
Months Ended
9/30/2011
Cash Flows from Operating Activities
$ 406,923
Less:
Purchase of Property and Equipment
(34,820)
Additions to Licensed Computer Software from Vendors
(52,635)
Additions to Internally Developed Computer Software
(23,577)
Additions to Contract Acquisition Costs
(55,401)
Free Cash Flow
$ 240,490
(in thousands)
19
©2011 Total System Services, Inc.®
Proprietary. All rights reserved worldwide. |