Attached files
| file | filename |
|---|---|
| 8-K - POLARIS INDUSTRIES INC. 8-K - Polaris Inc. | a50032590.htm |
| EX-99.1 - EXHIBIT 99.1 - Polaris Inc. | a50032590ex99-1.htm |
Exhibit 99.2
Third Quarter 2011 Earnings
Results October 18, 2011
Safe Harbor
Except for historical information contained herein, the matters set forth in this document, including but not limited to management’s expectations regarding 2011 and 2012 sales, shipments, net income, cash flow, and manufacturing realignment transition costs and savings, are forward-looking statements that involve certain risks and uncertainties that could cause actual results to differ materially from those forward-looking statements. Potential risks and uncertainties include such factors as product offerings, promotional activities and pricing strategies by competitors; manufacturing realignment transition costs; acquisition integration costs; warranty expenses; impact of changes in Polaris stock prices on incentive compensation; foreign currency exchange rate fluctuations; environmental and product safety regulatory activity; effects of weather; commodity costs; uninsured product liability claims; uncertainty in the retail and wholesale credit markets; changes in tax policy and overall economic conditions, including inflation, consumer confidence and spending and relationships with dealers and suppliers. Investors are also directed to consider other risks and uncertainties discussed in our 2010 annual report and Form 10-K filed by the Company with the Securities and Exchange Commission. The Company does not undertake any duty to any person to provide updates to its forward-looking statements.The data source for retail sales figures included in this presentation is registration information provided by Polaris dealers in North America and compiled by the Company or Company estimates. The Company must rely on information that its dealers supply concerning retail sales, and other retail sales data sources and this information is subject to revision.Note: Shares and per share information have been adjusted to give effect to the two-for-one stock split declared on July 20, 2011, payable on September 12, 2011 to shareholders of record on September 2, 2011.October 2011
Scott Wine CEO Third
Quarter 2011 Earnings Results October 18, 2011
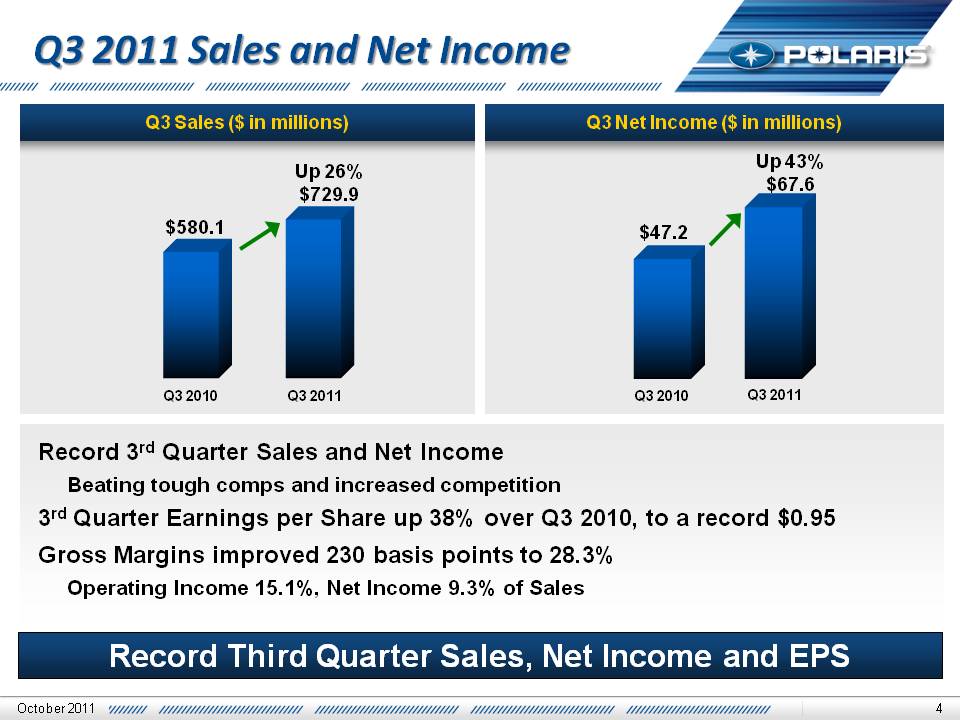
Q3 2011 Sales and Net Income Q3 Net Income ($ in millions) Q3 Sales ($ in millions) $47.2 Up 43% $67.6 Q3 2011 Q3 2010 Q3 2011 Q3 2010 Record 3rd Quarter Sales and Net Income Beating tough comps and increased competition 3rd Quarter Earnings per Share up 38% over Q3 2010, to a record$0.95 Gross Margins improved 230 basis points to 28.3% Operating Income 15.1%, Net Income 9.3% of Sales October 2011 Record Third Quarter Sales, Net Income and EPS Up 26% $729.9 $580.1
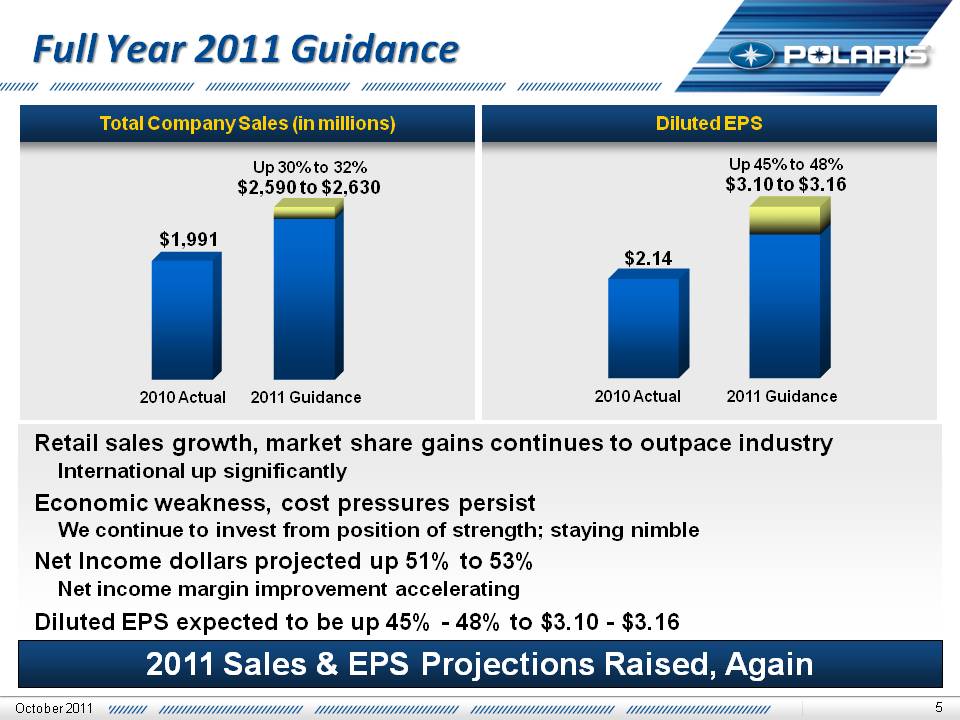
Total Company Sales (in
millions) Diluted EPS Full Year 2011 Guidance $1,991 Up 30% to 32%
$2,590 to $2,630 2010 Actual 2011 Guidance $2.14 Up 45% to 48% $3.10 to
$3.16 2011 Sales & EPS Projections Raised, Again Retail sales growth,
market share gains continues to outpace industry International up
significantly Economic weakness, cost pressures persist We continue to
invest from position of strength; staying nimble Net Income dollars
projected up 51% to 53% Net income margin improvement accelerating
Diluted EPS expected to be up 45% - 48% to $3.10 - $3.16 October 2011 5
2010 Actual 2011 Guidance
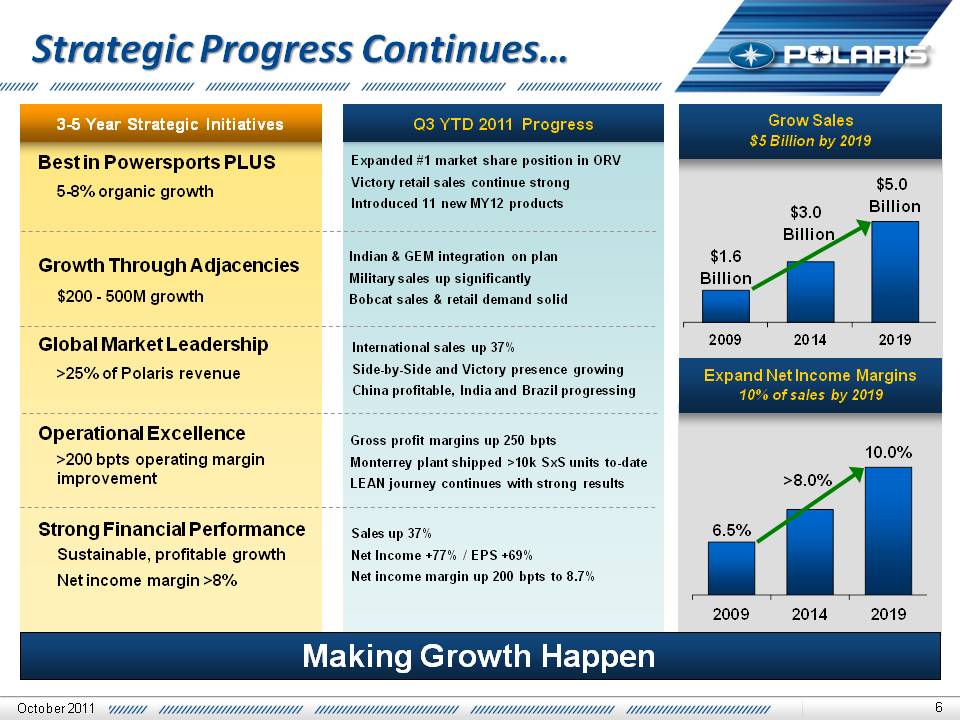
Strategic Progress
Continues… $1.6 Billion $5.0 Billion Grow Sales $5 Billion by 2019
Expand Net Income Margins 10% of sales by 2019 Making Growth Happen Q3
YTD 2011 Progress 3-5 Year Strategic Initiatives Best in Powersports
PLUS 5-8% organic growth Growth Through Adjacencies $200 - 500M growth
Global Market Leadership >25% of Polaris revenue Operational Excellence
>200 bpts operating margin improvement Strong Financial Performance
Sustainable, profitable growth Net income margin >8% Sales up 37% Net
Income +77% / EPS +69% Net income margin up 200 bpts to 8.7% Expanded #1
market share position in ORV Victory retail sales continue strong
Introduced 11 new MY12 products Indian & GEM integration on plan
Military sales up significantly Bobcat sales & retail demand solid
International sales up 37% Side-by-Side and Victory presence growing
China profitable, India and Brazil progressing Gross profit margins up
250 bpts Monterrey plant shipped >10k SxS units to-date LEAN journey
continues with strong results 6.5% >8.0% October 2011 6 2009 2014 2019
$3.0 Billion 2009 2014 2019 10.0%
Bennett Morgan President &
COO Third Quarter 2011 Earnings Results October 18, 2011
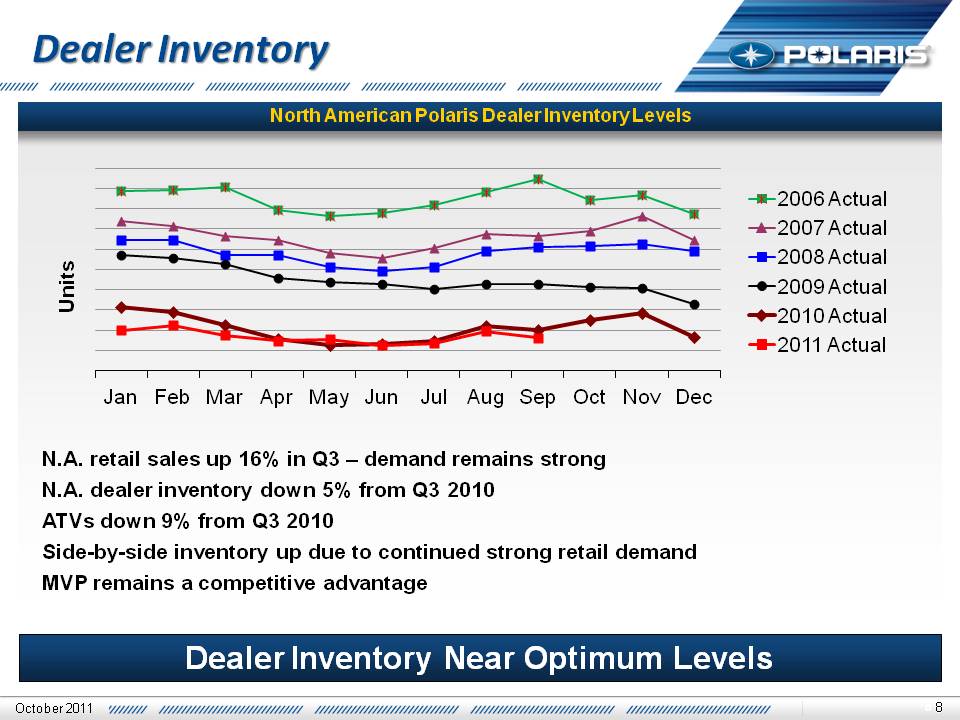
North American Polaris
Dealer Inventory Levels 8 Dealer Inventory N.A. retail sales up 16% in
Q3 – demand remains strong N.A. dealer inventory down 5% from Q3 2010
ATVs down 9% from Q3 2010 Side-by-side inventory up due to continued
strong retail demand MVP remains a competitive advantage Dealer
Inventory Near Optimum Levels October 2011 8 Jan Feb Mar Apr May Jun Jul
Aug Sep Oct Nov Dec Units 2006 Actual 2007 Actual 2008 Actual 2009
Actual 2010 Actual 2011 Actual
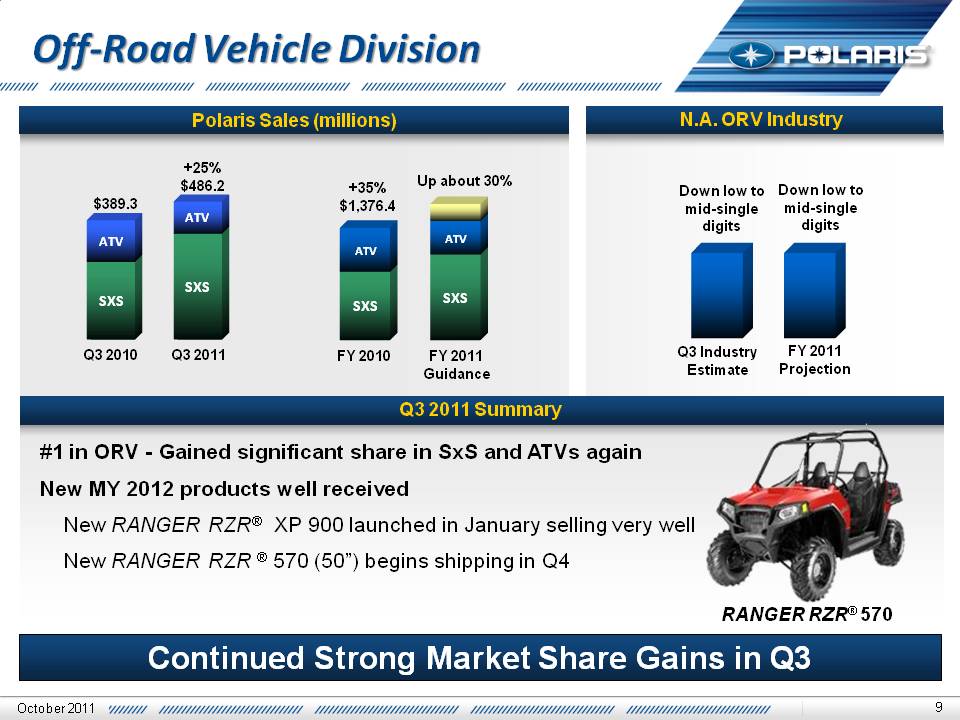
9 Off-Road Vehicle Division
Polaris Sales (millions) SXS SXS ATV ATV SXS SXS ATV ATV FY 2011
Guidance FY 2010Q3 2011 Q3 2010 $389.3 +35% $1,376.4 +25% $486.2 #1 in
ORV - Gained significant share in SxS and ATVs again New MY 2012
products well received New RANGER RZR® XP 900 launched in January
selling very well New RANGER RZR ® 570 (50”) begins shipping in Q4 FY
2011 Projection Q3 Industry Estimate Down low to mid-single digits N.A.
ORV Industry October 2011 Up about 30% Q3 2011 Summary Continued Strong
Market Share Gains in Q3 Down low to mid-single digits RANGER RZR® 570
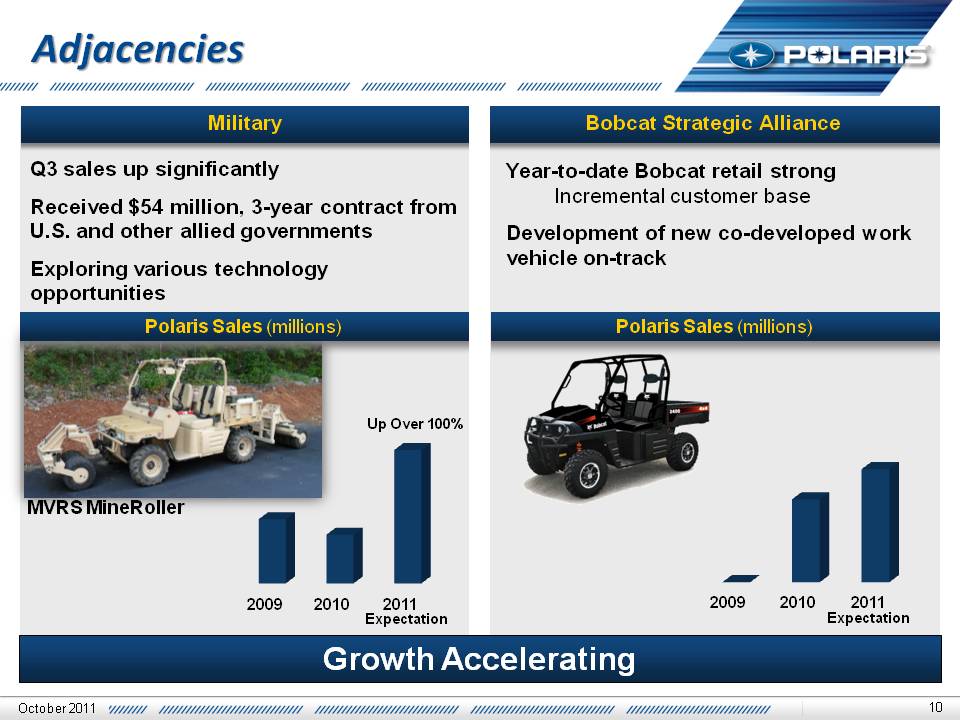
10 Year-to-date Bobcat
retail strong Incremental customer base Development of new co-developed
work vehicle on-track Adjacencies Bobcat Strategic Alliance Military
October 2011 Q3 sales up significantly Received $54 million, 3-year
contract from U.S. and other allied governments Exploring various
technology opportunities Growth Accelerating 2009 2010 2011 2009 2010
2011 Up Over 100% Expectation Expectation Polaris Sales (millions)
Polaris Sales (millions) MVRS MineRoller
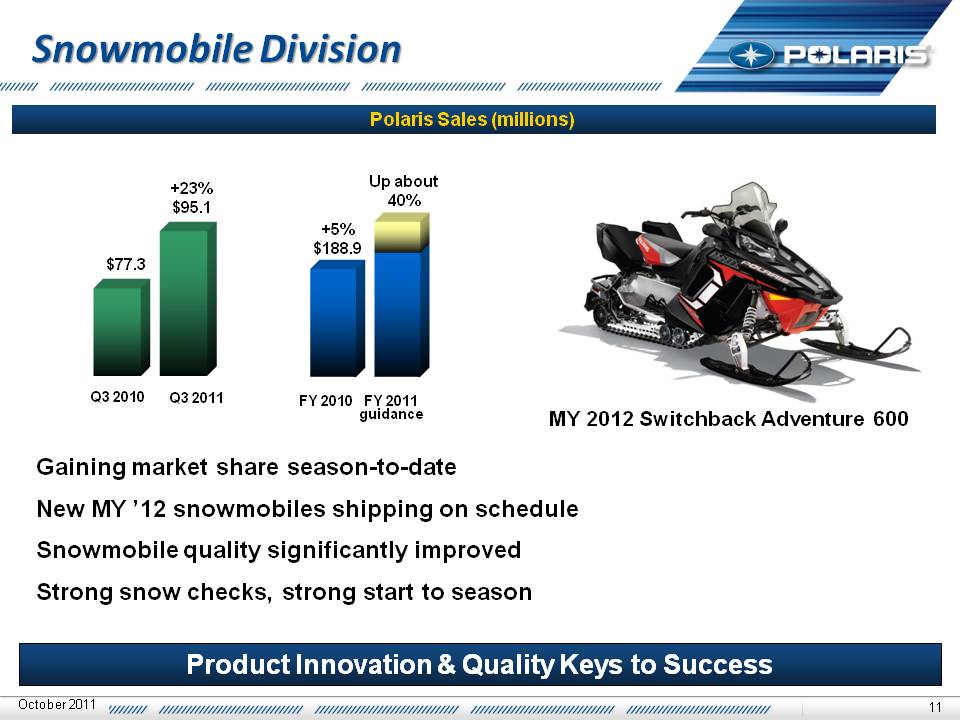
11 October 2011 Snowmobile
Division Gaining market share season-to-date New MY ’12 snowmobiles
shipping on schedule Snowmobile quality significantly improved Strong
snow checks, strong start to season MY 2012 Switchback Adventure 600 FY
2010 FY 2011 +5% $188.9 Up about 40% Product Innovation & Quality Keys
to Success +23% $95.1 $77.3 Q3 2011 guidance Q3 2010 Polaris Sales
(millions)
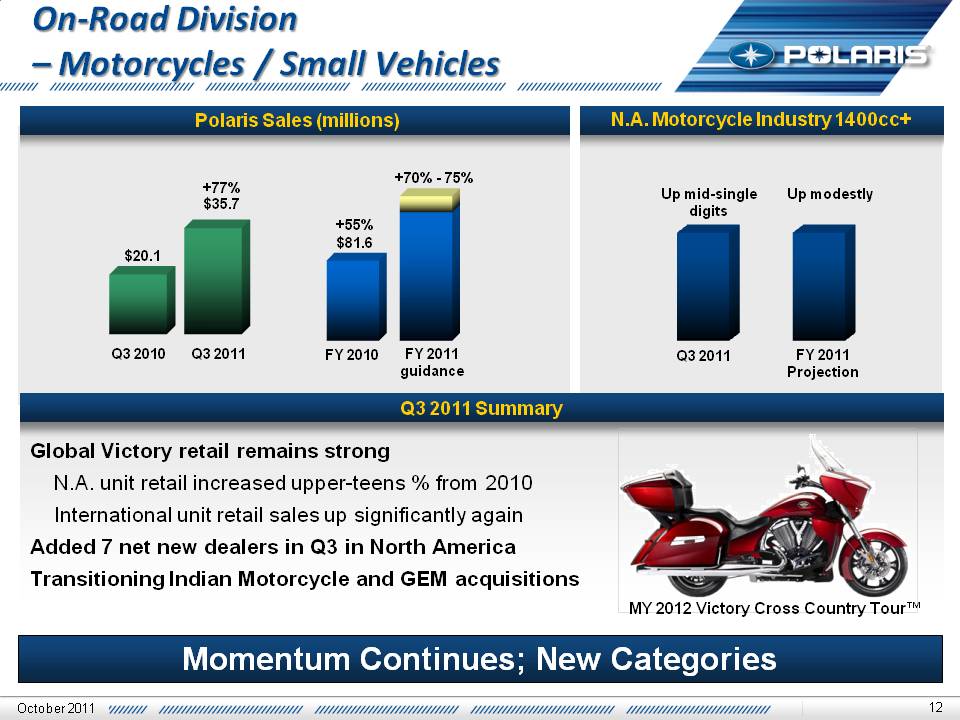
12 On-Road Division –
Motorcycles / Small Vehicles Polaris Sales (millions) Momentum
Continues; New Categories October 2011 N.A. Motorcycle Industry 1400cc+
Global Victory retail remains strong N.A. unit retail increased
upper-teens % from 2010 International unit retail sales up significantly
again Added 7 net new dealers in Q3 in North America Transitioning
Indian Motorcycle and GEM acquisitions +55% $81.6 +70% - 75% FY 2011
guidance FY 2010 FY 2011 Projection Q3 2011 Up mid-single digits Up
modestly Q3 2011 Summary Q3 2010 Q3 2011 +77% $35.7 $20.1 MY 2012
Victory Cross Country Tour™
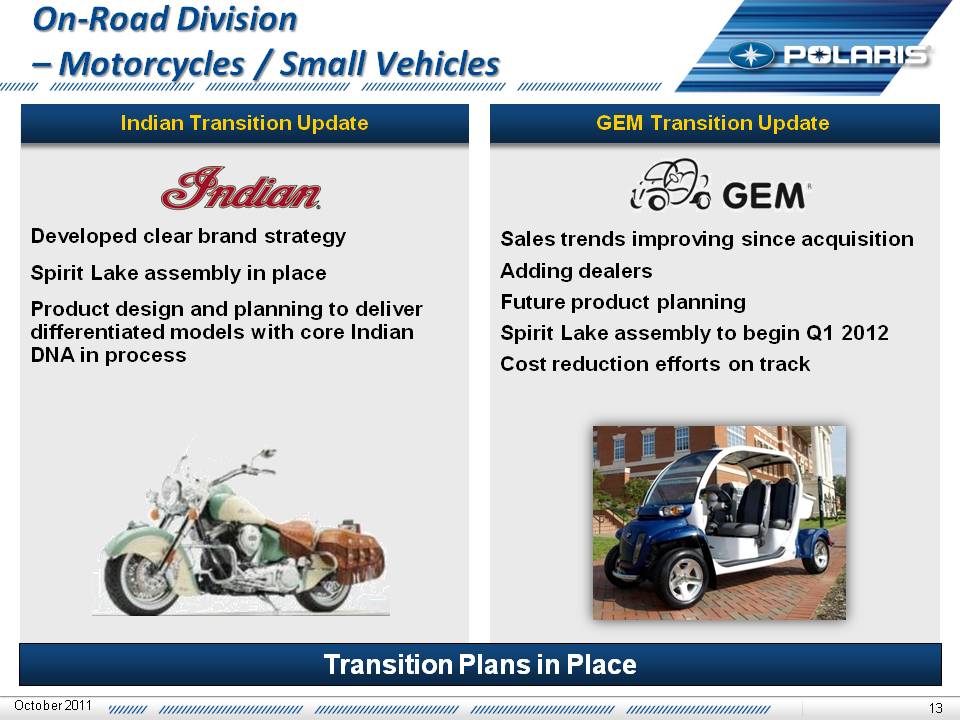
October 2011 13 On-Road
Division – Motorcycles / Small Vehicles Transition Plans in Place Sales
trends improving since acquisition Adding dealers Future product
planning Spirit Lake assembly to begin Q1 2012 Cost reduction efforts on
track Developed clear brand strategy Spirit Lake assembly in place
Product design and planning to deliver differentiated models with core
Indian DNA in process GEM Transition Update Indian Transition Update
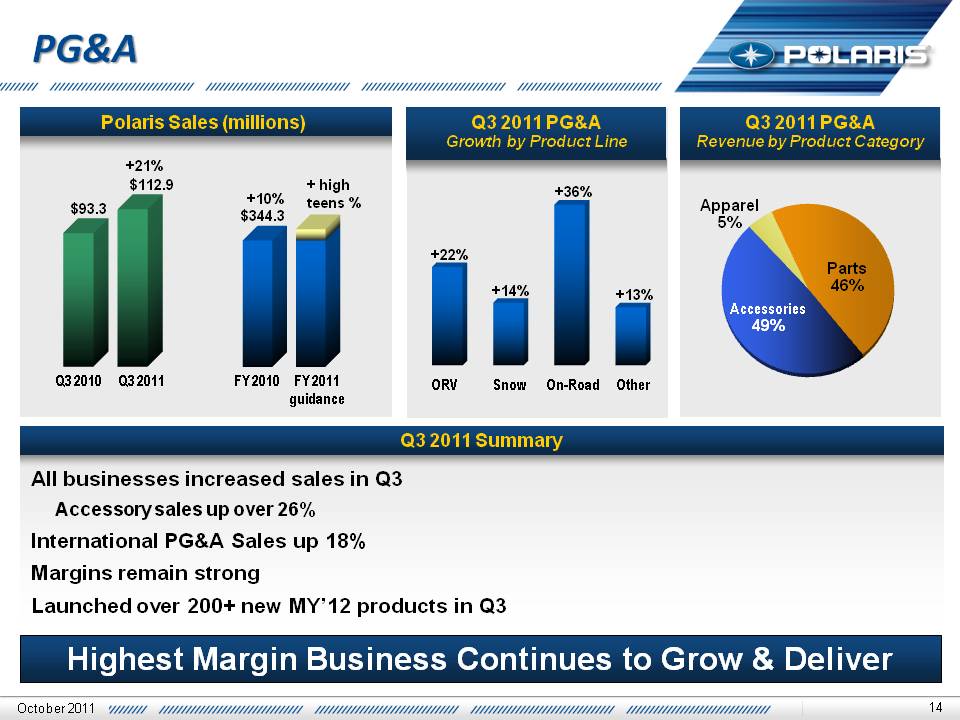
14 PG&A Highest Margin
Business Continues to Grow & Deliver Polaris Sales (millions) Q3 2011
PG&A Growth by Product Line Q3 2011 PG&A Revenue by Product Category
Parts 46% Accessories 49% Apparel 5% $93.3 +21% $112.9 FY 2011 guidance
FY 2010 Q3 2011 Q3 2010 +10% $344.3 All businesses increased sales in Q3
Accessory sales up over 26% International PG&A Sales up 18% Margins
remain strong Launched over 200+ new MY’12 products in Q3 + high teens %
October 2011 ORV Snow On-Road Other +22% +14% +36% +13% Q3 2011 Summary
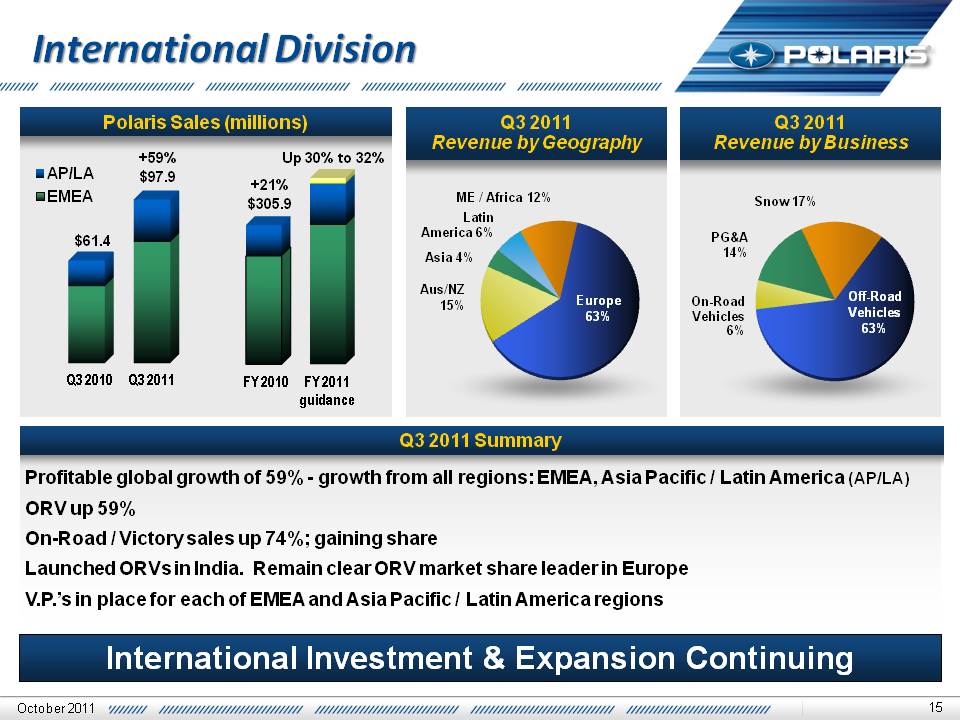
15 AP/LA EMEA Polaris Sales
(millions) International Investment & Expansion Continuing International
Division $61.4 +59% $97.9 +21% $305.9 Q3 2011 Revenue by Geography Q3
2011 Revenue by Business FY 2011 guidance FY 2010 Q3 2011 Q3 2010 ME /
Africa 12% Latin America 6% Asia 4% Aus/NZ 15% Europe 63% Off-Road
Vehicles 63% On-Road Vehicles 6% PG&A 14% Snow 17% Profitable global
growth of 59% - growth from all regions: EMEA, Asia Pacific / Latin
America (AP/LA) ORV up 59% On-Road / Victory sales up 74%; gaining share
Launched ORVs in India. Remain clear ORV market share leader in Europe
V.P.’s in place for each of EMEA and Asia Pacific / Latin America
regions Up 30% to 32% October 2011 Q3 2011 Summary
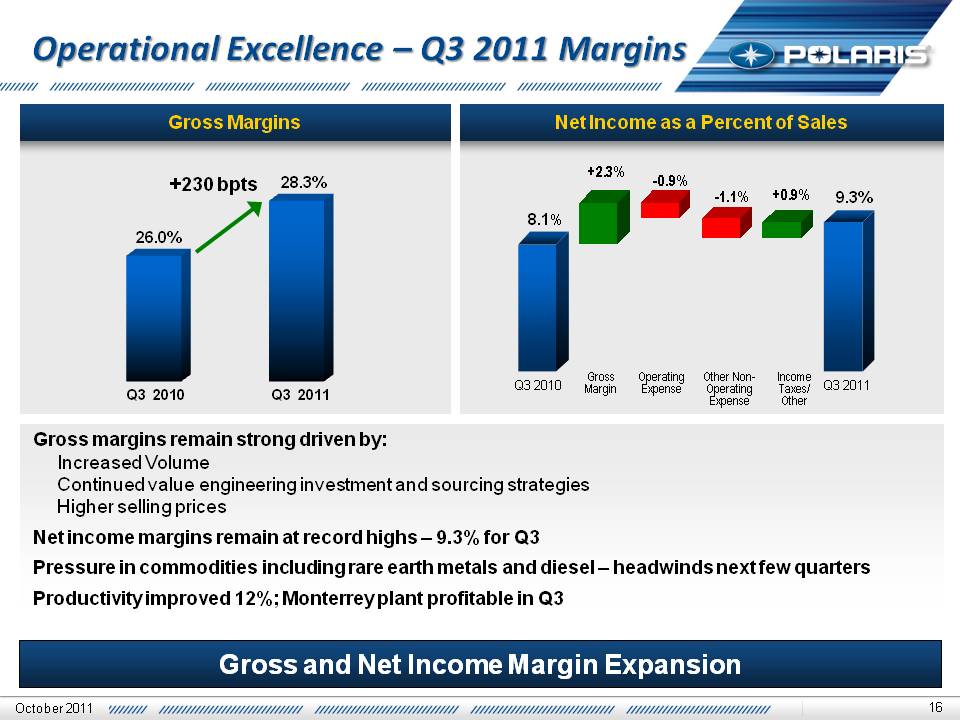
16 Operational Excellence –
Q3 2011 Margins Net Income as a Percent of Sales Gross Margins Q3 2010
Q3 2011 +2.3%-0.9%-1.1%+0.9%Gross Margin Operating Expense Other
Non-Operating Expense Income Taxes/ Other Q3 2010 Q3 2011 26.0% 28.3%
8.1% 9.3% +230 bpts Gross margins remain strong driven by: Increased
Volume Continued value engineering investment and sourcing strategies
Higher selling prices Net income margins remain at record highs – 9.3%
for Q3 Pressure in commodities including rare earth metals and diesel –
headwinds next few quarters Productivity improved 12%; Monterrey plant
profitable in Q3 Gross and Net Income Margin Expansion October 2011

Mike Malone V.P. Finance &
CFO Third Quarter 2011 Earnings Results October 18, 2011
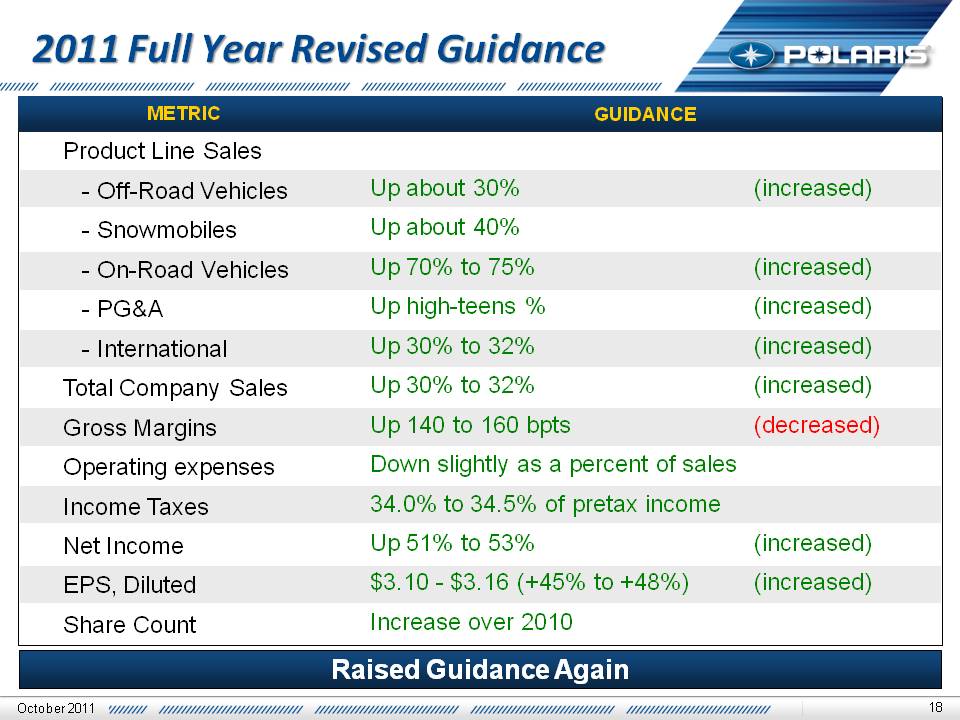
2011 Full Year Revised
Guidance Product Line Sales - Off-Road Vehicles - Snowmobiles - On-Road
Vehicles - PG&A - International Total Company Sales Gross Margins
Operating expenses Income Taxes Net Income EPS, Diluted Share Count Up
about 30% (increased) Up about 40% Up 70% to 75% (increased) Up
high-teens % (increased) Up 30% to 32% (increased) Up 30% to 32%
(increased) Up 140 to 160 bpts (decreased) Down slightly as a percent of
sales 34.0% to 34.5% of pretax income Up 51% to 53% (increased) $3.10 -
$3.16 (+45% to +48%) (increased) Increase over 2010 METRIC GUIDANCE
Raised Guidance Again 18 October 2011
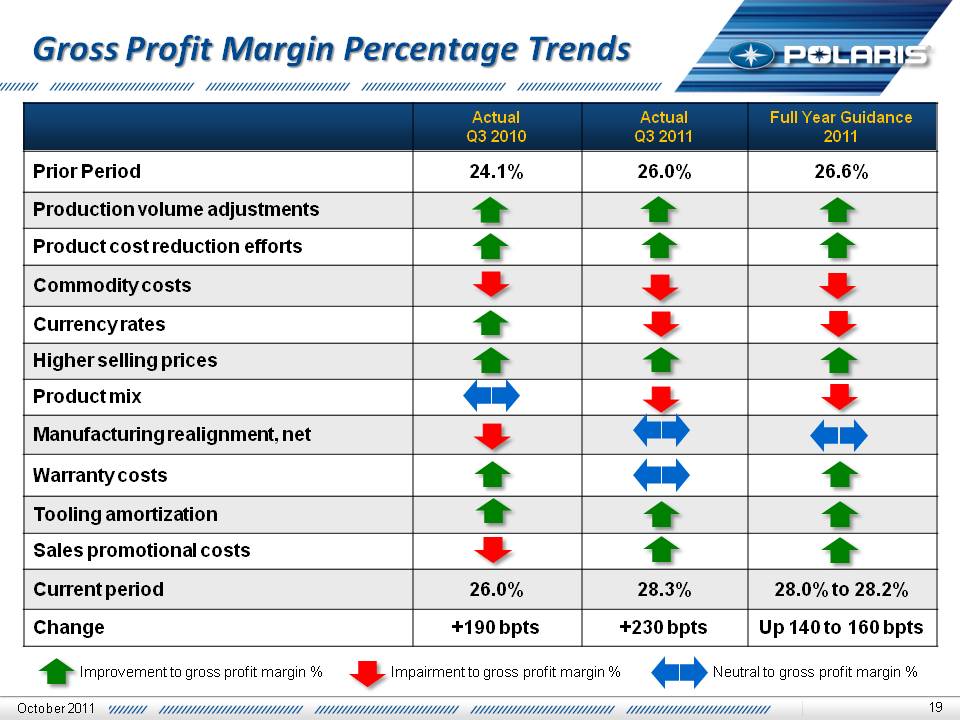
19 Actual Q3 2010 Actual Q3
2011Full Year Guidance 2011Prior Period 24.1% 26.0% 26.6% Production
volume adjustments Product cost reduction efforts Commodity costs
Currency rates Higher selling prices Product mix Manufacturing
realignment, net Warranty costs Tooling amortization Sales promotional
costs Current period 26.0% 28.3% 28.0% to 28.2% Change + 190 bpts + 230
bpts Up 140 to 160 bpts Gross Profit Margin Percentage Trends
Improvement to gross profit margin % Impairment to gross profit margin %
Neutral to gross profit margin % October 2011
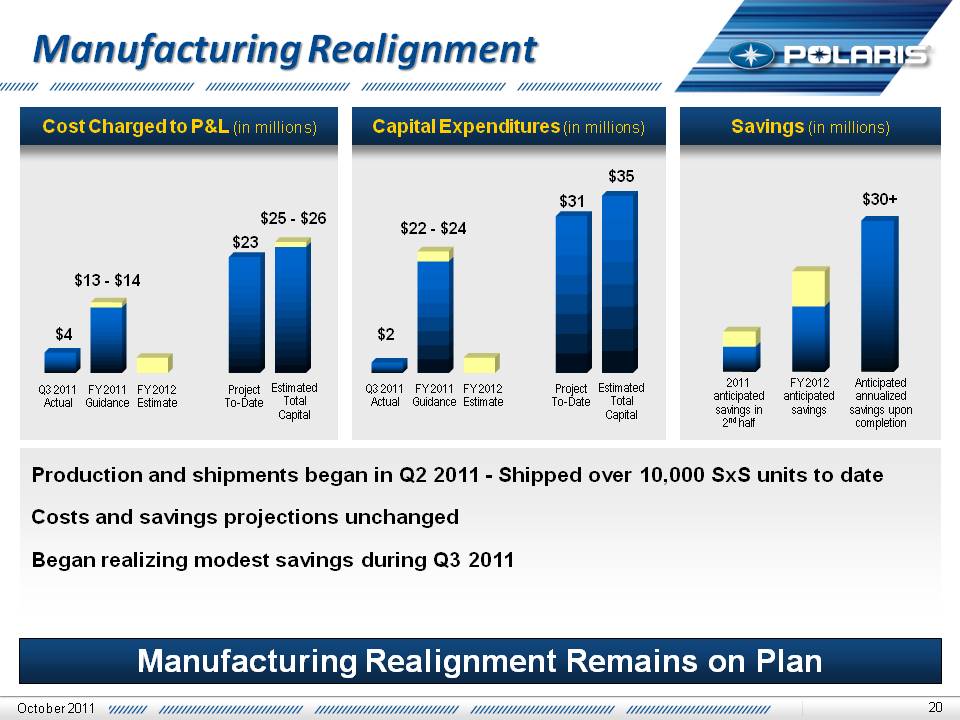
Manufacturing Realignment
Production and shipments began in Q2 2011 - Shipped over 10,000 SxS
units to date Costs and savings projections unchanged Began realizing
modest savings during Q3 2011 Manufacturing Realignment Remains on Plan
Cost Charged to P&L (in millions) Savings (in millions) Anticipated
annualized savings upon completion 2011 anticipated savings in 2nd half
$30+ FY 2012 anticipated savings October 2011 Capital Expenditures (in
millions) $2 $31 $35 Estimated Total Capital FY 2011 Guidance FY 2012
Estimate Project To-Date Q3 2011 Actual $4 $23 Estimated Total Capital
FY 2011 Guidance FY 2012 Estimate Project To-Date Q3 2011 Actual 20 $22
- $24 $25 - $26 $13 - $14
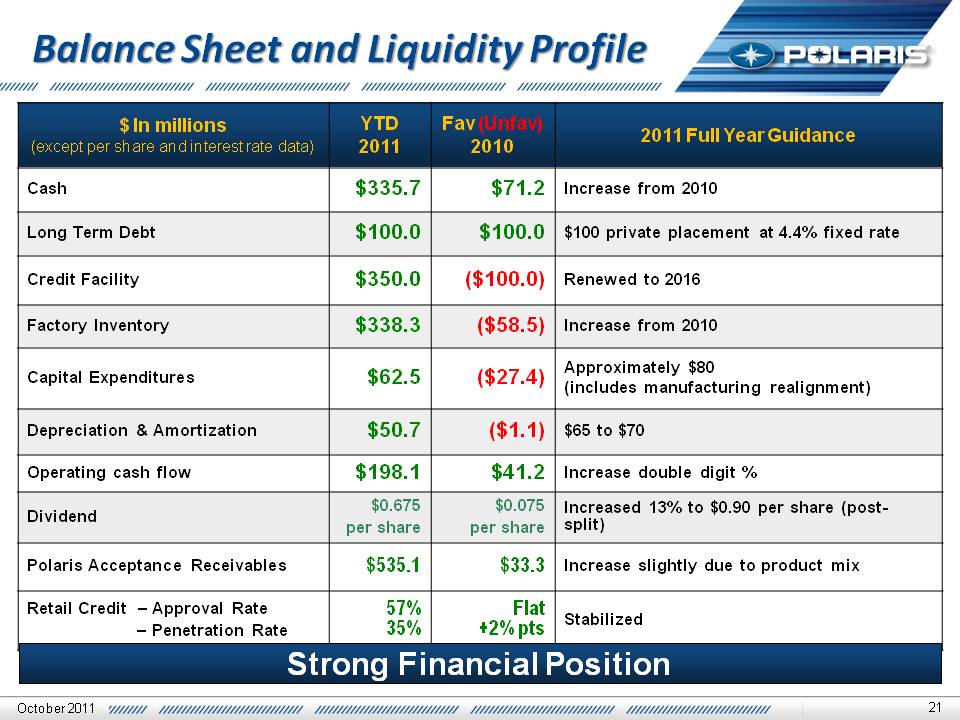
Balance Sheet and Liquidity
Profile $ In millions (except per share and interest rate data) YTD 2011
Fav (Unfav) 2010 2011 Full Year Guidance Cash$335.7$71.2 Increase from
2010 Long Term Debt$100.0$100.0$100 private placement at 4.4% fixed rate
Credit Facility$350.0($100.0) Renewed to 2016 Factory Inventory$338.3
($58.5) Increase from 2010 Capital Expenditures$62.5($27.4)
Approximately $80 (includes manufacturing realignment) Depreciation &
Amortization$50.7($1.1) $65 to $70 Operating cash flow$198.1$41.2
Increase double digit % Dividend$0.675 per share $0.075 per share
Increased 13% to $0.90 per share (post-split) Polaris Acceptance
Receivables$535.1$33.3 Increase slightly due to Retail Credit – Approval
Rate – Penetration Rate product mix 57% 35% Flat +2% pts Stabilized
October 2011 21

Scott Wine CEO Third
Quarter 2011 Earnings Results October 18, 2011
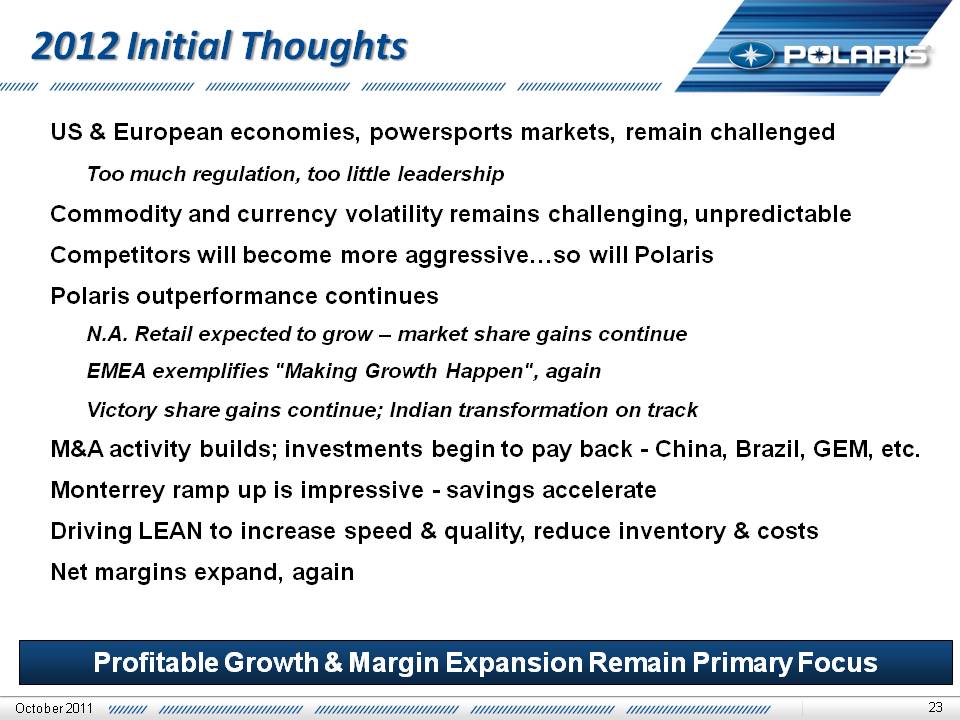
2012 Initial Thoughts US &
European economies, powersports markets, remain challenged Too much
regulation, too little leadership Commodity and currency volatility
remains challenging, unpredictable Competitors will become more
aggressive…so will Polaris Polaris outperformance continues N.A. Retail
expected to grow – market share gains continue EMEA exemplifies "Making
Growth Happen", again Victory share gains continue; Indian
transformation on track M&A activity builds; investments begin to pay
back - China, Brazil, GEM, etc. Monterrey ramp up is impressive -
savings accelerate Driving LEAN to increase speed & quality, reduce
inventory & costs Net margins expand, again 23 Profitable Growth &
Margin Expansion Remain Primary Focus October 2011
Polaris Industries Inc. 24 Thank you. Q & A October 2011