Attached files
| file | filename |
|---|---|
| EX-23 - EX-23 - PARKVALE FINANCIAL CORP | d236754dex23.htm |
| EX-99.1 - EX-99.1 - PARKVALE FINANCIAL CORP | d236754dex991.htm |
| EX-31.2 - EX-31.2 - PARKVALE FINANCIAL CORP | d236754dex312.htm |
| EX-32.1 - EX-32.1 - PARKVALE FINANCIAL CORP | d236754dex321.htm |
| EX-31.1 - EX-31.1 - PARKVALE FINANCIAL CORP | d236754dex311.htm |
UNITED STATES
SECURITIES AND EXCHANGE COMMISSION
Washington, D.C. 20549
Form 10-K
| x | Annual Report Pursuant to Section 13 or 15(d) of the Securities Exchange Act of 1934 |
For the fiscal year ended June 30, 2011
Commission File Number 0-17411
PARKVALE FINANCIAL CORPORATION
(Exact name of registrant as specified in its charter)
| Pennsylvania | 25-1556590 | |
| (State of incorporation) | (I.R.S. Employer Identification Number) | |
| 4220 William Penn Highway, Monroeville, PA | 15146 | |
| (Address of principal executive office) | (Zip code) | |
Registrant’s telephone number, including area code: (412) 373-7200
Securities registered pursuant to Section 12(b) of the Act:
| Common Stock ($1.00 par value) |
Name of Exchange on which registered | |
| (Title of Class) | Nasdaq Select |
Securities registered pursuant to Section 12(g) of the Act- None
Indicate by check mark if the registrant is a well-known seasoned issuer, as defined in Rule 405 of the Securities Exchange Act. Yes ¨ No x
Indicate by check mark if the registrant is not required to file reports pursuant to Section 13 or Section 15(d) of the Act. Yes ¨ No x
Indicate by check mark whether the registrant (1) has filed all reports required by Section 13 or 15(d) of the Securities Exchange Act of 1934 during the preceding 12 months and (2) has been subject to such filing requirements for the past 90 days. Yes x No ¨
Indicate by check mark whether the registrant has submitted electronically and posted on its corporate Web site, if any, every Interactive Data File required to be submitted and posted pursuant to Rule 405 of Regulation S-T (section 232.405 of this chapter) during the preceding 12 months (or for such shorter period that the registrant was required to submit and post such files). Yes ¨ No ¨
Indicate by check mark if disclosure of delinquent filers pursuant to Item 405 of Regulation S-K is not contained herein, and will not be contained, to the best of registrant’s knowledge, in definitive proxy or information statements incorporated by reference in Part III of this Form 10-K or any amendment to this Form 10-K. x
Indicate by check mark whether the registrant is a large accelerated filer, an accelerated filer, a non-accelerated filer, or a smaller reporting company. See the definitions of “large accelerated filer,” “accelerated filer” and “smaller reporting company” in Rule 12b-2 of the Exchange Act. (Check one):
| Large accelerated filer |
¨ |
Accelerated filer |
¨ | |||
| Non-accelerated filer |
¨ (Do not check if a smaller reporting company) |
Smaller reporting company |
x | |||
Indicate by check mark whether the registrant is a shell company (as defined in Rule 12b-2 of the Exchange Act). Yes ¨ No x
As of December 31, 2010, the last business day of the Registrant’s second quarter, the aggregate market value of the voting stock held by nonaffiliates of the Registrant, computed by reference to the reported closing sale price of $9.18 per share on such date was $37,397,043.36 Excluded from this computation are 726,992 shares held by all directors and executive officers as a group and 774,935 shares held by the Employee Stock Ownership Plan.
Number of shares of Common Stock outstanding as of September 23, 2011: 5,582,846
PART I.
Item 1. Business
INTRODUCTION
Parkvale Financial Corporation (“PFC” or “Corporation”) is a unitary savings and loan holding company incorporated under the laws of the Commonwealth of Pennsylvania. Its main operating subsidiary is Parkvale Savings Bank (the “Bank”), which is a Pennsylvania chartered permanent reserve fund stock savings bank headquartered in Monroeville, Pennsylvania. PFC and its subsidiaries are collectively referred to herein as “Parkvale”. Parkvale is also involved in lending in the Columbus, Ohio area through its wholly owned subsidiary, Parkvale Mortgage Corporation (“PMC”). The primary assets of PFC consist of the stock of the Bank, equity securities and cash. See Note N of Notes to Consolidated Financial Statements for additional details regarding PFC.
On June 15, 2011, PFC entered into an Agreement and Plan of Merger (the “Merger Agreement”) with F.N.B. Corporation (“FNB”) pursuant to which PFC will merge with and into FNB (the “Merger”). Promptly following consummation of the Merger, it is expected that the Bank will merge with and into FNB Bank (the “Bank Merger”). Under the terms of the Merger Agreement, shareholders of PFC will receive 2.178 shares of FNB common stock (the “Exchange Ratio”) for each share of PFC common stock they own. The Merger Agreement provides that each outstanding share of PFC’s Fixed Rate Cumulative Perpetual Preferred Stock, Series A (the “PFC TARP Preferred”), unless repurchased or redeemed prior to the Merger, will be converted into the right to receive one share of FNB preferred stock with substantially the same rights, powers and preferences as the PFC TARP Preferred. The outstanding warrant (the “PFC TARP Warrant”) to purchase PFC common stock, which was issued on December 23, 2008 to the United States Department of the Treasury (“Treasury”) will be converted into a warrant to purchase FNB common stock, subject to appropriate adjustments to reflect the Exchange Ratio. Subject to the receipt of requisite regulatory approvals, the parties have agreed to use their best efforts to have the PFC TARP Preferred either purchased by FNB or one of its subsidiaries, in which case it is expected to be extinguished upon consummation of the Merger, or repurchased or redeemed by PFC. FNB also may elect to have the PFC TARP Warrant purchased, redeemed or repurchased. Consummation of the Merger is subject to certain conditions, including, among others, approval of the Merger by shareholders of PFC, governmental filings and regulatory approvals and expiration of applicable waiting periods, accuracy of specified representations and warranties of the other party, effectiveness of the registration statement to be filed by FNB with the SEC to register shares of FNB common stock to be offered to PFC shareholders, absence of a material adverse effect, receipt of tax opinions, and the absence of any injunctions or other legal restraints. For additional information, see Note P in the Notes to Consolidated Financial Statements included in Item 8 herein.
THE BANK
General
The Bank conducts business in the greater Tri-State area through 47 full-service offices with 40 offices in Allegheny, Beaver, Butler, Fayette, Washington and Westmoreland Counties of Pennsylvania, two branches in West Virginia and five branches in Ohio. With total assets of $1.8 billion at June 30, 2011, Parkvale was the third largest financial institution headquartered in the Pittsburgh metropolitan area and ninth largest financial institution with a significant presence in Western Pennsylvania. Parkvale’s main office is located at 4220 William Penn Highway, Monroeville, PA 15146, and its telephone number is (412) 373-7200.
The Bank was originally chartered in 1943 as Park Savings and Loan Association and was renamed as a result of its merger with Millvale Savings and Loan Association in 1968. The Bank converted to a stock savings association in 1987 and to a state chartered savings bank in 1993. The Federal Deposit Insurance Corporation (“FDIC”) is the Bank’s primary federal regulator and the Pennsylvania Department of Banking (“Department”) is the Bank’s primary state regulator. As a Pennsylvania-chartered savings bank, deposits at the Bank are insured by the FDIC to the maximum extent permitted by law and regulation, and the Bank is a member of the Federal Home Loan Bank (“FHLB”) of Pittsburgh. As of July 21, 2011, supervisory and regulatory authority over PFC due to its status as a unitary savings and loan holding company was transferred to the Board of Governors of the Federal Reserve System (the “Federal Reserve Board”) from the now defunct Office of Thrift Supervision (the “OTS”). The Bank is further subject to regulation by the Federal Reserve Board governing reserves to be maintained against deposits and certain other matters.
2
The primary business of Parkvale consists of attracting deposits from the general public in the communities that it serves and investing such deposits, together with other funds, in residential real estate loans, consumer loans, commercial loans, and investment securities. Parkvale focuses on providing a wide range of consumer and commercial services to individuals, partnerships and corporations in the greater Pittsburgh metropolitan area, which comprises its primary market area. In addition to the loans described above, these services include various types of deposit and checking accounts, including commercial checking accounts and automated teller machines (“ATMs”) as part of the STAR network.
Parkvale derives its income primarily from interest charged on loans, interest on investments, and, to a lesser extent, service charges and fees. Parkvale’s principal expenses are interest on deposits and borrowings and operating expenses. Funds for lending activities are provided principally by deposits, loan repayments, FHLB advances and other borrowings, and earnings provided by operations.
Lower housing demand in Parkvale’s primary lending areas, relative to its deposit growth, has historically spurred the Bank to purchase residential mortgage loans from other financial institutions in the secondary market. This purchase strategy also achieves geographic asset diversification. Parkvale purchases adjustable rate residential mortgage loans subject to its normal underwriting standards. Parkvale purchased $10.7 million or 10.9% of total mortgage loan originations and purchases during fiscal 2011, $6.3 million or 7.4% of total mortgage loan originations and purchases during fiscal 2010 and did not purchase loans during fiscal 2009. The amount of loans originated by Parkvale increased from $177.3 million in fiscal 2010 to $215.6 million in fiscal 2011. The increased loan purchase and origination activity during fiscal 2011 was offset by principal reductions resulting in a decline in the net loan portfolio from $1.0 billion at June 30, 2010 to $984.0 million at June 30, 2011, with most of the decline occurring in the single-family residential loan portfolio. Loan purchase activities increased by $4.4 million compared to fiscal 2010, but remain below historical levels as a result of uncertainties related to the secondary market. In addition, Parkvale operates a loan production office through its subsidiary, PMC, with an office in Columbus, Ohio. During fiscal 2011, PMC originated a total of $13.6 million or 13.8% of total mortgage loan originations and purchases for inclusion in Parkvale’s loan portfolio. See “Lending Activities” and “Sources of Funds”.
Total nonperforming assets, comprised of nonaccrual loans and foreclosed real estate, decreased from $35.2 million at June 30, 2010 to $31.2 million at June 30, 2011. The $4.0 million decrease in fiscal 2011 is primarily due to lower levels of nonaccrual mortgage loans at June 30, 2011. See “Lending Activities — Nonperforming Loans and Foreclosed Real Estate”.
The exposure to interest rate risk (“IRR”) is the impact on Parkvale’s current and future earnings and capital from movements in interest rates. To properly manage and mitigate the financial impact of IRR, Parkvale’s management has implemented an asset and liability management plan to increase the interest rate sensitivity of its assets and extend the average maturity of its liabilities. As part of this program, Parkvale has, among other things (1) promoted the origination and purchase of adjustable rate mortgage (“ARM”) loans or the purchase of adjustable rate investment securities, (2) maintained a high level of liquidity, (3) emphasized the origination of short-term and/or variable rate consumer/commercial loans and (4) attempted to extend the average maturity of its deposits through the promotion of certificate accounts with terms of one year or more. For additional discussion of asset and liability management, see the Asset and Liability Management section of “Management’s Discussion and Analysis of Financial Condition and Results of Operations”.
Interest rate sensitivity gap analysis provides one indicator of potential IRR by comparing interest-earning assets and interest-bearing liabilities maturing or repricing at similar intervals. The interest rate sensitivity gap equals the difference between interest-earning assets and interest-bearing liabilities, and the gap ratio equals the gap divided by total assets. The one-year gap ratio was 9.28% of total assets at June 30, 2011 compared to 12.45% of total assets at June 30, 2010. The cumulative five-year gap ratio was 5.91% at June 30, 2010 and 1.88% at June 30, 2011. A key component of the asset and liability management program is to maintain an acceptable level of interest sensitive adjustable rate loans. Adjustable rate loans represented approximately 55.7% of the Bank’s loan portfolio at June 30, 2011 compared to 58.4% and 59.4% at June 30, 2010 and 2009, respectively. Deposits with rate sensitivity in excess of one year increased $33.1 million from $865.6 million at June 30, 2010 to $898.7 million at June 30, 2011.
3
The Banking Industry
Although we experienced a significant recovery in asset markets through 2010, the outlook for the U.S. banking industry remains in question due to persistent weakness in the economy and the corresponding lack of jobs growth. Weak loan demand continues to impede revenue growth, and bank profits continue to be squeezed due to increased regulation and enforcement, notably in the credit and debit card space, as well as remaining issues relating to mortgage lending and the foreclosure crisis.
The banking industry continues to face headwinds; however, data suggests that the credit turmoil that erupted in 2008 has largely subsided and the worst of the credit crisis may be behind us. First quarter 2011 earnings of all FDIC insured institutions were $29.0 billion. This is an increase of $11.6 billion over the same period last year and the best quarterly result since the second quarter of 2007. Lower provisions for loan losses and reduced expenses for goodwill impairment were major contributors to the earnings improvement.
Industry wide, loans and leases in non-accrual status have decreased for four consecutive quarters. Non-accrual loans decreased by 4.7% in the first quarter of 2011 versus the first quarter of 2010. Additionally, loss provisions in the first quarter 2011 were less than half of last year’s figure signaling a significant improvement in asset quality compared to 2010.
At its June 22, 2011 meeting, the Federal Open Market Committee (“FOMC”) commented that the economic recovery is continuing at a moderate pace, though somewhat more slowly than the Committee had expected. Also, recent labor market indicators have been weaker than anticipated. The slower pace of the recovery reflects in part factors that are likely to be temporary, including higher food and energy prices as well as supply chain disruptions associated with the tragic events in Japan. The Committee continues to anticipate that economic conditions, including low rates of resource utilization and a subdued outlook for inflation over the medium run, are likely to warrant exceptionally low levels for the federal funds rate for an extended period.
Parkvale will continue to be affected by these and other market and economic conditions, such as factors affecting the markets for debt and equity securities, as well as legislative, regulatory, accounting and tax changes which are beyond its control. Parkvale has positioned its liquidity level to remain flexible to the high volatility of the financial markets. For additional discussion of asset/liability management, see the Asset and Liability Management section of “Management’s Discussion and Analysis of Financial Condition and Results of Operations”.
BUSINESS
Lending Activities
Loan Activity and Portfolio Composition
The following table shows Parkvale’s loan origination, purchase and sale activity on a consolidated basis during the years ended June 30.
| 2011 | 2010 | 2009 | ||||||||||
| (Dollars in thousands) | ||||||||||||
| Gross loans receivable at beginning of year |
$ | 1,050,755 | $ | 1,125,886 | $ | 1,216,110 | ||||||
| Loan originations: |
||||||||||||
| Mortgage loans: |
||||||||||||
| 1-4 family (1) (2) |
69,845 | 52,222 | 54,446 | |||||||||
| Commercial (3) |
17,975 | 26,364 | 37,745 | |||||||||
|
|
|
|
|
|
|
|||||||
| Total mortgage loan originations |
87,820 | 78,586 | 92,191 | |||||||||
| Consumer loan originations |
68,612 | 63,928 | 61,237 | |||||||||
| Commercial business loan originations |
59,522 | 34,776 | 14,521 | |||||||||
|
|
|
|
|
|
|
|||||||
| Total loan originations |
215,594 | 177,290 | 167,949 | |||||||||
| Purchase of loans |
10,722 | 6,270 | — | |||||||||
|
|
|
|
|
|
|
|||||||
| Total loan originations and purchases |
226,676 | 183,560 | 167,949 | |||||||||
| Principal loan repayments |
143,069 | 119,842 | 87,178 | |||||||||
| Mortgage loan payoffs |
132,613 | 131,322 | 154,758 | |||||||||
| Sales of whole loans |
— | 7,527 | 16,237 | |||||||||
|
|
|
|
|
|
|
|||||||
| Net decrease in loans |
(49,006 | ) | (75,131 | ) | (90,224 | ) | ||||||
|
|
|
|
|
|
|
|||||||
| Gross loans receivable at end of year |
$ | 1,001,749 | $ | 1,050,755 | $ | 1,125,886 | ||||||
|
|
|
|
|
|
|
|||||||
4
| (1) | Includes $13.6 million, $9.8 million and $15.5 million of loans originated by PMC during fiscal 2011, 2010 and 2009, respectively. |
| (2) | Includes $2.1 million, $618,000 and $3.0 million of 1-4 family construction loans originated during fiscal 2011, 2010 and 2009, respectively. |
| (3) | Includes $2.7 million, $6.0 million and $9.0 million of multi-family real estate loans originated during fiscal 2011, 2010 and 2009, respectively. |
The following table sets forth the composition of the Bank’s loan portfolio by segment at June 30.
| 2011 | 2010 | 2009 | ||||||||||||||||||||||
| Amount | % | Amount | % | Amount | % | |||||||||||||||||||
| (Dollars in thousands) | ||||||||||||||||||||||||
| Mortgage loans: |
||||||||||||||||||||||||
| 1-4 family (1) |
$ | 615,884 | 62.6 | $ | 660,685 | 64.0 | $ | 726,586 | 65.5 | |||||||||||||||
| Commercial (2) |
162,533 | 16.5 | 159,991 | 15.5 | 163,849 | 14.8 | ||||||||||||||||||
|
|
|
|
|
|
|
|
|
|
|
|
|
|||||||||||||
| Total mortgage loans |
778,417 | 79.1 | 820,676 | 79.5 | 890,435 | 80.3 | ||||||||||||||||||
| Consumer loans (3) |
183,212 | 18.6 | 189,634 | 18.4 | 190,849 | 17.2 | ||||||||||||||||||
| Commercial business loans |
40,120 | 4.1 | 40,445 | 3.9 | 44,602 | 4.0 | ||||||||||||||||||
|
|
|
|
|
|
|
|
|
|
|
|
|
|||||||||||||
| Total gross loans receivable |
1,001,749 | 101.80 | 1,050,755 | 101.8 | 1,125,886 | 101.5 | ||||||||||||||||||
| Less: |
||||||||||||||||||||||||
| Loans in process |
— | 0.0 | 135 | 0.0 | 60 | 0.0 | ||||||||||||||||||
| Allowance for losses |
18,626 | 1.9 | 19,209 | 1.9 | 17,960 | 1.6 | ||||||||||||||||||
| Unamortized premiums |
(873 | ) | (0.1 | ) | (952 | ) | (0.1 | ) | (1,070 | ) | (0.1 | ) | ||||||||||||
|
|
|
|
|
|
|
|
|
|
|
|
|
|||||||||||||
| Net loans receivable |
$ | 983,996 | 100.0 | % | $ | 1,032,363 | 100.0 | % | $ | 1,108,936 | 100.0 | % | ||||||||||||
|
|
|
|
|
|
|
|
|
|
|
|
|
|||||||||||||
| 2008 | 2007 | |||||||||||||||||||||||
| Amount | % | Amount | % | |||||||||||||||||||||
| (Dollars in thousands) | ||||||||||||||||||||||||
| Mortgage loans: |
||||||||||||||||||||||||
| 1-4 family (1) |
$ | 828,516 | 69.0 | $ | 859,972 | 69.7 | ||||||||||||||||||
| Commercial (2) |
160,856 | 13.4 | 163,082 | 13.2 | ||||||||||||||||||||
|
|
|
|
|
|
|
|
|
|||||||||||||||||
| Total mortgage loans |
989,372 | 82.4 | 1,023,054 | 82.9 | ||||||||||||||||||||
| Consumer loans (3) |
183,095 | 15.2 | 178,668 | 14.5 | ||||||||||||||||||||
| Commercial business loans |
43,643 | 3.6 | 45,184 | 3.7 | ||||||||||||||||||||
|
|
|
|
|
|
|
|
|
|||||||||||||||||
| Total gross loans receivable |
1,216,110 | 101.2 | 1,246,906 | 101.1 | ||||||||||||||||||||
| Less: |
||||||||||||||||||||||||
| Loans in process |
236 | 0.0 | 98 | 0.0 | ||||||||||||||||||||
| Allowance for losses |
15,249 | 1.3 | 14,189 | 1.2 | ||||||||||||||||||||
| Unamortized premiums |
(1,040 | ) | (0.1 | ) | (1,778 | ) | (0.1 | ) | ||||||||||||||||
|
|
|
|
|
|
|
|
|
|||||||||||||||||
| Net loans receivable |
$ | 1,201,665 | 100.0 | % | $ | 1,234,397 | 100.0 | % | ||||||||||||||||
|
|
|
|
|
|
|
|
|
|||||||||||||||||
| (1) | Includes FHA and VA loans. |
| (2) | Includes multi family loans, short-term construction loans to developers and loans for purchase and development of land. |
| (3) | Primarily includes home equity loans and home equity lines of credit, and to a lesser extent, personal lines of credit, student loans, personal loans, charge cards, home improvement loans, automobile loans and deposit loans. |
5
At June 30, 2011, Parkvale’s gross loan portfolio amounted to 1.0 billion, representing 55.5% of Parkvale’s total assets at that date. Parkvale has traditionally concentrated its lending activities on conventional first mortgage loans secured by residential property. Conventional loans are not insured by the Federal Housing Administration (“FHA”) or guaranteed by the Department of Veteran’s Affairs (“VA”). FHA and VA loans aggregated $231,000, $229,000, $332,000, $359,000 and $410,000 of the 1-4 family mortgage loans at June 30, 2011, June 30, 2010, June 30, 2009, June 30, 2008 and June 30, 2007, respectively. Multi-family loans aggregated $31.5 million, $32.1 million, $34.2 million, $29.7 million and $32.5 million of the commercial mortgage loans at June 30, 2011, June 30, 2010, June 30, 2009, June 30, 2008 and June 30, 2007, respectively.
The following table sets forth the percentage of gross loans receivable by segment in each category to total loans at June 30:
| 2011 | 2010 | 2009 | 2008 | 2007 | ||||||||||||||||
| Mortgage loans |
77.7 | % | 78.1 | % | 79.0 | % | 81.3 | % | 82.1 | % | ||||||||||
| Consumer loans |
18.3 | 18.1 | 17.0 | 15.1 | 14.3 | |||||||||||||||
| Commercial business loans |
4.0 | 3.8 | 4.0 | 3.6 | 3.6 | |||||||||||||||
|
|
|
|
|
|
|
|
|
|
|
|||||||||||
| Total Loans |
100.0 | % | 100.0 | % | 100.0 | % | 100.0 | % | 100.0 | % | ||||||||||
|
|
|
|
|
|
|
|
|
|
|
|||||||||||
Contractual Maturities of Loans
The following table presents information regarding loan contractual maturities as of June 30, 2011 by loan categories during the periods indicated. Mortgage loans with adjustable interest rates are shown in the year in which they are contractually due rather than in the year in which they reprice. The amounts shown for each period do not take into account loan prepayments and normal amortization of the Bank’s loan portfolio:
| Amounts Due in Years Ending June 30, |
Mortgage Loans (1) |
Commercial Business Loans (2) |
Consumer Loans (3) |
|||||||||||
| (Dollars in thousands) | ||||||||||||||
| 2012 |
$ | 9,852 | $ | 23,907 | $ | 88,491 | ||||||||
| 2013 – 2016 |
35,845 | 13,017 | 33,009 | |||||||||||
| 2017 and thereafter |
732,720 | 3,196 | 61,712 | |||||||||||
|
|
|
|
|
|
|
|||||||||
| Gross loans receivable |
$ | 778,417 | $ | 40,120 | $ | 183,212 | ||||||||
|
|
|
|
|
|
|
|||||||||
| (1) | Of the $768.6 million of mortgage loans maturing after June 30, 2012, $331.1 million are fixed rate loans and $437.5 million are adjustable rate loans. |
| (2) | Of the $16.2 million of commercial business loans maturing after June 30, 2012, $14.7 million are fixed rate loans and $1.5 million are adjustable rate loans. |
| (3) | Of the $94.7 million of consumer loans maturing after June 30, 2012, $87.2 million are fixed rate loans and $7.5 million are adjustable rate loans. |
The average life of mortgage loans has been substantially less than the average contractual terms of such loans because of loan prepayments and, to a lesser extent, because of enforcement of due-on-sale clauses, which enable Parkvale to declare a loan immediately due and payable in the event that the borrower sells or otherwise disposes of the real property. The average life of mortgage loans tends to increase, however, when market rates on new mortgages substantially exceed rates on existing mortgages and, conversely, decrease when rates on new mortgages are substantially below rates on existing mortgages. During the past five fiscal years, many borrowers refinanced their mortgage loans in order to take advantage of low market rates.
Origination, Purchase and Sale of Loans
As a Pennsylvania-chartered, federally insured savings bank, the Bank has the ability to originate or purchase real estate loans secured by properties located throughout the United States. At June 30, 2011, the majority of loans in Parkvale’s portfolio are secured by real estate located in its primary market area, which consists of the greater Pittsburgh metropolitan and tri-state area. However, 35.2% and 37.7% of Parkvale’s total mortgage loan portfolio at June 30, 2011 and 2010, respectively, represented loans serviced by others, the majority of which are secured by
6
properties located outside of Pennsylvania, including, in order of loan concentration: Ohio, West Virginia, and Virginia. No state outside of the market area with Parkvale locations has more than 3% of mortgage loans outstanding. There were $10.7 million of loan purchases during fiscal 2011 as compared to $6.3 million of loan purchases during fiscal 2010, which amounted to 10.9% and 7.4% of Parkvale’s real estate originations and purchases for fiscal 2011 and 2010, respectively. See further discussion below.
Parkvale originates new loans primarily within its primary market area or through the PMC office in Columbus, Ohio. In addition, Parkvale purchases loan participations and whole loans from other institutions in the secondary market.
All of Parkvale’s mortgage lending is subject to its written underwriting standards and to loan origination procedures approved by the Board of Directors. Decisions on loan applications are based upon a number of factors including, but not limited to, property valuations by independent appraisers, credit history and cash flow available to service debt. Parkvale’s Loan Committee consists of at least three senior officers and is authorized to approve residential, consumer and commercial real estate credit requests up to $750,000. Requests exceeding $750,000 and requests exceeding $375,000 in which the total borrower loan relationship exceeds $1.5 million must be recommended for approval by the Loan Committee and require specific Board of Directors or its Executive Committee approval. The Loan Committee is authorized to approve commercial and industrial credit requests up to $600,000. Requests in excess of $600,000 and for extension of credit in excess of $300,000 where the total borrowing relationship exceeds $1.2 million must be recommended for approval by Loan Committee and require specific Board of Directors or its Executive Committee approval. Additionally, the Loan Committee has the authority to approve municipal and school district tax anticipation loans without regard to dollar limit. Borrowing relationships with municipalities and school districts are subject to regulatory lending limits. Tax anticipation loans approved by the Loan Committee are submitted to the Board of Directors for ratification.
Under policies adopted by Parkvale’s Board of Directors, Parkvale generally limits the loan-to-value ratio to 80% on newly originated first lien residential mortgage loans, or up to 97% with private mortgage insurance. Depending upon the amount of private mortgage insurance obtained by the borrower, Parkvale’s loan exposure may be reduced to 65% of the value of the property. Commercial real estate loans generally do not exceed 80% of the value of the secured property. In addition, it is Parkvale’s general policy to obtain title insurance policies or certificates of title insuring that Parkvale has a valid first lien on mortgaged real estate.
Originations by Parkvale. Historically, Parkvale has originated mortgage loans primarily through referrals from real estate brokers, builders and direct customers, as well as refinancing for existing customers. Parkvale makes consumer and commercial loan originations within its primary market area. Total loan originations for the fiscal years ending June 30, 2011, 2010 and 2009 were $215.6 million, $177.3 million and $167.9 million, respectively. See the chart on page 4 for detailed activity for the past three fiscal years.
Loan Purchases. Parkvale loan purchases were $10.7 million in fiscal 2011 compared to $6.3 million in fiscal 2010 and none in fiscal 2009. The level of purchases increased slightly during fiscal 2011, but remains below historical levels due to uncertainties in the secondary mortgage market that began in August 2008. In fiscal 2011 and 2010, all of the purchased loans were fixed rate loans with a remaining term of less than fifteen years. Typically, Parkvale purchases loans to supplement the portfolio during periods of loan origination shortfalls and takes advantage of market opportunities when yields on whole loans are greater than similarly securitized loans. Loan purchases are higher when prepayment speeds increase on existing portfolios. All loan purchases are subject to Parkvale’s underwriting standards and are purchased from reputable mortgage banking institutions.
Loan Sales. During fiscal 2003, the Bank entered into an agreement with Freddie Mac to sell fixed rate loans at origination in the secondary market. Parkvale is an approved seller/servicer with Freddie Mac. Parkvale generally retains the right to service loans sold or securitized. During fiscal 2011 there were no sales, during 2010 and 2009, there were sales of $7.5 million and $16.2 million respectively, which were newly originated fixed rate loans in both years.
7
1-4 Family Mortgage Loans
Parkvale offers fixed-rate mortgages and ARMs with amortization periods of up to 30 years. The monthly payment amounts on all Parkvale residential mortgage ARMs are reset at each interest rate adjustment period without affecting the maturity of the ARM. Interest rate adjustments generally occur on either a one, three or five year basis and allow a maximum change of 2% to 3% per adjustment period, with a 6% or 7% maximum rate increase over the life of the loan. ARMs comprised approximately 30.0%, 40.5% and 48.3% of total mortgage loan originations and purchases in fiscal 2011, 2010 and 2009, respectively. At June 30, 2011, ARMs represented 53.9% of Parkvale’s total residential loan portfolio. ARM loans generally do not adjust as rapidly as Parkvale’s cost of funds. Parkvale has been emphasizing the origination of adjustable-rate versus long-term fixed-rate residential mortgages for its portfolio as part of its asset and liability plan to increase the rate sensitivity of its assets. Loans included in the loan portfolio that are interest only for the initial years of the loan aggregated $154.0 million or 25.0% of the 1-4 family mortgage at June 30, 2011. The initial interest only period for $59.1 million of the aggregate $154.0 million, or 38.4% of the gross initial interest only mortgage portfolio, has expired, and the loans are fully amortizing at June 30, 2011.
Commercial Mortgage Loans
The balance of commercial mortgage loans was $162.5 million at June 30, 2011 versus $160.0 million at June 30, 2010. Commercial mortgage loans offer more attractive yields than residential real estate loans and are conservatively underwritten and well secured, as are residential loans. Also, these loans are made in the Greater Pittsburgh and tri-state area, which traditionally has not experienced the dramatic real estate price fluctuations that have occurred in certain other geographic areas.
Consumer Loans
Parkvale offers a full complement of consumer loans, including home equity loans, home equity and personal lines of credit, personal loans, home improvement loans, credit cards and automobile loans. Total consumer loans outstanding at June 30, 2011 decreased by $6.4 million to $183.2 million from $189.6 million at June 30, 2010. Parkvale had offered home equity lines of credit up to 120% of collateral value at a competitive introductory rate, but reduced the underwriting guideline to 90% in fiscal 2009. Of an aggregate $77.9 million in outstanding lines of credit at June 30, 2011, $68.1 million have a loan to value ratio of less than 90% and $9.8 million have a loan to value ratio of 90% or above. Consumer loans generally have shorter terms and greater interest rate sensitivity and margins than residential real estate loans.
Home equity lines are revolving and range from $5,000 to $250,000. The amount of the available line of credit is determined by the borrower’s ability to pay, the borrower’s credit history and the amount of collateral equity. Personal and overdraft lines of credit are generally unsecured and are extended for $300 to $25,000. Line of credit interest rates are variable and indexed to Parkvale’s prime rate.
Parkvale’s deposit loans are made on a demand basis for up to 100% of the balance of the account securing the loan. The interest rate on deposit loans generally equals the rate on the underlying account plus a minimum of 100 basis points.
Commercial Loans
Parkvale’s commercial loans are primarily of a short-term nature and are extended to small businesses and professionals located within the communities served by Parkvale. Generally, the purpose of the loan dictates the basis for its repayment. Parkvale offers both secured and unsecured commercial loans. In originating commercial loans, the borrower’s historical and projected ability to service the proposed debt is of primary importance. Interest rates are generally variable and indexed to Parkvale’s prime rate. Fixed-rate commercial loans are extended based upon Parkvale’s ability to match available funding sources to loan maturities. Parkvale generally requires personal guarantees on its commercial loans. Commercial loans were $40.1 million and $40.4 million at June 30, 2011 and 2010, respectively.
8
Loan Servicing and Loan Fees
Interest rates and fees charged by Parkvale on mortgage loans are primarily determined by funding costs and competitive rates offered in its market area. Mortgage loan rates reflect factors such as general interest rate levels, the availability of money and loan demand.
After originating fixed rate mortgage loans, Parkvale has the ability to sell its loans in the secondary mortgage market, primarily to Freddie Mac as an approved seller/servicer. During fiscal 2011, the Bank did not sell loans to Freddie Mac. Parkvale generally retains the right to service loans sold or securitized in order to generate additional servicing fee income. The amount of loans serviced by Parkvale for Freddie Mac was $46.8 million at June 30, 2011 and was $57.3 million at June 30, 2010. During fiscal 2010, $7.5 million of loans were sold to Freddie Mac and $16.2 million were sold during fiscal 2009. Prior to fiscal 2009, mortgage loan securitizations or sale transactions were limited to certain loans made in conjunction with various state and local bond programs designed to assist first time and/or low income home buyers. Parkvale may or may not service these loans depending on the terms of the specific program.
In addition to interest earned on loans and income from servicing of loans, Parkvale generally receives fees in connection with loan commitments and originations, loan modifications, late payments, changes of property ownership and for miscellaneous services related to its loans. Income from these activities varies with the volume and type of loans originated. The fees received by Parkvale in connection with the origination of conventional mortgage loans on single-family properties vary depending on the loan terms selected by the borrower.
Parkvale defers loan origination and commitment fees and certain direct loan origination costs over the contractual life of a loan as an adjustment of yield. Indirect loan origination costs are charged to expense as incurred. Deferred loan origination fees were $159,000, $94,000 and $55,000 at June 30, 2011, 2010 and 2009, respectively. The remaining balances primarily reflect the fees deferred related to the commercial real estate and commercial loan portfolio.
Nonperforming Loans and Foreclosed Real Estate
See “Management’s Discussion and Analysis” — “Non-Performing Loans and Foreclosed Real Estate” for information regarding Parkvale’s nonaccrual loans and foreclosed real estate.
A loan is considered delinquent when a borrower fails to make contractual payments on the loan. If the delinquency exceeds 90 days, Parkvale generally institutes legal action to remedy the default. In the case of real estate loans, this includes foreclosure action. If a foreclosure action is instituted and the loan is not reinstated, paid in full or refinanced, the property is sold at a judicial sale at which, in most instances, Parkvale is the buyer. The acquired property then becomes “foreclosed real estate” until it is sold. In the case of consumer and commercial business loans, the measures to remedy defaults include the repossession of the collateral, if any, and initiation of proceedings to collect and/or liquidate the collateral and/or act against guarantees related to the loans.
Loans are placed on nonaccrual status when, in management’s judgment, the probability of collection of principal and interest is deemed to be insufficient to warrant further accrual. When a loan is placed on nonaccrual status, previously accrued but unpaid interest is deducted from interest income. As a result, no uncollected interest income is included in earnings for loans on nonaccrual status. Parkvale provides an allowance for the loss of accrued but uncollected interest on mortgage, consumer and commercial business loans that are 90 days or more contractually past due.
A loan is considered impaired when, based on current information and events, it is probable that Parkvale will be unable to collect the scheduled payments of principal or interest when due according to the contractual terms of the loan agreement. Factors considered by management in determining impairment include payment status, collateral value and the probability of collecting scheduled principal and interest payments when due. Loans that experience insignificant payment delays and payment shortfalls generally are not classified as impaired. Management determines the significance of payment delays and payment shortfalls on a case-by-case basis, taking into consideration all of the known circumstances surrounding the loan and the borrower, including the length of the delay, the reasons for the delay, the borrower’s prior payment record and the amount of the shortfall in relation to the principal and interest owed. Impairment is measured on a loan by loan basis for commercial business loans and commercial mortgage loans by either the present value of expected future cash flows discounted at the loan’s effective interest rate or the fair value of the collateral if the loan is collateral dependent.
9
An allowance for loan losses is established for an impaired loan if its carrying value exceeds its estimated fair value. The estimated fair values of substantially all of Parkvale’s impaired loans are measured based on the estimated fair value of the loan’s collateral.
For commercial loans secured by real estate, estimated fair values are determined primarily through third-party appraisals. When a real estate secured loan becomes impaired, a decision is made regarding whether an updated certified appraisal of the real estate is necessary. This decision is based on various considerations, including the age of the most recent appraisal, the loan-to-value ratio based on the original appraisal and the condition of the property. Appraised values are discounted to arrive at the estimated selling price of the collateral, which is considered to be the estimated fair value. The discounts also include estimated costs to sell the property.
For commercial business loans secured by non-real estate collateral, such as accounts receivable, inventory and equipment, estimated fair values are determined based on the borrower’s financial statements, inventory reports, accounts receivable aging or equipment appraisals or invoices. Indications of value from these sources are generally discounted based on the age of the financial information or the quality of the assets.
Large groups of smaller balance homogeneous loans are collectively evaluated for impairment. Accordingly, Parkvale does not separately identify individual 1-4 family mortgage loans or consumer loans for impairment disclosures, unless such loans are the subject of a troubled debt restructuring agreement.
Loans whose terms are modified are classified as troubled debt restructurings if Parkvale grants such borrowers concessions and it is deemed that those borrowers are experiencing financial difficulty. Concessions granted under a troubled debt restructuring generally involve a temporary reduction in interest rate or an extension of a loan’s stated maturity date. Non-accrual troubled debt restructurings are restored to accrual status if a pattern of consistent principal and interest payments under the modified terms is demonstrated after modification. Loans classified as troubled debt restructurings are designated as impaired loans. See Note C of “Notes to Consolidated Financial Statements” for additional information on loan impairment. Impaired assets include $9.8 million of foreclosed real estate as of June 30, 2011. Foreclosed real estate properties are recorded at the lower of the carrying amount or fair value of the property less the cost to sell.
Allowance for Loan Losses
The following table sets forth the activity in the allowance for loan losses for the years ended June 30:
| 2011 | 2010 | 2009 | 2008 | 2007 | ||||||||||||||||
| (Dollars in thousands) | ||||||||||||||||||||
| Beginning balance |
$ | 19,209 | $ | 17,960 | $ | 15,249 | $ | 14,189 | $ | 14,907 | ||||||||||
| Provision for loan losses |
3,531 | 7,448 | 6,754 | 2,331 | 828 | |||||||||||||||
| Loans recovered: |
||||||||||||||||||||
| Consumer |
161 | 46 | 31 | 54 | 19 | |||||||||||||||
| Commercial business |
28 | 3 | 4 | 18 | 13 | |||||||||||||||
| Mortgage |
427 | 1 | — | 241 | 27 | |||||||||||||||
|
|
|
|
|
|
|
|
|
|
|
|||||||||||
| Total recoveries |
616 | 50 | 35 | 313 | 59 | |||||||||||||||
|
|
|
|
|
|
|
|
|
|
|
|||||||||||
| Loans charged-off: |
||||||||||||||||||||
| Consumer |
(520 | ) | (542 | ) | (324 | ) | (453 | ) | (287 | ) | ||||||||||
| Commercial business |
(133 | ) | (752 | ) | (344 | ) | (372 | ) | (842 | ) | ||||||||||
| Mortgage |
(4,077 | ) | (4,955 | ) | (3,410 | ) | (759 | ) | (476 | ) | ||||||||||
|
|
|
|
|
|
|
|
|
|
|
|||||||||||
| Total charge-offs |
(4,730 | ) | (6,249 | ) | (4,078 | ) | (1,584 | ) | (1,605 | ) | ||||||||||
|
|
|
|
|
|
|
|
|
|
|
|||||||||||
| Net charge-offs |
(4,114 | ) | (6,199 | ) | (4,043 | ) | (1,271 | ) | (1,546 | ) | ||||||||||
|
|
|
|
|
|
|
|
|
|
|
|||||||||||
| Ending balance |
$ | 18,626 | $ | 19,209 | $ | 17,960 | $ | 15,249 | $ | 14,189 | ||||||||||
|
|
|
|
|
|
|
|
|
|
|
|||||||||||
| Percentage of net charge-offs to average loans outstanding |
0.41 | % | 0.59 | % | 0.35 | % | 0.11 | % | 0.13 | % | ||||||||||
10
During fiscal 2011, the provision for loan losses decreased to $3.5 million from $7.4 million in fiscal 2010 consistent with the overall characteristics of the loan portfolio, which is continually evaluated by management. Resources continue to be directed toward reducing the levels of nonaccrual loans and foreclosed real estate, which decreased to $31.2 million at June 30, 2011 from $35.2 million at June 30, 2010 and the peak of $40.9 million at September 30, 2009.
The allowance for loan losses is established as losses are estimated to have occurred through a provision for loan losses charged to earnings. Loan losses are charged against the allowance when management believes the uncollectibility of a loan balance is confirmed. Subsequent recoveries, if any, are credited to the allowance.
The allowance for loan losses is evaluated on a regular basis by management and is based upon management’s periodic review of the collectability of the loans in light of historical experience, the nature and volume of the loan portfolio, adverse situations that may affect the borrower’s ability to repay, estimated value of any underlying collateral and prevailing economic conditions. This evaluation is inherently subjective as it requires estimates that are susceptible to significant revision as more information becomes available.
The allowance consists of allocated and general components. The allocated component relates to loans that are classified as impaired. For those loans that are classified as impaired, an allowance is established when the discounted cash flows (or collateral value or observable market price) of the impaired loan is lower than the carrying value of that loan. The general component covers non-classified loans and is based on historical charge-off experience and expected loss derived from Parkvale’s internal risk rating process. Other adjustments may be made to the allowance for pools of loans after an assessment of internal or external influences on credit quality that are not fully reflected in the historical loss or risk rating data.
The allowance for loan loss was $18.6 million at June 30, 2011 and $19.2 million at June 30, 2010 or 1.86% and 1.83% of gross loans at June 30, 2011 and 2010, respectively. This decrease, as well as the decrease to the provision for loan losses, is consistent with the overall improvement to the loan portfolio, and stabilization of general economic conditions that has affected performance of the loan portfolio. The adequacy of the allowance for loan loss is determined by management through evaluation of the loss potential on individual nonperforming, delinquent and high dollar loans, economic and business trends, growth and composition of the loan portfolio and historical loss experience, as well as other relevant factors.
The adequacy of the allowance for loan loss is continually monitored by management with an emphasis on identifying potential portfolio risks to detect potential credit deterioration in the early stages, including trends and risks in the market place and loan types. Management, in conjunction with the Loan Review Committee, establishes allowances based upon its evaluation of the inherent risks in the loan portfolio. Management believes the allowance for loan loss is adequate to absorb loan losses. For additional discussion of Allowance for Loan Losses, see “Management’s Discussion and Analysis” in this Annual Report Allowance for Loan Losses and Provision for Loan Losses”.
Investment Activities
In accordance with policies established by Parkvale’s Board of Directors, investment decisions are made by authorized officers, which include the Chief Executive Officer or the Chief Financial Officer.
Parkvale’s investment portfolio consisted of the following securities at June 30 of the years indicated.
| (Dollars in thousands) | 2011 | 2010 | 2009 | |||||||||
| U.S. Government and agency obligations |
$ | 172,053 | $ | 194,248 | $ | 108,682 | ||||||
| Municipal obligations |
26,445 | 21,641 | 19,165 | |||||||||
| Trust preferred securities |
30,266 | 33,551 | 77,660 | |||||||||
| Corporate debt |
32,501 | 27,112 | 57,464 | |||||||||
| Mortgage-backed securities |
270,924 | 226,704 | 241,058 | |||||||||
| Equity securities (at fair value) |
5,245 | 5,966 | 9,679 | |||||||||
| FHLB stock |
12,310 | 14,357 | 13,826 | |||||||||
|
|
|
|
|
|
|
|||||||
| Total investment portfolio |
$ | 549,744 | $ | 523,579 | $ | 527,534 | ||||||
|
|
|
|
|
|
|
|||||||
11
As part of its investment and interest rate risk management strategy, Parkvale has shortened the duration of its investment portfolio by purchasing short-term agency callable and multi-step securities in anticipation of rising interest rates. Parkvale also invests in mortgage-backed securities which are guaranteed by Freddie Mac, Fannie Mae or the Government National Mortgage Association (“GNMA”), as well as agency collateralized mortgage obligations (“CMO”). GNMA securities are guaranteed as to principal and interest by the full faith and credit of the United States Treasury, while Freddie Mac and Fannie Mae debt securities are guaranteed by their respective government sponsored agencies. At June 30, 2011, Parkvale had $270.9 million, or 15.0% of total assets invested in mortgage-backed securities, as compared to 12.3% and 12.6% at June 30, 2010 and 2009, respectively. At June 30, 2011, the mortgage-backed securities included Freddie Mac ($21.8 million); GNMA ($62.8 million); Fannie Mae ($117.1 million); agency CMOs ($12.6 million) and non-agency CMOs ($56.7 million). All of the non-agency CMO securities were rated AAA at purchase and carry an adjustable interest rate.
At June 30, 2010, the credit quality of non-agency CMO securities rated below investment grade as a result of downgrades by the national rating agencies was evaluated. Based upon actual and future credit deterioration projections and results of the evaluation, the Bank decided as of June 30, 2010 to sell fifteen non-agency CMO securities in the near term. These debt securities were reclassified from held to maturity to available for sale at June 30, 2010 and other than temporary impairment charges of $13.1 million were recognized in earnings during fiscal 2010 as the difference between the respective investment’s amortized cost basis and fair value at June 30, 2010. The remaining carrying value of the available for sale non-agency CMO securities was $59.8 million at June 30, 2010. During the September 30, 2010 quarter, a total of $49.0 million of below-investment grade non-agency collateralized mortgage obligations, which were classified as available for sale at June 30, 2010, were sold at a gain of $1.2 million. Two non-agency collateralized mortgage obligations with an amortized cost totaling $7.0 million were transferred from available for sale to held to maturity at September 30, 2010 as long term prospects related to the securities improved during said quarter. The remaining non-agency CMO security portfolio has a carrying value of $56.7 million and fair value of $54.4 million at June 30, 2011.
The following table shows mortgage-backed securities activity during the years ended June 30.
| (Dollars in thousands) | 2011 | 2010 | 2009 | |||||||||
| Mortgage-backed securities at beginning of year |
$ | 226,704 | $ | 241,058 | $ | 198,406 | ||||||
| Purchases |
142,785 | 57,955 | 84,788 | |||||||||
| Principal repayments |
(98,565 | ) | (72,309 | ) | (42,136 | ) | ||||||
|
|
|
|
|
|
|
|||||||
| Mortgage-backed securities at end of year |
$ | 270,924 | $ | 226,704 | $ | 241,058 | ||||||
|
|
|
|
|
|
|
|||||||
The following table indicates the respective maturities and weighted average yields of securities as of June 30, 2011:
| Carrying Balance | % | |||||||
| U.S. Treasury and U.S. Government agencies: |
||||||||
| Maturing after one year and within five years |
$ | 45,005 | 1.93 | |||||
| Maturing after five years and within ten years |
127,048 | 2.28 | ||||||
| States of the U.S. and political subdivisions: |
||||||||
| Maturing in one year or less |
3,406 | 1.88 | ||||||
| Maturing after one year and within five years |
14,251 | 3.21 | ||||||
| Maturing after five years and within ten years |
7,822 | 4.33 | ||||||
| Maturing after ten years |
966 | 6.13 | ||||||
| Individual trust preferred securities: |
||||||||
| Maturing after ten years |
9,345 | 4.11 | ||||||
| Pooled trust preferred securities: |
||||||||
| Maturing after ten years |
20,921 | 1.01 | ||||||
| Corporate Debt: |
||||||||
| Maturing in one year or less |
5,018 | 5.59 | ||||||
| Maturing after one year and within five years |
22,483 | 4.10 | ||||||
| Maturing after five years and within ten years |
5,000 | 4.10 | ||||||
| Mortgage-backed securities: |
||||||||
| Maturing in one year or less |
253 | 0.00 | ||||||
| Maturing after one year and within five years |
12 | 8.11 | ||||||
| Maturing after five years and within ten years |
56,458 | 3.09 | ||||||
| Maturing after ten years |
214,201 | 3.02 | ||||||
|
|
|
|
|
|||||
| Subtotal of Held to Maturity Securities |
532,189 | 2.80 | ||||||
| Equity and non-agency CMO securities available for sale (at market value) |
5,245 | 1.92 | ||||||
|
|
|
|||||||
| Total |
$ | 537,434 | ||||||
|
|
|
|||||||
12
The fair values of the individual trust preferred and pooled trust preferred securities at June 30, 2011 were $8.8 million and $17.8 million, respectively. The aggregate fair value of these trust preferred securities was $3.7 million below their aggregate amortized cost at June 30, 2011. Due to the illiquidity and uncertainty affecting the pooled trust preferred markets, Parkvale does not anticipate purchasing these types of investments in the immediate future. See “Risk Factors – The fair value of our investment securities held to maturity is less than the carrying value of such securities.”
See Note B of “Notes to Consolidated Financial Statements” for additional information on Investment Securities. Also, see “Management’s Discussion and Analysis” for additional discussion related to other than temporary impairment.
Hedging Activities
The objective of Parkvale’s financial futures policy is to reduce interest rate risk by authorizing an asset and liability-hedging program. The futures policy permits Parkvale’s investment officers to hedge up to $10 million of assets and liabilities. Hedges over $10 million and up to $25 million require the approval of the Audit-Finance Committee of the Board of Directors, and hedges over $25 million require the approval of the Board of Directors. The objective of Parkvale’s financial options policy is to reduce interest rate risk in the investment portfolio through the use of financial options. The options policy permits the use of options on United States Treasury bills, notes, bonds and bond futures and on mortgage-backed securities. The options policy generally limits the use of puts and calls to $5.0 million per type of option. Parkvale’s investment officers are authorized to conduct options activities, which are monitored by the Asset Liability Committee and the Audit-Finance Committee of the Board of Directors.
Derivative instruments are used to construct a transaction that is derived from and reflects the underlying value of assets, other instruments or various indices. The primary purpose of derivatives, which include such items as forward contracts, interest rate swap contracts, options futures and equity securities, is to transfer price risk associated with the fluctuations of financial instrument value. Parkvale does not enter into hedging transactions for speculative purposes. The only derivatives outstanding at June 30, 2011 relate to swapping floating rate PNC debt to fixed interest rates through December 2011 and December 2013.
Sources of Funds
General
Savings accounts and other types of deposits have traditionally been the principal source of Parkvale’s funds for use in lending and for other general business purposes. In addition to deposits, Parkvale derives funds from loan repayments and FHLB advances. Borrowings may be used on a short-term basis to compensate for seasonal or other reductions in deposits or for inflows at less than projected levels, as well as on a longer term basis to support expanded lending and investment activities.
Deposits
Parkvale has established a complete line of deposit products designed to attract both short-term and long-term savings by providing an assortment of terms and rates. The deposit products currently offered by Parkvale include passbook and statement savings accounts, commercial checking accounts, noninsured sweep accounts, checking accounts, money market accounts, certificates of deposit ranging in terms from 30 days to ten years, IRA certificates and jumbo certificates of deposit. In addition, Parkvale is a member of the STAR network with 47 ATMs currently operated by Parkvale.
13
Parkvale is generally competitive in the types of accounts and in the interest rates it offers on its deposit products, although it generally does not lead the market with respect to the level of interest rates offered. Parkvale intends to continue its efforts to attract deposits as a principal source of funds for supporting its lending activities because the cost of these funds generally is less than other borrowings. Although market demand generally dictates which deposit maturities and rates will be accepted by the public, Parkvale intends to continue to promote longer term deposits to the extent possible in a manner consistent with its asset and liability management goals.
The following table shows the distribution of Parkvale’s deposits by type of deposit as of June 30.
| 2011 | 2010 | 2009 | ||||||||||||||||||||||
| (Dollars in thousands) | Balance | % | Balance | % | Balance | % | ||||||||||||||||||
| Passbook accounts and statement savings |
$ | 243,312 | 16.4 | % | $ | 224,266 | 15.1 | % | $ | 203,756 | 13.5 | % | ||||||||||||
| Checking and money market accounts |
493,864 | 33.3 | % | 465,615 | 31.2 | % | 418,211 | 27.7 | % | |||||||||||||||
| Certificate accounts |
546,951 | 36.8 | % | 588,926 | 39.6 | % | 659,906 | 43.7 | % | |||||||||||||||
| Jumbo certificates |
194,952 | 13.1 | % | 202,483 | 13.6 | % | 218,527 | 14.4 | % | |||||||||||||||
| Accrued interest |
5,845 | 0.4 | % | 6,783 | 0.5 | % | 10,848 | 0.7 | % | |||||||||||||||
|
|
|
|
|
|
|
|
|
|
|
|
|
|||||||||||||
| Total savings deposits |
$ | 1,484,924 | 100.0 | % | $ | 1,488,073 | 100.0 | % | $ | 1,511,248 | 100.0 | % | ||||||||||||
|
|
|
|
|
|
|
|
|
|
|
|
|
|||||||||||||
The following table sets forth information regarding average balances and average rates paid by type of deposit for the years ending June 30.
| 2011 | 2010 | 2009 | ||||||||||||||||||||||
| (Dollars in thousands) | Balance | % | Balance | % | Balance | % | ||||||||||||||||||
| Passbook accounts |
$ | 230,364 | 0.26 | % | $ | 211,070 | 0.42 | % | $ | 193,273 | 0.66 | % | ||||||||||||
| Checking and money market accounts |
488,490 | 0.25 | % | 451,771 | 0.42 | % | 414,484 | 0.76 | % | |||||||||||||||
| Certificate accounts |
759,252 | 2.27 | % | 843,397 | 2.93 | % | 877,336 | 3.88 | % | |||||||||||||||
| Accrued interest |
6,723 | 0.00 | % | 9,302 | 0.00 | % | 12,374 | 0.00 | % | |||||||||||||||
|
|
|
|
|
|
|
|
|
|
|
|
|
|||||||||||||
| $ | 1,484,829 | 1.28 | % | $ | 1,515,540 | 1.81 | % | $ | 1,497,467 | 2.57 | % | |||||||||||||
|
|
|
|
|
|
|
|||||||||||||||||||
The wide range of deposit accounts offered has increased Parkvale’s ability to retain funds and to be more competitive in obtaining new funds, but does not eliminate the threat of disintermediation. During periods of high interest rates, certificate and money market accounts are more costly than transactions accounts. In addition, Parkvale has become subject to short-term fluctuations in deposit flows as customers have become more rate conscious and inclined to move funds into higher yielding accounts. The ability of Parkvale to attract and maintain deposits along with the impact on the cost of funds is significantly affected by competitive market conditions. Core deposit balances increased by $47.3 million or 6.9% during fiscal 2011 compared to fiscal 2010.
The principal methods used by Parkvale to attract deposits include the offering of a wide range of services and accounts, competitive interest rates, and convenient office hours and locations. Parkvale utilizes traditional marketing methods to attract new customers and deposits, including mass media advertising and direct mail. Parkvale’s deposits are obtained primarily from persons who are residents of Pennsylvania, Ohio and West Virginia. Parkvale neither advertises for deposits outside of Pennsylvania and the Ohio Valley nor utilizes the services of deposit brokers. Nonresidents of the tri-state area held approximately 2.0% of Parkvale’s deposits at June 30, 2011.
The following table sets forth the net deposit flows of Parkvale during the years ended June 30.
| (Dollars in thousands) | 2011 | 2010 | 2009 | |||||||||
| Decrease before interest credited |
($ | 19,010 | ) | ($ | 55,636 | ) | ($ | 14,896 | ) | |||
| Interest credited |
15,861 | 32,460 | 32,460 | |||||||||
|
|
|
|
|
|
|
|||||||
| Net deposit (decrease) increase |
($ | 3,149 | ) | ($ | 23,176 | ) | $ | 17,564 | ||||
|
|
|
|
|
|
|
|||||||
Management carefully monitors the interest rates and terms of its deposit products in order to maximize Parkvale’s interest rate spread and to better match its interest rate sensitivity.
14
The following table reflects the makeup of Parkvale’s deposit accounts at June 30, 2011, including the scheduled quarterly maturity of certificate accounts.
| (Dollars in thousands) | Amount | % of Total Deposits | Average Rate | |||||||||
| Passbook and club accounts |
$ | 243,312 | 16.4 | % | 0.26 | |||||||
| Checking and money market accounts |
493,864 | 33.3 | % | 0.24 | ||||||||
|
|
|
|
|
|
|
|||||||
| Total non-certificate accounts |
737,176 | 49.7 | % | 0.25 | ||||||||
| Certificates maturing in quarter ending: |
||||||||||||
| September 30, 2011 |
105,503 | 7.1 | % | 0.98 | ||||||||
| December 31, 2011 |
113,974 | 7.7 | % | 1.72 | ||||||||
| March 31, 2012 |
77,885 | 5.3 | % | 2.21 | ||||||||
| June 30, 2012 |
54,170 | 3.7 | % | 1.75 | ||||||||
| September 30, 2012 |
44,988 | 3.0 | % | 2.85 | ||||||||
| December 31, 2012 |
65,524 | 4.4 | % | 2.49 | ||||||||
| March 31, 2013 |
56,950 | 3.8 | % | 2.09 | ||||||||
| June 30, 2013 |
41,906 | 2.8 | % | 2.40 | ||||||||
| September 30, 2013 |
12,324 | 0.8 | % | 2.54 | ||||||||
| December 31, 2013 |
9,459 | 0.6 | % | 2.79 | ||||||||
| March 31, 2014 |
17,789 | 1.2 | % | 2.44 | ||||||||
| June 30, 2014 |
22,589 | 1.5 | % | 2.17 | ||||||||
| Thereafter |
118,842 | 8.0 | % | 3.32 | ||||||||
|
|
|
|
|
|
|
|||||||
| Total certificate accounts |
741,903 | 49.9 | % | 2.19 | ||||||||
| Accrued interest |
5,845 | 0.4 | % | 0.00 | ||||||||
|
|
|
|
|
|
|
|||||||
| Total deposits |
$ | 1,484,924 | 100.0 | % | 1.21 | |||||||
|
|
|
|
|
|
|
|||||||
The following table presents, by various interest rate categories, the outstanding amount of certificates of deposit at June 30, 2011, which mature during the years ending June 30:
| 2012 | 2013 | 2014 | Thereafter | Total | ||||||||||||||||
| (Dollar in thousands) | ||||||||||||||||||||
| Certificates of deposit: |
||||||||||||||||||||
| Under 1.00% |
$ | 144,938 | $ | 19,169 | $ | 2,285 | $ | 851 | $ | 167,243 | ||||||||||
| 1.00% to 1.99% |
106,667 | 64,153 | 35,594 | 2,372 | 208,786 | |||||||||||||||
| 2.00% to 2.99% |
30,847 | 78,791 | 10,296 | 59,276 | 179,210 | |||||||||||||||
| 3.00% to 6.50% |
69,080 | 47,255 | 13,986 | 56,343 | 186,664 | |||||||||||||||
|
|
|
|
|
|
|
|
|
|
|
|||||||||||
| Total certificates of deposit |
$ | 351,532 | $ | 209,368 | $ | 62,161 | $ | 118,842 | $ | 741,903 | ||||||||||
|
|
|
|
|
|
|
|
|
|
|
|||||||||||
Maturities of certificates of deposit of $100,000 or more that were outstanding as of June 30, 2011 are summarized as follows:
| (Dollars in thousands) | ||||
| 3 months or less |
$ | 26,772 | ||
| Over 3 months through 6 months |
28,509 | |||
| Over 6 months through 12 months |
30,861 | |||
| Over 12 months |
108,810 | |||
|
|
|
|||
| Total |
$ | 194,952 | ||
|
|
|
|||
15
Borrowings
Parkvale’s borrowings from the FHLB of Pittsburgh are collateralized with FHLB capital stock, deposits with the FHLB of Pittsburgh, investment securities and loans. See “Regulation — Federal Home Loan Bank System.” Borrowings are made pursuant to several different credit programs, which have varying interest rates, conversion options and range of maturities. FHLB advances are generally available to meet seasonal and other withdrawals of savings accounts and to expand lending and investment activities, as well as to aid the efforts of members to establish better asset/liability management by extending the maturities of liabilities.
The following table sets forth information concerning Parkvale’s advances from the FHLB of Pittsburgh for the years ended June 30.
| (Dollars in thousands) | 2011 | 2010 | 2009 | |||||||||
| Average balance outstanding |
$ | 165,874 | $ | 186,078 | $ | 186,306 | ||||||
| Maximum amount outstanding at any month-end during the period |
185,973 | $ | 186,182 | $ | 186,410 | |||||||
| Average interest rate |
5.02% | 4.90% | 4.90% | |||||||||
| Balance outstanding at June 30 |
$ | 150,857 | $ | 185,973 | $ | 186,202 | ||||||
The principal balance on PNC debt was $21.3 million with an average interest rate of 5.16% at June 30, 2011 and $23.8 million at June 30, 2010 with an average interest rate of 6.81%. See “Management’s Discussion and Analysis” — “Liquidity and Capital Resources” for information regarding the terms of the PNC debt.
Subsidiaries
PFC conducts substantially all of its operations through the Bank, which is a Pennsylvania chartered permanent reserve fund stock savings bank headquartered in Monroeville, Pennsylvania.
Pennsylvania law permits a Pennsylvania-chartered, federally insured savings institution to invest up to 2% of its assets in the capital stock, paid-in surplus and unsecured obligations of service corporations and an additional 1% of its assets when these funds are utilized for community or inner-city development or investment. Because Parkvale’s subsidiaries are operating subsidiaries rather than service corporations, this limitation does not apply. At June 30, 2011, Parkvale had equity investments of less than $1.0 million in its operating subsidiary corporations.
Parkvale Bank’s wholly owned subsidiaries include Parkvale Investment Corporation (“PIC”), Parkvale Mortgage Corporation (“PMC”), PV Financial Service, Inc. (“PVFS”) and Renaissance Corporation (“Renaissance”). PIC was formed in fiscal 2000 as a Delaware investment corporation. PMC was acquired in 1986 and operated two offices originating residential mortgage loans for the Bank through fiscal 2006. The PMC office in Fairfax, Virginia was closed in conjunction with expiration of the lease in the first quarter of fiscal 2007. For additional information regarding PMC, see “Lending Activities”. PVFS was incorporated in 1972. From 1997 until 2002, PVFS operated as a lending subsidiary by extending consumer loans to individuals who may otherwise not be able to obtain funds based on their unfavorable or nonexistent credit history. PVFS has not originated loans for the past five fiscal years. At June 30, 2011, PVFS had net assets of $1.2 million, which included $643,000 in cash and $597,000 of loans outstanding, compared to loans outstanding of $796,000 at June 30, 2010. This portfolio is collateralized by single-family residential properties. Renaissance completes collateral evaluations for consumer lending activities for the Bank. The sole asset of Renaissance at June 30, 2011 is $181,000 in cash.
Competition
Parkvale faces substantial competition both in the attraction of deposits and in the making of mortgage and other loans in its primary market area. Competition for the origination of mortgage and other loans principally comes from other community banks, commercial banks, mortgage banking companies, credit unions and other financial service corporations located in the tri-state area. Because of the wide diversity and large number of competitors, the exact number of competitors changes frequently. Parkvale’s most direct competition for deposits has historically come from other community banks, commercial banks and credit unions located in southwestern Pennsylvania, northern West
16
Virginia and eastern Ohio. In times of higher interest rates, Parkvale also encounters significant competition for investors’ funds from short-term money market securities and other corporate and government securities. During a lower interest rate environment, Parkvale and other depository institutions experience increased competition from stocks, mutual funds, and other direct investments offering the potential for higher yields.
Parkvale competes for loans principally through the interest rates and loan fees it charges on its loan products. In addition, Parkvale believes it offers a high degree of professionalism and quality in the services it provides. It competes for deposits by offering a variety of deposit accounts at competitive rates, convenient business hours, and convenient branch locations with inter-branch deposit and withdrawal privileges. Parkvale believes its offices are strategically located within the tri-state area, which provides Parkvale with both an opportunity to become an integral part of the local communities within the region and the means of competing with larger financial institutions doing business within the tri-state area. In addition, Parkvale has two offices located in downtown Pittsburgh to provide services to the business community and suburban customers working and shopping in the City of Pittsburgh.
Market Area
The Pittsburgh region has been a business leader for generations. The Pittsburgh Metropolitan Statistical Area (MSA), which includes Allegheny, Armstrong, Beaver, Butler, Fayette, Washington and Westmoreland counties, is ranked 20th by population in the United States, according to the 2000 U.S. Census. The region’s economy is primarily dependent on a combination of the manufacturing trade, services, government, and transportation industries. The economy has experienced a transition away from the steel and steel-related industries to the service industries, such as transportation, health care, education and finance, and a large number of high technology firms have established operations in Pittsburgh due to the wide range of support services available. The area served by Parkvale’s Ohio Valley division is demographically quite similar to the Pittsburgh region as the Steubenville, Ohio-Wheeling, West Virginia region is undergoing a transition from heavy industry to state-of-the-art manufacturing, information/service-based office operations and advanced technology/research.
Employees
As of June 30, 2011, Parkvale and its subsidiaries had 362 full-time equivalent employees. These employees are not represented by a collective bargaining agent or union and Parkvale believes it has satisfactory relations with its personnel.
REGULATION
General
PFC is a registered savings and loan holding company pursuant to the Home Owners’ Loan Act, as amended (“HOLA”). Regulatory and supervisory oversight responsibilities for savings and loan holding companies were transferred from the OTS to the Federal Reserve Board, effective as of July 21, 2011. PFC is also subject to the rules and regulations of the SEC under the federal securities laws. As a subsidiary of a savings and loan holding company, the Bank is subject to certain restrictions in its dealings with PFC and affiliates thereof.
The Bank is a Pennsylvania-chartered savings bank and is subject to extensive regulation and examination by the Pennsylvania Department of Banking and by the FDIC, and is also subject to certain requirements established by the Federal Reserve Board. The federal and state laws and regulations which are applicable to banks regulate, among other things, the scope of their business, their investments, their reserves against deposits, the payment of dividends, the timing of the availability of deposited funds and the nature and amount of and collateral for certain loans. There are periodic examinations by the Pennsylvania Department of Banking and the FDIC to test the Bank’s compliance with various regulatory requirements. This regulation and supervision establishes a comprehensive framework of activities in which an institution can engage and is intended primarily for the protection of the insurance fund and depositors. The regulatory structure also gives the regulatory authorities extensive discretion in connection with their supervisory and enforcement activities and examination policies, including policies with respect to the classification of assets and the establishment of adequate loan loss reserves for regulatory purposes. Any change in such regulation, whether by the Pennsylvania Department of Banking, the FDIC or the Congress, could have a material adverse impact on PFC and the Bank and their operations.
17
Under the Dodd-Frank Wall Street Reform and Consumer Protection Act, the powers of the Office of Thrift Supervision regarding PFC transferred to the Board of Governors of the Federal Reserve System on July 21, 2011. See “ — Regulatory Reform.”
Certain of the regulatory requirements that are or will be applicable to PFC and the Bank are described below. This description of statutes and regulations is not intended to be a complete explanation of such statutes and regulations and their effects on PFC and the Bank and is qualified in its entirety by reference to the actual statutes and regulations.
Regulatory Reform
On July 21, 2010, the President signed into law the Dodd-Frank Wall Street Reform and Consumer Protection Act. The financial reform and consumer protection act imposed new restrictions and an expanded framework of regulatory oversight for financial institutions, including depository institutions. In addition, the new law changed the jurisdictions of existing bank regulatory agencies and in particular transferred the regulation of federal savings associations from the Office of Thrift Supervision to the Office of Comptroller of the Currency, effective one year from the effective date of the legislation. Savings and loan holding companies are now regulated by the Federal Reserve Board. The new law also established an independent federal consumer protection bureau within the Federal Reserve Board. The following discussion summarizes significant aspects of the new law that affects PFC and the Bank.
The following aspects of the financial reform and consumer protection act are related to the operations of the Bank:
| • | A new independent consumer financial protection bureau was established within the Federal Reserve Board, empowered to exercise broad regulatory, supervisory and enforcement authority with respect to both new and existing consumer financial protection laws. Smaller financial institutions, like the Bank, are subject to the supervision and enforcement of their primary federal banking regulator with respect to the federal consumer financial protection laws. |
| • | The current prohibition on payment of interest on demand deposits was repealed, effective July 21, 2011. |
| • | Deposit insurance is permanently increased to $250,000 and unlimited deposit insurance for noninterest-bearing transaction accounts extended through December 31, 2012. |
| • | Deposit insurance assessment base calculation equals the depository institution’s total assets minus the sum of its average tangible equity during the assessment period. |
| • | The minimum reserve ratio of the Deposit Insurance Fund increased to 1.35% of estimated annual insured deposits or assessment base; however, the FDIC is directed to “offset the effect” of the increased reserve ratio for insured depository institutions with total consolidated assets of less than $10 billion. |
| • | Tier 1 capital treatment for “hybrid” capital items like trust preferred securities is eliminated subject to various grandfathering and transition rules. |
The following aspects of the financial reform and consumer protection act are related to the operations of PFC:
| • | Authority over savings and loan holding companies transferred to the Federal Reserve Board. |
| • | Leverage capital requirements and risk based capital requirements applicable to depository institutions and bank holding companies were extended to thrift holding companies. |
| • | The Federal Deposit Insurance Act was amended to direct federal regulators to require depository institution holding companies to serve as a source of strength for their depository institution subsidiaries. |
| • | Public companies will be required to provide their shareholders with a non-binding vote (i) at least once every three years on the compensation paid to executive officers, and (ii) at least once every six years on whether they should have a “say on pay” vote every one, two or three years. |
18
| • | A separate, non-binding shareholder vote will be required regarding golden parachutes for named executive officers when a shareholder vote takes place on mergers, acquisitions, dispositions or other transactions that would trigger the parachute payments. |
| • | Securities exchanges will be required to prohibit brokers from using their own discretion to vote shares not beneficially owned by them for certain “significant” matters, which include votes on the election of directors, executive compensation matters, and any other matter determined to be significant. |
| • | Stock exchanges will be prohibited from listing the securities of any issuer that does not have a policy providing for (i) disclosure of its policy on incentive compensation payable on the basis of financial information reportable under the securities laws, and (ii) the recovery from current or former executive officers, following an accounting restatement triggered by material noncompliance with securities law reporting requirements, of any incentive compensation paid erroneously during the three-year period preceding the date on which the restatement was required that exceeds the amount that would have been paid on the basis of the restated financial information. |
| • | Disclosure in annual proxy materials will be required concerning the relationship between the executive compensation paid and the financial performance of the issuer. |
| • | Item 402 of Regulation S-K will be amended to require companies to disclose the ratio of the Chief Executive Officer’s annual total compensation to the median annual total compensation of all other employees. |
| • | Smaller reporting companies are exempt from complying with the internal control auditor attestation requirements of Section 404(b) of the Sarbanes-Oxley Act. |
Activities Restrictions. There are generally no restrictions on the activities of a savings and loan holding company, which controlled only one subsidiary savings association on or before May 4, 1999 (a “grandfathered holding company”). However, if the Federal Reserve Board determines that there is reasonable cause to believe that the continuation by a savings and loan holding company of an activity constitutes a serious risk to the financial safety, soundness or stability of its subsidiary savings association, the Federal Reserve Board may impose such restrictions as it deems necessary to address such risk, including limiting (i) payment of dividends by the savings association; (ii) transactions between the savings association and its affiliates; and (iii) any activities of the savings association that might create a serious risk that the liabilities of the holding company and its affiliates may be imposed on the savings association. Notwithstanding the above rules as to permissible business activities of unitary savings and loan holding companies, if the savings association subsidiary of such a holding company fails to meet the qualified thrift lender (“QTL”) test, then such unitary holding company also shall become subject to the activities restrictions applicable to multiple savings and loan holding companies and, unless the savings association requalifies as a QTL within one year thereafter, shall register as, and become subject to the restrictions applicable to, a bank holding company. As of June 30, 2011, PFC was a grandfathered holding company.
If a savings and loan holding company acquires control of a second savings association and holds it as a separate institution, the holding company becomes a multiple savings and loan holding company. As a general rule, multiple savings and loan holding companies are subject to restrictions on their activities that are not imposed on a grandfathered holding company. They cannot commence or continue any business activity other than: (i) those permitted for a bank holding company under Section 4(c) of the Bank Holding Company Act (unless the Federal Reserve Board by regulation prohibits or limits such Section 4(c) activities); (ii) furnishing or performing management services for a subsidiary savings association; (iii) conducting an insurance agency or escrow business; (iv) holding, managing or liquidating assets owned by or acquired from a subsidiary savings association; (v) holding or managing properties used or occupied by a subsidiary savings association; (vi) acting as trustee under deeds of trust; or (vii) those activities authorized by regulation as of March 5, 1987 to be engaged in by multiple savings and loan holding companies.
The HOLA requires every savings association subsidiary of a savings and loan holding company to give the Federal Reserve Board at least 30 days advance notice of any proposed dividends to be made on its guarantee, permanent or other non-withdrawable stock, or else such dividend will be invalid.
19
Limitations on Transactions with Affiliates. Transactions between savings associations and any affiliate are governed by Section 11 of the HOLA and Sections 23A and 23B of the Federal Reserve Act. An affiliate of a savings association is any company or entity which controls, is controlled by or is under common control with the savings association. In a holding company context, the parent holding company of a savings association (such as PFC) and any companies, which are controlled by such parent holding company are affiliates of the savings association. Generally, Section 23A (i) limits the extent to which the savings association or its subsidiaries may engage in “covered transactions” with any one affiliate to an amount equal to 10% of such association’s capital stock and surplus, and (ii) contains an aggregate limit on all such transactions with all affiliates to an amount equal to 20% of such capital stock and surplus. Section 23B applies to “covered transactions” as well as certain other transactions and requires that all transactions be on terms substantially the same, or at least as favorable, to the association or subsidiary as those provided to a non-affiliate. The term “covered transaction” includes the making of loans to, purchase of assets from, issuance of a guarantee to an affiliate and similar transactions. Section 23B also applies to the provision of services and the sale of assets by a savings association to an affiliate. In addition to the restrictions imposed by Sections 23A and 23B, Section 11 of the HOLA prohibits a savings association from (i) making a loan or other extension of credit to an affiliate, except for any affiliate which engages only in certain activities which are permissible for bank holding companies, or (ii) purchasing or investing in any stocks, bonds, debentures, notes or similar obligations of any affiliate, except for affiliates which are subsidiaries of the savings association.
In addition, Sections 22(g) and (h) of the Federal Reserve Act place restrictions on loans to executive officers, directors and principal stockholders. Under Section 22(h), loans to a director, an executive officer and to a greater than 10% stockholder of a savings institution (“a principal stockholder”), and certain affiliated interests of either, may not exceed, together with all other outstanding loans to such person and affiliated interests, the savings institution’s loans to one borrower limit (generally equal to 15% of the institution’s unimpaired capital and surplus). Section 22(h) also requires that loans to directors, executive officers and principal stockholders be made on terms substantially the same as offered in comparable transactions to other persons unless the loans are made pursuant to a benefit or compensation program that (i) is widely available to employees of the institution and (ii) does not give preference to any director, executive officer or principal stockholder, or certain affiliated interests of either, over other employees of the savings institution. Section 22(h) also requires prior board approval for certain loans. In addition, the aggregate amount of extensions of credit by a savings institution to all insiders cannot exceed the institution’s unimpaired capital and surplus. Furthermore, Section 22(g) places additional restrictions on loans to executive officers. At June 30, 2011, the Bank was in compliance with the above restrictions.
Restrictions on Acquisitions. Except under limited circumstances, savings and loan holding companies are prohibited from acquiring, without prior approval of the Federal Reserve Board, (i) control of any other savings association or savings and loan holding company or substantially all the assets thereof or (ii) more than 5% of the voting shares of a savings association or holding company thereof which is not a subsidiary. Except with the prior approval of the Federal Reserve Board, no director or officer of a savings and loan holding company or person owning or controlling by proxy or otherwise more than 25% of such company’s stock, may acquire control of any savings association, other than a subsidiary savings association, or of any other savings and loan holding company.
The Federal Reserve Board may approve an application by a bank holding company to acquire control of a savings association. A bank holding company that controls a savings association may merge or consolidate the assets and liabilities of the savings association with, or transfer assets and liabilities to, any subsidiary bank which is a member of the Deposit Insurance Fund (“DIF”) with the approval of the appropriate federal banking agency and the Federal Reserve Board. As a result of these provisions, there have been a number of acquisitions of savings associations by bank holding companies.
Existing savings and loan holding companies and those formed pursuant to an application filed with the OTS before May 4, 1999 (see “Activities Restrictions” and “grandfathered holding companies” above) may engage in any activity including non-financial or commercial activities, provided such companies control only one savings and loan association that meets the QTL test. Corporate reorganizations are permitted, but the transfer of grandfathered unitary thrift holding company status through acquisition is not permitted.
Sarbanes-Oxley Act of 2002. On July 30, 2002, the Sarbanes-Oxley Act of 2002 was enacted, which generally establishes a comprehensive framework to modernize and reform the oversight of public company auditing, improve the quality and transparency of financial reporting by those companies and strengthen the independence of
20
auditors. Among other things, the new legislation (i) created a public company accounting oversight board which is empowered to set auditing, quality control and ethics standards, to inspect registered public accounting firms, to conduct investigations and to take disciplinary actions, subject to SEC oversight and review; (ii) strengthened auditor independence from corporate management by, among other things, limiting the scope of consulting services that auditors can offer their public company audit clients; (iii) heightened the responsibility of public company directors and senior managers for the quality of the financial reporting and disclosure made by their companies; (iv) adopted a number of provisions to deter wrongdoing by corporate management; (v) imposed a number of new corporate disclosure requirements; (vi) adopted provisions which generally seek to limit and expose to public view possible conflicts of interest affecting securities analysts; and (vii) imposed a range of new criminal penalties for fraud and other wrongful acts, as well as extended the period during which certain types of lawsuits can be brought against a company or its insiders.
Regulation of the Bank
General. In 1993, the Bank converted from a federal chartered savings bank to a Pennsylvania chartered savings bank. As a Pennsylvania chartered savings bank, the Bank is subject to extensive regulation and examination by the Department of Banking (“Department”) and by the FDIC, which insures its deposits to the maximum extent permitted by law. The federal and state laws and regulations which are applicable to banks regulate, among other things, the scope of their business, their investments, their reserves against deposits, the timing of the availability of deposited funds and the nature and amount of and collateral for certain loans. There are periodic examinations by the Department and the FDIC to test the Bank’s compliance with various regulatory requirements. This regulation and supervision establishes a comprehensive framework of activities in which an institution can engage and is intended primarily for the protection of the insurance fund and depositors. The regulatory structure also gives the regulatory authorities extensive discretion in connection with their supervisory and enforcement activities and examination policies, including policies with respect to the classification of assets and the establishment of adequate loan loss reserves for regulatory purposes. Any change in such regulation, whether by the Department, the FDIC or the Congress could have a material adverse impact on the Bank and its operations. The Bank is also a member of the FHLB of Pittsburgh and is subject to certain limited regulation by the Federal Reserve Board.
Pennsylvania Savings Bank Law. The Pennsylvania Banking Code of 1965, as amended (“Banking Code”) contains detailed provisions governing the organization, location of offices, rights and responsibilities of directors, officers, employees and members, as well as corporate powers, savings and investment operations and other aspects of the Bank and its affairs. The Banking Code delegates extensive rulemaking power and administrative discretion to the Department so that the supervision and regulation of state-chartered savings banks may be flexible and readily responsive to changes in economic conditions and in savings and lending practices.
One of the purposes of the Banking Code is to provide savings banks with the opportunity to be competitive with each other and with other financial institutions existing under other Pennsylvania laws and other state, federal and foreign laws. A Pennsylvania savings bank may locate or change the location of its principal place of business and establish an office anywhere in Pennsylvania, with the prior approval of the Department.
The Department generally examines each savings bank no less frequently than once every two years. Although the Department may accept the examinations and reports of the FDIC in lieu of the Department’s examination, the present practice is for the Department to conduct individual examinations. The Department may order any savings bank to discontinue any violation of law or unsafe or unsound business practice and may direct any director, trustee, officer, attorney or employee of a savings bank engaged in an objectionable activity, after the Department has ordered the activity to be terminated, to show cause at a hearing before the Department why such person should not be removed.
Interstate Acquisitions. The Interstate Banking Act allows federal regulators to approve mergers between adequately capitalized banks from different states regardless of whether the transaction is prohibited under any state law, unless one of the banks’ home states has enacted a law expressly prohibiting out-of-state mergers before June 1997. The Commonwealth of Pennsylvania has not “opted out” of this interstate merger provision. Therefore, the federal provision permitting interstate acquisitions applies to banks chartered in Pennsylvania. Pennsylvania law, however, retained the requirement that an acquisition of a Pennsylvania institution by a Pennsylvania or a non-Pennsylvania-based holding company must be approved by the Department. The Interstate Act also allows a state to permit out-of-
21
state banks to establish and operate new branches in this state. Pennsylvania law permits an out of state banking institution to establish a branch office in Pennsylvania only if the laws of the state where that institution is located would permit an institution chartered under the laws of Pennsylvania to establish and maintain a branch in such other state on substantially the same terms and conditions.
Insurance of Accounts. The deposits of the Bank are insured to the maximum extent permitted by the Deposit Insurance Fund, which is administered by the FDIC, and is backed by the full faith and credit of the U.S. Government. As insurer, the FDIC is authorized to conduct examinations of, and to require reporting by, insured institutions. It also may prohibit any insured institution from engaging in any activity the FDIC determines by regulation or order to pose a serious threat to the FDIC.
In October 2008, the FDIC increased FDIC deposit insurance coverage per separately insured depositor for all account types to $250,000. While initially stipulated to be in effect through December 31, 2010, this increase was made permanent in July 2010 by the enactment of the Dodd-Frank Act. The Dodd-Frank Act also maintains federal deposit insurance coverage for non-interest-bearing transaction accounts at an unlimited amount from December 31, 2010 until December 31, 2012. Interest on Lawyer Trust Accounts will be considered “non-interest-bearing transaction accounts” for purposes of temporary unlimited deposit insurance coverage. However, interest-bearing transaction accounts paying 25 basis points or less are no longer insured beyond the $250,000 limit as of December 31, 2010. The Dodd Frank Act’s federal deposit insurance coverage for non-interest-bearing transaction deposit accounts replaces the transaction account guarantee program of the Temporary Liquidity Guarantee Program. Parkvale was a participant in the transaction account guarantee program during its existence.
On May 22, 2009, the FDIC announced a five basis point special assessment on each insured depository institution’s assets minus its Tier 1 capital as of June 30, 2009. The amount of the special assessment for any institution was not to exceed ten basis points times the institution’s domestic deposit assessment base for the second quarter 2009 risk-based assessment. The FDIC special assessment of $880,000 was expensed at June 30, 2009.
The Bank received a credit of $1.5 million in June 2007 that was utilized throughout fiscal 2008 and a portion of fiscal 2009 to offset FDIC premiums of $758,000 and $746,000, respectively. The credit balance was fully utilized by June 30, 2009. As a result of increased FDIC insurance premium rates and full utilization of the credit, FDIC insurance expense increased to $3.4 million during fiscal 2010 compared to $2.3 million during fiscal 2009 and was $3.3 million during fiscal 2011.
In 2009, the FDIC also required insured deposit institutions on December 30, 2009 to prepay 13 quarters of estimated insurance assessments. Our prepayment totaled approximately $12.8 million. Unlike a special assessment, this prepayment did not immediately affect bank earnings. Banks will book the prepaid assessment as a non-earning asset and record the actual risk-based premium payments at the end of each quarter.
On February 7, 2011, the FDIC adopted a final rule, which redefined the deposit insurance assessment base as required by the Dodd-Frank Act and made changes to the assessment rates. The rule redefined the deposit insurance assessment base as average consolidated total assets minus average tangible equity; made changes to the unsecured debt and brokered deposit adjustments to assessment rates; created a depository institution debt adjustment; and adopted a new assessment rate schedule effective April 1, 2011, and in lieu of dividends, other rate schedules when the reserve ratio reaches certain levels. The FDIC has implemented a risk-based premium system that provides for quarterly assessments based on an insured institution’s ranking in one of four risk categories based upon supervisory and capital evaluations. Within its risk category, an institution is assigned to an initial base assessment rate which is then adjusted to determine its final assessment rate based on its brokered deposits, secured liabilities and unsecured debt. The base assessment rates range from five to thirty five basis points, with less risky institutions paying lower assessments.
In addition, all institutions with deposits insured by the FDIC are required to pay assessments to fund interest payments on bonds issued by the Financing Corporation (“FICO”), a mixed-ownership government corporation that was established to recapitalize a predecessor to the DIF. As of June 30, 2011, the annualized FICO assessment rate was 1.0 basis point per $100 of insured deposits. This assessment, which is adjusted quarterly, will continue until the FICO bonds mature in 2019.
22
The FDIC may terminate the deposit insurance of any insured depository institution, including the Bank, if it determines after a hearing that the institution has engaged or is engaging in unsafe or unsound practices, is in an unsafe or unsound condition to continue operations, or has violated any applicable law, regulation, order or any condition imposed by an agreement with the FDIC. It also may suspend deposit insurance temporarily during the hearing process for the permanent termination of insurance, if the institution has no tangible capital. If insurance of accounts is terminated, the accounts at the institution at the time of the termination, less subsequent withdrawals, shall continue to be insured for a period of six months to two years, as determined by the FDIC.
Capital Requirements. The FDIC has promulgated regulations and adopted a statement of policy regarding the capital adequacy of state-chartered banks, which like the Bank, are not members of the Federal Reserve System. The FDIC’s capital regulations establish a minimum 3.0% Tier I leverage capital requirement for the most highly-rated state-chartered, non-member banks, with an additional cushion of at least 100 to 200 basis points for all other state-chartered, non-member banks, which effectively will increase the minimum Tier I leverage ratio for such other banks from 4.0% to 5.0% or more. Under the FDIC’s regulation, the highest-rated banks are those that the FDIC determines are not anticipating or experiencing significant growth and have well diversified risk, including no undue interest rate risk exposure, excellent asset quality, high liquidity, good earnings and, in general, which are considered a strong banking organization, rated composite 1 under the Uniform Financial Institutions Rating System. Leverage or core capital is defined as the sum of common stockholders’ equity (including retained earnings), noncumulative perpetual preferred stock and related surplus, and minority interests in consolidated subsidiaries, minus all intangible assets other than certain qualifying supervisory goodwill, and certain purchased mortgage servicing rights and purchased credit and relationships.
The FDIC also requires that savings banks meet a risk-based capital standard. The risk-based capital standard for savings banks requires the maintenance of total capital, which is defined as Tier I capital and supplementary (Tier 2 capital) to risk weighted assets of 8%. In determining the amount of risk-weighted assets, all assets, plus certain off balance sheet assets, are multiplied by a risk-weight of 0% to 100%, based on the risks the FDIC believes are inherent in the type of asset or item.
The components of Tier I capital are equivalent to those discussed above under the 3% leverage standard. The components of supplementary (Tier 2) capital include certain perpetual preferred stock, certain mandatory convertible securities, certain subordinated debt and intermediate preferred stock and general allowances for loan losses. Allowance for loan losses includable in supplementary capital is limited to a maximum of 1.25% of risk-weighted assets. Overall, the amount of capital counted toward supplementary capital cannot exceed 100% of core capital. At June 30, 2011, the Bank met each of its capital requirements and exceeded requirements established to be well capitalized.
A bank which has less than the minimum leverage capital requirement shall, within 60 days of the date as of which it fails to comply with such requirement, submit to its FDIC regional director for review and approval a reasonable plan describing the means and timing by which the bank shall achieve its minimum leverage capital requirement. A bank which fails to file such plan with the FDIC is deemed to be operating in an unsafe and unsound manner, and could subject the bank to a cease-and-desist order from the FDIC. The FDIC’s regulation also provides that any insured depository institution with a ratio of Tier I capital to total assets that is less than 2.0% is deemed to be operating in an unsafe or unsound condition pursuant to Section 8(a) of the FDIC and is subject to potential termination of deposit insurance. However, such an institution will not be subject to an enforcement proceeding there under solely on account of its capital ratios if it has entered into and is in compliance with a written agreement with the FDIC to increase its Tier I leverage capital ratio to such level as the FDIC deems appropriate and to take such other action as may be necessary for the institution to be operated in a safe and sound manner. The FDIC capital regulation also provides, among other things, for the issuance by the FDIC or its designee(s) of a capital directive, which is a final order issued to a bank that fails to maintain minimum capital to restore its capital to the minimum leverage capital requirement within a specified time period. Such directive is enforceable in the same manner as a final cease-and-desist order.
The Bank is also subject to more stringent Department capital guidelines. Although not adopted in regulation form, the Department utilizes capital standards requiring a minimum of 6% leverage capital and 10% risk-based capital. The components of leverage and risk-based capital are substantially the same as those defined by the FDIC.
23
Prompt Corrective Action. Under Section 38 of the FDIA, each federal banking agency is required to implement a system of prompt corrective action for institutions, which it regulates. The federal banking agencies (including the FDIC) have adopted substantially similar regulations to implement Section 38 of the FDIA. Under the regulations, a savings bank shall be deemed to be (i) “well capitalized” if it has total risk-based capital of 10.0% or more, has a Tier 1 risk-based ratio of 6.0% or more, has a Tier 1 leverage capital ratio of 5.0% or more and is not subject to any order or final capital directive to meet and maintain a specific capital level for any capital measure, (ii) “adequately capitalized” if it has a total risk-based capital ratio of 8.0% or more, a Tier 1 risk-based capital ratio of 4.0% or more and a Tier 1 leverage capital ratio of 4.0% or more (3.0% under certain circumstances) and does not meet the definition of “well capitalized”, (iii) “undercapitalized” if it has a total risk-based capital ratio that is less than 8.0%, a Tier 1 risk-based capital ratio that is less than 4.0% or a Tier 1 leverage capital ratio that is less than 4.0% (3.0% under certain circumstances), (iv) “significantly undercapitalized” if it has a total risk-based ratio that is less than 6.0%, a Tier 1 risk-based capital ratio that is less than 3.0% or a Tier 1 leverage capital ratio that is less than 3.0%, and (v) “critically undercapitalized” if it has a ratio of tangible equity to total assets that is equal to or less than 2.0%. Section 38 of the FDIA and the regulations promulgated there under also specify circumstances under which the FDIC may reclassify a well capitalized savings bank as adequately capitalized and may require an adequately capitalized savings bank or an undercapitalized savings bank to comply with supervisory actions as if it were in the next lower category (except that the FDIC may not reclassify a significantly undercapitalized savings bank as critically undercapitalized). At June 30, 2011, the Bank was in the “well capitalized” category.
Loans-to-One Borrower Limitation. With certain limited exceptions, a Pennsylvania-chartered savings bank may lend to a single or related group of borrowers on an “unsecured” basis an amount equal to no greater than 15% of its capital accounts.
Activities and Investments of Insured State-Chartered Banks. Section 24 of the FDIA generally limits the activities and equity investments of FDIC-insured, state-chartered banks to those that are permissible for national banks. Under regulations dealing with equity investments, an insured state bank generally may not directly or indirectly acquire or retain any equity investment of a type, or in an amount, that is not permissible for a national bank. An insured state bank is not prohibited from, among other things, (i) acquiring or retaining a majority interest in a subsidiary, (ii) investing as a limited partner in a partnership the sole purpose of which is direct or indirect investment in the acquisition, rehabilitation or new construction of a qualified housing project, provided that such limited partnership investments may not exceed 2% of the bank’s total assets, (iii) acquiring up to 10% of the voting stock of a company that solely provides or reinsures directors’, trustees’ and officers’ liability insurance coverage or bankers’ blanket bond group insurance coverage for insured depository institutions, and (iv) acquiring or retaining the voting shares of a depository institution if certain requirements are met.
The FDIC has adopted regulations pertaining to the other activity restrictions imposed upon insured savings banks and their subsidiaries by Section 24 of the FDIA. Pursuant to such regulations, insured savings banks engaging in impermissible activities may seek approval from the FDIC to continue such activities. Savings banks not engaging in such activities but that desire to engage in otherwise impermissible activities either directly or through a subsidiary may apply for approval from the FDIC to do so; however, if such bank fails to meet the minimum capital requirements or the activities present a significant risk to the FDIC insurance funds, such application will not be approved by the FDIC. Pursuant to this authority, the FDIC has determined that investments in certain majority-owned subsidiaries of insured state banks do not represent a significant risk to the deposit insurance funds. Investments permitted under that authority include real estate investment activities and securities activities.
Qualified Thrift Lender Test. Because the Bank has elected to be treated as a savings association for purposes of Section 10 of HOLA, it is required to meet a qualified thrift lender test to avoid certain restrictions on its operations. A savings institution can comply with the qualified thrift lender test by either qualifying as a domestic building and loan bank as defined in Section 7701(a)(19) of the Internal Revenue Code or by meeting the second prong of the qualified thrift lender test set forth in Section 10(m) of HOLA. A savings institution that does not meet the qualified thrift lender test must either convert to a bank charter or comply with the following restrictions on its operations: (a) the institution may not engage in any new activity or make any new investment, directly or indirectly, unless such activity or investment is permissible for a national bank; (b) the branching powers of the institution shall be restricted to those of a national bank; and (c) payment of dividends by the institution shall be subject to the rules regarding payment of dividends by a national bank. Upon the expiration of three years from the date the savings institution ceases to be a qualified thrift lender, it must cease any activity and not retain any investment not permissible for a national bank.
24
The portion of the qualified thrift lender test that is based on Section 10(m) of HOLA rather than the Internal Revenue Code requires that 65% of an institution’s “portfolio assets” (as defined) consist of certain housing and consumer-related assets on a monthly average basis in nine out of every 12 months. Assets that qualify without limit for inclusion as part of the 65% requirement are loans made to purchase, refinance, construct, improve or repair domestic residential housing and manufactured housing; home equity loans; mortgage-backed securities (where the mortgages are secured by domestic residential housing or manufactured housing); stock issued by a Federal Home Loan Bank; and direct or indirect obligations of the FDIC. Small business loans, credit card loans and student loans are also included without limitation as qualified investments. In addition, the following assets, among others, may be included in meeting the test subject to an overall limit of 20% of the savings institution’s portfolio assets: 50% of residential mortgage loans originated and sold within 90 days of origination; 100% of loans for personal, family and household purposes (other than credit card loans and educational loans); and stock issued by Fannie Mae or Freddie Mac. Portfolio assets consist of total assets minus the sum of (a) goodwill and other intangible assets, (b) property used by the savings institution to conduct its business, and (c) liquid assets up to 20% of the institution’s total assets.
Under the Dodd-Frank Wall Street Reform and Consumer Protection Act, a savings institution not in compliance with the QTL test is also prohibited from paying dividends and is subject to an enforcement action for violation of the Home Owners’ Loan Act, as amended.
The Bank believes that it meets the provisions of the QTL test.
Safety and Soundness. The federal banking agencies, including the FDIC, have implemented rules and guidelines concerning standards for safety and soundness required pursuant to Section 39 of the FDIA. In general, the standards relate to (1) operational and managerial matters; (2) asset quality and earnings; and (3) compensation. The operational and managerial standards cover (a) internal controls and information systems, (b) internal audit systems, (c) loan documentation, (d) credit underwriting, (e) interest rate exposure, (f) asset growth, and (g) compensation, fees and benefits. Under the asset quality and earnings standards, the Bank is required to establish and maintain systems to (i) identify problem assets and prevent deterioration in those assets, and (ii) evaluate and monitor earnings and ensure that earnings are sufficient to maintain adequate capital reserves. Finally, the compensation standard states that compensation will be considered excessive if it is unreasonable or disproportionate to the services actually performed by the individual being compensated. The federal banking agencies have also adopted asset quality and earnings standards. If an insured state-chartered bank fails to meet any of the standards promulgated by regulation, then such institution will be required to submit a plan within 30 days to the FDIC specifying the steps it will take to correct the deficiency. In the event that an insured state-chartered bank fails to submit or fails in any material respect to implement a compliance plan within the time allowed by the federal banking agency, Section 39 of the FDIA provides that the FDIC must order the institution to correct the deficiency and may (1) restrict asset growth; (2) require the savings bank to increase its ratio of tangible equity to assets; (3) restrict the rates of interest that the savings institution may pay; or (4) take any other action that would better carry out the purpose of prompt corrective action. The Bank believes that it has been and will continue to be in compliance with each of the standards as they have been adopted by the FDIC.
Privacy Requirements of the Gramm-Leach-Bliley Act. Federal law places limitations on financial institutions like the Bank regarding the sharing of consumer financial information with unaffiliated third parties. Specifically, these provisions require all financial institutions offering financial products or services to retail customers to provide such customers with the financial institution’s privacy policy and provide such customers the opportunity to “opt out” of the sharing of personal financial information with unaffiliated third parties. The Bank currently has a privacy protection policy in place and believes such policy is in compliance with the regulations.
Anti-Money Laundering. Federal anti-money laundering rules impose various requirements on financial institutions to prevent the use of the U.S. financial system to fund terrorist activities. These provisions include a requirement that financial institutions operating in the United States have anti-money laundering compliance programs, due diligence policies and controls to ensure the detection and reporting of money laundering. Such compliance programs supplement existing compliance requirements, also applicable to financial institutions, under the Bank Secrecy Act and the Office of Foreign Assets Control Regulations. The Bank has established policies and procedures to ensure compliance with the federal anti-laundering provisions.
25
Community Reinvestment Act. All insured depository institutions have a responsibility under the Community Reinvestment Act and related regulations to help meet the credit needs of their communities, including low- and moderate-income neighborhoods. An institution’s failure to comply with the provisions of the Community Reinvestment Act could result in restrictions on its activities. The Bank received a “satisfactory” Community Reinvestment Act rating in its most recently completed examination.
Regulatory Enforcement Authority. Federal banking regulators have substantial enforcement authority over the financial institutions that they regulate including, among other things, the ability to assess civil money penalties, to issue cease-and-desist or removal orders and to initiate injunctive actions against banking organizations and institution-affiliated parties, as defined. In general, these enforcement actions may be initiated for violations of laws and regulations and unsafe or unsound practices. Other actions or inactions may provide the basis for enforcement action, including misleading or untimely reports filed with regulatory authorities. Except under certain circumstances, federal law requires public disclosure of final enforcement actions by the federal banking agencies.
Emergency Economic Stabilization Act of 2008. On October 3, 2008, the Emergency Economic Stabilization Act of 2008 (“EESA”) was enacted, which authorizes the United States Department of the Treasury to purchase from financial institutions and their holding companies up to $700 billion in mortgage loans, mortgage-related securities and certain other financial instruments, including debt and equity securities issued by financial institutions and their holding companies in a troubled asset relief program. The purpose of the troubled asset relief program is to restore confidence and stability to the U.S. banking system and to encourage financial institutions to increase their lending to customers and to each other. In addition, under a capital purchase program, the Treasury Department purchases debt or equity securities from participating institutions.
Federal Home Loan Bank System. The Bank is a member of the Federal Home Loan Bank of Pittsburgh, which is one of 12 regional Federal Home Loan Banks. Each Federal Home Loan Bank serves as a reserve or central bank for its members within its assigned region. It is funded primarily from funds deposited by member institutions and proceeds from the sale of consolidated obligations of the Federal Home Loan Bank System. It makes loans to members (i.e., advances) in accordance with policies and procedures established by the board of directors of the Federal Home Loan Bank.
As a member, the Bank is required to purchase and maintain stock in the Federal Home Loan Bank of Pittsburgh in an amount equal to the greater of 1% of its aggregate unpaid residential mortgage loans, home purchase contracts or similar obligations at the beginning of each year or 5% of its outstanding advances from the Federal Home Loan Bank. At June 30, 2011, the Bank had a $12.3 million investment in the stock of the FHLB of Pittsburgh to comply with this requirement.
Advances from the FHLB of Pittsburgh are secured by a member’s shares of stock in the FHLB of Pittsburgh, certain types of mortgages, investments and other assets. The maximum amount of credit which the FHLB of Pittsburgh will advance for purposes other than meeting deposit withdrawals fluctuates from time to time in accordance with changes in policies of the FHLB of Pittsburgh. Interest rates charged for advances vary depending upon maturity, the cost of funds to the FHLB of Pittsburgh and the purpose of the borrowing. At June 30, 2011, the Bank had $150.9 million of outstanding advances from the FHLB of Pittsburgh.
Federal Reserve Board System. The Federal Reserve Board requires all depository institutions to maintain non-interest-bearing reserves at specified levels against their transaction accounts, which are primarily checking and NOW accounts, and non-personal time deposits. The balances maintained to meet the reserve requirements imposed by the Federal Reserve Board may be used to satisfy the liquidity requirements that are imposed by the Pennsylvania Department of Banking. Because required reserves must be maintained in the form of vault cash or a non-interest bearing account at a Federal Reserve Bank, the effect of this reserve requirement is to reduce the Bank’s interest-earning assets. Parkvale satisfies its reserve requirement with vault cash.
26
TAXATION
Federal Taxation
For federal income tax purposes, PFC and its subsidiaries file a consolidated return on a calendar year basis and report their income and expenses on the accrual basis of accounting. Corporations are subject to the corporate alternative minimum tax to the extent this tax would exceed the regular tax liability. PFC has not been subject to this tax in the past and does not anticipate being subject to this tax in future years given its current level of financial and taxable income. With certain exceptions, no deduction is allowed for interest expense allocable to the purchase or carrying of tax-exempt obligations acquired after August 7, 1986.
State Taxation
For state tax purposes, Parkvale reports its income and expenses on the accrual basis of accounting and files its tax returns on a calendar year basis. The Bank is subject to Ohio Franchise taxes, West Virginia Income Taxes and the Pennsylvania Mutual Thrift Institutions Tax (“MTIT”). The Ohio Franchise tax is based on assets as of January 1 of each year and is not considered an income tax. The MTIT is imposed at the rate of 11.5% on net income computed substantially in accordance with generally accepted accounting principles (“GAAP”). Under the Mutual Thrift Institution Act, Parkvale is not subject to any state or local taxes except for the Ohio, West Virginia and MTIT taxes described above and taxes imposed upon real estate and the transfer thereof.
See Note H of “Notes to Consolidated Financial Statements” for additional information regarding federal and state taxation.
Item 1A. Risk Factors
Investments in Parkvale’s common stock involve risk. The following discussion highlights risks which management believes are material for the Company, but does not necessarily include all risks that Parkvale may face.
If the Merger with FNB is not completed, we will continue to face certain risk factors related to our on-going operations.
In the event that the proposed Merger with FNB is not completed, we will continue our operations as an independent entity and, as such, would continue to face certain risks in our on-going operations, as described below. Even if the Merger is completed as expected in the first calendar quarter of 2012, PFC will face these risks on an independent basis until the time of the Merger.
If the Merger is not completed, we will have incurred substantial expenses without realizing the expected benefits of the Merger.
PFC has incurred substantial expenses in connection with the Merger. The completion of the Merger depends on the satisfaction of specified conditions and the receipt of regulatory approvals and the approval of PFC’s shareholders. We cannot guarantee that these connections will be met. If the Merger is not completed, these expenses could have a material adverse impact on PFC’s financial condition and results of operations on a stand-alone basis. In addition, the market price of PFC’s common stock would likely decline in the event that the Merger is not consummated as the current market price likely reflects an assumption that the Merger will be completed.
The market price of Parkvale common stock may fluctuate significantly in response to a number of factors, including:
| • | changes in securities analysts’ estimates of financial performance |
| • | volatility of stock market prices and volumes |
| • | changes in the market price of FNB or in market valuations of other companies which are similar to PFC |
| • | changes in interest rates since net interest income comprises the majority of our revenue and is significantly influenced by changes in interest rates |
| • | new products or services offered in the banking and/or financial services industries |
27
| • | variations in quarterly or annual operating results, including investment writedowns and loan loss provisions |
| • | litigation |
| • | regulatory actions including new laws and regulations and continued compliance with existing laws and regulations |
| • | changes in accounting policies or procedures as may be required by the Financial Accounting Standards Board or other regulatory agencies. |
We reported net losses for the years ended June 30, 2010 and 2009.
While we had net income of $8.1 million in fiscal 2011, we reported a net loss of $16.8 million for fiscal 2010 and a net loss of $10.3 million for fiscal 2009. After subtracting the dividends paid on the preferred stock issued in December 2008, the net income available to our common stockholders in fiscal 2011 was $6.5 million, compared to a net loss of $18.4 million in fiscal 2010 and $11.1 million in fiscal 2009. Net income during fiscal 2011 included writedowns of $2.3 million on trust preferred securities. The net loss in fiscal 2010 was primarily due to writedowns of $39.0 million on pooled trust preferred and non-agency CMO securities. The net loss in fiscal 2009 was primarily due to writedowns of $30.4 million on trust preferred securities, preferred stocks and other securities held in our investment portfolio. See Notes B and J of Notes to Consolidated Financial Statements.
There are increased risks involved with commercial business and consumer lending activities.
We have increased our emphasis on originating commercial business and consumer loans in recent years. We originated $128.1 million of these loans in fiscal 2011, representing 59.4% of total loan originations in fiscal 2011. In fiscal 2010, we originated $98.2 million of these loans, representing 62.8% of total loan originations. Commercial business and consumer loans represent 22.3% of our gross loan portfolio at June 30, 2011. Commercial business and consumer loans are generally considered to involve a higher degree of risk than mortgage lending due to a variety of factors. As a result of the larger loan balances typically involved with commercial business loans, an adverse development with respect to one loan or one credit relationship can expose us to greater risk of loss compared to an adverse development with respect to a mortgage loan. At June 30, 2011, the outstanding balance of our largest single commercial business loan was $4.0 million. While we have not had significant charge-offs of commercial business loans in recent years, if one of these large loans were to become non-performing, it could have a significant impact on our results of operations. In fiscal 2011, we charged off $79,000 of commercial business loans, compared to $752,000 of such charge-offs in fiscal 2010. Consumer loans also involve greater risks than single-family residential loans, as it may be more difficult to recover collateral on those loans that are secured with higher loans to value and certain consumer loans are unsecured. In addition, the recent increases in the originations of commercial business and consumer loans mean that our portfolio of these loans is significantly weighted with loans which are not well seasoned and are generally perceived to be more susceptible to adverse economic conditions than older loans.
There are increased risks associated with our interest only loans.
At June 30, 2011, our loan portfolio included $154.0 million of loans that are interest only for the initial years of the loans, representing 8.5% of total assets at that date. The initial interest only years of the loans range from three to ten years. These loans have a higher degree of risk than fully amortizing loans, as the original loan balance does not decline during the interest only period of the loan. The risks associated with these loans are increased if housing prices decline after the loan is originated. The initial interest only period for $59.1 million of the aggregate $154.0 million has expired, and such loans are fully amortizing at June 30, 2011.
We will be adversely affected if housing prices continue to decline.
A decline in housing prices adversely affects us in several ways. First, we generally limit the loan-to-value ratio to 80% on newly originated residential first lien mortgage loans. A decline in housing prices after the loan is originated results in an increase in the loan-to-value ratio, which increases the risks associated with such loans. Second, borrowers who experience a decline in the market value of their house, particularly a decline below their outstanding mortgage balance, may be more likely to be delinquent in their loan payments and to experience a foreclosure on their mortgage. Third, a decline in housing prices generally leads to higher foreclosure rates, and the value of the properties we receive may be less than the outstanding mortgage balance. At June 30, 2011, we held $615.9 million of 1-4 family mortgage loans, representing 34.1% of our total assets. Fourth, the value of the mortgage-backed securities held by us,
28
which are secured by residential properties, may decline. At June 30, 2011, we held $270.9 million of mortgage-backed securities, representing 15.0% of our total assets. Fifth, our consumer loan portfolio includes a limited amount ($9.8 million) of outstanding home equity lines of credit in excess of 90% of collateral value at a competitive introductory rate, and the risks associated with these loans will increase if housing prices continue to decline. Sixth, a decline in housing prices is likely to lead to increased provisions for loan losses, which would adversely affect our net income.
Our allowance for loans losses may not be adequate to cover probable losses.
We have established an allowance for loan losses based upon various assumptions and judgments about the collectability of our loan portfolio, which we believe is adequate to offset probable losses on our existing loans. While we are not aware of any specific factors indicating a deficiency in the amount of our allowance for loan losses, in light of the current economic slowdown, the increased number of foreclosures and lower real estate values, one of the most pressing current issues faced by financial institutions is the adequacy of their allowance for loan losses. Federal bank regulators have increased their scrutiny of the level of the allowance for losses maintained by regulated institutions. Many banks and other lenders are reporting significantly higher provisions to their allowance for loan losses, which are materially impacting their earnings. In the event that we have to increase our allowance for loan losses, it would have an adverse effect on our results in future periods. At June 30, 2011, our allowance for loan losses amounted to $18.6 million, while gross loan portfolio was $1.0 billion at such date.
Our business is geographically concentrated in the greater Pittsburgh and tri state area, which makes us vulnerable to downturns in the local economy.
The majority of our loans are to individuals and businesses located generally in the greater Pittsburgh and tri state area, consisting of southwestern Pennsylvania, eastern Ohio and northern West Virginia. Regional economic conditions affect the demand for our products and services as well as the ability of our customers to repay loans. While economic conditions in our primary market area have been relatively good in recent periods compared to many areas of the country, the concentration of our business operations makes us vulnerable to downturns in the local economy. Declines in local real estate values could adversely affect the value of property used as collateral for the loans we make.
A significant amount of our loan portfolio consists of geographically diverse, out of area mortgage loans that are serviced by others. These may have a higher risk of loss than loans serviced by us because we may have limited control over credit monitoring.
There are approximately $252 million of 1-4 family mortgage loans in the Bank’s portfolio as of June 30, 2011 collateralized by single family homes throughout the United States, a significant portion of which is located in areas experiencing economic difficulties with falling home prices and excess supply. If these economic pressures continue for an extended period of time, it is possible losses will be realized if the current assessments of fair value deteriorate. The substantial majority of these loans were jumbo loans at the time of origination, which are more severely affected by economic conditions. Parkvale must rely on national service providers to monitor the performance of these loans, and collection efforts may be affected by servicing difficulties by the national service providers, which will be beyond the control of our collection staff. An increase in non-performing loans could result in higher loan losses and reduced earnings.
Interest rate volatility could harm our results of operations.
Parkvale’s results of operations depend to a great extent on the difference between the interest earned on loans and investment securities and the interest paid on deposits and other borrowings. Interest rates are beyond our control and fluctuate in response to general economic conditions and the policies of various governmental and regulatory agencies, in particular, the Federal Reserve Board. Changes in monetary policy, including changes in interest rates, will influence the origination of loans, the purchase of investments, the generation of deposits and the rates received on loans and investment securities and paid on deposits and borrowings. In anticipation of rising interest rates, Parkvale had a positive one-year interest rate gap ratio of 9.28% at June 30, 2011, compared to 12.45% at June 30, 2010. Because a positive gap ratio means that our interest-earning assets are more sensitive to interest rates than our interest-bearing liabilities, our net interest income decreased by $1.3 million or 3.3% in fiscal 2011 as interest rates have remained at historic low levels. Although increases in interest rates would result in additional interest income from each new loan made or serviced, the number of new loans is likely to decrease as interest rates rise. Any revenue reductions from
29
fewer loans and increased interest expense paid in connection with borrowed funds and deposits may not be offset by the higher income as a result of increased interest rates, which would adversely affect our interest rate spread and net interest income. Changes in interest rates also can affect the value of our interest-earning assets and our ability to realize gains from the sale of such assets, our ability to obtain and retain deposits in competition with other available investment alternatives, and the ability of our borrowers to repay adjustable or variable rate loans.
The fair value of our investments is less than the carrying value of such securities.
At June 30, 2011, the amortized cost or carrying value of our investment securities held to maturity was $532.2 million, or 29.5% of our total assets. At such date, the fair value of such securities was $531.1 million. Because the declines in the fair value of individual held-to-maturity securities are currently deemed to be temporary, the investment securities have not been written down to their fair value. The investment securities held to maturity at June 30, 2011 include pooled and single issuer trust-preferred securities with an aggregate amortized cost of $30.3 million and an aggregate fair value of $26.6 million; non-agency CMOs with an aggregate amortized cost of $56.7 million and aggregate fair value of $54.4 million; U.S. government, agency and municipal securities with an aggregate amortized cost of $198.5 million and aggregate fair value of $200.2 million; corporate debt with an aggregate amortized cost of $32.5 million and aggregate fair value of $33.3 million; and government and agency mortgage-backed securities and CMOs with an aggregate amortized cost of $214.2 million and aggregate fair value of $216.6 million. Available for sale investments include an ARM mortgage mutual fund with an amortized cost of $5.5 million and fair value of $5.2 million. As disclosed in Note B of “Notes to Consolidated Financial Statements”, we are closely monitoring our investment portfolio in light of price volatility and deferred payments. Continued interest deferrals, defaults and/or price declines could result in a write-down of one or more of the trust preferred investments or other investment securities that have a fair value below amortized cost.
If Parkvale does not adjust to changes in the financial services industry, its financial performance may suffer.
Parkvale’s ability to maintain its history of favorable financial performance and return on investment to shareholders will depend in part on the ability to expand its scope of available financial services to customers. In addition to other banks, competitors include security dealers, brokers, mortgage bankers, investment advisors, and finance and insurance companies. The increasingly competitive environment is, in part, a result of changes in regulation, changes in technology and product delivery systems, and the accelerating pace of consolidation among financial service providers.
We face strong competition that may adversely affect our profitability.
We are subject to vigorous competition in all aspects and areas of our business from banks and other financial institutions, including savings and loan associations, savings banks, finance companies, credit unions and other providers of financial services, such as money market mutual funds, brokerage firms, consumer finance companies and insurance companies. As of June 30, 2011, we were the 9th largest institution, in terms of deposits, with a significant presence in western Pennsylvania. We are significantly smaller than the eight largest depository institutions operating in western Pennsylvania, which have more than 79% of the total deposits in the greater Pittsburgh metropolitan area. The financial resources of these larger competitors may permit them to pay higher interest rates on their deposits and to be more aggressive in new loan originations. Certain of our competitors are larger financial institutions with substantially greater resources, more advanced technological capabilities, higher lending limits, larger branch systems and a wider array of commercial banking services. Competition from both bank and non-bank organizations will continue.
Future governmental regulation and legislation could limit our growth.
Parkvale is subject to extensive state and federal regulation, supervision and legislation that govern nearly every aspect of our operations, and the extensive regulation is intended primarily for the protection of depositors. Changes to these laws could affect the ability to deliver or expand services and diminish the value of our business. See “Regulation” for additional information.
Item 1B. Unresolved Staff Comments.
None.
30
Item 2. Properties
Parkvale presently conducts business from its main office building and 47 branch offices located in the tri-state area. Parkvale owns the building and land for 24 offices and leases the remaining 23 offices. Such leases expire through 2040. PMC leases one facility in Ohio for a loan origination center. At June 30, 2011, land, building and equipment had a net book value of $16.9 million.
Item 3. Legal Proceedings.
PFC and its subsidiaries, in the normal course of business, are subject to a number of asserted and unasserted potential legal claims. In the opinion of management, there is no present basis to conclude that the resolution of these claims will have a material adverse impact on the consolidated financial condition or results of operations of PFC and its subsidiaries.
Item 4. Submission of Matters to a Vote of Security Holders.
None
PART II.
Item 5. Market for Registrant’s Common Equity and Related Shareholders Matters.
| (a) | Parkvale’s Common Stock is traded on the NASDAQ Global Select Market System under the symbol “PVSA.” Prices shown below are based on the prices reported by the NASDAQ system. |
| For the Quarter Ended |
High | Low | Dividends | |||||||||
| June 2011 |
$ | 21.69 | $ | 8.88 | $ | 0.02 | ||||||
| March 2011 |
11.95 | 9.00 | 0.02 | |||||||||
| December 2010 |
9.19 | 6.27 | 0.02 | |||||||||
| September 2010 |
8.45 | 5.75 | 0.02 | |||||||||
| June 2010 |
$ | 12.39 | $ | 7.11 | $ | 0.05 | ||||||
| March 2010 |
7.90 | 6.62 | 0.05 | |||||||||
| December 2009 |
9.47 | 6.41 | 0.05 | |||||||||
| September 2009 |
9.81 | 6.56 | 0.05 | |||||||||
Additional information required by Item 5 with respect to securities authorized for issuance under equity plans is set forth in Part III, Item 12 of this report.
Transfer Agent
Registrar and Transfer Company
10 Commerce Drive
Cranford, NJ 07016
Toll free phone: 1 (800) 368-5948
Fax: (908) 497-2312
Website: www.rtco.com
INFORMATION REQUESTS
A copy of the 2011 Annual Report on Form 10-K of Parkvale Financial Corporation filed with the Securities and Exchange Commission, and a list of exhibits thereto, will be furnished to shareholders without charge upon written request to the Chief Financial Officer of the Corporation at its Headquarters Office, 4220 William Penn Highway, Monroeville, PA 15146. The telephone number is (412) 373-7200. Parkvale’s website is http://www.parkvale.com.
(b) None.
(c) During the year ended June 30, 2011, Parkvale did not purchase any shares of its common stock.
31
Performance Graphs
The following graphs compare the yearly cumulative total return of Parkvale’s common stock over a five-year measurement period with (i) the yearly cumulative total return on the stocks included in the Nasdaq Market Index, (ii) the yearly cumulative total return on the stocks included in the Nasdaq Financial Stock Market Index and (iii) the S&P 500 total return data. The source of the graph and chart is SNL Financial. All of the cumulative returns are computed assuming the reinvestment of dividends at the frequency with which dividends were paid during the applicable years. The starting point for all graphs assumes the investment of $100 at the beginning of the period.
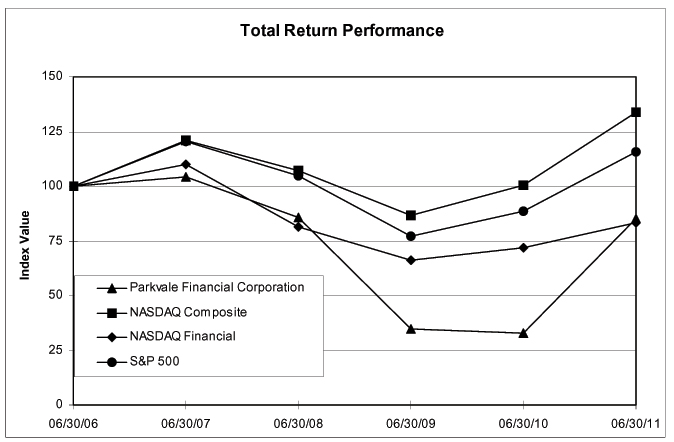
| Period Ending | ||||||||||||||||||||||||
| Index |
06/30/06 | 06/30/07 | 06/30/08 | 06/30/09 | 06/30/10 | 06/30/11 | ||||||||||||||||||
| Parkvale Financial Corporation |
100.00 | 104.33 | 85.67 | 34.53 | 32.80 | 85.35 | ||||||||||||||||||
| NASDAQ Composite |
100.00 | 120.72 | 107.21 | 86.70 | 100.61 | 133.68 | ||||||||||||||||||
| NASDAQ Financial |
100.00 | 110.17 | 81.40 | 66.25 | 72.03 | 83.13 | ||||||||||||||||||
| S&P 500 |
100.00 | 120.59 | 104.77 | 77.30 | 88.46 | 115.61 | ||||||||||||||||||
32
Item 6. Selected Financial Data.
SELECTED CONSOLIDATED FINANCIAL AND OTHER DATA
(Dollar amounts in thousands except per share data)
| Balance Sheet Data at June 30: |
2011 | 2010 | 2009 | 2008 | 2007 | |||||||||||||||
| Total assets |
$ | 1,806,556 | $ | 1,841,309 | $ | 1,906,370 | $ | 1,851,392 | $ | 1,844,231 | ||||||||||
| Loans, net |
983,996 | 1,032,363 | 1,108,936 | 1,201,665 | 1,234,397 | |||||||||||||||
| Securities and FHLB stock |
549,744 | 523,579 | 527,534 | 444,375 | 379,943 | |||||||||||||||
| Deposits |
1,484,924 | 1,488,073 | 1,511,248 | 1,493,685 | 1,469,084 | |||||||||||||||
| FHLB advances, term and other debt |
184,625 | 223,588 | 232,463 | 213,395 | 224,764 | |||||||||||||||
| Shareholders’ equity |
124,214 | 117,873 | 150,024 | 131,631 | 129,670 | |||||||||||||||
| Book value per share |
16.56 | 15.57 | 21.79 | 24.01 | 23.10 | |||||||||||||||
|
|
|
|
|
|
|
|
|
|
|
|||||||||||
| Operating Data for the Year Ended June 30: |
2011 | 2010 | 2009 | 2008 | 2007 | |||||||||||||||
| Total interest income |
$ | 64,794 | $ | 75,861 | $ | 90,483 | $ | 97,882 | $ | 97,260 | ||||||||||
| Total interest expense |
28,699 | 38,515 | 48,846 | 57,978 | 58,871 | |||||||||||||||
|
|
|
|
|
|
|
|
|
|
|
|||||||||||
| Net interest income |
36,095 | 37,346 | 41,637 | 39,904 | 38,389 | |||||||||||||||
| Provision for loan losses |
3,531 | 7,448 | 6,754 | 2,331 | 828 | |||||||||||||||
|
|
|
|
|
|
|
|
|
|
|
|||||||||||
| Net interest income after provision for loan losses |
32,564 | 29,898 | 34,883 | 37,573 | 37,561 | |||||||||||||||
| Net impairment losses recognized in earnings |
2,314 | 38,977 | 30,363 | — | — | |||||||||||||||
| Noninterest income |
11,898 | 12,443 | 12,662 | 8,452 | 10,358 | |||||||||||||||
| Noninterest expenses |
31,103 | 30,948 | 30,553 | 28,623 | 28,039 | |||||||||||||||
|
|
|
|
|
|
|
|
|
|
|
|||||||||||
| Income (loss) before taxes |
11,045 | (27,584 | ) | (13,371 | ) | 17,402 | 19,880 | |||||||||||||
| Income tax expense (benefit) |
2,931 | (10,784 | ) | (3,093 | ) | 4,599 | 6,455 | |||||||||||||
|
|
|
|
|
|
|
|
|
|
|
|||||||||||
| Net income (loss) |
$ | 8,114 | ($ | 16,800 | ) | ($ | 10,278 | ) | $ | 12,803 | $ | 13,425 | ||||||||
|
|
|
|
|
|
|
|
|
|
|
|||||||||||
| Preferred Stock Dividend |
1,588 | 1,588 | 829 | — | — | |||||||||||||||
|
|
|
|
|
|
|
|
|
|
|
|||||||||||
| Income (loss) to common shareholders |
$ | 6,526 | ($ | 18,388 | ) | ($ | 11,107 | ) | $ | 12,803 | $ | 13,425 | ||||||||
|
|
|
|
|
|
|
|
|
|
|
|||||||||||
| Net income (loss) per diluted common share |
$ | 1.17 | ($ | 3.36 | ) | ($ | 2.04 | ) | $ | 2.31 | $ | 2.34 | ||||||||
|
|
|
|
|
|
|
|
|
|
|
|||||||||||
| Other Selected Data (Statistical Profile): Year Ended June 30: |
2011 | 2010 | 2009 | 2008 | 2007 | |||||||||||||||
| Average yield earned on all interest-earning assets |
3.86 | % | 4.27 | % | 5.13 | % | 5.66 | % | 5.55 | % | ||||||||||
| Average rate paid on interest-bearing liabilities |
1.70 | 2.21 | 2.84 | 3.42 | 3.44 | |||||||||||||||
| Average interest rate spread |
2.16 | 2.06 | 2.29 | 2.24 | 2.11 | |||||||||||||||
| Net yield on average interest-earning assets |
2.15 | 2.10 | 2.36 | 2.31 | 2.19 | |||||||||||||||
| Other expenses to average assets |
1.71 | 1.62 | 1.63 | 1.56 | 1.51 | |||||||||||||||
| Efficiency ratio |
65.08 | 62.16 | 56.27 | 59.19 | 57.52 | |||||||||||||||
| Return on average assets |
0.44 | (0.88 | ) | (0.55 | ) | 0.70 | 0.73 | |||||||||||||
| Dividend payout ratio |
6.91 | — | — | 38.12 | 34.19 | |||||||||||||||
| Return on average equity |
5.92 | (11.10 | ) | (6.92 | ) | 9.73 | 10.54 | |||||||||||||
| Average equity to average total assets |
7.45 | 7.94 | 7.91 | 7.15 | 6.88 | |||||||||||||||
|
|
|
|
|
|
|
|
|
|
|
|||||||||||
| At June 30: |
2011 | 2010 | 2009 | 2008 | 2007 | |||||||||||||||
| One year gap to total assets |
9.28 | % | 12.45 | % | 9.46 | % | 2.07 | % | 1.67 | % | ||||||||||
| Intangibles to total equity |
22.05 | 24.19 | 19.61 | 23.04 | 24.09 | |||||||||||||||
| Shareholders’ equity to assets ratio |
6.93 | 6.40 | 7.87 | 7.11 | 7.03 | |||||||||||||||
| Ratio of nonperforming assets to total assets |
1.73 | 1.91 | 1.76 | 0.85 | 0.34 | |||||||||||||||
| Nonperforming assets |
$ | 31,246 | $ | 35,157 | $ | 33,641 | $ | 15,808 | $ | 6,196 | ||||||||||
| Allowance for loan losses as a % of gross loans |
1.86 | % | 1.83 | % | 1.60 | % | 1.25 | % | 1.14 | % | ||||||||||
| Number of full-service offices |
47 | 47 | 48 | 48 | 47 | |||||||||||||||
|
|
|
|
|
|
|
|
|
|
|
|||||||||||
33
Item 7. Management’s Discussion and Analysis of Financial Condition and Results of Operations.
The purpose of this discussion is to summarize the financial condition and results of operations of Parkvale Financial Corporation (“PFC”) and provide other information which is not readily apparent from the consolidated financial statements included in this report. Reference should be made to those statements, the notes thereto and the selected financial data presented elsewhere in this report for a complete understanding of the following discussion and analysis.
INTRODUCTION
PFC is a unitary savings and loan holding company incorporated under the laws of the Commonwealth of Pennsylvania. Its main operating subsidiary is Parkvale Savings Bank (the “Bank”), which is a Pennsylvania chartered permanent reserve fund stock savings bank headquartered in Monroeville, Pennsylvania. PFC and its subsidiaries are collectively referred to herein as “Parkvale”. Parkvale is also involved in lending in the Columbus, Ohio area through its wholly owned subsidiary, Parkvale Mortgage Corporation (“PMC”).
THE BANK
General
The Bank conducts business in the greater tri-state area through 47 full-service offices using the trade name Parkvale Bank with 40 offices in Allegheny, Beaver, Butler, Fayette, Washington and Westmoreland Counties of Pennsylvania, two branches in West Virginia and five branches in Ohio. With total assets of $1.8 billion at June 30, 2011, Parkvale was the third largest financial institution headquartered in the Pittsburgh metropolitan area and the ninth largest financial institution with a significant presence in western Pennsylvania.
The primary business of Parkvale consists of attracting deposits from the general public in the communities that it serves and investing such deposits, together with other funds, in residential real estate loans, consumer loans, commercial loans, and investment securities. Parkvale focuses on providing a wide range of consumer and commercial services to individuals, partnerships and corporations in the greater Pittsburgh metropolitan area, which comprises its primary market area. In addition to the loans described above, these services include various types of deposit and checking accounts, including commercial checking accounts and automated teller machines (“ATMs”) as part of the STAR network.
Parkvale derives its income primarily from interest charged on loans, interest on investments, and, to a lesser extent, service charges and fees. Parkvale’s principal expenses are interest on deposits and borrowings and operating expenses. Lending activities are funded principally by deposits, loan repayments, and operating earnings.
Lower housing demand in Parkvale’s primary lending areas, relative to its deposit growth, has spurred the Bank to purchase residential mortgage loans from other financial institutions in the secondary market. This purchase strategy also achieves geographic asset diversification. Parkvale purchases residential mortgage loans subject to its normal underwriting standards. Parkvale purchased $10.7 million of mortgage loans during fiscal 2011, compared to $6.3 million of mortgage loans during fiscal 2010.
Financial Condition
Parkvale’s average interest-earning assets decreased $97.4 million or 5.5% for the year ended June 30, 2011 over fiscal year 2010. Average balances decreased by $42.8 million in loans, by $54.2 million in investments and by $346,000 in federal funds sold during the fiscal 2011 period. Average deposit liabilities decreased $30.7 million in fiscal year 2011, and average borrowings decreased by $23.2 million in fiscal 2011, resulting in a $43.5 million or 124.8% decline in net interest-earning assets. However, our average interest rate spread increased from 2.06% in fiscal 2010 to 2.16% in fiscal 2011. The decrease in net interest-earning assets offset by an increase in the average interest rate spread resulted in a $1.3 million or 3.3% decrease in net interest income in fiscal 2011 compared to fiscal 2010.
34
Asset and Liability Management
Parkvale functions as a financial intermediary, and as such, its financial condition should be examined in terms of its ability to manage interest rate risk (“IRR”) and diversify credit risk.
Parkvale’s asset and liability management (“ALM”) is driven by the ability to manage the exposure of current and future earnings and capital to fluctuating interest rates. This exposure occurs because the present value of future cash flows, and in many cases the cash flows themselves, change when interest rates change. One of Parkvale’s ALM goals is to minimize this exposure.
IRR is measured and analyzed using static interest rate sensitivity gap indicators, net interest income simulations and net present value sensitivity measures. These combined methods enable Parkvale’s management to regularly monitor both the direction and magnitude of potential changes in the pricing relationship between interest-earning assets and interest-bearing liabilities.
Interest rate sensitivity gap analysis provides one indicator of potential interest rate risk by comparing interest-earning assets and interest-bearing liabilities maturing or repricing at similar intervals. The gap ratio is defined as rate-sensitive assets minus rate-sensitive liabilities for a given time period divided by total assets. Parkvale continually monitors gap ratios, and within the IRR framework and in conjunction with net interest income simulations, implements actions to reduce exposure to fluctuating interest rates. Such actions have included maintaining high liquidity, increasing the repricing frequency of the loan portfolio, purchasing adjustable-rate investment securities and lengthening the overall maturities of interest-bearing liabilities. Management believes these ongoing actions minimize Parkvale’s vulnerability to fluctuations in interest rates. The one-year gap ratio decreased from 12.45% at June 30, 2010 to 9.28% as of June 30, 2011, the three-year gap ratio went from 1.38% at June 30, 2010 to -3.65% at June 30, 2011 and the five-year gap ratio was 5.91% at June 30, 2010 versus 1.88% at June 30, 2011. The decrease in the asset sensitivity in the one-year GAP ratio is due to a decrease in federal funds sold and projected calls on agency step-up securities.
Gap indicators of IRR are not necessarily consistent with IRR simulation estimates. Parkvale utilizes net interest income simulation estimates under various assumed interest rate environments to more fully capture the details of IRR. Assumptions included in the simulation process include measurement over a probable range of potential interest rate changes, prepayment speeds on amortizing financial instruments, other imbedded options, loan and deposit volumes and rates, non-maturity deposit assumptions and management’s capital requirements. The estimated impact on projected net interest income in fiscal 2012 assuming an immediate parallel and instantaneous shift in current interest rates, would result in the following percentage changes over fiscal 2011 net interest income: +100 basis points (“bp”), +0.52%; +200 bp, -2.03%; -100 bp, -7.90%; -200 bp, -20.00%. This compares to projected net interest income for fiscal 2011 made at June 30, 2010 of: +100 bp, +10.66%; +200 bp, +7.62%; -100 bp, +4.21%; -200 bp, -9.04%. The fluctuation in projected net interest income between fiscal 2012 and 2011 relates to lower yields on shorter-term liquid assets and is reflective of Parkvale’s investment and interest rate risk management strategy of shortening the duration of its investment portfolio by purchasing short-term agency callable and multi-step securities in anticipation of rising interest rates.
35
Interest-Sensitivity Analysis. The following table reflects the maturity and repricing characteristics of Parkvale’s assets and liabilities at June 30, 2011:
| (Dollars in thousands): |
||||||||||||||||||||
| Interest sensitive assets |
<3 months | 4-12 Months | 1-5 Years | 5+Years | Total | |||||||||||||||
| ARM and other variable rate loans |
$ | 176,962 | $ | 231,371 | $ | 141,650 | $ | 8,172 | $ | 558,155 | ||||||||||
| Fixed-rate loans, net (1) |
12,843 | 45,132 | 176,572 | 209,049 | 443,594 | |||||||||||||||
| Variable rate mortgage-backed securities and CMO’s |
27,009 | 51,330 | 108,594 | — | 186,933 | |||||||||||||||
| Fixed rate mortgage-backed securities and CMO’s (1) |
1,662 | 4,227 | 27,962 | 50,140 | 83,991 | |||||||||||||||
| Investments and federal funds sold |
208,727 | 33,151 | 61,733 | 107,471 | 411,082 | |||||||||||||||
| Equities, primarily FHLB |
— | 4,723 | 12,310 | 522 | 17,555 | |||||||||||||||
|
|
|
|
|
|
|
|
|
|
|
|||||||||||
| Total interest-sensitive assets |
$ | 427,203 | $ | 369,934 | $ | 528,821 | $ | 375,354 | $ | 1,701,312 | ||||||||||
|
|
|
|
|
|
|
|
|
|
|
|||||||||||
| Ratio of interest-sensitive assets to total assets |
23.7 | % | 20.5 | % | 29.3 | % | 20.8 | % | 94.2 | % | ||||||||||
|
|
|
|
|
|
|
|
|
|
|
|||||||||||
| Interest-sensitive liabilities |
||||||||||||||||||||
| Passbook deposits and club accounts (2) |
$ | 14,022 | $ | 45,750 | $ | 56,097 | $ | 127,443 | $ | 243,312 | ||||||||||
| Checking accounts (3) |
25,709 | 21,626 | 43,256 | 237,568 | 328,159 | |||||||||||||||
| Money market deposit accounts |
77,705 | 44,000 | 44,000 | — | 165,705 | |||||||||||||||
| Certificates of deposit |
105,502 | 246,029 | 361,672 | 28,700 | 741,903 | |||||||||||||||
| FHLB advances and other borrowings |
23,757 | 25,060 | 157,560 | 10,010 | 216,387 | |||||||||||||||
|
|
|
|
|
|
|
|
|
|
|
|||||||||||
| Total interest-sensitive liabilities |
$ | 246,695 | $ | 382,465 | $ | 662,585 | $ | 403,721 | $ | 1,695,466 | ||||||||||
|
|
|
|
|
|
|
|
|
|
|
|||||||||||
| Ratio of interest-sensitive liabilities to total liabilities and equity |
13.7 | % | 21.2 | % | 36.7 | % | 22.4 | % | 93.9 | % | ||||||||||
|
|
|
|
|
|
|
|
|
|
|
|||||||||||
| Ratio of interest-sensitive assets to interest-sensitive liabilities |
173.2 | % | 96.7 | % | 79.8 | % | 93.0 | % | 100.3 | % | ||||||||||
|
|
|
|
|
|
|
|
|
|
|
|||||||||||
| Period Gap (Assets Less Liabilities) |
$ | 180,508 | ($ | 12,531 | ) | ($ | 133,764 | ) | ($ | 28,367 | ) | |||||||||
|
|
|
|
|
|
|
|
|
|
|
|||||||||||
| Periodic Gap to total assets |
10.0 | % | -0.7 | % | -7.4 | % | -1.6 | % | 0.3 | % | ||||||||||
|
|
|
|
|
|
|
|
|
|
|
|||||||||||
| Cumulative Gap (Assets Less Liabilities) |
$ | 180,508 | $ | 167,977 | $ | 34,213 | $ | 5,846 | ||||||||||||
| Cumulative Gap to total assets |
10.0 | % | 9.3 | % | 1.9 | % | 0.3 | % | ||||||||||||
| (1) | Includes total repayments and prepayments at an assumed rate of 15% per annum for fixed-rate mortgage loans and mortgage-backed securities, with the amounts for other loans based on the estimated remaining loan maturity by loan type. |
| (2) | Based on historical data, assumes passbook deposits are rate sensitive at the rate of 23.4% in the first year, compared with 21.0% for fiscal 2010. |
| (3) | Includes investment checking accounts, which are assumed to be immediately rate sensitive, with remaining interest-bearing checking accounts assumed to be rate sensitive at 10.0% in the first year and 5.0% per annum thereafter. Noninterest checking accounts are considered core deposits and are included in the 5+ years category. |
Asset Management. A primary goal of Parkvale’s asset management is to maintain a high level of liquid assets. Parkvale defines the following as liquid assets: cash, federal funds sold, certain corporate debt maturing in less than one year, U.S. Government and agency obligations maturing in less than one year and short-term bank deposits. The average daily liquidity was 32.5% for the quarter ended June 30, 2011. During fiscal 2011, in addition to maintaining high liquidity, Parkvale’s investment strategy was to purchase primarily lower risk investment grade securities rated AA or higher to enhance yields and reduce the risk associated with rate volatility.
Parkvale’s lending strategy has been designed to shorten the average maturity of its assets and increase the rate sensitivity of the loan portfolio. In fiscal 2011, 2010 and 2009, 30.0%, 40.5% and 48.3%, respectively, of mortgage loans originated or purchased were adjustable-rate loans. While Parkvale has continually emphasized the origination of ARM loans, ARM loans have decreased as a percentage of total loans originated and purchased due to current market conditions. ARMs totaled $451.4 million or 58.0% of total mortgage loans at June 30, 2011 versus $511.8 million or
36
62.7% of total mortgage loans at June 30, 2010. To supplement local mortgage originations, Parkvale purchased loans aggregating $10.7 million in fiscal 2011 from other financial institutions, compared to loans aggregating $6.3 million in fiscal 2010. There were no loan purchases during fiscal 2009. The loan packages purchased were fixed-rate residential loans. All of the fiscal 2011 and fiscal 2010 purchases were residential loans. The loans purchased from others are reviewed for underwriting standards that include appraisals, creditworthiness and acceptable ratios of loan to value and debt to income calculated at fully indexed rates. The practice of purchasing loans or ARM securities in the secondary market was temporarily discontinued in fiscal 2009 due to the lack of acceptable product availability. At June 30, 2011, Parkvale had commitments to originate mortgage loans totaling $4.5 million and commercial loans of $7.9 million. Commitments to fund construction loans in process at June 30, 2011 were $4.9 million, which were funded from current liquidity.
Parkvale continues to focus on its consumer loan portfolio through new originations. Home equity lines of credit are granted up to 90% of collateral value at competitive rates. In general, these loans have shorter maturities and greater interest rate sensitivity and margins than residential real estate loans. At June 30, 2011 and 2010, consumer loans were $183.2 million and $189.6 million, which represented a 3.4% decrease, with fixed-rate second mortgage loans totaling $68.8 million and $80.6 million of the total outstanding balances at June 30, 2011 and 2010, respectively.
Investments in mortgage-backed securities and other securities, such as U.S. Government and agency obligations and corporate debt, are primarily purchased to enhance Parkvale’s liquidity position and to diversify asset concentration. During fiscal 2011, Parkvale purchased an aggregate of $345.6 million of investment securities classified as held to maturity, compared to $431.8 million of such purchases in fiscal 2010 and $284.6 million in fiscal 2009. The fiscal 2011 purchases primarily consist of government and agency securities. Substantially all of the 2011 purchases were either adjustable or expected to be shorter term due to step up features. At June 30, 2011, the combined weighted average yield on adjustable corporate securities, agency and collateralized mortgage obligations was 2.52%. If the interest rate indices were to fall further, net interest income may decrease if the yield, after discount amortization, on these securities, as well as other liquid assets and ARM loans were to fall faster than liabilities would reprice. All debt securities are classified as held to maturity and are not available for sale or held for trading.
At June 30, 2010, the credit quality of non-agency CMO securities rated below investment grade as a result of downgrades by the national rating agencies was evaluated. Based upon actual and future credit deterioration projections and results of the evaluation, the Bank decided as of June 30, 2010 to sell fifteen non-agency CMO securities in the near term. These debt securities were reclassified from held to maturity to available for sale at June 30, 2010 and other than temporary impairment charges of $13.1 million were recognized in earnings during fiscal 2010 as the difference between the respective investment’s amortized cost basis and fair value at June 30, 2010. The remaining carrying value of the available for sale non-agency CMO securities was $59.8 million at June 30, 2010. During the September 30, 2010 quarter, a total of $49.0 million of below-investment grade non-agency collateralized mortgage obligations, which were classified as available for sale at June 30, 2010, were sold at a gain of $1.2 million. Two non-agency collateralized mortgage obligations with an amortized cost totaling $7.0 million were transferred from available for sale to held to maturity at September 30, 2010 as long term prospects related to the securities improved during said quarter. The remaining non-agency CMO security portfolio carrying value of $56.7 million and fair value of $54.4 million at June 30, 2011 is expected to be received through maturity.
Liability Management. Deposits are priced according to management’s asset/liability objectives, alternate funding sources and competitive factors. Certificates of deposits maturing after one year as a percent of total deposits were 26.3% at June 30, 2011 and 26.0% at June 30, 2010. The increased percentage of longer-term certificates is reflective of consumer preference for longer-terms. Over the past 5 years, Parkvale has made a concentrated effort to increase low cost deposits by attracting new checking customers to our community branch offices. During fiscal 2011, checking accounts increased by 6.1% compared to a 12.4% increase during fiscal 2010. Parkvale’s primary sources of funds are deposits received through its branch network and advances from the Federal Home Loan Bank (“FHLB”). FHLB advances can be used on a short-term basis for liquidity purposes or on a long-term basis to support lending activities.
37
Contractual Obligations
Information concerning our future contractual obligations by payment due dates at June 30, 2011 is summarized as follows. Contractual obligations for deposit accounts do not include accrued interest. Payments for deposits other than time, which consist of non-interest bearing deposits and money market, NOW and savings accounts, are based on our historical experience, judgment and statistical analysis, as applicable, concerning their most likely withdrawal behaviors.
| (Dollars in thousands) |
Due < one year | 1-3 years | 3-5 years | 5+ years | Total | |||||||||||||||
| Deposits other than time |
$ | 228,812 | $ | 121,725 | $ | 21,628 | $ | 365,011 | $ | 737,176 | ||||||||||
| Time deposits |
351,532 | 271,529 | 90,142 | 28,700 | 741,903 | |||||||||||||||
| Advances from FHLB |
30,060 | 20,229 | 80,568 | 20,000 | 150,857 | |||||||||||||||
| Term debt |
2,500 | 5,000 | 13,750 | — | 21,250 | |||||||||||||||
| Other debt |
12,518 | — | — | — | 12,518 | |||||||||||||||
| Mortgage loan commitments |
4,498 | — | — | — | 4,498 | |||||||||||||||
| Operating leases |
1,255 | 2,158 | 1,114 | 2,594 | 7,121 | |||||||||||||||
|
|
|
|
|
|
|
|
|
|
|
|||||||||||
| Total |
$ | 631,175 | $ | 420,641 | $ | 207,202 | $ | 416,305 | $ | 1,675,323 | ||||||||||
|
|
|
|
|
|
|
|
|
|
|
|||||||||||
Concentration of Credit Risk
Financial institutions, such as Parkvale, generate income primarily through lending and investing activities. The risk of loss from lending and investing activities includes the possibility that losses may occur from the failure of another party to perform according to the terms of the loan or investment agreement. This possibility of loss is known as credit risk.
Credit risk is increased when lending and investing activities concentrate a financial institution’s earning assets in a way that exposes the institution to a material loss from any single occurrence or group of related occurrences. Diversifying loans and investments to prevent concentrations of risks is one manner a financial institution can reduce potential losses due to credit risk. Examples of asset concentrations would include, but not be limited to, geographic concentrations, loans or investments of a single type, multiple loans to a single borrower, loans made to a single type of industry and loans of an imprudent size relative to the total capitalization of the institution. For loans originated, Parkvale has taken steps to reduce exposure to credit risk by emphasizing lower risk single-family mortgage loans, which comprise 61.5% of the gross loan portfolio as of June 30, 2011. Home equity loans comprised 14.7% of the gross loan portfolio at June 30, 2011, which generally consists of lower balance second mortgages and home equity loans originated in the greater Pittsburgh area and Ohio Valley region.
Nonperforming Loans and Foreclosed Real Estate
Nonperforming loans, by class, and foreclosed real estate (“REO”), consisted of the following at June 30:
| (Dollars in thousands) |
2011 | 2010 | 2009 | 2008 | 2007 | |||||||||||||||
| Nonaccrual loans: |
||||||||||||||||||||
| Mortgage loans: |
||||||||||||||||||||
| 1-4 family |
$ | 22,058 | $ | 24,332 | $ | 22,550 | $ | 6,079 | $ | 2,747 | ||||||||||
| Commercial |
1,457 | 2,435 | 4,920 | 5,447 | 527 | |||||||||||||||
| Consumer loans: |
||||||||||||||||||||
| Home equity |
700 | 521 | 528 | 523 | 550 | |||||||||||||||
| Automobile |
196 | 286 | 243 | 175 | 139 | |||||||||||||||
| Other consumer |
14 | 41 | 21 | 22 | 23 | |||||||||||||||
| Commercial business loans |
1,271 | 3,084 | 1,940 | 496 | 1,275 | |||||||||||||||
|
|
|
|
|
|
|
|
|
|
|
|||||||||||
| Total nonaccrual loans |
$ | 25,696 | $ | 30,699 | $ | 30,202 | $ | 12,742 | $ | 5,261 | ||||||||||
| Less: in-place loan reserves |
(4,214 | ) | (4,179 | ) | (2,267 | ) | (213 | ) | (922 | ) | ||||||||||
|
|
|
|
|
|
|
|
|
|
|
|||||||||||
| Total nonaccrual loans, net of in-place reserves |
$ | 21,482 | $ | 26,520 | $ | 27,935 | $ | 12,529 | $ | 4,339 | ||||||||||
| Total foreclosed real estate, net of reserves |
9,764 | 8,637 | 5,706 | 3,279 | 1,857 | |||||||||||||||
|
|
|
|
|
|
|
|
|
|
|
|||||||||||
| Total nonaccrual loans and foreclosed real estate, net of reserves |
$ | 31,246 | $ | 35,157 | $ | 33,641 | $ | 15,808 | $ | 6,196 | ||||||||||
|
|
|
|
|
|
|
|
|
|
|
|||||||||||
| Total nonaccrual loans, net of in-place reserves, as a % of total loans |
2.14 | % | 2.52 | % | 2.48 | % | 1.02 | % | 0.35 | % | ||||||||||
|
|
|
|
|
|
|
|
|
|
|
|||||||||||
| Total nonaccrual loans and foreclosed real estate, net of reserves, as a percent of total assets |
1.73 | % | 1.91 | % | 1.76 | % | 0.85 | % | 0.34 | % | ||||||||||
|
|
|
|
|
|
|
|
|
|
|
|||||||||||
38
A weak national economy and to a lesser extent local housing sector and credit markets have contributed towards an increased level of nonperforming loans and foreclosed real estate during fiscal 2007 through fiscal 2010. While the upward trend continued with foreclosed real estate in fiscal 2011, the level of nonaccrual loans decreased during fiscal 2011 compared to fiscal 2010. Nonperforming loans (delinquent 90 days or more) and foreclosed real estate, net of reserves, in the aggregate represented 1.73%, 1.91% and 1.76% of total assets at June 30, 2011, 2010 and 2009 respectively. The level of nonperforming assets at June 30, 2011 has decreased to $31.2 million from $35.2 million at June 30, 2010, and includes $21.5 million of non-accrual loans. Please refer to the loan charts and analysis in Note C to of this Form 10-K.
As of June 30, 2011, 1-4 family mortgage loans delinquent 90 days or more include 46 loans aggregating $18.7 million purchased from others and serviced by national service providers with a cost basis ranging from $100,000 to $843,000 and 44 loans aggregating $3.4 million in Parkvale’s retail market area. Management believes that these 90 delinquent 1-4 family mortgage loans are adequately collateralized with the exception of 38 loans with a remaining net book value of $9.4 million, which have the necessary related allowances for losses provided. Loans 180 days or more delinquent are individually evaluated for collateral values in accordance with banking regulations with specific reserves recorded as appropriate.
At June 30, 2011, modifications have been performed on 174 1-4 family mortgage loans totaling $31.5 million. Of the aggregate $31.5 million, 129 modifications totaling $20.2 million were performed at market terms, primarily related to extension of maturity dates and extension of interest-only payment periods of thirty-six months or less. The discounted cash flow analysis related to these modifications results in an insignificant impact over the life of the loan. Of the aggregate $31.5 million, 45 modifications totaling $11.3 million were determined to be Troubled Debt Restructurings (TDR). The discounted cash flows related to these TDR’s was analyzed and the appropriate reserves have been established at June 30, 2011. Of the 129 loan modifications, 112 loans totaling $18.1 million are performing at June 30, 2011. Of the 45 TDR’s, 33 loans totaling $9.4 million are performing at June 30, 2011.
Commercial business loans delinquent 90 days or more of $1.3 million at June 30, 2011 include a $798,000 relationship to a coal extraction and reclamation entity. The commercial relationship is in the process of collection and management believes the facility is adequately collateralized.
Commercial real estate loans delinquent 90 days or more of $1.4 million at June 30, 2011 include a $447,000 relationship to a restaurant operator. The restaurant, which was open for business and operating as a going concern at June 30, 2011, is in the process of collection and management believes the facility is adequately collateralized.
Loans are placed on nonaccrual status when, in management’s judgment, the probability of collection of principal and interest is deemed to be insufficient to warrant further accrual. When a loan is placed on nonaccrual status, previously accrued but unpaid interest is deducted from interest income. As a result, uncollected interest income is not included in earnings for nonaccrual loans. The amount of interest income on nonaccrual loans that has not been recognized in interest income was $1.8 million for fiscal 2011, $1.2 million for fiscal 2010 and $825,000 for fiscal 2009. Parkvale provides an allowance for the loss of accrued but uncollected interest on mortgage, consumer and commercial business loans, which are 90 days or more contractually past due.
Parkvale has $33.6 million of loans classified as substandard at June 30, 2011. The substandard loans have exhibited signs of weakness, or have been recently modified or refinanced and are being monitored to assess if new payment terms are followed by the borrowers. These loans have exhibited characteristics that warrant special monitoring. Examples of these concerns include irregular payment histories, questionable collateral values, investment properties having cash flows insufficient to service debt, and other financial inadequacies of the borrower. These loans are regularly monitored with efforts being directed towards resolving the underlying concerns and achieving a performing status classification of such loans.
Foreclosed real estate was $9.8 million at June 30, 2011 compared to $8.6 million at June 30, 2010. The real estate owned balance at June 30, 2011 consists of $6.1 million in 36 single-family dwellings and commercial real estate
39
aggregating $3.7 million, which includes one facility used as an automobile dealership with a net book value of $1.0 million; one facility used as a former medical facility with a net book value of $1.0 million; and one facility used as commercial office space with a net book value of $995,000. The property formerly used as an automobile dealership is under agreement to be sold for $1.0 million and is expected to close by December 31, 2011. The property used for commercial office space was sold and closed in August 2011 for $875,000, and $118,000 in consideration was received from a guarantor to the former loan. Foreclosed real estate is valued at the lower of cost or market less estimated selling and holding costs with reserves established when deemed necessary.
Allowance for Loan Losses
The allowance for loan loss was $18.6 million at June 30, 2011 and $19.2 million at June 30, 2010 or 1.9% and 1.8% of gross loans at June 30, 2011 and June 30, 2010, respectively. The adequacy of the allowance for loan loss is determined by management through evaluation of the loss probable on individual nonperforming, delinquent and high dollar loans, economic and business trends, growth and composition of the loan portfolio and historical loss experience, as well as other relevant factors.
Parkvale continually monitors the loan portfolio to identify potential portfolio risks and to detect potential credit deterioration in the early stages. Reserves are then established based upon the evaluation of the inherent risks in the loan portfolio. Changes to the levels of reserves are made quarterly based upon perceived changes in risk. When evaluating the risk elements within the loan portfolio, Parkvale has a substantial portion of the loans secured by real estate (see Note C — Loans, of “Notes to Consolidated Financial Statements”). In addition to the $615.9 million of 1-4 family mortgage loans, the majority of the consumer loans represent either second mortgages in the form of term loans and home equity lines of credit or first lien positions on home loans. The Bank does not underwrite subprime loans, negative amortization loans or discounted teaser rates on ARM loans. Included in the 1-4 family mortgage portfolio is $461.9 of amortizing loans and $154.0 million of interest only loans as of June 30, 2011. The initial interest only period for $59.1 million of the aggregate $154.0 million has expired, and the loans are contractually amortizing at June 30, 2011. Originated adjustable 1-4 family mortgage loans are made at competitive market rates in the primary lending areas of the Bank with add-on margins ranging from 250 to 300 basis points to either the constant maturity treasury yields or Libor. Adjustable-rate 1-4 family mortgage loans purchased in the secondary market that are serviced by national service providers are prudently underwritten with emphasis placed on loans to value of less than 80% combined with high FICO scores. The purchased loan portfolio is geographically diversified throughout the United States and is generally considered well collateralized. Aside from the states where Parkvale has offices, no other state exceeds 3% of the mortgage loan portfolio. While management believes the allowance is adequate to absorb estimated credit losses in its existing loan portfolio, future adjustments may be necessary in circumstances where economic conditions change and affect the assumptions used in evaluating the adequacy of the allowance for loan losses.
The following table sets forth the allowance for loan loss allocation by segment at June 30:
| (Dollars in thousands) |
2011 | 2010 | 2009 | 2008 | 2007 | |||||||||||||||||||||||||||||||||||
| General Allowances: |
||||||||||||||||||||||||||||||||||||||||
| Mortgage loans |
$ | 7,017 | 37.7 | % | $ | 8,735 | 45.5 | % | $ | 9,162 | 51.1 | % | $ | 8,527 | 55.9 | % | $ | 6,680 | 47.0 | % | ||||||||||||||||||||
| Consumer loans |
2,726 | 14.6 | % | 2,745 | 14.3 | % | 3,193 | 17.8 | % | 3,510 | 23.0 | % | 4,154 | 29.3 | % | |||||||||||||||||||||||||
| Commercial business loans |
2,401 | 12.9 | % | 2,534 | 13.2 | % | 3,038 | 16.9 | % | 2,741 | 18.0 | % | 2,848 | 20.1 | % | |||||||||||||||||||||||||
|
|
|
|
|
|
|
|
|
|
|
|
|
|
|
|
|
|
|
|
|
|||||||||||||||||||||
| Total General |
12,144 | 65.2 | % | 14,014 | 73.0 | % | 15,393 | 85.8 | % | 14,778 | 96.9 | % | 13,682 | 96.4 | % | |||||||||||||||||||||||||
|
|
|
|
|
|
|
|
|
|
|
|
|
|
|
|
|
|
|
|
|
|||||||||||||||||||||
| Specific Allowances: |
||||||||||||||||||||||||||||||||||||||||
| Mortgage |
6,176 | 33.2 | % | 4,316 | 22.5 | % | 1,697 | 9.4 | % | 105 | 0.7 | % | 31 | 0.2 | % | |||||||||||||||||||||||||
| Consumer |
306 | 1.6 | % | 383 | 2.0 | % | 324 | 1.8 | % | 288 | 1.9 | % | 426 | 3.0 | % | |||||||||||||||||||||||||
| Commercial business loans |
— | 0.0 | % | 496 | 2.5 | % | 546 | 3.0 | % | 78 | 0.5 | % | 50 | 0.4 | % | |||||||||||||||||||||||||
|
|
|
|
|
|
|
|
|
|
|
|
|
|
|
|
|
|
|
|
|
|||||||||||||||||||||
| Total Specific |
6,482 | 34.8 | % | 5,195 | 27.0 | % | 2,567 | 14.2 | % | 471 | 3.1 | % | 507 | 3.6 | % | |||||||||||||||||||||||||
|
|
|
|
|
|
|
|
|
|
|
|
|
|
|
|
|
|
|
|
|
|||||||||||||||||||||
| Total Allowances for loan losses |
$ | 18,626 | 100.0 | % | $ | 19,209 | 100.0 | % | $ | 17,960 | 100.0 | % | $ | 15,249 | 100.0 | % | $ | 14,189 | 100.0 | % | ||||||||||||||||||||
|
|
|
|
|
|
|
|
|
|
|
|
|
|
|
|
|
|
|
|
|
|||||||||||||||||||||
As of June 30, 2011, the general allowance for mortgage loans was $7.0 million or 0.9% of the mortgage loan portfolio; for consumer loans the general allowance was $2.7 million or 1.5% of the consumer loan portfolio; and for commercial business loans, the general allowance was $2.4 million or 6.0% of the respective loan portfolio.
40
Results of Operations
Parkvale Financial Corporation reported net income to common shareholders for the fiscal year ended June 30, 2011 of $6.5 million or $1.17 per diluted common share, compared to a net loss of $18.4 million or $3.36 per diluted common share for the fiscal year ended June 30, 2010. The $24.9 million increase in the fiscal 2011 net income reflects a $36.7 million decrease in non-cash debt security impairment charges and a $3.9 million decrease in the provision for loan losses. These factors were partially offset by a $13.7 million increase in income tax expense, a $1.3 million decrease in net interest income and a $1.1 million decrease in gain on sale of assets. The increase in income tax expense reflects a higher level of pre-tax income for the twelve months ended June 30, 2011.
Interest Income
Interest income on loans decreased by $6.0 million or 10.7% in fiscal 2011 from fiscal 2010. Average loans outstanding in fiscal 2011 were $1.0 billion, representing a decrease of $42.8 million or 4.1% compared to fiscal 2010. Single-family residential loans declined by $44.8 million or 6.8% from June 30, 2010 to June 30, 2011. The lower interest income also reflected a lower average loan yield, which was 5.33% in fiscal 2010 and 4.96% in fiscal 2011, due to the lower prevailing rates on new loans along with ARM loans repricing down due to lower indices for periodic rate adjustments. Interest income on loans decreased by $10.5 million or 15.7% from fiscal 2009 to 2010. The average yield on loans decreased from 5.72% in fiscal 2009 to 5.33% in fiscal 2010, and the average loan balance decreased by $109 million or 9.4% in fiscal 2010 compared to fiscal 2009.
Interest income on investments decreased by $5.0 million or 26.2% in fiscal 2011. This was the result of a decrease in the average yield on investments to 2.76% in fiscal 2011 from 3.38% in fiscal 2010 and by a decrease in the average balance of $54.2 million or 9.5% to $517 million. Interest income on investments decreased by $3.8 million or 16.6% from fiscal 2009 to fiscal 2010 as a result a decrease in the average yield on investments to 3.38% in fiscal 2010 from 4.57% in fiscal 2009, partially offset by an increase in the average balance of $64.5 million or 12.7% to $572 million. The higher level of investment securities during fiscal 2010 was primarily related to purchases of lower risk short-term government and agency securities, which have lower yields than other investment securities.
Interest income on federal funds sold decreased by $1,000 or 0.3% from fiscal 2010 to fiscal 2011. The decrease was attributable primarily to a decrease in the average federal funds sold balance of $346,000 from fiscal 2010. The federal funds sold average yield was 0.25% throughout fiscal 2011 as a result of the Federal Reserve maintaining the Federal Fund target rate at 0.25% since the end of fiscal 2010. Interest income on federal funds sold decreased by $307,000 or 44.7% from fiscal 2009 to fiscal 2010 due primarily to a decrease in the average yield from 0.74% in fiscal 2009 to 0.25% in fiscal 2010, offset by an increase in the average federal funds sold balance from $92.6 million in fiscal 2009 to $150.6 million in fiscal 2010.
Interest Expense
Interest expense on deposits decreased by $8.5 million or 30.8% from fiscal 2010 to fiscal 2011. The average deposit balance decreased $30.7 million or 2.0% in fiscal 2011 and the average cost decreased from 1.81% in fiscal 2010 to 1.28% in fiscal 2011. Interest expense on deposits decreased by $11.0 million or 28.6% from fiscal 2009 to fiscal 2010. The average deposit balance increased $18.1 million or 1.2% in fiscal 2010, while the average cost decreased from 2.57% in fiscal 2009 to 1.81% in fiscal 2010. The lower rates paid in fiscal 2011 and fiscal 2010 were reflective primarily of lower prevailing market rates on certificate accounts.
Interest expense on borrowed money decreased by $1.4 million or 12.3% in fiscal 2011. This was due to a decrease of $23.2 million or 10.2% in the average balance due to maturity of Federal Home Loan Bank advances of $35.0 million and a decrease in the average cost of borrowings from 4.88% in fiscal 2010 to 4.76% in fiscal 2011. Interest expense on borrowed money increased by $692,000 or 6.3% in fiscal 2010. This was due to an increase of $5.0 million or 2.3% in the average balance due to $25 million of term debt borrowings on December 30, 2008 and an increase in the average cost of borrowings from 4.68% in fiscal 2009 to 4.88% in fiscal 2010. The increase in average cost of borrowings during fiscal 2010 is due primarily to a higher interest rate on PNC Bank, National Association term debt as a result of not meeting a financial reporting covenant beginning in the second quarter of fiscal 2010.
41
Yields Earned and Rates Paid
The results of operations of Parkvale depend substantially on its net interest income, which is generally the largest component of Parkvale’s operating results. Net interest income is affected by the difference or spread between yields earned by Parkvale on its loan and investment portfolios and the rates of interest paid by Parkvale for deposits and borrowings, as well as the relative amounts of its interest-earning assets and interest-bearing liabilities.
The following table sets forth certain information regarding changes in interest income and interest expense for the periods indicated. For each category of interest-earning asset and interest-bearing liability, information is provided on changes attributable to (1) changes in rates (change in rate multiplied by old volume), (2) changes in volume (changes in volume multiplied by old rate), and (3) changes in rate-volume (change in rate multiplied by the change in volume).
| Year ended June 30 | ||||||||||||||||||||||||||||||||
| 2011 vs. 2010 | 2010 vs. 2009 | |||||||||||||||||||||||||||||||
| (Dollars in thousands) |
Rate | Volume | Rate/ Volume |
Total | Rate | Volume | Rate/ Volume |
Total | ||||||||||||||||||||||||
| Interest-earning assets |
||||||||||||||||||||||||||||||||
| Loans |
($ | 3,903 | ) | ($ | 2,283 | ) | $ | 168 | ($ | 6,018 | ) | ($ | 4,540 | ) | ($ | 6,256 | ) | $ | 325 | ($ | 10,471 | ) | ||||||||||
| Investments |
(3,544 | ) | (1,832 | ) | 328 | (5,048 | ) | (6,033 | ) | 2,950 | (761 | ) | (3,844 | ) | ||||||||||||||||||
| Federal funds sold |
— | (1 | ) | — | (1 | ) | (454 | ) | 429 | (282 | ) | (307 | ) | |||||||||||||||||||
|
|
|
|
|
|
|
|
|
|
|
|
|
|
|
|
|
|||||||||||||||||
| Total |
(7,447 | ) | (4,116 | ) | 496 | (11,067 | ) | (11,027 | ) | (2,877 | ) | (718 | ) | (14,622 | ) | |||||||||||||||||
| Interest-bearing liabilities |
||||||||||||||||||||||||||||||||
| Deposits |
(8,032 | ) | (556 | ) | 136 | (8,452 | ) | (11,381 | ) | 464 | (106 | ) | (11,023 | ) | ||||||||||||||||||
| FHLB advances and debt |
(272 | ) | (1,130 | ) | 38 | (1,364 | ) | 443 | 233 | 16 | 692 | |||||||||||||||||||||
|
|
|
|
|
|
|
|
|
|
|
|
|
|
|
|
|
|||||||||||||||||
| Total |
(8,304 | ) | (1,686 | ) | 174 | (9,816 | ) | (10,938 | ) | 697 | (90 | ) | (10,331 | ) | ||||||||||||||||||
| Net change in net interest income (expense) |
$ | 857 | ($ | 2,430 | ) | $ | 322 | ($ | 1,251 | ) | ($ | 89 | ) | ($ | 3,574 | ) | ($ | 628 | ) | ($ | 4,291 | ) | ||||||||||
|
|
|
|
|
|
|
|
|
|
|
|
|
|
|
|
|
|||||||||||||||||
The following table sets forth the average yields earned on Parkvale’s interest-earning assets and the average rates paid on its interest-bearing liabilities for the periods indicated, the resulting average interest rate spreads, the net yield on interest-earning assets and the weighted average yields and rates at June 30, 2011:
| Year Ended June 30, | At June 30, | |||||||||||||||
| 2011 | 2010 | 2009 | 2011 | |||||||||||||
| Average yields on (1) |
||||||||||||||||
| Loans |
4.96 | % | 5.33 | % | 5.72 | % | 4.87 | % | ||||||||
| Investments (2) |
2.76 | % | 3.38 | % | 4.57 | % | 2.76 | % | ||||||||
| Federal funds sold |
0.25 | % | 0.25 | % | 0.74 | % | 0.25 | % | ||||||||
|
|
|
|
|
|
|
|
|
|||||||||
| All interest-earning assets |
3.86 | % | 4.27 | % | 5.13 | % | 3.81 | % | ||||||||
|
|
|
|
|
|
|
|
|
|||||||||
| Average rates paid on (1) |
||||||||||||||||
| Deposits |
1.28 | % | 1.81 | % | 2.57 | % | 1.22 | % | ||||||||
| FHLB advances and other borrowings |
4.76 | % | 4.88 | % | 4.68 | % | 4.73 | % | ||||||||
|
|
|
|
|
|
|
|
|
|||||||||
| All interest-bearing liabilities |
1.70 | % | 2.21 | % | 2.84 | % | 1.61 | % | ||||||||
|
|
|
|
|
|
|
|
|
|||||||||
| Average interest rate spread |
2.16 | % | 2.06 | % | 2.29 | % | 2.20 | % | ||||||||
|
|
|
|
|
|
|
|
|
|||||||||
| Net yield on interest-earning assets (3) |
2.15 | % | 2.10 | % | 2.36 | % | ||||||||||
|
|
|
|
|
|
|
|||||||||||
| (1) | Average yields and rates are calculated by dividing the interest income or expense for the period by the average daily balance for the year. The weighted averages at June 30, 2011 are based on the weighted average contractual interest rates. Nonaccrual loans are excluded in the average yield and balance calculations. |
| (2) | Includes held-to-maturity and available-for-sale investments, including mortgage-backed securities and interest-earning deposits in other banks. |
| (3) | Net interest income on a tax equivalent basis divided by average interest-earning assets. |
42
The following table presents the average balances of each category of interest-earning assets and interest-bearing liabilities for the periods indicated.
| Year Ended June 30 | ||||||||||||
| (Dollars in thousands) |
2011 | 2010 | 2009 | |||||||||
| Interest-earning assets |
||||||||||||
| Loans |
$ | 1,012,015 | $ | 1,054,840 | $ | 1,164,206 | ||||||
| Investments, including FHLB stock |
517,357 | 571,545 | 506,996 | |||||||||
| Federal funds sold |
150,264 | 150,610 | 92,633 | |||||||||
|
|
|
|
|
|
|
|||||||
| Total interest-earning assets |
1,679,636 | 1,776,995 | 1,763,835 | |||||||||
|
|
|
|
|
|
|
|||||||
| Noninterest-earning assets |
142,531 | 128,609 | 113,387 | |||||||||
|
|
|
|
|
|
|
|||||||
| Total assets |
$ | 1,822,167 | $ | 1,905,604 | $ | 1,877,222 | ||||||
| Interest-bearing liabilities |
||||||||||||
| Deposits |
$ | 1,484,829 | $ | 1,515,540 | $ | 1,497,467 | ||||||
| FHLB advances and other borrowings |
203,453 | 226,607 | 221,619 | |||||||||
|
|
|
|
|
|
|
|||||||
| Total interest-bearing liabilities |
1,688,282 | 1,742,147 | 1,719,086 | |||||||||
|
|
|
|
|
|
|
|||||||
| Noninterest-bearing liabilities |
(1,812 | ) | 12,101 | 9,559 | ||||||||
|
|
|
|
|
|
|
|||||||
| Total Liabilities |
1,686,470 | 1,754,248 | 1,728,645 | |||||||||
| Shareholders equity |
135,697 | 151,356 | 148,577 | |||||||||
|
|
|
|
|
|
|
|||||||
| Total liabilities and equity |
$ | 1,822,167 | $ | 1,905,604 | $ | 1,877,222 | ||||||
|
|
|
|
|
|
|
|||||||
| Net interest-earning assets |
($ | 8,646 | ) | $ | 34,848 | $ | 44,749 | |||||
|
|
|
|
|
|
|
|||||||
| Interest-earning assets as a % of interest-bearing liabilities |
99.5% | 102.0% | 102.6% | |||||||||
An excess of interest-earning assets over interest-bearing liabilities enhances a positive interest rate spread, while an excess of interest bearing liabilities has an adverse impact on our net interest income. During fiscal 2011, our average interest-bearing liabilities exceeded our average interest-earning assets by $8.6 million, as the average balances of our loans and investments decreased faster than the average balances of our deposits and borrowings. The decrease in average balances of our assets during fiscal 2011 is partially due to the non-cash debt security impairment charges recognized during the end of fiscal 2010, which had the effect of reducing average interest-earning asset balances during fiscal 2011. During fiscal 2010, our average interest-earning assets exceeded our average interest-bearing liabilities by $34.8 million.
Net Interest Income
Net interest income is the difference between interest earned on loans, investments and federal funds sold and interest paid for deposits and borrowings. A positive interest rate spread is enhanced when interest-earning assets exceed interest-bearing liabilities, which results in increased net interest income.
Net interest income decreased by $1.3 million or 3.3% from fiscal 2010 to fiscal 2011. The average net interest-earning assets decreased $43.5 million, offset by an increase in the average interest rate spread to 2.16% in fiscal 2011 from 2.06% in fiscal 2010. In fiscal 2010, net interest income decreased by $4.3 million or 10.3%. The average interest rate spread decreased to 2.06% in fiscal 2010 from 2.29% in fiscal 2009, and average net interest-earning assets decreased $9.9 million between the two years.
At June 30, 2011, the weighted average yield on loans, investments and federal funds sold was 3.81%. The average rate payable on liabilities was 1.22% for deposits, 4.73% for borrowings and 1.61% for combined deposits and borrowings.
Provision for Loan Losses
The provision for loan losses is the amount added to the allowance against which loan losses are charged. The provision for loan losses was $3.5 million in fiscal 2011, $7.4 million in fiscal 2010, and $6.8 million in fiscal 2009. The provision decreased by $3.9 million or 52.6% in fiscal 2011 compared to fiscal 2010. Aggregate allowances were
43
1.86% of gross loans as of June 30, 2011 compared to 1.83% at June 30, 2010. Management believes the allowance for loan losses is adequate to cover the amount of probable credit losses in the loan portfolio as of June 30, 2011. Parkvale’s nonperforming assets and allowance for loan losses are discussed earlier in this section. In addition, see “Critical Accounting Policies and Judgments — Allowance for Loan Losses.”
Noninterest Income
Total noninterest income increased by $36.1 million or 136.1% in fiscal 2011 due primarily to a $36.7 million decrease in non-cash debt security impairment charges to $2.3 million in fiscal 2011 compared to $39.0 million in fiscal 2010. Fee income derived from deposit accounts increased $350,000 or 5.4%, while other fees and service charges on loan accounts decreased $42,000 or 2.8%. The net gain on sale of assets decreased by $1.1 million or 44.5% in fiscal 2011. The fiscal 2011 writedowns were attributable to pooled trust preferred securities. The fiscal 2010 writedowns were attributable to pooled trust preferred and non-agency CMO securities. See Note J of “Notes to the Consolidated Financial Statements” for additional details. Total noninterest income decreased by $8.8 million or 49.9% in fiscal 2010, due primarily to an increase in non-cash debt security impairment charges from $30.4 million in fiscal 2009 to $39.0 million in fiscal 2010. Fee income derived from deposit accounts decreased $10,000, while other fees and service charges on loan accounts decreased $7,000 or less than 1% during fiscal 2010. The net gain on sale of assets during fiscal 2010 increased by $126,000 or 5.6%.
Other income increased by $202,000 or 9.5% in fiscal 2011, and decreased by $328,000 or 13.4% in fiscal 2010. The income on bank owned life insurance decreased by $32,000 in fiscal 2011 compared to a $2,000 decrease in fiscal 2010. Investment service fee income earned by Parkvale Financial Services investment representatives increased to $1.0 million in fiscal 2011 from $892,000 in fiscal 2010 and was $921,000 fiscal 2009.
Noninterest Expense
Total noninterest expense increased by $155,000 or 0.5% in fiscal 2011 and by $395,000 or 1.3% in fiscal 2010 over fiscal 2009.
Compensation and employee benefits decreased by $313,000 or 2.1% during fiscal 2011 and by $880,000 or 5.5% during fiscal 2010 compared to the respective prior periods. Stock compensation expense recognized for stock option grants was $50,000 in fiscal 2011 compared to $27,000 in fiscal 2010. The decrease in compensation expense during fiscal 2011 and fiscal 2010 is due primarily to a reduction in the amount of incentive compensation being accrued. Parkvale is not able to pay or accrue any cash bonuses to its five most highly compensated employees until the Series A Preferred Stock is redeemed, and other employee benefits have been reduced.
Office occupancy expense decreased by $225,000 or 5.0% in fiscal 2011 and by $91,000 or 2.0% in fiscal 2010 compared to the respective prior periods. The fiscal 2011 decrease relates to lower real estate taxes resulting from a successful property assessment appeal of the headquarters location and lower levels of depreciation. The 2010 decrease relates to lower levels of depreciation.
Marketing expense increased by $8,000 or 2.4% in fiscal 2011 and decreased by $121,000 or 26.2% in fiscal 2010 compared to the respective prior periods.
Deposits at the Bank are insured by the Federal Deposit Insurance Corporation (“FDIC”) through the Deposit Insurance Fund (“DIF”). FDIC insurance expense was $3.3 million, $3.4 million and $2.3 million during fiscal years 2011, 2010 and 2009, respectively. On February 7, 2011, the FDIC adopted a final rule, which redefined the deposit insurance assessment base as required by the Dodd-Frank Act and made changes to the assessment rates. The rule redefined the deposit insurance assessment base as average consolidated total assets minus average tangible equity; made changes to the unsecured debt and brokered deposit adjustments to assessment rates; created a depository institution debt adjustment; and adopted a new assessment rate schedule effective April 1, 2011, and in lieu of dividends, other rate schedules when the reserve ratio reaches certain levels. The FDIC has implemented a risk-based premium system that provides for quarterly assessments based on an insured institution’s ranking in one of four risk categories based upon supervisory and capital evaluations. Within its risk category, an institution is assigned to an initial base assessment rate which is then adjusted to determine its final assessment rate based on its brokered deposits, secured liabilities and unsecured debt. The base assessment rates range from five to thirty five basis points, with less risky
44
institutions paying lower assessments. The final rule, which was effective April 1, 2011, contributed to the $119,000 or 3.5% reduction to FDIC insurance expense during fiscal 2011. The Bank received a credit of $1.5 million in June 2007 that was utilized throughout fiscal 2008 and a portion of fiscal 2009 to offset FDIC premiums of $758,000 and $746,000, respectively. The credit balance was fully utilized by June 30, 2009. As a result of increased FDIC insurance premium rates and full utilization of the credit, FDIC insurance expense increased to $3.4 million during fiscal 2010 compared to $2.3 million during fiscal 2009.
Other expense increased by $840,000 or 14.5% in fiscal 2011 primarily due to higher levels of expense related to maintaining foreclosed real estate and legal costs associated with the collection of past due loans. Merger related expenses of $250,000 were recognized during fiscal 2011. The amortization expense of core deposit intangibles was $909,000 in fiscal years 2011, 2010 and 2009. Other expense increased by $386,000 or 7.2% in fiscal 2010 compared to fiscal 2009 due to higher levels of legal expense related to the collection of past due loans.
Income Taxes
Federal and state income tax expense increased by $13.7 million in fiscal 2011 due to an increase in pre-tax income compared to fiscal year 2010. In fiscal 2010, the federal and state tax benefit increased by $7.7 million due to an increase in the pre-tax loss during fiscal 2010 compared to fiscal 2009. The effective tax rate in fiscal 2011 is higher at 26.5% compared to the fiscal 2010 effective tax benefit rate of (39.1%), primarily due to pre-tax income for 2011 compared to a taxable loss in fiscal 2010. The effective tax benefit rate in fiscal 2009 is lower at (23.1%) than the federal statutory tax rate due to tax benefits resulting from the reversal of a $2.4 million tax valuation allowance related to equity securities writedowns. Tax benefits resulting from tax-exempt income on loans, investment and BOLI in the past three fiscal years also contribute to a lower effective tax rate compared to the 35.0% federal statutory tax rate.
Commitments
At June 30, 2011, Parkvale was committed under various agreements to originate fixed and adjustable-rate mortgage loans aggregating $2.1 million and $2.4 million, respectively, at rates ranging from 4.289% to 5.369% for fixed rate and 3.389% to 4.625% for adjustable-rate loans, and had $84.1 million of unused consumer lines of credit and $19.4 million in unused commercial lines of credit. At June 30, 2011, Parkvale was committed to fund commercial construction loans in process of $2.7 million and residential loans in process of $2.2 million. Parkvale was also committed to originate commercial loans totaling $7.9 million at June 30, 2011. Outstanding letters of credit totaled $6.8 million at June 30, 2011.
Liquidity and Capital Resources
Liquidity risk represents the inability to generate cash or otherwise obtain funds at reasonable rates to satisfy commitments to borrowers, as well as the obligations to depositors and debt holders. Parkvale uses its asset/liability management policy and contingency funding plan to control and manage liquidity risk.
Federal funds sold decreased $9.1 million or 6.7% from June 30, 2010 to June 30, 2011. Investment securities held to maturity increased $88.7 million or 20.0%, interest-earning deposits in other institutions increased $3.7 million or 457.2%, loans decreased $48.4 million or 4.7% from June 30, 2010 to June 30, 2011, and prepaid expenses and other assets decreased $7.8 million or 10.1%. Deposits decreased $3.1 million or 0.2% from June 30, 2010 to June 30, 2011, and advances from the Federal Home Loan Bank decreased $35.1 million or 18.9%. Parkvale Bank’s FHLB advance available maximum borrowing capacity was $760.4 million at June 30, 2011. If Parkvale were to experience a deposit decrease in excess of the available cash resources and cash equivalents, the FHLB borrowing capacity could be utilized to fund a rapid decrease in deposits. During the December 2008 quarter, Parkvale borrowed $25.0 million and issued $31.8 million of preferred stock. See the discussion below.
TARP Capital Purchase Program: On October 14, 2008, the United States Department of the Treasury (the “Treasury”) announced a voluntary Capital Purchase Program (the “CPP”) under which the Treasury will purchase senior preferred shares from qualifying financial institutions. The plan is part of the $700 billion Emergency Economic Stabilization Act signed into law in October 2008.
45
On December 23, 2008, pursuant to the CPP established by the Treasury, Parkvale entered into a Letter Agreement, which incorporates by reference the Securities Purchase Agreement — Standard Terms, with the Treasury (the “Agreement”), pursuant to which Parkvale issued and sold to the Treasury for an aggregate purchase price of $31,762,000 in cash (i) 31,762 shares of its Fixed Rate Cumulative Perpetual Preferred Stock, Series A, par value $1.00 per share, having a liquidation preference of $1,000 per share (the “Series A Preferred Stock”), and (ii) a ten-year warrant to purchase up to 376,327 shares of common stock, par value $1.00 per share, of Parkvale (“Common Stock”), at an initial exercise price of $12.66 per share, subject to certain anti-dilution and other adjustments (the “Warrant”).
The Series A Preferred Stock pays cumulative dividends at a rate of 5% per annum on the liquidation preference for the first five years, and thereafter at a rate of 9% per annum. The Series A Preferred Stock has no maturity date and ranks senior to the Common Stock (and pari passu with Parkvale’s other authorized shares of preferred stock, of which no shares are currently outstanding) with respect to the payment of dividends and distributions and amounts payable in the unlikely event of any future liquidation or dissolution of Parkvale. Parkvale may redeem the Series A Preferred Stock at a price of $1,000 per share plus accrued and unpaid dividends, subject to the concurrence of the Treasury and its federal banking regulators. Prior to December 23, 2011, unless the Corporation has redeemed the Series A Preferred Stock or the Treasury has transferred the Series A Preferred Stock to a third party, the consent of the Treasury will be required for the Corporation to increase its Common Stock dividend or repurchase its Common Stock or other equity or capital securities, other than in certain circumstances specified in the Agreement.
The Warrant is immediately exercisable. The Warrant provides for the adjustment of the exercise price and the number of shares of Common Stock issuable upon exercise pursuant to customary anti-dilution provisions, such as upon stock splits or distributions of securities or other assets to holders of Common Stock, and upon certain issuances of Common Stock at or below a specified price relative to the then-current market price of Common Stock. The Warrant expires ten years from the issuance date. Pursuant to the Agreement, the Treasury has agreed not to exercise voting power with respect to any shares of Common Stock issued upon exercise of the Warrant.
Term Debt: On December 30, 2008, PFC entered into a Loan Agreement with PNC Bank, National Association (“PNC”) for a term loan in the amount of $25.0 million (the “Loan”). The Loan pays interest at a rate equal to LIBOR plus three hundred and twenty five basis points, payable quarterly. Principal on the Loan is due and payable in fifteen consecutive quarterly payments of $625,000, commencing on March 31, 2010, with the remaining outstanding balance, which is scheduled to be $15,625,000, due and payable on December 31, 2013 (the “Maturity Date”). The outstanding balance due under the credit facility may be repaid, at any time, in whole or in part at PFC’s option. In connection with the Loan, PFC executed a Term Note, dated December 30, 2008, to evidence the Loan and a Pledge Agreement, dated December 30, 2008, whereby PFC granted PNC a security interest in the outstanding capital stock of Parkvale Savings Bank, the wholly owned subsidiary of PFC. The Loan Agreement contains customary and standard provisions regarding representations and warranties of PFC, covenants and events of default. If PFC has an event of default, the interest rate on the loan may increase by 2% during the period of default. As of June 30, 2011, we have met all of the financial covenants contained in the Loan Agreement.
On January 7, 2009, PFC entered into swap arrangements with PNC to convert portions of the LIBOR floating interest rates to fixed interest rates for three and five years. Under the swap agreements after the effects of the add-on of 325 basis points to LIBOR, $5.0 million matures on December 31, 2011 at a rate of 4.92% and an additional $15.0 million matures on December 31, 2013 at a rate of 5.41%.
In January 2009, PFC entered into interest rate swap contracts to modify the interest rate characteristics of designated debt instruments from variable to fixed in order to reduce the impact of changes in future cash flows due to interest rate changes. PFC hedged its exposure to the variability of future cash flows for all forecasted transactions for a maximum of three to five years for hedges converting an aggregate of $20.0 million in floating-rate debt to fixed. The fair value of these derivatives, totaling $539,000 at June 30, 2011, is reported as a contra account in other liabilities and offset in accumulated other comprehensive income for the effective portion of the derivatives. Ineffectiveness of these swaps, if any, is recognized immediately in earnings. The change in value of these derivatives was ($143,000) for fiscal 2011.
Interest rate swap contracts involve the risk of dealing with counterparties and their ability to meet contractual terms. When the fair value of a derivative instrument contract is positive, this generally indicates that the counter party or customer owes PFC, and results in credit risk to PFC. When the fair value of a derivative instrument contract is negative, PFC owes the customer or counterparty and therefore, has no credit risk.
46
The Board of Directors reduced the dividend from the rate of $0.05 per common share per quarter to $0.02 per common share per quarter during fiscal 2011. In doing so, the Board of Directors considered various factors, including the possibility of non-performing loans continuing to increase, the possibility of additional impairment charges on investment securities and goodwill, the capital needs of the Bank, PFC’s liquidity, and the level of dividends being paid by peer companies. If additional investment securities become other than temporarily impaired or if PFC’s goodwill is deemed impaired in a future quarter, impairment charges could have a material adverse effect on Parkvale’s capital and results of operations.
Shareholders’ equity increased $6.3 million or 5.4% at June 30, 2011 compared to June 30, 2010. Accumulated other comprehensive loss was $13.7 million at June 30, 2011. Dividends declared per common share in fiscal 2011 were $446,000 (equal to $0.02 per common share), representing 5.5% of net income for the fiscal year ended June 30, 2011. No treasury stock was purchased in fiscal 2011. The book value of Parkvale’s common stock increased 6.4% to $16.56 per share at June 30, 2011 from $15.57 per share at June 30, 2010.
The Bank is a wholly owned subsidiary of PFC. The Bank’s primary regulators are the FDIC and the Pennsylvania Department of Banking. PFC also is subject to regulation and oversight by the Federal Reserve Board. The Bank continues to maintain a “well capitalized” status, reporting a 6.63% Tier 1 capital level as of June 30, 2011 compared to 6.10% Tier 1 capital level at June 30, 2010. Adequate capitalization allows Parkvale to continue building shareholder value through traditionally conservative operations and potentially profitable growth opportunities. Management is not aware of any trends, events, uncertainties or recommendations by any regulatory authority that will have, or that are reasonably likely to have, material adverse effects on Parkvale’s liquidity, capital resources or operations. However, if additional provisions for loan losses or write-downs of investment securities become material in a weak economy, our net income and capital ratios would be adversely affected.
Critical Accounting Policies and Judgments
PFC’s consolidated financial statements are prepared based upon the application of certain accounting policies, the most significant of which are described in Note A of the “Notes to Consolidated Financial Statements - Significant Accounting Policies”. Certain policies require numerous estimates and strategic or economic assumptions that may prove to be inaccurate or subject to variations and may significantly affect Parkvale’s reported results and financial position in future periods. Changes in underlying factors, assumptions, or estimates in any of these areas could have a material impact on Parkvale’s future financial condition and results of operations.
Allowance for Loan Losses. The allowance for loan losses is established as losses are estimated to have occurred through a provision for loan losses charged to earnings. Loan losses are charged against the allowance when management believes the uncollectibility of a loan balance is confirmed. Subsequent recoveries, if any, are credited to the allowance.
The allowance for loan losses is evaluated on a regular basis by management and is based upon management’s periodic review of the collectability of the loans in light of historical experience, the nature and volume of the loan portfolio, adverse situations that may affect the borrower’s ability to repay, estimated value of any underlying collateral and prevailing economic conditions. This evaluation is inherently subjective as it requires estimates that are susceptible to significant revision as more information becomes available.
The allowance consists of allocated and general components. The allocated component relates to loans that are classified as impaired. For those loans that are classified as impaired, an allowance is established when the discounted cash flows (or collateral value or observable market price) of the impaired loan is lower than the carrying value of that loan. The general component covers nonclassified loans and is based on historical charge-off experience and expected loss derived from Parkvale’s internal risk rating process. Other adjustments may be made to the allowance for pools of loans after an assessment of internal or external influences on credit quality that are not fully reflected in the historical loss or risk rating data.
47
A loan is considered impaired when, based on current information and events, it is probable that Parkvale will be unable to collect the scheduled payments of principal or interest when due according to the contractual terms of the loan agreement. Factors considered by management in determining impairment include payment status, collateral value, and the probability of collecting scheduled principal and interest payments when due. Loans that experience insignificant payment delays and payment shortfalls generally are not classified as impaired. Management determines the significance of payment delays and payment shortfalls on a case-by-case basis, taking into consideration all of the circumstances surrounding the loan and the borrower, including the length of the delay, the reasons for the delay, the borrower’s prior payment record, and the amount of the shortfall in relation to the principal and interest owed. Impairment is measured on a loan by loan basis for commercial and construction loans by either the present value of expected future cash flows discounted at the loan’s effective interest rate, the loan’s obtainable market price, or the fair value of the collateral if the loan is collateral dependent.
Large groups of smaller balance homogeneous loans are collectively evaluated for impairment. Accordingly, Parkvale does not separately identify individual consumer and residential loans for impairment disclosures, unless such loans are the subject of a restructuring agreement due to financial difficulties of the borrower.
Securities — Held to Maturity, Available for Sale and Other Than Temporarily Impaired. Certain debt securities that management has the positive intent and ability to hold to maturity are classified as “held to maturity” and recorded at amortized cost. Trading securities are recorded at fair value with changes in fair value included in earnings. Securities not classified as held to maturity or trading, including equity securities with readily determinable fair values, are classified as “available for sale” and recorded at fair value, with unrealized gains and losses excluded from earnings and reported in other comprehensive income. Purchase premiums and discounts are recognized in interest income using the interest method over the terms of the securities. Gains and losses on the sale of securities are recorded on the trade date and are determined using the specific identification method.
The recent accounting guidance amends the recognition guidance for other-than-temporary impairments of debt securities and expands the financial statement disclosures for other-than-temporary impairment losses on debt and equity securities. The recent guidance replaced the “intent and ability” indication in current guidance by specifying that (a) if a company does not have the intent to sell a debt security prior to recovery and (b) it is more likely than not that it will not have to sell the debt security prior to recovery, the security would not be considered other-than-temporarily impaired unless there is a credit loss. When an entity does not intend to sell the security, and it is more likely than not the entity will not have to sell the security before recovery of its cost basis, it will recognize the credit component of an other-than-temporary impairment of a debt security in earnings and the remaining portion in other comprehensive income. For held-to-maturity debt securities, the amount of an other-than-temporary impairment recorded in other comprehensive income for the noncredit portion of a previous other-than-temporary impairment should be amortized prospectively over the remaining life of the security on the basis of the timing of future estimated cash flows of the security.
As a result of this guidance, Parkvale’s consolidated statement of operations as of June 30, 2011 reflects the full impairment (that is, the difference between the security’s amortized cost basis and fair value) on debt securities that Parkvale intends to sell or would more-likely-than-not be required to sell before the expected recovery of the amortized cost basis. For available-for-sale and held-to-maturity debt securities that management has no intent to sell and believes that it more-likely-than-not will not be required to sell prior to recovery, only the credit loss component of the impairment is recognized in earnings, while the non-credit loss is recognized in other comprehensive income, net of applicable taxes.
For equity securities, when Parkvale has decided to sell an impaired available-for-sale security and the entity does not expect the fair value of the security to fully recover before the expected time of sale, the security is deemed other-than-temporarily impaired in the period in which the decision to sell is made. Parkvale recognizes an impairment loss when the impairment is deemed other than temporary even if a decision to sell has not been made.
Foreclosed Real Estate. Real estate properties acquired through, or in lieu of, loan foreclosure are recorded at the lower of the carrying amount or fair value of the property less cost to sell. After foreclosure, management periodically performs valuations and a valuation allowance is established for declines in the fair value less cost to sell below the property’s carrying amount. Revenues, expenses and changes in the valuation allowance are included in the statement of
48
operations. Gains and losses upon disposition are reflected in earnings as realized. Foreclosed real estate at June 30, 2011 included eight commercial properties aggregating $3.7 million of commercial property and thirty six single-family properties aggregating $6.1 million.
Goodwill and Other Intangible Assets. At June 30, 2011, Parkvale has $2.0 million of core deposit intangible assets subject to amortization and $25.6 million in goodwill, which is not subject to periodic amortization. Parkvale determined the amount of identifiable intangible assets based upon independent core deposit analyses.
Goodwill arising from business acquisitions represents the value attributable to unidentifiable intangible elements in the business acquired. Parkvale’s goodwill relates to value inherent in the banking business, and the value is dependent upon Parkvale’s ability to provide quality, cost effective services in the face of competition from other market participants on a regional basis. This ability relies upon continuing investments in processing systems, the development of value-added service features, and the ease of use of Parkvale’s services. As such, goodwill value is supported ultimately by revenue, which is driven by the volume of business transacted. A decline in earnings as a result of a lack of growth or the inability to deliver cost effective services over sustained periods can lead to impairment of goodwill, which could result in a charge and adversely impact earnings in future periods. See Note A of Notes to Consolidated Financial Statements for additional information as of June 30, 2011.
Income Taxes. Income taxes are accounted for under the asset and liability method. Deferred tax assets and liabilities are recorded on the consolidated balance sheet for future tax consequences that arise from the difference between the financial statement and tax basis of assets and liabilities as measured by the enacted tax rates that will be in effect when these differences reverse. Changes in tax rates are recognized in the financial statements during the period they are enacted. When a deferred tax asset or liability, or a change thereto, is recorded on the consolidated balance sheet, deferred tax (benefit) or expense is recorded for GAAP purposes in the income tax (benefit) expense line of the consolidated statement of operations for purposes of determining the current period’s net income. The principal types of differences between assets and liabilities for financial statement and tax return purposes are net operating losses, allowance for loan and lease losses, deferred loan fees, deferred compensation and unrealized gains or losses on investment securities available for sale.
Deferred tax assets are recorded on the consolidated statement of financial condition at net realizable value. An assessment is performed each reporting period to evaluate the amount of deferred tax asset it is more likely than not to realize. Realization of deferred tax assets is dependent upon the amount of taxable income expected in future periods, as tax benefits require taxable income to be realized. If a valuation allowance is required, the deferred tax asset on the consolidated statement of financial condition is reduced via a corresponding income tax expense in the consolidated statement of operations.
Impact of Inflation and Changing Prices
The financial statements and related data presented herein have been prepared in accordance with accounting principles generally accepted in the United States, which require the measurement of financial position and operating results in terms of historical dollars without considering changes in the relative purchasing power of money over time due to inflation. Unlike most industrial companies, substantially all of the assets and liabilities of a financial institution are monetary in nature. As a result, interest rates have a more significant impact on a financial institution’s performance than the effects of general levels of inflation. Interest rates do not necessarily move in the same direction or in the same magnitude as the prices of goods and services as measured by the consumer price index.
Forward Looking Statements
Certain statements in this report are “forward-looking” within the meaning of the Private Securities Litigation Reform Act of 1995, which statements generally can be identified by the use of forward-looking terminology, such as “may,” “will,” “expect,” “estimate,” “anticipate,” “believe,” “target,” “plan,” “project” or “continue” or the negatives thereof or other variations thereon or similar terminology, and are made on the basis of management’s current plans and analyses of PFC, its business and the industry as a whole. These forward-looking statements are subject to risks and uncertainties, including, but not limited to, economic conditions, competition, interest rate sensitivity and exposure to regulatory and legislative changes. The above factors in some cases could affect PFC’s financial performance and could cause actual results to differ materially from those expressed or implied in such forward-looking statements. PFC does not undertake to update or revise its forward-looking statements even if experience or future changes make it clear that PFC will not realize any projected results expressed or implied therein.
49
Item 7a. Qualitative and Quantitative Disclosures About Market Risk.
The information called for by this item is provided in the Market Risk section of “Management’s Discussion and Analysis” of Financial Condition and Results of Operations, which is included in Item 7 of this Report.
50
Item 8. Financial Statements and Supplementary
Data.
Report of Independent Registered Public Accounting Firm
The Board of Directors and Shareholders of Parkvale Financial Corporation:
We have audited the accompanying consolidated statements of financial condition of Parkvale Financial Corporation and subsidiaries (the Company) as of June 30, 2011 and 2010, and the related consolidated statements of operations, cash flows, and shareholders’ equity for each of the years in the three-year period ended June 30, 2011. These consolidated financial statements are the responsibility of the Company’s management. Our responsibility is to express an opinion on these consolidated financial statements based on our audits.
We conducted our audits in accordance with the standards of the Public Company Accounting Oversight Board (United States). Those standards require that we plan and perform the audit to obtain reasonable assurance about whether the financial statements are free of material misstatement. An audit includes examining, on a test basis, evidence supporting the amounts and disclosures in the financial statements. An audit also includes assessing the accounting principles used and significant estimates made by management, as well as evaluating the overall financial statement presentation. We believe that our audits provide a reasonable basis for our opinion.
In our opinion, the consolidated financial statements referred to above present fairly, in all material respects, the financial position of Parkvale Financial Corporation and subsidiaries as of June 30, 2011 and 2010, and the results of their operations and their cash flows for each of the years in the three-year period ended June 30, 2011, in conformity with U.S. generally accepted accounting principles.
We also have audited, in accordance with the standards of the Public Company Accounting Oversight Board (United States), the Company’s internal control over financial reporting as of June 30, 2011, based on criteria established in Internal Control—Integrated Framework issued by the Committee of Sponsoring Organizations of the Treadway Commission (COSO), and our report dated September 27, 2011 expressed an adverse opinion on the effective operation of the Company’s internal control over financial reporting as of June 30, 2011.
| /s/ ParenteBeard LLC
ParenteBeard LLC Pittsburgh, Pennsylvania |
| September 27, 2011 |
51
PARKVALE FINANCIAL CORPORATION
CONSOLIDATED STATEMENTS OF FINANCIAL CONDITION
| (Dollar amounts in thousands, except share data) | ||||||||
| Assets |
2011 | 2010 | ||||||
| Cash and noninterest-earning deposits |
$ | 18,713 | $ | 17,736 | ||||
| Federal funds sold |
126,642 | 135,773 | ||||||
|
|
|
|
|
|||||
| Cash and cash equivalents |
145,355 | 153,509 | ||||||
| Interest-earning deposits in other banks |
4,463 | 801 | ||||||
| Investment securities available for sale at fair value (cost of $5,501 at June 30, 2011 and $65,778 at June 30, 2010) (Note B) |
5,245 | 65,770 | ||||||
| Investment securities held to maturity (fair value of $531,116 at June 30, 2011 and $437,931 at June 30, 2010) (Note B) |
532,189 | 443,452 | ||||||
| Federal Home Loan Bank Stock, at cost (Note A) |
12,310 | 14,357 | ||||||
| Loans, net of allowance of $18,626 at June 30, 2011 and $19,209 at June 30, 2010 (Note C) |
983,996 | 1,032,363 | ||||||
| Foreclosed real estate, net (Note D) |
9,764 | 8,637 | ||||||
| Office properties and equipment, net (Note D) |
16,862 | 17,374 | ||||||
| Goodwill (Note A) |
25,634 | 25,634 | ||||||
| Intangible assets and deferred charges (Note A) |
1,968 | 2,877 | ||||||
| Prepaid expenses and other assets (Note L) |
68,770 | 76,535 | ||||||
|
|
|
|
|
|||||
| Total assets |
$ | 1,806,556 | $ | 1,841,309 | ||||
|
|
|
|
|
|||||
| Liabilities and Shareholders’ Equity |
||||||||
| Liabilities |
||||||||
| Deposits (Note E) |
$ | 1,484,924 | $ | 1,488,073 | ||||
| Advances from Federal Home Loan Bank (Note F) |
150,857 | 185,973 | ||||||
| Other debt (Note F) |
12,518 | 13,865 | ||||||
| Term debt (Note F) |
21,250 | 23,750 | ||||||
| Advance payments from borrowers for taxes and insurance |
7,524 | 7,526 | ||||||
| Other liabilities (Note L) |
5,269 | 4,249 | ||||||
|
|
|
|
|
|||||
| Total liabilities |
1,682,342 | 1,723,436 | ||||||
|
|
|
|
|
|||||
| Shareholders’ Equity (Notes G and I) |
||||||||
| Preferred stock ($1.00 par value; 5,000,000 shares authorized; 31,762 shares issued) |
31,762 | 31,762 | ||||||
| Common stock ($1.00 par value; 10,000,000 shares authorized; 6,734,894 shares issued) |
6,735 | 6,735 | ||||||
| Additional paid-in capital |
2,151 | 2,734 | ||||||
| Treasury stock at cost — 1,152,048 shares at June 30, 2011 and 1,205,683 shares at June 30, 2010 |
(24,072 | ) | (25,193 | ) | ||||
| Accumulated other comprehensive loss |
(13,690 | ) | (13,413 | ) | ||||
| Retained earnings |
121,328 | 115,248 | ||||||
|
|
|
|
|
|||||
| Total shareholders’ equity |
124,214 | 117,873 | ||||||
|
|
|
|
|
|||||
| Total liabilities and shareholders’ equity |
$ | 1,806,556 | $ | 1,841,309 | ||||
|
|
|
|
|
|||||
See Notes to Consolidated Financial Statements.
52
PARKVALE FINANCIAL CORPORATION
CONSOLIDATED STATEMENTS OF OPERATIONS
| (Dollar amounts in thousands, except per share data) | 2011 | 2010 | 2009 | |||||||||
| Interest Income: |
||||||||||||
| Loans |
$ | 50,160 | $ | 56,178 | $ | 66,649 | ||||||
| Investments |
14,255 | 19,303 | 23,147 | |||||||||
| Federal funds sold |
379 | 380 | 687 | |||||||||
|
|
|
|
|
|
|
|||||||
| Total interest income |
64,794 | 75,861 | 90,483 | |||||||||
|
|
|
|
|
|
|
|||||||
| Interest Expense: |
||||||||||||
| Deposits (Note E) |
19,008 | 27,460 | 38,483 | |||||||||
| Borrowings |
9,691 | 11,055 | 10,363 | |||||||||
|
|
|
|
|
|
|
|||||||
| Total interest expense |
28,699 | 38,515 | 48,846 | |||||||||
|
|
|
|
|
|
|
|||||||
| Net interest income |
36,095 | 37,346 | 41,637 | |||||||||
| Provision for loan losses (Note C) |
3,531 | 7,448 | 6,754 | |||||||||
|
|
|
|
|
|
|
|||||||
| Net interest income after provision for loan losses |
32,564 | 29,898 | 34,883 | |||||||||
|
|
|
|
|
|
|
|||||||
| Noninterest Income: |
||||||||||||
| Other-than-temporary impairment losses (Note J) |
(4,471 | ) | (64,662 | ) | (31,629 | ) | ||||||
| Non-credit related losses recognized in other comprehensive income |
2,157 | 25,685 | 1,266 | |||||||||
|
|
|
|
|
|
|
|||||||
| Net impairment losses recognized in earnings |
(2,314 | ) | (38,977 | ) | (30,363 | ) | ||||||
| Service charges on deposit accounts |
6,798 | 6,448 | 6,458 | |||||||||
| Other service charges and fees |
1,464 | 1,506 | 1,513 | |||||||||
| Net gain on sale of assets (Note J) |
1,317 | 2,372 | 2,246 | |||||||||
| Other |
2,319 | 2,117 | 2,445 | |||||||||
|
|
|
|
|
|
|
|||||||
| Total noninterest income |
9,584 | (26,534 | ) | (17,701 | ) | |||||||
|
|
|
|
|
|
|
|||||||
| Noninterest Expense: |
||||||||||||
| Compensation and employee benefits |
14,720 | 15,033 | 15,913 | |||||||||
| Office occupancy |
4,283 | 4,508 | 4,599 | |||||||||
| Marketing |
348 | 340 | 461 | |||||||||
| FDIC insurance |
3,261 | 3,380 | 2,288 | |||||||||
| Office supplies, telephone and postage |
1,875 | 1,911 | 1,902 | |||||||||
| Other |
6,616 | 5,776 | 5,390 | |||||||||
|
|
|
|
|
|
|
|||||||
| Total noninterest expense |
31,103 | 30,948 | 30,553 | |||||||||
|
|
|
|
|
|
|
|||||||
| Income (loss) before income tax expense |
11,045 | (27,584 | ) | (13,371 | ) | |||||||
| Income tax expense (benefit) (Note H) |
2,931 | (10,784 | ) | (3,093 | ) | |||||||
|
|
|
|
|
|
|
|||||||
| Net income (loss) |
$ | 8,114 | ($ | 16,800 | ) | ($ | 10,278 | ) | ||||
| Preferred Stock Dividend |
1,588 | 1,588 | 829 | |||||||||
|
|
|
|
|
|
|
|||||||
| Income (loss) to common stockholders |
$ | 6,526 | ($ | 18,388 | ) | ($ | 11,107 | ) | ||||
|
|
|
|
|
|
|
|||||||
| Net income (loss) per share: |
||||||||||||
| Basic |
$ | 1.17 | ($ | 3.36 | ) | ($ | 2.04 | ) | ||||
| Diluted |
$ | 1.17 | ($ | 3.36 | ) | ($ | 2.04 | ) | ||||
See Notes to Consolidated Financial Statements.
53
PARKVALE FINANCIAL CORPORATION
CONSOLIDATED STATEMENTS OF CASH FLOWS
| Years ended June 30, | ||||||||||||
| (Dollar amounts in thousands) |
2011 | 2010 | 2009 | |||||||||
| Cash flows from operating activities: |
||||||||||||
| Interest received |
$ | 65,762 | $ | 75,279 | $ | 88,425 | ||||||
| Loan fees received |
491 | 545 | 672 | |||||||||
| Disbursements of student loans |
— | — | (30 | ) | ||||||||
| Proceeds from sales of student loans |
— | — | 365 | |||||||||
| Other fees and commissions received |
9,513 | 8,971 | 9,313 | |||||||||
| Interest paid |
(28,876 | ) | (38,706 | ) | (49,073 | ) | ||||||
| Cash paid to suppliers and employees |
(23,142 | ) | (38,154 | ) | (28,757 | ) | ||||||
| Income taxes refund (paid) |
3,643 | (1,720 | ) | (4,300 | ) | |||||||
|
|
|
|
|
|
|
|||||||
| Net cash provided by operating activities |
27,391 | 6,215 | 16,615 | |||||||||
| Cash flows from investing activities: |
||||||||||||
| Proceeds from sales of investment securities available for sale |
52,416 | 2,381 | 3,012 | |||||||||
| Proceeds from maturities of investments |
261,651 | 376,195 | 178,175 | |||||||||
| Purchase of investment securities available for sale |
— | (532 | ) | — | ||||||||
| Purchase of investment securities held to maturity |
(345,602 | ) | (431,824 | ) | (284,640 | ) | ||||||
| (Purchase) maturity of deposits in other banks |
(3,662 | ) | 3,098 | 3,353 | ||||||||
| Purchase of loans |
(10,722 | ) | (6,270 | ) | — | |||||||
| Principal collected on loans |
270,318 | 242,077 | 234,634 | |||||||||
| Loan sales |
— | 7,527 | 16,237 | |||||||||
| Loans made to customers, net of loans in process |
(215,954 | ) | (177,290 | ) | (167,949 | ) | ||||||
| Capital expenditures, net of proceeds from sales of capital assets |
(347 | ) | (300 | ) | (316 | ) | ||||||
|
|
|
|
|
|
|
|||||||
| Net cash provided by (used in) investing activities |
8,098 | 15,062 | (17,494 | ) | ||||||||
| Cash flows from financing activities: |
||||||||||||
| Net increase in checking and savings accounts |
47,278 | 67,900 | 19,799 | |||||||||
| Net (decrease) in certificates of deposit |
(50,426 | ) | (91,076 | ) | (2,235 | ) | ||||||
| Repayment of FHLB advances |
(35,019 | ) | (25 | ) | (5,024 | ) | ||||||
| Net (decrease) in other borrowings |
(1,347 | ) | (7,396 | ) | (705 | ) | ||||||
| Repayment of term debt |
(2,500 | ) | (1,250 | ) | — | |||||||
| Proceeds from term debt |
— | — | 25,000 | |||||||||
| Net (decrease) increase in borrowers advances for tax and insurance |
(2 | ) | 167 | (396 | ) | |||||||
| Proceeds from issuance of preferred stock |
— | — | 31,762 | |||||||||
| Dividends paid |
(2,199 | ) | (2,682 | ) | (5,427 | ) | ||||||
| Contribution to benefit plans |
572 | 703 | — | |||||||||
| Payment for treasury stock |
— | — | (717 | ) | ||||||||
| Proceeds from exercise of stock options |
— | — | 21 | |||||||||
|
|
|
|
|
|
|
|||||||
| Net cash (used in) provided by financing activities |
(43,643 | ) | (33,659 | ) | 62,078 | |||||||
|
|
|
|
|
|
|
|||||||
| Net (decrease) increase in cash and cash equivalents |
(8,154 | ) | (12,382 | ) | 61,199 | |||||||
| Cash and cash equivalents at beginning of year |
153,509 | 165,891 | 104,692 | |||||||||
|
|
|
|
|
|
|
|||||||
| Cash and cash equivalents at end of year |
$ | 145,355 | $ | 153,509 | $ | 165,891 | ||||||
|
|
|
|
|
|
|
|||||||
| Reconciliation of net income (loss) to net cash provided by operating activities: |
||||||||||||
| Net income (loss) |
$ | 8,114 | ($ | 16,800 | ) | ($ | 10,278 | ) | ||||
| Adjustments to reconcile net income (loss) to net cash provided by operating activities: |
||||||||||||
| Depreciation and amortization |
1,768 | 1,907 | 2,004 | |||||||||
| Accretion and amortization of fees and discounts |
845 | (1,526 | ) | (2,675 | ) | |||||||
| Loan fees collected and deferred |
65 | 152 | 105 | |||||||||
| Provision for loan losses |
3,531 | 7,448 | 6,754 | |||||||||
| Net loss on sale and writedown of securities |
997 | 36,605 | 28,117 | |||||||||
| (Decrease) increase in accrued interest receivable |
(54 | ) | 820 | 634 | ||||||||
| Increase (decrease) in other assets |
7,819 | (30,445 | ) | (6,261 | ) | |||||||
| (Decrease) increase in accrued interest payable |
(56 | ) | 37 | (34 | ) | |||||||
| Increase (decrease) in other liabilities |
4,362 | 8,017 | (1,751 | ) | ||||||||
|
|
|
|
|
|
|
|||||||
| Total adjustments |
19,277 | 23,015 | 26,893 | |||||||||
|
|
|
|
|
|
|
|||||||
| Net cash provided by operating activities |
$ | 27,391 | $ | 6,215 | $ | 16,615 | ||||||
|
|
|
|
|
|
|
|||||||
See Notes to Consolidated Financial Statements.
54
PARKVALE FINANCIAL CORPORATION
CONSOLIDATED STATEMENTS OF SHAREHOLDERS’ EQUITY
| (Dollar amounts in thousands) | Preferred Stock |
Common Stock |
Additional Paid-In Capital |
Treasury Stock |
Accumulated Other Comprehensive (Loss) Income |
Retained Earnings |
Total Shareholders’ Equity |
|||||||||||||||||||||
| Balance at July 1, 2008 |
$ | — | $ | 6,735 | $ | 4,026 | ($ | 26,618 | ) | ($ | 2,222 | ) | $ | 149,710 | $ | 131,631 | ||||||||||||
|
|
|
|
|
|
|
|
|
|
|
|
|
|
|
|||||||||||||||
| 2009 net (loss) |
(10,278 | ) | (10,278 | ) | ||||||||||||||||||||||||
| Accumulated other comprehensive income: |
||||||||||||||||||||||||||||
| Change in swap liability |
326 | |||||||||||||||||||||||||||
| Change in unrealized gain (loss) on securities, net of deferred tax expense of ($1,976) |
(3,437 | ) | ||||||||||||||||||||||||||
| Reclassification adjustment, net of taxes of $3,060 |
5,323 | 2,212 | ||||||||||||||||||||||||||
|
|
|
|||||||||||||||||||||||||||
| Comprehensive (loss) |
(8,066 | ) | ||||||||||||||||||||||||||
| Issuance of Preferred Stock |
$ | 31,762 | 31,762 | |||||||||||||||||||||||||
| Treasury stock purchased |
(717 | ) | (717 | ) | ||||||||||||||||||||||||
| Recognition of stock option compensation expense |
90 | 90 | ||||||||||||||||||||||||||
| Exercise of stock options |
— | 21 | 21 | |||||||||||||||||||||||||
| Cash dividends declared on 5% preferred stock |
(829 | ) | (829 | ) | ||||||||||||||||||||||||
| Cash dividends declared on common stock at $0.71 per share |
(3,868 | ) | (3,868 | ) | ||||||||||||||||||||||||
|
|
|
|
|
|
|
|
|
|
|
|
|
|
|
|||||||||||||||
| Balance at June 30, 2009 |
$ | 31,762 | $ | 6,735 | $ | 4,116 | ($ | 27,314 | ) | ($ | 10 | ) | $ | 134,735 | $ | 150,024 | ||||||||||||
|
|
|
|
|
|
|
|
|
|
|
|
|
|
|
|||||||||||||||
| 2010 net (loss) |
(16,800 | ) | (16,800 | ) | ||||||||||||||||||||||||
| Accumulated other comprehensive income: |
||||||||||||||||||||||||||||
| Change in swap liability |
(819 | ) | ||||||||||||||||||||||||||
| Change in unrealized gain (loss) on securities, net of deferred tax expense of $6,769 |
10,660 | |||||||||||||||||||||||||||
| Reclassification adjustment, net of taxes of ($13,361) |
(23,244 | ) | (13,403 | ) | ||||||||||||||||||||||||
|
|
|
|||||||||||||||||||||||||||
| Comprehensive (loss) |
(30,203 | ) | ||||||||||||||||||||||||||
| Recognition of stock option compensation expense |
27 | 27 | ||||||||||||||||||||||||||
| Allocation of treasury stock to retirement plans |
(1,409 | ) | 2,121 | 712 | ||||||||||||||||||||||||
| Cash dividends declared on 5% preferred stock |
(1,588 | ) | (1,588 | ) | ||||||||||||||||||||||||
| Cash dividends declared on common stock at $0.20 per share |
(1,099 | ) | (1,099 | ) | ||||||||||||||||||||||||
|
|
|
|
|
|
|
|
|
|
|
|
|
|
|
|||||||||||||||
| Balance at June 30, 2010 |
$ | 31,762 | $ | 6,735 | $ | 2,734 | ($ | 25,193 | ) | ($ | 13,413 | ) | $ | 115,248 | $ | 117,873 | ||||||||||||
|
|
|
|
|
|
|
|
|
|
|
|
|
|
|
|||||||||||||||
| 2011 net income |
8,114 | 8,114 | ||||||||||||||||||||||||||
| Change in Equity Swap |
(143 | ) | ||||||||||||||||||||||||||
| Change in unrealized gain on securities, net of deferred tax expense of $200 |
572 | |||||||||||||||||||||||||||
| Reclassification adjustment, net of taxes of ($380) |
(706 | ) | (277 | ) | ||||||||||||||||||||||||
|
|
|
|||||||||||||||||||||||||||
| Comprehensive income |
7,837 | |||||||||||||||||||||||||||
| Recognition of stock option compensation expense |
50 | 50 | ||||||||||||||||||||||||||
| Allocation of treasury stock to retirement plans |
(633 | ) | 1,121 | 488 | ||||||||||||||||||||||||
| Cash dividends declared on 5% preferred stock |
(1,588 | ) | (1,588 | ) | ||||||||||||||||||||||||
| Cash dividends declared on common stock at $0.08 per share |
(446 | ) | (446 | ) | ||||||||||||||||||||||||
|
|
|
|
|
|
|
|
|
|
|
|
|
|
|
|||||||||||||||
| Balance at June 30, 2011 |
$ | 31,762 | $ | 6,735 | $ | 2,151 | ($ | 24,072 | ) | ($ | 13,690 | ) | $ | 121,328 | $ | 124,214 | ||||||||||||
|
|
|
|
|
|
|
|
|
|
|
|
|
|
|
|||||||||||||||
See Notes to Consolidated Financial Statements.
55
Notes to Consolidated Financial Statements
Note A — Significant Accounting Policies
(Dollar amounts in thousands, except per share data)
Principles of Consolidation
The accompanying consolidated financial statements include the accounts of Parkvale Financial Corporation (“PFC”or the “Corporation”), its wholly owned subsidiary, Parkvale Savings Bank (the “Bank”) and its wholly owned subsidiaries. PFC and the Bank are collectively referred to as “Parkvale”. All significant intercompany transactions and balances have been eliminated in consolidation.
Business
The primary business of Parkvale consists of attracting deposits from the general public in the communities that it serves and investing such deposits, together with other funds, in residential real estate loans, consumer loans, commercial loans and investment securities. Parkvale focuses on providing a wide range of consumer and commercial services to individuals, partnerships and corporations in the tri-state area, which comprises its primary market area. Parkvale is subject to the regulations of certain federal and state agencies and undergoes periodic examinations by certain regulatory authorities.
56
Notes to Consolidated Financial Statements — (Continued)
Revenue Recognition
Income on loans and investments is recognized as earned on the accrual method. Service charges and fees on loans and deposit accounts are recognized at the time the customer account is charged.
Operating Segments
An operating segment is defined as a component of an enterprise that engages in business activities, which generates revenue and incurs expense, and with the operating results reviewed by management. Parkvale’s business activities are currently confined to one operating segment, which is community banking.
Use of Estimates
The preparation of consolidated financial statements in conformity with accounting principles generally accepted in the United States requires management to make estimates and assumptions that affect the reported amounts of assets and liabilities and disclosures of contingent assets and liabilities at the date of the financial statements and the reported amounts of income and expense during the reported period. Actual results could differ from those estimates. Material estimates that are particularly susceptible to significant change in the near term relate to the determination of the allowance for loan losses, securities (held to maturity, available for sale and other than temporarily impaired), foreclosed real estate, goodwill and intangible assets and income taxes, including valuation of deferred tax assets.
Reclassification
Certain amounts in the 2010 and 2009 consolidated financial statements have been reclassified to conform to the 2011 presentation.
Subsequent Events
The Corporation evaluated and disclosed all material subsequent events that provide evidence about conditions that existed as of June 30, 2011.
Cash and Noninterest-Earning Deposits
The Bank is required to maintain cash and reserve balances with the Federal Reserve Bank. The reserve calculation is currently 0% of the first $10,700 of checking deposits, 3% of the next $48,100 of checking deposits and 10% of total checking deposits over $58,800. These required reserves, net of allowable credits, amounted to $6,119 at June 30, 2011. Such reserves are generally maintained with vault cash and to a lesser extent balances with the Federal Reserve.
Securities — Held to Maturity, Available for Sale and Other than Temporary Impairment
Certain debt securities that management has the positive intent and ability to hold to maturity are classified as “held to maturity” and recorded at amortized cost. Trading securities are recorded at fair value with changes in fair value included in earnings. Securities not classified as held to maturity or trading, including equity securities with readily determinable fair values, are classified as “available for sale” and recorded at fair value, with unrealized gains and losses excluded from earnings and reported in other comprehensive income. Purchase premiums and discounts are recognized in interest income using the interest method over the terms of the securities. Gains and losses on the sale of securities are recorded on the trade date and are determined using the specific identification method.
57
Notes to Consolidated Financial Statements — (Continued)
The recent accounting guidance amends the recognition guidance for other-than-temporary impairments of debt securities and expands the financial statement disclosures for other-than-temporary impairment losses on debt and equity securities. The recent guidance replaced the “intent and ability” indication in current guidance by specifying that (a) if a company does not have the intent to sell a debt security prior to recovery and (b) it is more likely than not that it will not have to sell the debt security prior to recovery, the security would not be considered other-than-temporarily impaired unless there is a credit loss. When an entity does not intend to sell the security, and it is more likely than not, the entity will not have to sell the security before recovery of its cost basis, it will recognize the credit component of an other-than-temporary impairment of a debt security in earnings and the remaining portion in other comprehensive income. For held-to-maturity debt securities, the amount of an other-than-temporary impairment recorded in other comprehensive income for the noncredit portion of a previous other-than-temporary impairment should be amortized prospectively over the remaining life of the security on the basis of the timing of future estimated cash flows of the security.
As a result of this guidance, Parkvale’s consolidated statement of operations as of June 30, 2011 reflects the full impairment (that is, the difference between the security’s amortized cost basis and fair value) on debt securities that Parkvale intends to sell or would more-likely-than-not be required to sell before the expected recovery of the amortized cost basis. For available-for-sale and held-to-maturity debt securities that management has no intent to sell and believes that it more-likely-than-not will not be required to sell prior to recovery, only the credit loss component of the impairment is recognized in earnings, while the non-credit loss is recognized in other comprehensive income, net of applicable taxes.
For equity securities, when Parkvale has decided to sell an impaired available-for-sale security and the entity does not expect the fair value of the security to fully recover before the expected time of sale, the security is deemed other-than-temporarily impaired in the period in which the decision to sell is made. Parkvale recognizes an impairment loss when the impairment is deemed other-than-temporary even if a decision to sell has not been made.
Federal Home Loan Bank Stock
Parkvale, as a member of the Federal Home Loan Bank (FHLB) system, is required to maintain an investment in capital stock of the FHLB. Based on redemption provisions of the FHLB, the stock has no quoted market value and is carried at cost. In December 2008, the FHLB declared a moratorium on the redemption of its stock. At its discretion, the FHLB may declare dividends on the stock. However, since 2009 the FHLB suspended its dividend. Management reviews for impairment based on the ultimate recoverability of the cost basis in the FHLB stock.
Members do not purchase stock in the FHLB for the same reasons that traditional equity investors acquire stock in an investor-owned enterprise. Rather, members purchase stock to obtain access to the low-cost products and services offered by the FHLB. Unlike equity securities of traditional for-profit enterprises, the stock of the FHLB does not provide its holders with an opportunity for capital appreciation because, by regulation, FHLB stock can only be purchased, redeemed and transferred at par value.
At June 30, 2011 and June 30, 2010, the Bank’s FHLB stock totaled $12,310 and $14,357, respectively. The Bank accounts for the stock based on U.S. GAAP, which requires the investment to be carried at cost and evaluated for impairment based on the ultimate recoverability of the par value.
58
Notes to Consolidated Financial Statements — (Continued)
The Bank periodically evaluates its FHLB investment for possible impairment based on, among other things, the capital adequacy of the FHLB and its overall financial condition. The FHLB exceeds all regulatory capital requirements established by the Federal Housing Finance Agency, the regulator of the FHLB. Failure by the FHLB to meet this regulatory capital requirement would require an in-depth analysis of other factors including:
| • | the member’s ability to access liquidity from the FHLB; |
| • | the member’s funding cost advantage with the FHLB compared to alternative sources of funds; |
| • | a decline in the market value of the FHLB’s net assets relative to book value which may or may not affect future financial performance or cash flow; |
| • | the FHLB’s ability to obtain credit and source liquidity, for which one indicator is the credit rating of the FHLB; |
| • | the FHLB’s commitment to make payments taking into account its ability to meet statutory and regulatory payment obligations and the level of such payments in relation to the FHLB’s operating performance; and |
| • | the prospects of amendments to laws that affect the rights and obligations of the FHLB. |
The Bank believes its holdings in the stock are ultimately recoverable at par value at June 30, 2011 and, therefore, determined that FHLB stock was not other-than-temporarily impaired. In addition, the Bank has ample liquidity and does not require redemption of its FHLB stock in the foreseeable future.
Loans
Parkvale grants mortgage, commercial and consumer loans to customers. The ability of Parkvale’s debtors to honor their contracts is largely dependent upon the real estate and general economic conditions in the tri-state area.
Loans that management has the intent and ability to hold for the foreseeable future or until maturity or pay-off generally are reported at their outstanding unpaid principal balances adjusted for unearned income, the allowance for loan losses, and any unamortized deferred fees or costs on originated loans, and premiums or discounts on purchased loans.
The loans receivable portfolio is segmented into mortgage loans, consumer loans and commercial business loans. The mortgage loan segment has two classes, 1-4 family first lien residential mortgage loans and commercial mortgage loans, which are comprised of commercial real estate, multi-family and acquisition and development loans. The consumer loan segment consists of three classes, home equity loans, automobile loans and other loans. The commercial business loan segment consists of one class, commercial and industrial loans.
Portfolio Risk Characteristics:
A loan is considered impaired when, based on current information and events, it is probable that the Corporation will be unable to collect the scheduled payments of principal or interest when due according to the contractual terms of the loan agreement. Factors considered by management in determining impairment include payment status, collateral value and the probability of collecting scheduled principal and interest payments when due. Loans that experience insignificant payment delays and payment shortfalls generally are not classified as impaired. Management determines the significance of payment delays and payment shortfalls on a case-by-case basis, taking into consideration all of the known circumstances surrounding the loan and the borrower, including the length of the delay, the reasons for the delay, the borrower’s prior payment record and the amount of the shortfall in relation to the principal and interest owed. Impairment is measured on a loan by loan basis for commercial business loans and commercial mortgage loans by either the present value of expected future cash flows discounted at the loan’s effective interest rate or the fair value of the collateral if the loan is collateral dependent.
An allowance for loan losses is established for an impaired loan if its carrying value exceeds its estimated fair value. The estimated fair values of substantially all of the Corporation’s impaired loans are measured based on the estimated fair value of the loan’s collateral.
59
Notes to Consolidated Financial Statements — (Continued)
For commercial loans secured by real estate, estimated fair values are determined primarily through third-party appraisals. When a real estate secured loan becomes impaired, a decision is made regarding whether an updated certified appraisal of the real estate is necessary. This decision is based on various considerations, including the age of the most recent appraisal, the loan-to-value ratio based on the original appraisal and the condition of the property. Appraised values are discounted to arrive at the estimated selling price of the collateral, which is considered to be the estimated fair value. The discounts also include estimated costs to sell the property.
For commercial business loans secured by non-real estate collateral, such as accounts receivable, inventory and equipment, estimated fair values are determined based on the borrower’s financial statements, inventory reports, accounts receivable agings or equipment appraisals or invoices. Indications of value from these sources are generally discounted based on the age of the financial information or the quality of the assets.
Large groups of smaller balance homogeneous loans are collectively evaluated for impairment. Accordingly, the Corporation does not separately identify individual 1-4 family mortgage loans or consumer loans for impairment disclosures, unless such loans are the subject of a troubled debt restructuring agreement.
Loans whose terms are modified are classified as troubled debt restructurings if the Corporation grants such borrowers concessions and it is deemed that those borrowers are experiencing financial difficulty. Concessions granted under a troubled debt restructuring generally involve a temporary reduction in interest rate or an extension of a loan’s stated maturity date. Non-accrual troubled debt restructurings are restored to accrual status if a pattern of consistent principal and interest payments under the modified terms is demonstrated after modification. Loans classified as troubled debt restructurings are designated as impaired.
The 1-4 family loans include residential first mortgage loans originated by Parkvale Bank in the greater Pittsburgh Metropolitan area, which comprises its primary market area, and loans purchased from other financial institutions in the secondary market, which are geographically diversified. We currently originate fixed-rate, fully amortizing mortgage loans with maturities of 15 to 30 years. We also offer adjustable rate mortgage (“ARM”) loans where the interest rate either adjusts on an annual basis or is fixed for the initial one, three or five years and then adjusts annually. We underwrite 1 to 4 family residential mortgage loans with loan-to-value ratios of up to 95%, generally provided that the borrower obtains private mortgage insurance on loans that exceed 80% of the appraised value or sales price, whichever is less, of the secured property. We also require that title insurance, hazard insurance and, if appropriate, flood insurance be maintained on all properties securing real estate loans. We require that a licensed appraiser from our list of approved appraisers perform and submit to us an appraisal on all properties secured by a first mortgage on 1 to 4 family first mortgage loans. In underwriting 1-4 family residential mortgage loans, the Corporation evaluates both the borrower’s ability to make monthly payments and the value of the property securing the loan. Real estate loans originated by the Corporation generally contain a “due upon sale” clause allowing the Corporation to declare the unpaid principal balance due and payable upon the sale of the property. The Corporation has not engaged in sub-prime residential mortgage loan originations. Our single-family residential mortgage loans generally are underwritten on terms and documentation conforming to guidelines issued by Freddie Mac. All of Parkvale’s lending activities, including loan purchases, are subject to written underwriting standards and loan origination procedures approved by the Board of Directors.
Commercial mortgage loans include commercial real estate, multi-family and other loans that are secured by non-farm nonresidential properties. Commercial and multi-family real estate loans generally present a higher level of risk than loans secured by 1-4 family residences. This greater risk is due to several factors, including the concentration of principal in a limited number of loans and borrowers, the effect of general economic conditions on income producing properties and the increased difficulty of evaluating and monitoring these types of loans. Furthermore, the repayment of loans secured by commercial and multi-family real estate is typically dependent upon the successful operation of the related real estate project. If the cash flow from the project is reduced (for example, if leases are not obtained or renewed, or a bankruptcy court modifies a lease term, or a major tenant is unable to fulfill its lease obligations), the borrower’s ability to repay the loan may be impaired.
60
Notes to Consolidated Financial Statements — (Continued)
Consumer loans include home equity loans secured by first or second liens on residential property, automobile loans and other unsecured consumer loans. The Corporation currently originates most of its consumer loans in its primary market area and surrounding areas. The Corporation originates consumer loans primarily on a direct basis. Consumer loans generally have higher interest rates and shorter terms than residential mortgage loans; however, they have additional credit risk due to the type of collateral securing the loan.
Consumer loans may entail greater credit risk than do residential mortgage loans, particularly in the case of consumer loans secured by rapidly depreciable assets, such as automobiles. In such cases, any repossessed collateral for a defaulted consumer loan may not provide an adequate source of repayment of the outstanding loan balance as a result of the greater likelihood of damage, loss or depreciation. In addition, consumer loan collections are dependent on the borrower’s continuing financial stability, and thus are more likely to be affected by adverse personal circumstances. Furthermore, the application of various federal and state laws, including bankruptcy and insolvency laws, may limit the amount that can be recovered on such loans.
Commercial business loans are primarily short term facilities extended to small businesses and professionals located within the communities served by Parkvale, and are generally secured by business assets of the borrower. The commercial business loans that we originated may be either a revolving line of credit or for a fixed term of generally 10 years or less. Interest rates are adjustable, indexed to a published prime rate of interest, or fixed. Generally, equipment, machinery, real property or other corporate assets secure such loans. Personal guarantees from the business principals are generally obtained as additional collateral.
For loans amortized at cost, interest income is accrued based on the unpaid principal balance. Loan origination fees, net of certain direct origination costs, as well as premiums and discounts, are deferred and amortized as a level yield adjustment over the respective term of the loan.
The accrual of interest on mortgage and commercial loans is discontinued at the time the loan is 90 days past due unless the credit is well-secured and in process of collection. Credit card loans and other personal loans are typically charged off no later than 180 days past due. Past due status is based on contractual terms of the loan. In all cases, loans are placed on nonaccrual or charged-off at an earlier date if collection of principal or interest is considered doubtful.
All interest accrued but not collected for loans that are placed on nonaccrual or charged off is reversed against interest income. The interest on these loans is accounted for on the cash-basis or cost-recovery method, until qualifying for return to accrual. Loans are returned to accrual status when all the principal and interest amounts contractually due are brought current and future payments are reasonably assured.
Allowance for Loan Losses
The allowance for loan losses is established as losses are estimated to have occurred through a provision for loan losses charged to earnings. Loan losses are charged against the allowance when management believes the uncollectibility of a loan balance is confirmed. Subsequent recoveries, if any, are credited to the allowance.
The allowance for loan losses is evaluated on a regular basis by management and is based upon management’s periodic review of the collectability of the loans in light of historical experience, the nature and volume of the loan portfolio, adverse situations that may affect the borrower’s ability to repay and estimated value of any underlying collateral and prevailing economic conditions. This evaluation is inherently subjective as it requires estimates that are susceptible to significant revision as more information becomes available.
The allowance consists of allocated and general components. The allocated component relates to loans that are classified as impaired. For those loans that are classified as impaired, an allowance is established when the discounted cash flows (or collateral value or observable market price) of the impaired loan is lower than the carrying value of that loan. The general component covers nonclassified loans and is based on historical charge-off experience and expected loss derived from Parkvale’s internal risk rating process. Other adjustments may be made to the allowance for pools of loans after an assessment of internal or external influences on credit quality that are not fully reflected in the historical loss or risk rating data.
61
Notes to Consolidated Financial Statements — (Continued)
A loan is considered impaired when, based on current information and events, it is probable that Parkvale will be unable to collect the scheduled payments of principal or interest when due according to the contractual terms of the loan agreement. Factors considered by management in determining impairment include payment status, collateral value, and the probability of collecting scheduled principal and interest payments when due. Loans that experience insignificant payment delays and payment shortfalls generally are not classified as impaired. Management determines the significance of payment delays and payment shortfalls on a case-by-case basis, taking into consideration all of the circumstances surrounding the loan and the borrower, including the length of the delay, the reasons for the delay, the borrower’s prior payment record, and the amount of the shortfall in relation to the principal and interest owed. Impairment is measured on a loan by loan basis for commercial and construction loans by either the present value of expected future cash flows discounted at the loan’s effective interest rate, the loan’s obtainable market price, or the fair value of the collateral if the loan is collateral dependent.
Large groups of smaller balance homogeneous loans are collectively evaluated for impairment. Accordingly, Parkvale does not separately identify individual consumer and residential loans for impairment disclosures, unless such loans are the subject of a restructuring agreement due to financial difficulties of the borrower.
Earnings per Share
The following table sets forth the computation of basic and diluted earnings per share for the three years ended June 30:
| 2011 | 2010 | 2009 | ||||||||||
| Numerator for basic and diluted earnings per share: |
||||||||||||
| Net income (loss) |
$ | 8,114 | ($ | 16,800 | ) | ($ | 10,278 | ) | ||||
| Less: Preferred stock dividend |
1,588 | 1,588 | 829 | |||||||||
|
|
|
|
|
|
|
|||||||
| Net income (loss) to common shareholders |
$ | 6,526 | ($ | 18,388 | ) | ($ | 11,107 | ) | ||||
|
|
|
|
|
|
|
|||||||
| Denominator |
||||||||||||
| Weighted average shares for basic earnings per share |
5,556,045 | 5,478,332 | 5,451,295 | |||||||||
| Effect of dilutive employee stock options |
44,733 | — | 1,058 | |||||||||
|
|
|
|
|
|
|
|||||||
| Weighted average shares for dilutive earnings per share |
5,600,442 | 5,478,332 | 5,452,353 | |||||||||
|
|
|
|
|
|
|
|||||||
| Net income (loss) per common share |
||||||||||||
| Basic |
$ | 1.17 | ($ | 3.36 | ) | ($ | 2.04 | ) | ||||
| Diluted |
$ | 1.17 | ($ | 3.36 | ) | ($ | 2.04 | ) | ||||
Office Property and Equipment
Land is carried at cost. Office property and equipment is recorded at cost less accumulated depreciation. Depreciation is computed using the straight-line method over the useful lives of the various classes of assets. Amortization of leasehold improvements is computed using the straight-line method over the useful lives of the leasehold. Land has an indefinite useful life, office buildings and leasehold improvements have a useful life ranging from 5-40 years and the useful life for furniture, fixtures and equipment ranges from 3-10 years. Office property and equipment have been evaluated for impairment in accordance with US GAAP and management has determined that office property and equipment are not impaired at June 30, 2011.
Foreclosed Real Estate
Real estate properties acquired through, or in lieu of, loan foreclosure are held for sale and initially recorded at fair value of the property less cost to sell. After foreclosure, management periodically performs valuations, and a valuation allowance is established for any declines in the fair value less cost to sell below the property’s carrying amount. Revenues, expenses and changes in the valuation allowance are included in the statement of operations. Gains and losses upon disposition are reflected in earnings as realized. Loans transferred to foreclosed real estate, which is a non-cash activity, were $9,343 during fiscal 2011, $8,858 in 2010 and $8,836 in 2009. The foreclosures in the last three years were primarily due to loans on single-family dwellings foreclosed throughout the year.
62
Notes to Consolidated Financial Statements — (Continued)
Stock Compensation Plans
Stock compensation accounting guidance requires that the compensation cost relating to share-based payment transactions be recognized in financial statements. That cost will be measured based on the grant date fair value of the equity or liability instruments issued. The stock compensation accounting guidance covers a wide range of share based compensation arrangements including stock options, restricted share plans, performance-based awards, share appreciation rights, and employee share purchase plans. At June 30, 2011, all outstanding options to purchase shares of Parkvale common stock are fully vested.
The stock compensation accounting guidance requires that compensation cost for all stock awards be calculated and recognized over the employees’ service period, generally defined as the vesting period. For awards with graded-vesting, compensation cost is recognized on a straight-line basis over the requisite service period for the entire award. A Black-Sholes model is used to estimate the fair value of stock options, while the market price of Parkvale’s common stock at the date of grant is used for restricted stock awards.
Statement of Cash Flows
For the purposes of reporting cash flows, cash and cash equivalents include cash and noninterest-earning deposits and federal funds sold. Additionally, allocation of treasury stock to retirement plans includes exercise of stock options and allocation to the employee stock ownership plan.
Treasury Stock
The purchase of PFC common stock is recorded at cost. At the date of subsequent reissue, the treasury stock account is reduced by the cost of such stock on the average cost basis, with any excess proceeds being credited to additional paid-in capital.
The repurchase program approved on June 19, 2008 expired on June 30, 2009. During fiscal 2011 and fiscal 2010, Parkvale did not approve a repurchase program.
Goodwill and Other Intangible Assets
Goodwill is the excess of the purchase price over the fair value of assets acquired in connection with a business acquisition accounted for as a purchase, and intangible assets with indefinite lives are not amortized but are reviewed annually, requiring a two-step process, or more frequently if impairment indicators arise, for impairment. Separable intangible assets that are not deemed to have an indefinite life continue to be amortized over their useful lives. Parkvale applied the non-amortization provisions to goodwill recorded on December 31, 2004 as a result of the acquisition of Advance Financial Corporation (“AFB” or “Advance”). AFB core deposit intangibles valued at $4,600 at acquisition represented 4.7% of core deposit accounts, and the premium is being amortized over the average life of 8.94 years. Resulting goodwill of $18,100 is not subject to periodic amortization. Core deposit intangible amortization expense for AFB acquired on December 31, 2004 and for Second National Bank of Masontown (“SNB” or “Masontown”) acquired on January 31, 2002 was $517 and $392 in fiscal 2011, respectively. Amortization over the next three years is expected to aggregate $1,250 and $718 for AFB and SNB, respectively. Goodwill and amortizing core deposit intangibles are not deductible for federal income tax purposes.
Goodwill of $25,634 shown on the Statement of Financial Condition relates to acquisitions in fiscal 2002 (Masontown) and 2005 (Advance). The operations of both acquisitions have been fully integrated into Parkvale’s operations. All of the offices and business activities of both Masontown and Advance have been retained, remain open and are performing as expected. The market price of Parkvale’s common stock was $21.50 per share at June 30, 2011, which is above the book value of $16.56 at such date. Goodwill is tested on an annual basis as of June 30 of each year in conjunction with the Corporation’s fiscal year end but can be tested for impairment at any time if circumstances warrant.
63
Notes to Consolidated Financial Statements — (Continued)
An independent third party was retained for the fiscal year ended June 30, 2011 to assist in determining whether an impairment of goodwill was appropriate. In a report dated July 25, 2011, the third party certified goodwill non-impairment supported by a composite fair value measure based upon the outstanding acquisition offer by F.N.B. Corporation, a discounted cash flow estimate of Parkvale’s current fair value, stock market capitalization data, and a deal value to book value of tangible equity ratios observed in recent comparable banking sector merger and acquisition transactions. Anecdotal evidence for goodwill non-impairment is also shown in the strong underlying financial foundations of Parkvale’s fair value. Based on their report, management determined that goodwill was not impaired at June 30, 2011.
Marketing Costs
Marketing costs are expensed as incurred.
Derivative Financial Instruments
Derivatives are recognized as assets and liabilities on the consolidated statement of financial condition and measured at fair value. For exchange-traded contracts, fair value is based on quoted market prices. For nonexchange traded contracts, fair value is based on dealer quotes, pricing models, discounted cash flow methodologies, or similar techniques for which the determination of fair value may require significant management judgment or estimation.
Interest Rate Swap Agreements. For asset/liability management purposes, Parkvale uses interest rate swap agreements to hedge various exposures or to modify interest rate characteristics of various balance sheet accounts. Interest rate swaps are contracts in which a series of interest rate flows are exchanged over a prescribed period. The notional amount on which the interest payments are based is not exchanged. These swap agreements are derivative instruments and generally convert a portion of Parkvale’s variable-rate debt to a fixed rate (cash flow hedge), and convert a portion of its fixed-rate loans to a variable rate (fair value hedge).
The gain or loss on a derivative designated and qualifying as a fair value hedging instrument, as well as the offsetting gain or loss on the hedged item attributable to the risk being hedged, is recognized currently in earnings in the same accounting period. The effective portion of the gain or loss on a derivative designated and qualifying as a cash flow hedging instrument is initially reported as a component of other comprehensive income and subsequently reclassified into earnings in the same period or periods during which the hedged transaction affects earnings. The ineffective portion of the gain or loss on the derivative instrument, if any, is recognized currently in earnings.
For cash flow hedges, the net settlement (upon close-out or termination) that offsets changes in the value of the hedged debt is deferred and amortized into net interest income over the life of the hedged debt. For fair value hedges, the net settlement (upon close-out or termination) that offsets changes in the value of the loans adjusts the basis of the loans and is deferred and amortized to loan interest income over the life of the loans. The portion, if any, of the net settlement amount that did not offset changes in the value of the hedged asset or liability is recognized immediately in noninterest income.
Interest rate derivative financial instruments receive hedge accounting treatment only if they are designated as a hedge and are expected to be, and are, effective in substantially reducing interest rate risk arising from the assets and liabilities identified as exposing Parkvale to risk. Those derivative financial instruments that do not meet specified hedging criteria would be recorded at fair value with changes in fair value recorded in income. If periodic assessment indicates derivatives no longer provide an effective hedge, the derivative contracts would be closed out and settled, or classified as a trading activity.
Cash flows resulting from the derivative financial instruments that are accounted for as hedges of assets and liabilities are classified in the cash flow statement in the same category as the cash flows of the items being hedged.
64
Notes to Consolidated Financial Statements — (Continued)
Income Taxes
The income tax accounting guidance results in two components of income tax expense: current and deferred. Current income tax expense reflects taxes to be paid or refunded for the current period by applying the provisions of the enacted tax law to the taxable income or excess of deductions over revenues. Parkvale recognizes interest and penalties on income taxes as a component of income tax expense. Parkvale determines deferred income taxes using the liability (or balance sheet) method. Under this method, the net deferred tax asset or liability is based on the tax effects of the differences between the book and tax bases of assets and liabilities, and enacted changes in tax rates and laws are recognized in the period in which they occur.
Under GAAP (ASC 740), a valuation allowance is required to be recognized if it is “more likely than not” that all or a portion of our deferred tax assets will not be recognized. The term “more likely than not” is defined as greater than a 50% probability of occurrence. The determination of the realizability of the deferred tax assets is highly subjective and dependent upon judgment concerning our evaluation of both positive and negative evidence, our forecast of future income, available net operating loss carryback and carryforward, applicable tax planning strategies, and assessment of current and future economic and business conditions. The valuation allowances recorded at June 30, 2011 and 2010 were related to writedowns on equity securities that are unlikely to be offset by future capital gain income.
At June 30, 2011 and 2010, the Company also conducted an analysis to determine if an additional valuation allowance was required as a result of the recent losses experienced by the Company, and concluded that an additional valuation allowance was not necessary, largely based on our projections of future taxable income and that recent losses are not expected to have a significant long-term impact on our operating profitability. Additional positive evidence considered in our analysis was our long-term history of generating taxable income prior to the recent economic downturn; our current projections of positive taxable income for the 2011 tax year; the fact that the Company continued to have solid operational earnings during these loss periods; the fact that recent losses were primarily attributable to impaired investments in trust preferred securities which the Company stopped investing in during 2007 (these investment losses were a result of the economic downturn experienced systemically by the financial industry beginning in 2008); and the fact that the Company can apply the majority of its tax net operating losses in the available two-year carryback period. We conclude that the aforementioned positive evidence outweighs the negative evidence, and as a result an additional valuation allowance was not necessary at either June 30, 2011 or 2010.
Comprehensive Income
Comprehensive income consists of net income and other comprehensive income. Other comprehensive income includes unrealized gains on securities available for sale, unrealized losses related to factors other than credit on debt securities, and unrealized gains and losses on cash flow hedges, which are also recognized as separate components of equity.
Recent Accounting Standards
In July 2010, the Financial Accounting Standards Board (FASB) issued Accounting Standards Update (ASU) 2010-20, Receivables (Topic 310): Disclosures about the Credit Quality of Financing Receivables and the Allowance for Credit Losses. The disclosures will provide financial statement users with additional information about the nature of credit risks inherent in entities’ financing receivables, how credit risk is analyzed and assessed when determining the allowance for credit losses and the reasons for the change in the allowance for credit losses. This requirement is effective for all periods ending on or after December 15, 2010, although certain disclosures will have a deferred effective date. During the December 31, 2010 quarter, Parkvale adopted the additional accounting standards and the required additional disclosure, which have no impact on the consolidated financial statements.
In January 2011, the FASB issued ASU 2011-10: Receivables (Topic 310) Deferral of the Effective Date of Disclosures about Troubled Debt Restructurings in Update 2010 -20. The disclosures associated with ASU 2010-20 were originally scheduled to be effective for public entities for the periods beginning on or after December 15, 2010. Due to significant stakeholder concerns, the disclosures relating to Troubled Debt Restructuring have been deferred to a
65
Notes to Consolidated Financial Statements — (Continued)
later date, anticipated to be effective for interim and annual periods ending after June 15, 2011. The adoption of this standard is not anticipated to have a material effect on the financial statements, results of operations or liquidity of the Corporation.
In April 2011, the FASB issued ASU 2011-02: A Creditor’s Determination of Whether a Restructuring is a Troubled Debt Restructuring. The ASU is clarifying when a loan modification or restructuring is considered a troubled debt restructuring. The guidance is effective for the first interim period beginning on or after June 15, 2011, and should be applied retrospectively to the beginning of the annual period of adoption. For purposes of measuring impairment on newly considered impaired receivables an entity should apply the guidance prospectively in the first interim period beginning on or after June 15, 2011. The disclosures relating to troubled debt restructurings will be required in the first interim period beginning on or after June 15, 2011. The adoption of this ASU is not expected to have a material impact on the Corporation’s consolidated financial statements.
In December 2010, the FASB issued ASU No. 2010-28, Intangibles-Goodwill and Other (Topic 350), When to Perform Step 2 of the Goodwill Impairment Test for Reporting Units with Zero or Negative Carrying Amounts. This ASU is a consensus of the FASB Emerging Issues Task Force (EITF). The amendments are effective for public entities for fiscal years, and interim periods, beginning after December 15, 2010. Early adoption is not permitted. Non-public entities have an additional year to comply (December 15, 2011). For public entities, the disclosures as of the end of a reporting period are effective for interim and annual reporting periods ending on or after December 15, 2010. The disclosures about activity that occurs during a reporting period are effective for interim and annual reporting periods beginning on or after December 15, 2010. The adoption of this standard did not have a material effect on the financial statements, results of operations or liquidity of the Corporation.
In May 2011, the FASB issued ASU No. 2011-03, Reconsideration of Effective Control for Repurchase Agreements, to clarify the accounting principles applied to repurchase agreements, as set forth by FASB ASC Topic 860, Transfers and Servicing. This ASU, entitled Reconsideration of Effective Control for Repurchase Agreements, amends one of three criteria used to determine whether or not a transfer of assets may be treated as a sale by the transferor. Under Topic 860, the transferor may not maintain effective control over the transferred assets in order to qualify as a sale. This ASU eliminates the criteria under which the transferor must retain collateral sufficient to repurchase or redeem the collateral on substantially agreed upon terms as a method of maintaining effective control. This ASU is effective for both public and nonpublic entities for interim and annual reporting periods beginning on or after December 31, 2011, and requires prospective application to transactions or modifications of transactions which occur on or after the effective date. Early adoption is not permitted. The Corporation is evaluating the effects of this ASU on its financial statements.
In May 2011, the FASB issued ASU No. 2011-04, Fair Value Measurement (Topic 820). The amendments in this Update change the wording used to describe the requirements in U.S. GAAP for measuring fair value and for disclosing information about fair value measurements. The amendments in this Update are to be applied prospectively. For public entities, the amendments are effective during interim and annual periods beginning after December 15, 2011. For nonpublic entities, the amendments are effective for annual periods beginning after December 15, 2011. Early application by public entities is not permitted. Nonpublic entities may apply the amendments in this Update early, but no earlier than for interim periods beginning after December 15, 2011. The Corporation is evaluating the effects of this ASU on its financial statements.
In June 2011, the FASB issued ASU No. 2011-05, Comprehensive Income with the intention of increasing the prominence of other comprehensive income in the financial statements. The FASB has eliminated the option to present components of other comprehensive income as part of the statement of changes in stockholders’ equity and will require it be presented either in a single continuous statement of comprehensive income or in two separate but consecutive statements. The single statement format would include the traditional income statement and the components and total other comprehensive income as well as total comprehensive income. In the two statement approach, the first statement would be the traditional income statement which would be immediately followed by a separate statement which includes the components of other comprehensive income, total other comprehensive income and total comprehensive income. The amendments in this ASU will be applied retrospectively. For public entities, they are effective for fiscal years, and interim periods within those years, beginning after December 15, 2011. For non-public entities, the effective date is fiscal years ending after December 15, 2012 and interim and annual periods thereafter. Early adoption is permitted. The Corporation is evaluating the effects of this ASU on its financial statements.
66
Notes to Consolidated Financial Statements — (Continued)
Note B — Investment Securities
(Dollar amounts in thousands)
The amortized cost, gross unrecorded gains and losses and fair values for investment securities classified as available for sale or held to maturity at June 30 are as follows:
| 2011 | ||||||||||||||||
| Amortized Cost |
Gross Unrealized Gains |
Gross Unrealized Losses |
Fair Value |
|||||||||||||
| Available for sale: |
||||||||||||||||
| CMOs - Non Agency (Residential) |
$ | — | $ | — | $ | — | $ | — | ||||||||
| Mutual Funds — ARM mortgages |
5,500 | 22 | 278 | 5,244 | ||||||||||||
| Other common equities (Financial Services) |
1 | — | — | 1 | ||||||||||||
|
|
|
|
|
|
|
|
|
|||||||||
| Total equity investments available for sale |
5,501 | 22 | 278 | 5,245 | ||||||||||||
|
|
|
|
|
|
|
|
|
|||||||||
| Held to maturity: |
||||||||||||||||
| U.S. Government and agency obligations due: |
||||||||||||||||
| Within 1 year |
— | — | — | — | ||||||||||||
| Within 5 years |
45,005 | 654 | — | 45,659 | ||||||||||||
| Within 10 years |
127,048 | 448 | 218 | 127,278 | ||||||||||||
|
|
|
|
|
|
|
|
|
|||||||||
| Total U.S. Government and agency obligations |
172,053 | 1,102 | 218 | 172,937 | ||||||||||||
|
|
|
|
|
|
|
|
|
|||||||||
| Municipal obligations: |
||||||||||||||||
| Within 1 year |
3,406 | 7 | — | 3,413 | ||||||||||||
| Within 5 years |
14,251 | 399 | 4 | 14,646 | ||||||||||||
| Within 10 years |
7,822 | 308 | — | 8,130 | ||||||||||||
| After 10 years |
966 | 92 | — | 1,058 | ||||||||||||
|
|
|
|
|
|
|
|
|
|||||||||
| Total municipal obligations |
26,445 | 806 | 4 | 27,247 | ||||||||||||
|
|
|
|
|
|
|
|
|
|||||||||
| Individual trust preferred securities — after 10 years |
9,345 | 213 | 716 | 8,842 | ||||||||||||
|
|
|
|
|
|
|
|
|
|||||||||
| Pooled trust preferred securities - after 10 years |
20,921 | 3,450 | 6,612 | 17,759 | ||||||||||||
|
|
|
|
|
|
|
|
|
|||||||||
| Corporate debt: |
||||||||||||||||
| Within 1 year |
5,018 | 81 | — | 5,099 | ||||||||||||
| Within 5 years |
22,483 | 792 | 6 | 23,269 | ||||||||||||
| Within 10 years |
5,000 | — | 25 | 4,975 | ||||||||||||
|
|
|
|
|
|
|
|
|
|||||||||
| Total corporate debt |
32,501 | 873 | 31 | 33,343 | ||||||||||||
|
|
|
|
|
|
|
|
|
|||||||||
| Total U.S. Government and agency obligations, municipal obligations, corporate debt and individual and pooled trust preferred securities |
261,265 | 6,444 | 7,581 | 260,128 | ||||||||||||
|
|
|
|
|
|
|
|
|
|||||||||
| Mortgage-backed securities: (All Residential) |
||||||||||||||||
| FHLMC |
21,812 | 500 | 57 | 22,255 | ||||||||||||
| FNMA |
117,074 | 1,490 | 345 | 118,219 | ||||||||||||
| GNMA |
62,767 | 556 | 96 | 63,227 | ||||||||||||
| SBA |
2 | — | — | 2 | ||||||||||||
| Collateralized mortgage obligations (“CMOs”) — Agency |
12,553 | 331 | — | 12,884 | ||||||||||||
| CMOs — Non-Agency |
56,716 | 1,604 | 3,919 | 54,401 | ||||||||||||
|
|
|
|
|
|
|
|
|
|||||||||
| Total mortgage-backed securities |
270,924 | 4,481 | 4,417 | 270,988 | ||||||||||||
|
|
|
|
|
|
|
|
|
|||||||||
| Total investments classified as held to maturity |
532,189 | 10,925 | 11,998 | 531,116 | ||||||||||||
|
|
|
|
|
|
|
|
|
|||||||||
| Total investment portfolio |
$ | 537,690 | $ | 10,947 | $ | 12,276 | $ | 536,361 | ||||||||
|
|
|
|
|
|
|
|
|
|||||||||
67
Notes to Consolidated Financial Statements — (Continued)
| 2010 | ||||||||||||||||
| Gross | Gross | |||||||||||||||
| Amortized | Unrealized | Unrealized | Fair | |||||||||||||
| Cost | Gains | Losses | Value | |||||||||||||
| Available for sale: |
||||||||||||||||
| CMOs - Non Agency (Residential) |
$ | 59,804 | $ | — | $ | — | $ | 59,804 | ||||||||
| Mutual Funds — ARM mortgages |
5,500 | 24 | 240 | 5,284 | ||||||||||||
| Other common equities (Financial Services) |
474 | 208 | — | 682 | ||||||||||||
|
|
|
|
|
|
|
|
|
|||||||||
| Total equity investments available for sale |
65,778 | 232 | 240 | 65,770 | ||||||||||||
|
|
|
|
|
|
|
|
|
|||||||||
| Held to maturity: |
||||||||||||||||
| U.S. Government and agency obligations due: |
||||||||||||||||
| Within 1 year |
10,000 | 334 | — | 10,334 | ||||||||||||
| Within 5 years |
145,084 | 1,078 | 6 | 146,156 | ||||||||||||
| Within 10 years |
39,164 | 269 | 3 | 39,430 | ||||||||||||
| After 10 years |
— | — | — | — | ||||||||||||
|
|
|
|
|
|
|
|
|
|||||||||
| Total U.S. Government and agency obligations |
194,248 | 1,681 | 9 | 195,920 | ||||||||||||
|
|
|
|
|
|
|
|
|
|||||||||
| Municipal obligations: |
||||||||||||||||
| Within 1 year |
7,023 | 19 | — | 7,042 | ||||||||||||
| Within 5 years |
10,719 | 469 | — | 11,188 | ||||||||||||
| Within 10 years |
1,653 | 42 | — | 1,695 | ||||||||||||
| After 10 years |
2,246 | 174 | — | 2,420 | ||||||||||||
|
|
|
|
|
|
|
|
|
|||||||||
| Total municipal obligations |
21,641 | 704 | — | 22,345 | ||||||||||||
|
|
|
|
|
|
|
|
|
|||||||||
| Individual trust preferred securities — after 10 years |
9,322 | 205 | 1,550 | 7,977 | ||||||||||||
|
|
|
|
|
|
|
|
|
|||||||||
| Pooled trust preferred securities — after 10 years |
24,229 | — | 7,380 | 16,849 | ||||||||||||
|
|
|
|
|
|
|
|
|
|||||||||
| Corporate debt: |
||||||||||||||||
| Within 1 year |
10,693 | 161 | — | 10,854 | ||||||||||||
| Within 5 years |
16,419 | 1,079 | — | 17,498 | ||||||||||||
|
|
|
|
|
|
|
|
|
|||||||||
| Total corporate debt |
27,112 | 1,240 | — | 28,352 | ||||||||||||
|
|
|
|
|
|
|
|
|
|||||||||
| Total U.S. Government and agency obligations, municipal obligations, corporate debt and individual and pooled trust preferred securities |
276,552 | 3,830 | 8,939 | 271,443 | ||||||||||||
|
|
|
|
|
|
|
|
|
|||||||||
| Mortgage-backed securities (All Residential): |
||||||||||||||||
| FHLMC |
20,549 | 431 | 44 | 20,936 | ||||||||||||
| FNMA |
31,126 | 1,052 | — | 32,178 | ||||||||||||
| GNMA |
41,569 | 371 | 3 | 41,937 | ||||||||||||
| SBA |
4 | — | — | 4 | ||||||||||||
| Collateralized mortgage obligations (“CMOs”) - Agency |
10,357 | 273 | — | 10,630 | ||||||||||||
| CMOs — Non-Agency |
63,295 | 2,387 | 4,879 | 60,803 | ||||||||||||
|
|
|
|
|
|
|
|
|
|||||||||
| Total mortgage-backed securities |
166,900 | 4,514 | 4,926 | 166,488 | ||||||||||||
|
|
|
|
|
|
|
|
|
|||||||||
| Total investments classified as held to maturity |
443,452 | 8,344 | 13,865 | 437,931 | ||||||||||||
|
|
|
|
|
|
|
|
|
|||||||||
| Total investment portfolio |
$ | 509,230 | $ | 8,576 | $ | 14,105 | $ | 503,701 | ||||||||
|
|
|
|
|
|
|
|
|
|||||||||
Investment securities with an estimated fair value of $20,390 and $23,648 were pledged to secure public deposits and other purposes at June 30, 2011 and 2010, respectively. Investment securities with an estimated fair value of $12,345 and $17,769 were pledged to secure commercial investment agreements at June 30, 2011 and 2010, respectively. Investment securities with an estimated fair value of $405,604 were pledged at June 30, 2011 to the Federal Home Loan Bank and Federal Reserve Bank for access to immediately available borrowings in conjunction with the Bank’s contingency funding plan. Mortgage-backed securities and CMOs are not due at a single maturity date; periodic payments are received on the securities based on the payment patterns of the underlying collateral.
68
Notes to Consolidated Financial Statements — (Continued)
Unrealized losses on investments are primarily the result of volatility in interest rates, changes in spreads over treasuries and certain investments falling out of favor with investors due to illiquidity in the financial markets. Based on the creditworthiness of the issuers and discounted cash flow analysis, management determined that the remaining investments in debt and equity securities were not other-than-temporarily impaired at June 30, 2011. The following table represents gross unrealized losses and fair value of investments aggregated by investment category and length of time that individual securities have been in a continuous unrealized loss position at June 30, 2011:
| Less than 12 months | 12 months or more | Total | ||||||||||||||||||||||
| Fair Value |
Unrealized Losses |
Fair Value |
Unrealized Losses |
Fair Value |
Unrealized Losses |
|||||||||||||||||||
| U.S. government and agency obligations |
$ | 33,817 | $ | 218 | $ | — | $ | — | $ | 33,817 | $ | 218 | ||||||||||||
| Municipal obligations |
4,535 | 4 | — | — | 4,535 | 4 | ||||||||||||||||||
| Corporate debt |
7,021 | 31 | — | — | 7,021 | 31 | ||||||||||||||||||
| Individual trust preferred securities |
— | — | 5,419 | 716 | 5,419 | 716 | ||||||||||||||||||
| Pooled trust preferred securities |
463 | 92 | 6,395 | 6,520 | 6,858 | 6,612 | ||||||||||||||||||
|
|
|
|
|
|
|
|
|
|
|
|
|
|||||||||||||
| Total U.S. Government and agency obligations, municipal obligations, corporate debt and individual and pooled trust preferred securities |
45,836 | 345 | 11,815 | 7,236 | 57,651 | 7,581 | ||||||||||||||||||
|
|
|
|
|
|
|
|
|
|
|
|
|
|||||||||||||
| Mortgaged-backed securities |
69,422 | 497 | 7 | 1 | 69,429 | 498 | ||||||||||||||||||
| Non-agency CMO’s |
18,437 | 1,197 | 16,254 | 2,722 | 34,691 | 3,919 | ||||||||||||||||||
| Mutual Funds — ARM mortgages |
— | — | 4,723 | 278 | 4,723 | 278 | ||||||||||||||||||
|
|
|
|
|
|
|
|
|
|
|
|
|
|||||||||||||
| Totals |
$ | 133,695 | $ | 2,039 | $ | 32,798 | $ | 10,237 | $ | 166,493 | $ | 12,276 | ||||||||||||
|
|
|
|
|
|
|
|
|
|
|
|
|
|||||||||||||
As of June 30, 2011, securities with unrealized losses of less than 12 months include five investments in U.S. government and agency obligations, four investments in municipal obligations, two investments in corporate debt, one investment in pooled trust preferred securities, four investments in non-agency CMOs and fourteen investments in residential mortgage-backed securities.
As of June 30, 2011, securities with unrealized losses of greater than 12 months include four investments in individual trust preferred securities, three investments in pooled trust preferred securities, five investments in non-agency CMOs, one investment in residential mortgage-backed securities one mutual fund investment.
Available for sale investments.
Mutual Funds. Parkvale has investments in two adjustable rate mortgage mutual funds with an aggregate amortized cost of $5,500 at June 30, 2011. The larger of the two investments, which had a fair value of $4,722 at June 30, 2011, has had an unrealized loss in excess of one year of $278 and $240 at June 30, 2011 and at June 30, 2010, respectively. Parkvale evaluated the near-term prospects of the issuer of the mutual fund in relation to the severity and duration of the impairment. Based on this evaluation and Parkvale’s ability to hold the investment for a reasonable period of time sufficient for a forecasted recovery of fair value, Parkvale does not consider the remaining value of this investment to be other than temporarily impaired at June 30, 2011.
Common Equities. At June 30, 2011, Parkvale had investments in three different common equities, which had an aggregate amortized cost of $1 and an aggregate fair value of $1 at June 30, 2011 and an aggregate amortized cost of $474 and an aggregate fair value of $682 at June 30, 2010 consisting of nine different equity securities.
Held to maturity securities.
U.S. Government and Agency Obligations. At June 30, 2011, the $172,937 fair value of Parkvale’s investments in U.S. Government and Agency obligations was higher than the $172,053 amortized cost of such investments. Certain of these investments with a fair value of $33,817 show unrealized losses of less than one year of $218 at the balance sheet date. The contractual terms of those investments do not permit the issuer to settle the securities
69
Notes to Consolidated Financial Statements — (Continued)
at a price less than the face value of the investment. Parkvale intends to hold these securities to the contractual maturity of such investments and it is more likely than not that Parkvale will not be required to sell the investments before recovery of its amortized cost.
Municipal obligations. At June 30, 2011, the $27,247 fair value of Parkvale’s investments in municipal obligations was higher than the $26,445 amortized cost of such investments. Certain of these investments with a fair value of $4,535 show unrealized losses of less than one year of $4 at the balance sheet date. The contractual terms of those investments do not permit the issuer to settle the securities at a price less than the face value of the investment. Parkvale intends to hold these securities to the contractual maturity of such investments and it is more likely than not that Parkvale will not be required to sell the investments before recovery of its amortized cost.
Corporate debt. At June 30, 2011, the $33,343 fair value of Parkvale’s investments in corporate debt was higher than the $32,501 amortized cost of such investments. Certain of these investments with a fair value of $7,021 show unrealized losses of less than one year of $31 at the balance sheet date. The contractual terms of those investments do not permit the issuer to settle the securities at a price less than the face value of the investment. Parkvale intends to hold these securities to the contractual maturity of such investments and it is more likely than not that Parkvale will not be required to sell the investments before recovery of its amortized cost.
Agency mortgage-backed securities. Agency mortgage-backed securities in a continuous unrealized loss position of less than 12 months had an aggregate fair value of $69,422 with unrealized losses of $497 and those in a continuous unrealized loss position of more than 12 months had an aggregate fair value of $7 with unrealized losses of $1 at June 30, 2011. Based on management’s evaluation of these securities, including the respective governmental or agency guaranty, management determined that the investment in these securities was not other than temporarily impaired at June 30, 2011.
Non-agency CMO’s. Non-agency CMO’s in a continuous unrealized loss position of less than 12 months had an aggregate fair value of $18,437 with unrealized losses of $1,197 and those in a continuous unrealized loss position of more than 12 months had an aggregate fair value of $16,254 with unrealized losses of $2,722 at June 30, 2011. Parkvale intends to hold these securities to the contractual maturity of such investments and it is more likely than not that Parkvale will not be required to sell the investments before recovery of its amortized cost. Based upon an evaluation of these securities, management determined that the investment in these securities was not other than temporarily impaired at June 30, 2011.
Trust Preferred Securities. Trust preferred securities are very long-term (usually 30-year maturity) instruments with characteristics of both debt and equity. Most of the Corporation’s investments in trust preferred securities are of pooled issues, each made up of 23 or more companies with geographic and size diversification. Unless otherwise noted, the Corporation’s pooled trust preferred securities are substantially secured by bank and thrift holding companies (approximately 85% in the aggregate) and by insurance companies (approximately 15% in the aggregate). No single company represents more than 5% of any individual pooled offering. While certain companies are in more than one pool, no single company represents more than a 5% interest in the aggregate pooled investments. The pooled trust preferred investments were all investment grade at purchase with an initial average investment grade rating of A. As a result of the overall credit market and the number of underlying issuers deferring interest payments, as well as issuers defaulting, the rating agencies have downgraded the securities to below investment grade as of June 30, 2011. All of these investments are classified as held to maturity.
The following table represents gross unrealized losses and fair value of investments aggregated by investment category and length of time that individual securities have been in a continuous unrealized loss position at June 30, 2010:
| Less than 12 months | 12 months or more | Total | ||||||||||||||||||||||
| Fair Value |
Unrealized Losses |
Fair Value |
Unrealized Losses |
Fair Value |
Unrealized Losses |
|||||||||||||||||||
| U.S. government and agency obligations |
$ | 29,990 | $ | 9 | $ | — | $ | — | $ | 29,990 | $ | 9 | ||||||||||||
| Individual trust preferred securities |
— | — | 5,054 | 1,550 | 5,054 | 1,550 | ||||||||||||||||||
| Pooled trust preferred securities |
— | — | 10,197 | 7,380 | 10,197 | 7,380 | ||||||||||||||||||
|
|
|
|
|
|
|
|
|
|
|
|
|
|||||||||||||
| Total U.S. Government and agency obligations and individual and pooled trust preferred securities |
29,990 | 9 | 15,251 | 8,930 | 45,241 | 8,939 | ||||||||||||||||||
|
|
|
|
|
|
|
|
|
|
|
|
|
|||||||||||||
| Mortgaged-backed securities |
5,300 | 47 | — | — | 5,300 | 47 | ||||||||||||||||||
| Non-agency CMO’s |
— | — | 18,024 | 4,879 | 18,024 | 4,879 | ||||||||||||||||||
| Mutual Funds — ARM mortgages |
— | — | 4,760 | 240 | 4,760 | 240 | ||||||||||||||||||
|
|
|
|
|
|
|
|
|
|
|
|
|
|||||||||||||
| Totals |
$ | 35,290 | $ | 56 | $ | 38,035 | $ | 14,049 | $ | 73,325 | $ | 14,105 | ||||||||||||
|
|
|
|
|
|
|
|
|
|
|
|
|
|||||||||||||
70
Notes to Consolidated Financial Statements — (Continued)
As of June 30, 2010, securities with unrealized losses of less than 12 months include four investments in U.S. government and agency obligations and two investments in residential mortgage-backed securities.
As of June 30, 2010, securities with unrealized losses of greater than 12 months include five investments in individual trust preferred securities, four investments in pooled trust preferred securities, five investments in non-agency CMOs and one mutual fund investment.
During fiscal 2011, certain pooled trust preferred security investments considered to be other than temporarily impaired were written down to fair value with a net charge to earnings of $2,314. During fiscal 2010, certain investments considered to be other than temporarily impaired were written down to fair value with a net charge to earnings of $38,977; see Note J. Write-downs during both fiscal 2011 and 2010 were based on the credit performance of individual securities and the issuer’s ability to make its contractual principal and interest payments. Of the aggregate impairment charge of $24,947 recognized during fiscal 2010 related to pooled trust preferred securities, a total of $21,322 was recognized during the fourth quarter of fiscal 2010 as a result of management adjusting assumptions related to default probabilities, recoveries and discount factors. The adjustments resulted from credit deterioration of underlying issuers and an increase in the level and duration of payment deferrals experienced during the fourth quarter of fiscal 2010. Based on management’s evaluation of the securities, management determined that the remaining investments in debt and equity securities were not other than temporarily impaired at June 30, 2011. Should credit quality continue to deteriorate, it is possible that additional writedowns may be required.
At June 30, 2010, the credit quality of non-agency CMO securities rated below investment grade as a result of downgrades by the national rating agencies was evaluated. Based upon actual and future credit deterioration projections and results of the evaluation, the Bank decided as of June 30, 2010 to sell fifteen non-agency CMO securities in the near term. These debt securities were reclassified from held to maturity to available for sale at June 30, 2010 and other than temporary impairment charges of $13,100 were recognized in earnings during fiscal 2010 as the difference between the respective investment’s amortized cost basis and fair value at June 30, 2010. The remaining carrying value of the available for sale non-agency CMO securities was $59,800 at June 30, 2010. During the September 30, 2010 quarter, a total of $49,000 of below-investment grade non-agency collateralized mortgage obligations, which were classified as available for sale at June 30, 2010, were sold at a gain of $1,200. Two non-agency collateralized mortgage obligations with an amortized cost totaling $7,000 were transferred from available for sale to held to maturity at September 30, 2010 as long term prospects related to the securities improved during said quarter. The remaining non-agency CMO security portfolio carrying value of $56,700 and fair value of $54,400 at June 30, 2011 is expected to be received through maturity.
A significant portion of the Corporation’s unrealized losses primarily relate to investments in pooled trust preferred securities, which consist of securities issued primarily by banks, with some of the pools including a limited number of insurance companies. Investments in pooled securities are primarily mezzanine tranches, except for two investments in senior tranches, and are secured by over-collateralization or default protection provided by subordinated tranches. Unrealized losses on investments in pooled trust preferred securities are attributable to temporary illiquidity and the uncertainty affecting these markets, as well as changes in interest rates.
71
Notes to Consolidated Financial Statements — (Continued)
Liquidity concerns in the financial markets have made it difficult to obtain reliable market quotations on some infrequently traded securities that are held to maturity. Corporate debt has been valued using financial models permitted by guidance in Accounting Standards Codification (“ASC”) 820 for Level III (see Fair Value Note) assets as active markets did not exist at June 30, 2011 and June 30, 2010 to provide reliable market quotes. The assets included in Level III pricing relate to pooled trust preferred securities. The trust preferred market has been severely impacted by the deteriorating economy and the lack of liquidity in the credit markets.
Management believes trust preferred valuations have been negatively affected by an inactive market and concerns that the underlying banks and insurance companies may have significant exposure to losses from sub-prime mortgages, defaulted collateralized debt obligations or other concerns. When evaluating these investments, a determination is made of the credit portion and the noncredit portion of impairment. The credit portion is recognized in earnings and represents the expected shortfall in future cash flows. The noncredit portion is recognized in other comprehensive income and represents the difference between the fair value of the security and the amount of credit related impairment, which is discussed in the following paragraphs. A discounted cash flow analysis provides the best estimate of the credit related portion of the impairment for these securities. Parkvale’s pooled trust preferred collateralized debt obligations are measured for other than temporary impairment within the scope of US GAAP, by determining whether it is probable that an adverse change in estimated cash flows has occurred. The discounted cash flow analysis is considered to be the primary evidence when determining whether credit related impairment exists.
Management’s estimates and results of a discounted cash flow test are significantly affected by other variables such as the estimate of future cash flows, credit worthiness of the underlying banks and insurance companies (“issuer”) and determination of probability of default of the underlying collateral. Changes in the variable assumptions could produce different conclusions for each security. Current available information is evaluated in estimating the future cash flows of these securities and a determination is made regarding whether or not there have been favorable or adverse changes in estimated cash flows from the cash flows previously projected. Consideration is given to the structure and term of the pool and the financial condition of the underlying issuers. Specifically, the evaluation incorporates factors such as over-collateralization and interest coverage tests, interest rates and appropriate risk premiums, the timing and amount of interest and principal payments and the allocation of payments to the various tranches. Current estimates of cash flows are based on the most recent trustee reports, announcements of deferrals or defaults, and assumptions regarding expected future default rates, prepayment and recovery rates and other relevant information. In constructing these assumptions, the following is considered:
| • | that current defaults would have no recovery; |
| • | that some individually analyzed deferrals will cure at rates varying from 10% to 90% after the deferral period ends; |
| • | recent historical performance metrics, including profitability, capital ratios, loan charge-offs and loan reserve ratios, for the underlying institutions that would indicate a higher probability of default by the institution; |
| • | that institutions identified as possessing a higher probability of default would recover at a rate of 10% for banks and 15% for insurance companies; |
| • | that financial performance of the financial sector continues to be affected by the economic environment resulting in an expectation of additional deferrals and defaults in the future; |
| • | whether the security is currently deferring interest; and |
| • | the external rating of the security and recent changes to its external rating. |
In addition to the above factors, the excess subordination levels for each pooled trust preferred security are calculated. The results of this excess subordination allows management to identify those pools that are a greater risk for a future break in cash flows so that issuers in those pools can be monitored more closely for potential deterioration of credit quality.
A significant portion of the Corporation’s unrealized losses relate primarily to investments in trust preferred securities, which consist of single issuer and pooled securities. The portfolio of trust preferred collateralized debt obligations consists of 16 pooled issues and 8 single issuer securities. The single issuer securities are primarily from Pennsylvania regional banks. Investments in pooled securities are primarily mezzanine tranches, except for 1
72
Notes to Consolidated Financial Statements — (Continued)
investment in a senior tranche, and are secured by over-collateralization or default protection provided by subordinated tranches At June 30, 2011, the 16 pooled trust preferred securities have an amortized cost basis of $20,921 and an estimated fair value of $17,759, while the single-issuer trust preferred securities have an amortized cost basis of $9,345 and an estimated fair value of $8,842. The net unrealized losses on the trust preferred securities at June 30, 2011, which aggregated $3,162 on the pooled securities and $503 on the individual securities, are attributable to temporary illiquidity and the uncertainty affecting these markets, as well as changes in interest rates. Contractual terms of the investments do not permit debtors to settle the security at a price less than the face value of the investments and as such, it is expected that the remaining trust preferred securities will not be settled at a price less than the current carrying value of the investments. The Corporation has concluded from detailed cash flow analysis performed as of June 30, 2011 that it is probable that all contractual principal and interest payments will be collected on all of its single-issuer and pooled trust preferred securities, except for those on which OTTI was recognized on the pooled trust preferred securities. Because Parkvale does not have the intent to sell these investments prior to recovery and it is more likely than not that Parkvale will not have to sell these securities prior to recovery, Parkvale does not consider the remaining value of these assets to be other than temporarily impaired at June 30, 2011. However, continued interest deferrals and/or insolvencies by participating issuers could result in a further writedown of one or more of the trust preferred investments in the future.
At June 30, 2011, as permitted by the debt instruments, there are 11 pooled trust preferred securities with an amortized cost basis of $7,982 that have for one reason or another chosen to defer payments. Interest payments aggregating $465 have been capitalized to the balance of the securities as permitted by the underlying trust agreement and interest payments aggregating $2,258 have been deferred since the respective securities began to defer payments. Deferred payments are not included in interest income. Interest payments totaling $911 were deferred during fiscal 2011 and no payments were capitalized during fiscal 2011.
73
Notes to Consolidated Financial Statements — (Continued)
The following table provides information relating to the Corporation’s trust preferred securities as of June 30, 2011.
(Dollar amounts in thousands)
| Deal | Note Class | Par Value | Book Value | Fair Value |
Unrealized Gain (Loss) |
Lowest Credit Ratings |
# of Issuers |
Actual Default % (1) |
Actual Deferral % (1) (2) |
Expected of performing |
Excess Subordination (as a % of performing collateral) (4) |
|||||||||||||||||||||||||||||
| Pooled Investments |
||||||||||||||||||||||||||||||||||||||||
| P1 | C1 | 5,000 | 350 | 825 | 475 | C | 68 | 1.0 | % | 21.4 | % | 13.0 | % | 0.0 | % | |||||||||||||||||||||||||
| P2 | A2A | 5,000 | 2,027 | 2,515 | 488 | CCC- | 64 | 1.8 | % | 21.8 | % | 12.7 | % | 10.2 | % | |||||||||||||||||||||||||
| P3 | C1 | 4,592 | 735 | 1,234 | 499 | C | 71 | 1.6 | % | 8.0 | % | 13.9 | % | 0.0 | % | |||||||||||||||||||||||||
| P4 | C1 | 5,058 | 354 | 1,088 | 734 | C | 62 | 0.3 | % | 10.9 | % | 12.6 | % | 0.0 | % | |||||||||||||||||||||||||
| P5 | C1 | 5,023 | 151 | 320 | 169 | C | 81 | 3.5 | % | 20.2 | % | 14.1 | % | 0.0 | % | |||||||||||||||||||||||||
| P6 | C1 | 3,075 | 31 | 121 | 90 | C | 68 | 2.5 | % | 19.6 | % | 14.3 | % | 0.0 | % | |||||||||||||||||||||||||
| P8 | C | 3,219 | 129 | 207 | 78 | C | 48 | 1.2 | % | 18.6 | % | 11.6 | % | 0.0 | % | |||||||||||||||||||||||||
| P9 | B | 2,008 | 80 | 540 | 460 | C | 54 | 0.0 | % | 30.1 | % | 10.4 | % | 0.0 | % | |||||||||||||||||||||||||
| P10 | B1 | 5,000 | 4,886 | 2,525 | (2,361 | ) | CCC | 23 | 0.0 | % | 11.6 | % | 11.6 | % | 6.0 | % | ||||||||||||||||||||||||
| P11 | Mezz | 1,500 | 555 | 463 | (92 | ) | C | 23 | 18.8 | % | 21.1 | % | 7.9 | % | 0.0 | % | ||||||||||||||||||||||||
| P12 | B2 | 1,003 | 290 | 312 | 22 | C | 23 | 14.7 | % | 16.3 | % | 10.5 | % | 0.0 | % | |||||||||||||||||||||||||
| P13 | B | 3,909 | 3,759 | 1,024 | (2,735 | ) | C | 43 | 14.9 | % | 17.4 | % | 12.7 | % | 0.0 | % | ||||||||||||||||||||||||
| P14 | A1 | 4,581 | 4,270 | 2,846 | (1,424 | ) | CCC | 49 | 20.4 | % | 7.4 | % | 13.1 | % | 30.3 | % | ||||||||||||||||||||||||
| P15 | B | 5,000 | 1,465 | 1,465 | 0 | C | 34 | 25.2 | % | 13.2 | % | 16.0 | % | 0.0 | % | |||||||||||||||||||||||||
| P16 | C1 | 5,000 | 1,089 | 1,233 | 144 | C | 43 | 17.2 | % | 11.1 | % | 8.4 | % | 0.0 | % | |||||||||||||||||||||||||
| P17 | C1 | 5,000 | 750 | 1,041 | 291 | C | 41 | 18.5 | % | 15.5 | % | 9.0 | % | 0.0 | % | |||||||||||||||||||||||||
|
|
|
|
|
|
|
|
|
|||||||||||||||||||||||||||||||||
| Subtotal | 16 | 63,968 | 20,921 | 17,759 | (3,162 | ) | ||||||||||||||||||||||||||||||||||
| Single Issuer Investments |
||||||||||||||||||||||||||||||||||||||||
| S1 | N/A | 1,000 | 932 | 809 | (123 | ) | BB+ | 1 | 0.0 | % | 0.0 | % | 0.0 | % | ||||||||||||||||||||||||||
| S2 | N/A | 2,000 | 1,970 | 1,621 | (349 | ) | BB+ | 1 | 0.0 | % | 0.0 | % | 0.0 | % | ||||||||||||||||||||||||||
| S3 | N/A | 3,000 | 2,785 | 2,586 | (199 | ) | A- | 1 | 0.0 | % | 0.0 | % | 0.0 | % | ||||||||||||||||||||||||||
| S4 | N/A | 500 | 448 | 403 | (45 | ) | BB- | 1 | 0.0 | % | 0.0 | % | 0.0 | % | ||||||||||||||||||||||||||
| S5 | N/A | 1,000 | 1,005 | 1,120 | 115 | NR | 1 | 0.0 | % | 0.0 | % | 0.0 | % | |||||||||||||||||||||||||||
| S6 | N/A | 700 | 710 | 738 | 28 | NR | 1 | 0.0 | % | 0.0 | % | 0.0 | % | |||||||||||||||||||||||||||
| S7 | N/A | 529 | 495 | 535 | 40 | B+ | 1 | 0.0 | % | 0.0 | % | 0.0 | % | |||||||||||||||||||||||||||
| S8 | N/A | 1,000 | 1,000 | 1,030 | 30 | BB+ | 1 | 0.0 | % | 0.0 | % | 0.0 | % | |||||||||||||||||||||||||||
|
|
|
|
|
|
|
|
|
|||||||||||||||||||||||||||||||||
| Subtotal | 8 | 9,729 | 9,345 | 8,842 | (503 | ) | ||||||||||||||||||||||||||||||||||
| Grand total of Trust Preferred holdings |
73,697 | 30,266 | 26,601 | (3,665) | ||||||||||||||||||||||||||||||||||||
The above listings do not include 7 trust preferred investments written off in previous quarters.
Notes:
| (1) | As a percentage of the total collateral. |
| (2) | Includes deferrals that have not paid current interest payments as permitted by the debt instruments. |
| (3) | Expected defaults are determined by an analysis of each security. |
| (4) | Excess subordination measures the performing collateral coverage of the outstanding liabilities (as a % of performing collateral). |
74
Notes to Consolidated Financial Statements — (Continued)
Non-agency CMOs:
The entire CMO portfolio is backed by “prime” residential mortgage loans and generally includes loans in excess of GSE conforming loan amounts at the date of origination. While there are no sub-prime, option ARMs or home equity loans in any of the CMO pools, approximately 64% of the loans supporting the obligations contained an interest only feature at origination. All pools held by the Bank were rated AAA when purchased and have additional collateral provided by support tranches. The non-agency CMO securities of $56,716 at June 30, 2011 are supported by underlying collateral that was originated as follows:
| Year Originated |
Amortized Cost | Fair Value | ||||||
| 2003 |
$ | 17,619 | $ | 18,654 | ||||
| 2004 |
26,231 | 24,292 | ||||||
| 2005 |
3,478 | 3,700 | ||||||
| 2007 |
5,650 | 4,166 | ||||||
| 2008 |
3,738 | 3,589 | ||||||
|
|
|
|
|
|||||
| $ | 56,716 | $ | 54,401 | |||||
|
|
|
|
|
|||||
The non-agency CMO portfolio at June 30, 2011 contains investments that were all rated AAA at the time of purchase. The amortized cost and fair value by the most recent investment rating at June 30, 2011 is as follows:
| Amortized Cost | Fair Value | |||||||
| AAA/Aaa by Moody’s, S&P, or Fitch |
$ | 19,982 | $ | 19,877 | ||||
| AA/Aa by Moody’s or S&P |
6,706 | 7,237 | ||||||
| A by Moody’s |
3,738 | 3,590 | ||||||
| Baa by Moody’s |
4,747 | 5,411 | ||||||
| BB/Ba by Moody’s or S&P |
15,763 | 14,074 | ||||||
| B by Fitch |
3,101 | 2,542 | ||||||
| CCC by Fitch |
2,549 | 1,624 | ||||||
| D by S&P |
130 | 46 | ||||||
|
|
|
|
|
|||||
| $ | 56,716 | $ | 54,401 | |||||
|
|
|
|
|
|||||
Securities with a remaining carrying value as of June 30, 2011 that have incurred OTTI charges are summarized as follows:
| Security | Unadjusted Carrying Value |
OTTI Charge to Earnings |
OTTI Charge to OCI |
6/30/11 Carrying Value |
6/30/11 Fair Value |
|||||||||||||||
| Pooled trust preferred security |
$ | 48,862 | $ | 20,021 | $ | 20,836 | $ | 8,005 | $ | 11,363 | ||||||||||
The following table shows the balance of other comprehensive income charges related to fair value:
| Pooled trust preferred securities | ||||
| Balance at June 30, 2010 |
$ | 19,868 | ||
| Total losses – realized/unrealized |
3,282 | |||
| Included as a charge to earnings |
(2,314 | ) | ||
| Change to other comprehensive income |
— | |||
|
|
|
|||
| Balance at June 30, 2011 |
$ | 20,836 | ||
|
|
|
|||
The following table displays the cumulative credit component of OTTI charges recognized in earnings on debt securities for which a portion of an OTTI is recognized in other comprehensive income at June 30, 2011:
| Pooled trust preferred securities | ||||
| Balance at June 30, 2010 |
$ | 17,707 | ||
| Addition for the credit component on debt securities in which OTTI was not previously recognized |
2,314 | |||
|
|
|
|||
| Balance at June 30, 2011 |
$ | 20,021 | ||
|
|
|
|||
75
Notes to Consolidated Financial Statements — (Continued)
The amount of securities with OTTI charges to earnings is as follows:
| Pooled trust preferred securities | ||||
| Recorded in September 2010 Quarter |
$ | 996 | ||
| Recorded in December 2010 Quarter |
946 | |||
| Recorded in March 2011 Quarter |
255 | |||
| Recorded in June 2011 Quarter |
117 | |||
|
|
|
|||
| Total – fiscal 2011 |
$ | 2,314 | ||
|
|
|
|||
Note C — Loans
(Dollar amounts in thousands)
Loans at June 30 are summarized as follows:
| June 30, 2011 | June 30, 2010 | |||||||
| Mortgage loans: |
||||||||
| 1-4 family |
$ | 615,884 | $ | 660,685 | ||||
| Commercial |
162,533 | 159,991 | ||||||
|
|
|
|
|
|||||
| Total mortgage loans |
778,417 | 820,676 | ||||||
| Consumer loans: |
||||||||
| Home equity |
146,728 | 147,567 | ||||||
| Automobile |
26,684 | 34,817 | ||||||
| Other consumer |
9,800 | 7,250 | ||||||
|
|
|
|
|
|||||
| Total consumer loans |
183,212 | 189,634 | ||||||
| Commercial business loans |
40,120 | 40,445 | ||||||
|
|
|
|
|
|||||
| Total gross loans |
1,001,749 | 1,050,755 | ||||||
|
|
|
|
|
|||||
| Less: Loans in process |
— | 135 | ||||||
| Allowance for loan losses |
18,626 | 19,209 | ||||||
| Unamortized premiums and deferred loan fees |
(873 | ) | (952 | ) | ||||
|
|
|
|
|
|||||
| Loans, net |
$ | 983,996 | $ | 1,032,363 | ||||
|
|
|
|
|
|||||
76
Notes to Consolidated Financial Statements — (Continued)
The following table presents the classes of the loan portfolio summarized by the aggregate pass rating and the classified ratings of special mention, substandard and doubtful within the Corporation’s internal risk rating system as of June 30, 2011:
| Pass | Special Mention |
Substandard | Doubtful | Total | ||||||||||||||||
| Mortgage loans: |
||||||||||||||||||||
| 1-4 family |
$ | 585,505 | $ | 7,673 | $ | 22,706 | $ | — | $ | 615,884 | ||||||||||
| Commercial |
153,931 | 1,090 | 7,512 | — | 162,533 | |||||||||||||||
| Consumer loans: |
||||||||||||||||||||
| Home equity |
145,600 | — | 1,127 | — | 146,727 | |||||||||||||||
| Automobile |
26,379 | — | 306 | — | 26,685 | |||||||||||||||
| Other consumer |
9,773 | — | 26 | 1 | 9,800 | |||||||||||||||
| Commercial business loans |
37,014 | 1,177 | 1,929 | — | 40,120 | |||||||||||||||
|
|
|
|
|
|
|
|
|
|
|
|||||||||||
| Total |
$ | 958,202 | $ | 9,940 | $ | 33,606 | $ | 1 | $ | 1,001,749 | ||||||||||
|
|
|
|
|
|
|
|
|
|
|
|||||||||||
The following table presents the classes of the loan portfolio summarized by the aggregate pass rating and the classified ratings of special mention, substandard and doubtful within the Corporation’s internal risk rating system as of June 30, 2010:
| Pass | Special Mention |
Substandard | Doubtful | Total | ||||||||||||||||
| Mortgage loans: |
||||||||||||||||||||
| 1-4 family |
$ | 631,466 | $ | 4,860 | $ | 24,359 | $ | — | $ | 660,685 | ||||||||||
| Commercial |
154,649 | 56 | 5,286 | — | 159,991 | |||||||||||||||
| Consumer loans: |
||||||||||||||||||||
| Home equity |
146,540 | — | 1,027 | — | 147,567 | |||||||||||||||
| Automobile |
34,433 | — | 384 | — | 34,817 | |||||||||||||||
| Other consumer |
7,222 | — | 18 | 10 | 7,250 | |||||||||||||||
| Commercial business loans |
35,662 | 20 | 4,763 | — | 40,445 | |||||||||||||||
|
|
|
|
|
|
|
|
|
|
|
|||||||||||
| Total |
$ | 1,009,972 | $ | 4,936 | $ | 35,837 | $ | 10 | $ | 1,050,755 | ||||||||||
|
|
|
|
|
|
|
|
|
|
|
|||||||||||
Pass-rated loans consist of facilities that do not currently expose the Bank to sufficient risk to warrant classifications. Special mention loans have potential weaknesses requiring management’s close attention that if uncorrected, may result in deterioration of the repayment prospects. Substandard loans have a well-defined weakness that jeopardizes liquidation of the debt, and includes loans that are inadequately protected by the current net worth and paying capacity of the obligor or of the collateral pledged, if any. Doubtful loans have all the weaknesses inherent with substandard facilities with the added characteristic that collection or liquidation in full, on the basis of current conditions and facts, is highly improbable.
77
Notes to Consolidated Financial Statements — (Continued)
The following table presents nonaccrual loans by class of the loan portfolio as of June 30,:
| 2011 | 2010 | |||||||
| Mortgage loans: |
||||||||
| 1-4 family |
$ | 22,058 | $ | 24,332 | ||||
| Commercial |
1,457 | 2,435 | ||||||
| Consumer loans: |
||||||||
| Home equity |
700 | 521 | ||||||
| Automobile |
196 | 286 | ||||||
| Other consumer |
14 | 40 | ||||||
| Commercial business loans |
1,271 | 3,084 | ||||||
|
|
|
|
|
|||||
| Total nonaccrual loans |
25,696 | 30,698 | ||||||
| Less: in-place reserves |
(4,214 | ) | (4,178 | ) | ||||
|
|
|
|
|
|||||
| Total nonaccrual loans, net of in-place reserves |
$ | 21,482 | $ | 26,520 | ||||
|
|
|
|
|
|||||
The following table summarizes information regarding impaired loans by loan portfolio class as of or for the year ended June 30, 2011:
| Net Recorded Investment |
Unpaid Principal Balance |
Related Allowance |
Average Recorded Investment |
Interest Income Recognized |
||||||||||||||||
| With no related allowance recorded: |
||||||||||||||||||||
| Mortgage loans: |
||||||||||||||||||||
| 1-4 family |
$ | 3,820 | $ | 3,820 | $ | — | $ | 3,819 | $ | 154 | ||||||||||
| Commercial |
— | — | — | — | — | |||||||||||||||
| Consumer loans: |
||||||||||||||||||||
| Home Equity |
— | — | — | — | — | |||||||||||||||
| Automobile |
— | — | — | — | — | |||||||||||||||
| Other Consumer |
— | — | — | — | — | |||||||||||||||
| Commercial business loans |
798 | 798 | — | 1,143 | — | |||||||||||||||
| With an allowance recorded: |
||||||||||||||||||||
| Mortgage loans: |
||||||||||||||||||||
| 1-4 family |
$ | 16,050 | $ | 21,630 | $ | 5,580 | $ | 21,602 | $ | 264 | ||||||||||
| Commercial |
1,259 | 1,855 | 596 | 1,930 | 53 | |||||||||||||||
| Consumer loans: |
||||||||||||||||||||
| Home Equity |
405 | 570 | 165 | 593 | 32 | |||||||||||||||
| Automobile |
111 | 226 | 115 | 249 | 9 | |||||||||||||||
| Other Consumer |
— | 26 | 26 | 26 | — | |||||||||||||||
| Commercial business loans |
— | — | — | — | — | |||||||||||||||
| Total: |
||||||||||||||||||||
| Mortgage loans: |
||||||||||||||||||||
| 1-4 family |
$ | 19,870 | $ | 25,450 | $ | 5,580 | $ | 25,421 | $ | 418 | ||||||||||
| Commercial |
1,259 | 1,855 | 596 | 1,930 | 53 | |||||||||||||||
| Consumer loans: |
||||||||||||||||||||
| Home Equity |
405 | 570 | 165 | 593 | 32 | |||||||||||||||
| Automobile |
111 | 226 | 115 | 249 | 9 | |||||||||||||||
| Other Consumer |
— | 26 | 26 | 26 | — | |||||||||||||||
| Commercial business loans |
798 | 798 | — | 1,143 | — | |||||||||||||||
78
Notes to Consolidated Financial Statements — (Continued)
At June 30, 2011, modifications have been performed on 174 1-4 family mortgage loans totaling $31,500. Of the aggregate $31,500, 129 modifications totaling $20,200 were performed at market terms, primarily related to extension of maturity dates and extension of interest-only payment periods of thirty-six months or less. Of the aggregate $31,500, 45 modifications totaling $11,300 were determined to be Troubled Debt Restructurings (TDR). The discounted cash flows related to these TDR’s were analyzed and the appropriate reserves have been established at June 30, 2011. Of the 129 loan modifications, 112 loans totaling $18,100 are performing at June 30, 2011. Of the 45 TDR’s, 33 loans totaling $9,400 are performing at June 30, 2011. At June 30, 2010, modifications were performed on 176 1-4 family mortgage loans totaling $29,897. Of the aggregate $29,897, 142 modifications totaling $22,290 were performed at market terms. Of the aggregate $29,897 modifications at June 30, 2010, 34 modifications totaling $7,607 were determined to be Troubled Debt Restructurings.
The performance and credit quality of the loan portfolio is monitored by analyzing the age of the loans receivable as determined by the length of time a recorded payment is past due. The following table presents the classes of the loan portfolio summarized by the past due status as of June 30, 2011:
| 30- 59 Days Past Due |
60-89 Days Past Due |
Greater than 90 Days |
Total Past Due |
Current | Total Loans Receivables |
Loans Receivable > 90 Days and Accruing |
||||||||||||||||||||||
| Mortgage loans: |
||||||||||||||||||||||||||||
| 1-4 family |
$ | 8,670 | $ | 4,297 | $ | 22,058 | $ | 35,025 | $ | 580,859 | $ | 615,884 | $ | — | ||||||||||||||
| Commercial |
4,506 | 163 | 1,457 | 6,126 | 156,407 | 162,533 | — | |||||||||||||||||||||
| Consumer loans: |
||||||||||||||||||||||||||||
| Home equity |
687 | 360 | 700 | 1,747 | 144,981 | 146,728 | — | |||||||||||||||||||||
| Automobile |
249 | 59 | 196 | 504 | 26,180 | 26,684 | — | |||||||||||||||||||||
| Other consumer |
54 | 9 | 14 | 77 | 9,723 | 9,800 | — | |||||||||||||||||||||
| Commercial business loans |
325 | 230 | 1,271 | 1,826 | 38,294 | 40,120 | — | |||||||||||||||||||||
|
|
|
|
|
|
|
|
|
|
|
|
|
|
|
|||||||||||||||
| Total |
$ | 14,491 | $ | 5,118 | $ | 25,696 | $ | 45,305 | $ | 956,444 | $ | 1,001,749 | $ | — | ||||||||||||||
|
|
|
|
|
|
|
|
|
|
|
|
|
|
|
|||||||||||||||
79
Notes to Consolidated Financial Statements — (Continued)
The performance and credit quality of the loan portfolio is monitored by analyzing the age of the loans receivable as determined by the length of time a recorded payment is past due. The following table presents the classes of the loan portfolio summarized by the past due status as of June 30, 2010:
| 30- 59 Days Past Due |
60-89 Days Past Due |
Greater than 90 Days |
Total Past Due |
Current | Total Loans Receivables |
Loans Receivable > 90 Days and Accruing |
||||||||||||||||||||||
| Mortgage loans: |
||||||||||||||||||||||||||||
| 1-4 family |
$ | 8,656 | $ | 5,846 | $ | 24,304 | $ | 38,806 | $ | 621,879 | $ | 660,685 | $ | — | ||||||||||||||
| Commercial |
139 | 232 | 2,435 | 2,806 | 157,185 | 159,991 | — | |||||||||||||||||||||
| Consumer loans: |
||||||||||||||||||||||||||||
| Home equity |
671 | 102 | 572 | 1,345 | 146,222 | 147,567 | — | |||||||||||||||||||||
| Automobile |
386 | 145 | 301 | 832 | 33,985 | 34,817 | — | |||||||||||||||||||||
| Other consumer |
8 | 5 | 4 | 17 | 7,233 | 7,250 | — | |||||||||||||||||||||
| Commercial business loans |
82 | 274 | 3,084 | 3,440 | 37,005 | 40,445 | — | |||||||||||||||||||||
|
|
|
|
|
|
|
|
|
|
|
|
|
|
|
|||||||||||||||
| Total |
$ | 9,942 | $ | 6,604 | $ | 30,700 | $ | 47,246 | $ | 1,003,509 | $ | 1,050,755 | $ | — | ||||||||||||||
|
|
|
|
|
|
|
|
|
|
|
|
|
|
|
|||||||||||||||
The adequacy of the allowance for loan loss is determined by management through evaluation of the loss probable on individual nonperforming, delinquent and high dollar loans, economic and business trends, growth and composition of the loan portfolio and historical loss experience, as well as other relevant factors.
The following table presents the Allowance for Loan Losses and Recorded Investment in Financing Receivables at June 30, 2011:
| 1-4 family Mortgage |
Commercial Mortgage |
Home Equity | Automobile | Other Consumer |
Commercial Business Loans |
Total | ||||||||||||||||||||||
| Allowance for Loan Losses: |
||||||||||||||||||||||||||||
| Beginning balance at June 30, 2010: |
$ | 10,440 | $ | 3,340 | $ | 2,091 | $ | 907 | $ | 155 | $ | 2,276 | $ | 19,209 | ||||||||||||||
| Charge-offs |
(4,007 | ) | (70 | ) | (405 | ) | (46 | ) | (69 | ) | (133 | ) | (4,730 | ) | ||||||||||||||
| Recoveries |
18 | 409 | — | 71 | 90 | 28 | 616 | |||||||||||||||||||||
| Provisions |
2,885 | 537 | 64 | 33 | 12 | — | 3,531 | |||||||||||||||||||||
| Ending balance at June 30, 2011 |
$ | 9,336 | $ | 4,216 | $ | 1,750 | $ | 965 | $ | 188 | $ | 2,171 | $ | 18,626 | ||||||||||||||
| Ending balance: individually evaluated for impairment |
$ | 5,580 | $ | 596 | $ | 165 | $ | 115 | $ | 26 | $ | — | $ | 6,482 | ||||||||||||||
| Ending balance: collectively evaluated for impairment |
$ | 3,756 | $ | 3,620 | $ | 1,585 | $ | 850 | $ | 162 | $ | 2,171 | $ | 12,144 | ||||||||||||||
| Ending balance: loans acquired with deteriorated credit quality |
$ | — | $ | — | $ | — | $ | — | $ | — | $ | — | $ | — | ||||||||||||||
| Recorded Investment: |
||||||||||||||||||||||||||||
| Ending balance |
$ | 615,884 | $ | 162,533 | $ | 146,728 | $ | 26,684 | $ | 9,800 | $ | 40,120 | $ | 1,001,749 | ||||||||||||||
| Ending balance: individually evaluated for impairment |
$ | 25,450 | $ | 1,855 | $ | 570 | $ | 226 | $ | 26 | $ | 798 | $ | 28,925 | ||||||||||||||
| Ending balance: collectively evaluated for impairment |
$ | 590,434 | $ | 160,678 | $ | 146,158 | $ | 26,458 | $ | 9,774 | $ | 39,322 | $ | 972,824 | ||||||||||||||
80
Notes to Consolidated Financial Statements — (Continued)
The following summarizes the allowance for loan loss activity for the twelve-month period ended June 30, 2010:
| Beginning balance at June 30, 2009 |
$ | 17,960 | ||
| Provision for loan losses |
7,448 | |||
| Loans recovered: |
||||
| Commercial business loans |
3 | |||
| Consumer loans |
46 | |||
| Mortgage loans |
1 | |||
|
|
|
|||
| Total recoveries |
50 | |||
|
|
|
|||
| Loans charged off: |
||||
| Commercial business loans |
(752 | ) | ||
| Consumer loans |
(542 | ) | ||
| Mortgage loans |
(4,955 | ) | ||
|
|
|
|||
| Total charge-offs |
(6,249 | ) | ||
|
|
|
|||
| Net (charge-offs) |
(6,199 | ) | ||
|
|
|
|||
| Ending balance at June 30, 2010 |
$ | 19,209 | ||
|
|
|
The following table sets forth the allowance for loan loss allocation for the year ended June 30, 2010:
| 1-4 family mortgage loans |
$ | 10,440 | ||
| Commercial mortgage loans |
3,340 | |||
| Home equity loans |
2,091 | |||
| Automobile loans |
907 | |||
| Other consumer loans |
155 | |||
| Commercial business loans |
2,276 | |||
|
|
|
|||
| Total allowance for loan losses |
$ | 19,209 | ||
|
|
|
The loan portfolio is reviewed on a periodic basis to ensure Parkvale’s allowance for loan losses is adequate to absorb potential losses due to inherent risk in the portfolio.
At June 30, 2011, Parkvale was committed under various agreements to originate fixed and adjustable-rate mortgage loans aggregating $2,060 and $2,437, respectively, at rates ranging from 4.289% to 5.369% for fixed rate and 3.389% to 4.625% for adjustable-rate loans, and had $84,105 of unused consumer lines of credit and $19,384 in unused commercial lines of credit. Parkvale was committed to fund commercial development loans in process of $2,667 and residential loans in process of $2,233. Parkvale was also committed to originate commercial loans totaling $7,914 at June 30, 2011. Outstanding letters of credit totaled $6,819 at June 30, 2011. Substantially all commitments are expected to expire within a year.
At June 30, Parkvale serviced loans for others as follows: 2011 — $51,787, 2010 — $62,484 and 2009 — $62,060.
At June 30, 2011, Parkvale’s loan portfolio consisted primarily of residential real estate loans collateralized by single and multifamily residences, nonresidential real estate loans secured by industrial and retail properties and consumer loans including lines of credit. Parkvale has geographically diversified its mortgage loan portfolio, having loans outstanding in 46 states and the District of Columbia. Parkvale’s highest concentrations are in the following states/areas along with their respective share of the outstanding mortgage loan balance: Pennsylvania — 47.3%; Ohio — 14.2%; and West Virginia — 5.8%. The ability of debtors to honor these contracts depends largely on economic conditions affecting the Pittsburgh, Columbus and Steubenville, Ohio metropolitan areas, with repayment risk dependent on the cash flow of the individual debtors. Substantially all mortgage loans are secured by real property with a loan amount of generally no more than 80% of the appraised value at the time of origination. Mortgage loans in excess of 80% of appraised value generally require private mortgage insurance.
81
Notes to Consolidated Financial Statements — (Continued)
The recorded balance of impaired loans was $24,307 with a related allowance for loan losses of $6,482 at June 30, 2011 compared to impaired loans of $9,687 with a related allowance for loan losses of $5,195 at June 30, 2010. The recorded balance of impaired loans without a related allowance for loan losses was $4,618 at June 30, 2011 and $21,041 at June 30, 2010. The average recorded balance of impaired loans was $29,362 and $27,159 during fiscal 2011 and 2010 respectively. The amount of interest income that has not been recognized on nonaccrual and impaired loans was $1,237 for fiscal 2011, $1,211 for fiscal 2010 and $825 for fiscal 2009.
Note D — Office Properties and Equipment and Foreclosed Real Estate
(Dollar amounts in thousands)
Office properties and equipment at June 30 are summarized by major classification as follows:
| 2011 | 2010 | 2009 | ||||||||||
| Land |
$ | 4,706 | $ | 4,708 | $ | 4,708 | ||||||
| Office buildings and leasehold improvements |
17,750 | 17,902 | 17,863 | |||||||||
| Furniture, fixtures and equipment |
13,892 | 13,495 | 13,234 | |||||||||
|
|
|
|
|
|
|
|||||||
| 36,348 | 36,105 | 35,805 | ||||||||||
| Less accumulated depreciation and amortization |
19,486 | 18,731 | 17,732 | |||||||||
|
|
|
|
|
|
|
|||||||
| Office properties and equipment, net |
$ | 16,862 | $ | 17,374 | $ | 18,073 | ||||||
|
|
|
|
|
|
|
|||||||
| Depreciation expense for the year |
$ | 860 | $ | 998 | $ | 1,095 | ||||||
|
|
|
|
|
|
|
|||||||
| A summary of foreclosed real estate at June 30 is as follows: |
||||||||||||
| 2011 | 2010 | 2009 | ||||||||||
| Real estate acquired through foreclosure |
$ | 10,486 | $ | 9,426 | $ | 6,470 | ||||||
| Allowance for losses |
(722 | ) | (789 | ) | (776 | ) | ||||||
|
|
|
|
|
|
|
|||||||
| $ | 9,764 | $ | 8,637 | $ | 5,694 | |||||||
|
|
|
|
|
|
|
|||||||
| Changes in the allowance for losses on foreclosed real estate for the years ended June 30 were as follows: |
||||||||||||
| 2011 | 2010 | 2009 | ||||||||||
| Beginning balance |
$ | 789 | $ | 776 | $ | 257 | ||||||
| Provision for losses |
671 | 745 | 989 | |||||||||
| Less charges to allowance |
(738 | ) | (732 | ) | (470 | ) | ||||||
|
|
|
|
|
|
|
|||||||
| Ending Balance |
$ | 722 | $ | 789 | $ | 776 | ||||||
|
|
|
|
|
|
|
|||||||
Note E — Savings Deposits
(Dollar amounts in thousands)
The following schedule sets forth interest expense for the years ended June 30 by type of deposit:
| 2011 | 2010 | 2009 | ||||||||||
| Checking and money market accounts |
$ | 1,199 | $ | 1,877 | $ | 3,130 | ||||||
| Passbook and statement savings accounts |
590 | 877 | 1,280 | |||||||||
| Certificates |
17,219 | 24,706 | 34,073 | |||||||||
|
|
|
|
|
|
|
|||||||
| $ | 19,008 | $ | 27,460 | $ | 38,483 | |||||||
|
|
|
|
|
|
|
|||||||
A summary of savings deposits at June 30 is as follows:
| 2011 | 2010 | |||||||||||||||
| Amount | % | Amount | % | |||||||||||||
| Transaction accounts: |
||||||||||||||||
| Checking and money market accounts |
$ | 406,826 | 27.4 | $ | 384,654 | 25.8 | ||||||||||
| Checking accounts - noninterest-bearing |
87,038 | 5.9 | 80,961 | 5.4 | ||||||||||||
| Passbook and statement savings accounts |
243,312 | 16.4 | 224,266 | 15.1 | ||||||||||||
|
|
|
|
|
|
|
|
|
|||||||||
| 737,176 | 49.7 | 689,881 | 46.3 | |||||||||||||
| Certificates of deposit |
741,903 | 50.0 | 791,409 | 53.2 | ||||||||||||
|
|
|
|
|
|
|
|
|
|||||||||
| 1,479,079 | 99.7 | 1,481,290 | 99.5 | |||||||||||||
| Accrued Interest |
5,845 | 0.3 | 6,783 | 0.5 | ||||||||||||
|
|
|
|
|
|
|
|
|
|||||||||
| $ | 1,484,924 | 100.0 | $ | 1,488,073 | 100.0 | |||||||||||
|
|
|
|
|
|
|
|
|
|||||||||
82
Notes to Consolidated Financial Statements — (Continued)
The aggregate amount of time deposits over $100 was $194,952 and $202,483 at June 30, 2011 and 2010, respectively.
At June 30, the scheduled maturities of certificate accounts were as follows:
| Maturing During Fiscal |
2011 | 2010 | ||||||
| 2012 |
$ | 351,532 | $ | 404,199 | ||||
| 2013 |
209,368 | 157,341 | ||||||
| 2014 |
62,161 | 131,171 | ||||||
| 2015 |
45,541 | 22,036 | ||||||
| 2016 |
44,601 | 41,952 | ||||||
| Thereafter |
28,700 | 34,710 | ||||||
|
|
|
|
|
|||||
| $ | 741,903 | $ | 791,409 | |||||
|
|
|
|
|
|||||
Note F — Advances from Federal Home Loan Bank and Other Debt
(Dollar amounts in thousands)
The advances from the FHLB at June 30 consisted of the following:
| 2011 | 2010 | |||||||||||||||
| Balance | Interest Rate | Balance | Interest Rate | |||||||||||||
| Due within one year |
$ | 30,060 | 3.25-5.62 | % | $ | 35,097 | 4.12-6.05 | % | ||||||||
| Due within five years |
100,797 | 3.00-6.75 | % | 80,305 | 3.00-6.75 | % | ||||||||||
| Due within ten years |
20,000 | 4.67-4.97 | % | 70,571 | 4.32-6.27 | % | ||||||||||
|
|
|
|
|
|||||||||||||
| $ | 150,857 | $ | 185,973 | |||||||||||||
|
|
|
|
|
|
|
|
|
|||||||||
| Weighted average interest rate at end of period |
|
5.02 | % | 4.90 | % | |||||||||||
|
|
|
|
|
|||||||||||||
Included in the $150,857 are advances of $60,500 of convertible select advances. These advances may reset to the three-month London Interbank Offered Rate (LIBOR) Index and have various spreads and call dates. The FHLB has the right to call any convertible select advance on its call date or quarterly thereafter. Should such advances be called, Parkvale has the right to pay off the advance without penalty. The FHLB advances are secured by Parkvale’s FHLB stock and investment securities and are subject to substantial prepayment penalties.
On December 30, 2008, PFC entered into a Loan Agreement with PNC Bank, National Association (“PNC”) for a term loan in the amount of $25,000 (the “Loan”). The Loan pays interest at a rate equal to LIBOR plus three hundred and twenty five basis points, payable quarterly. Principal on the Loan, which is due and payable in fifteen consecutive quarterly payments of $625, commenced on March 31, 2010, with the remaining outstanding balance, which is expected to be $15,625, due and payable on December 31, 2013 (the “Maturity Date”). The outstanding balance due under the credit facility may be repaid, at any time, in whole or in part at the Corporation’s option. In connection with the Loan, the Corporation executed a Term Note, dated December 30, 2008, to evidence the Loan and a Pledge Agreement, dated December 30, 2008, whereby the Corporation granted PNC a security interest in the outstanding capital stock of Parkvale Savings Bank, the wholly owned subsidiary of the Corporation. The Loan
83
Notes to Consolidated Financial Statements — (Continued)
Agreement contains customary and standard provisions regarding representations and warranties of the Corporation, covenants and events of default. If the Corporation has an event of default, the interest rate of the loan may increase by 2% during the period of default. As of June 30, 2011, we have met all of the financial covenants contained in the Loan Agreement.
On January 7, 2009, the Corporation entered into swap arrangements with PNC to convert portions of the LIBOR floating interest rates to fixed interest rates for three and five years. Under the swap agreements, $5,000 matures on December 31, 2011 at a rate of 4.92% and an additional $15,000 matures on December 31, 2013 at a rate of 5.41%. PNC term debt had balances of $21,250 and $23,750 at June 30, 2011 and 2010, respectively.
Additionally, other debt consists of recourse loans, repurchase agreements and commercial investment agreements with certain commercial checking account customers. These daily borrowings had balances of $12,518 and $13,865 at June 30, 2011 and 2010, respectively.
Note G — Regulatory Capital
(Dollar amounts in thousands)
The Bank is subject to various regulatory capital requirements administered by the federal banking agencies. Failure to meet minimum capital requirements can result in certain mandatory and possibly additional discretionary actions by regulators that, if undertaken, could have a direct material effect on Parkvale’s financial statements. Under capital adequacy guidelines and the regulatory framework for prompt corrective action, the Bank must meet specific capital guidelines that involve quantitative measures of the Bank’s assets, liabilities, and certain off-balance-sheet items as calculated under regulatory accounting practices. The Bank’s capital amounts and classification are also subject to qualitative judgments by the regulators about components, risk weightings and other factors.
Quantitative measures established by regulation to ensure capital adequacy require the Bank to maintain minimum amounts and ratios of total and Tier I capital to risk weighted assets and of Tier I capital to average assets. Management believes, as of June 30, 2011, that the Bank meets all capital adequacy requirements to which it is subject.
As of June 30, 2011, the most recent notification from the Federal Deposit Insurance Corporation categorized Parkvale Savings Bank as well capitalized under the regulatory framework for prompt corrective action. There are no conditions or events since that notification that management believes have changed the Bank’s category.
The Bank’s actual regulatory capital amounts and ratios compared to minimum levels are as follows:
| Actual | For Capital Adequacy Purposes |
To Be Well Capitalized Under Prompt Corrective Action Provisions |
||||||||||||||||||||||
| Amount | Ratio | Amount | Ratio | Amount | Ratio | |||||||||||||||||||
| As of June 30, 2011: | ||||||||||||||||||||||||
| Total Capital to Risk Weighted Assets |
$ | 131,039 | 11.22 | % | $ | 93,458 | 8.00 | % | $ | 116,823 | 10.00 | % | ||||||||||||
| Tier I Capital to Risk Weighted Assets |
118,895 | 10.18 | % | 46,729 | 4.00 | % | 70,094 | 6.00 | % | |||||||||||||||
| Tier I Capital to Average Assets |
118,895 | 6.63 | % | 71,717 | 4.00 | % | 89,646 | 5.00 | % | |||||||||||||||
| As of June 30, 2010: | ||||||||||||||||||||||||
| Total Capital to Risk Weighted Assets |
$ | 127,476 | 10.44 | % | $ | 97,685 | 8.00 | % | $ | 122,106 | 10.00 | % | ||||||||||||
| Tier I Capital to Risk Weighted Assets |
113,462 | 9.29 | % | 48,843 | 4.00 | % | 73,264 | 6.00 | % | |||||||||||||||
| Tier I Capital to Average Assets |
113,462 | 6.10 | % | 74,349 | 4.00 | % | 93,937 | 5.00 | % | |||||||||||||||
84
Notes to Consolidated Financial Statements — (Continued)
Note H — Income Taxes
(Dollar amounts in thousands)
Income tax expense (credits) for the years ended June 30 are comprised of:
| 2011 | 2010 | 2009 | ||||||||||
| Federal: Current |
$ | — | $ | — | $ | 4,036 | ||||||
| Deferred |
2,930 | (10,786 | ) | (7,129 | ) | |||||||
| State |
1 | 2 | — | |||||||||
|
|
|
|
|
|
|
|||||||
| Total income tax expense (benefit) |
$ | 2,931 | ($ | 10,784 | ) | ($ | 3,093 | ) | ||||
|
|
|
|
|
|
|
|||||||
Deferred income taxes reflect the net tax effects of temporary differences between the carrying amounts of assets and liabilities for financial reporting purposes and the amounts used for income tax purposes. Significant components of Parkvale’s deferred tax assets and liabilities at June 30 are as follows:
| 2011 | 2010 | |||||||
| Deferred tax assets: |
||||||||
| Book bad debt reserves |
$ | 4,216 | $ | 4,871 | ||||
| Deferred compensation |
445 | 422 | ||||||
| Interest on deposits |
82 | 213 | ||||||
| Non-accrued interest on loans |
249 | 306 | ||||||
| Net operating loss carryforward |
1,356 | — | ||||||
| Asset writedowns |
17,049 | 20,339 | ||||||
| Deferred loan costs and premiums, net of fees |
56 | 33 | ||||||
| Unrealized losses on securities available for sale and interest rate swaps |
280 | 1 | ||||||
|
|
|
|
|
|||||
| Total deferred tax assets |
23,733 | 26,185 | ||||||
|
|
|
|
|
|||||
| Deferred tax liabilities: |
||||||||
| Purchase accounting adjustments |
(6 | ) | 138 | |||||
| Fixed assets |
272 | 142 | ||||||
| Mark to market on securities reclassed from available for sale to held to maturity |
197 | — | ||||||
| Other |
108 | 314 | ||||||
|
|
|
|
|
|||||
| Total deferred tax liabilities |
571 | 594 | ||||||
| Valuation allowances on equity security writedowns |
(1,564 | ) | (1,632 | ) | ||||
|
|
|
|
|
|||||
| Net deferred tax assets |
$ | 21,598 | $ | 23,959 | ||||
|
|
|
|
|
|||||
The net deferred tax asset of $21,598 as of June 30, 2011 includes $1,356 of net operating loss carryforward that is available for a two- year carryback and a twenty-year carryforward period. This net operating loss carryforward will begin to expire after December 31, 2030.
Under GAAP (ASC 740), a valuation allowance is required to be recognized if it is “more likely than not” that all or a portion of our deferred tax assets will not be recognized. The term “more likely than not” is defined as greater than a 50% probability of occurrence. The determination of the realizability of the deferred tax assets is highly subjective and dependent upon judgment concerning our evaluation of both positive and negative evidence, our forecast of future income, available net operating loss carryback and carryforward, applicable tax planning strategies, and assessment of current and future economic and business conditions. The valuation allowances recorded at June 30, 2011 and 2010 were related to writedowns on equity securities that are unlikely to be offset by future capital gain income. The valuation allowance decreased by $68 in fiscal 2011 due to the subsequent partial recovery on the sale of equities.
At June 30, 2011 and 2010, the Company has also conducted an analysis to determine if an additional valuation allowance was required as a result of the recent losses experienced by the Company, and concluded that an additional valuation allowance was not necessary, largely based on our projections of future taxable income and that recent losses are not expected to have a long-term impact on our operating profitability. Additional positive evidence considered in our analysis was our long-term history of generating taxable income prior to the recent economic
85
Notes to Consolidated Financial Statements — (Continued)
downturn; our current projections of positive taxable income for the 2011 tax year; the fact that the Company continued to have solid operational earnings during these loss periods; the fact that recent losses were primarily attributable to impaired investments in trust preferred securities which the Company stopped investing in during 2007 (these investment losses were a result of the economic downturn experienced systemically by the financial industry beginning in 2008); and the fact that the Company can apply the majority of its tax net operating losses in the available two-year carryback period. We conclude that the aforementioned positive evidence outweighs the negative evidence, and as a result an additional valuation allowance was not necessary at either June 30, 2011 or 2010.
Parkvale’s effective tax rate differs from the expected federal income tax rate for the years ended June 30 as follows:
| 2011 | 2010 | 2009 | ||||||||||||||||||||||
| Expected federal statutory income tax provision(benefit)/rate |
$ | 3,865 | 35.0 | % | ($ | 9,655 | ) | (35.0 | %) | ($ | 4,680 | ) | (35.0 | %) | ||||||||||
| Tax-exempt interest and dividends |
(195 | ) | (1.8 | %) | (222 | ) | (0.8 | %) | (224 | ) | (1.7 | %) | ||||||||||||
| Cash surrender value of life insurance |
(374 | ) | (3.4 | %) | (383 | ) | (1.4 | %) | (386 | ) | (2.9 | %) | ||||||||||||
| Dividends paid to ESOP participants |
(27 | ) | (0.2 | %) | (50 | ) | (0.2 | %) | (184 | ) | (1.4 | %) | ||||||||||||
| Valuation allowances on equity securities |
(68 | ) | (0.6 | %) | (734 | ) | (2.7 | %) | 2,366 | 17.7 | % | |||||||||||||
| Other |
(270 | ) | (2.5 | %) | 260 | 1.0 | % | 15 | 0.2 | % | ||||||||||||||
|
|
|
|
|
|
|
|
|
|
|
|
|
|||||||||||||
| Effective total income tax (benefit) provision |
$ | 2,931 | 26.5 | % | ($ | 10,784 | ) | (39.1 | %) | ($ | 3,093 | ) | (23.1 | %) | ||||||||||
|
|
|
|
|
|
|
|
|
|
|
|
|
|||||||||||||
The Bank is subject to the Pennsylvania Mutual Thrift Institutions Tax, which is calculated at 11.5% of Pennsylvania earnings based on accounting principles generally accepted in the United States with certain adjustments.
The Corporation had no material unrecognized tax benefits or accrued interest or penalties at June 30, 2011. If applicable, interest and penalties will be recorded as a component of noninterest expense. The Corporation is subject to income taxes in the U.S. and various state jurisdictions. Tax regulations within each jurisdiction are subject to the interpretation of the related tax laws and regulations and require application of significant judgment. With few exceptions, the Company is no longer subject to U.S. federal, state and local tax examinations by tax authorities for the years before 2006.
Note I — Employee Compensation Plans
(Dollar amounts in thousands)
Retirement Plan
Parkvale provides eligible employees participation in a 401(k) defined contribution plan. Benefit expense was $239, $257 and $450 in fiscal years 2011, 2010 and 2009, respectively, which represented a 50% company match on employees’ salary deferrals, up to a maximum of 6% of the employees’ salary and for fiscal year 2009, a profit sharing contribution equal to 2% of eligible compensation.
Employee Stock Ownership Plan
Parkvale also provides an Employee Stock Ownership Plan (“ESOP”) to all employees who have met minimum service and age requirements. Parkvale recognized expense of $131 in fiscal 2011, $584 in fiscal 2010 and $560 in fiscal 2009 for ESOP contributions, which were used to allocate additional shares of Parkvale’s Common Stock to the ESOP. Annual discretionary share awards are made on a calendar year basis with expense recognition accrued ratably throughout the year based on expected awards. At June 30, 2011, the ESOP owned 768,266 shares of Parkvale Common Stock, which are outstanding shares for EPS purposes. Cash dividends are paid quarterly to the ESOP for either dividend re-investment or distribution to vested participants at their election.
Stock Option Plans
Parkvale has Stock Option Plans for the benefit of directors, officers and other selected key employees of Parkvale who are deemed to be responsible for the future growth of Parkvale. Under the plans initiated in 1987 and 1993, there will be no further awards.
86
Notes to Consolidated Financial Statements — (Continued)
In October 2004, the 2004 Stock Incentive Plan (the “Incentive Plan”) was approved by the shareholders with an aggregate of 267,000 shares of authorized but unissued shares reserved for future grants. As of June 30, 2011, stock options for 186,500 shares have been granted and are exercisable. Parkvale measures compensation costs for all share-based payments at fair value. Stock option pre-tax compensation expense of $50, $27 and $90 has been recognized for fiscal 2011, 2010 and 2009, respectively in the Statement of Operations.
The following table presents option share data related to the stock option plans for the years indicated.
| Exercise Price Per Share |
$ | 8.49 | $ | 12.97 | $ | 15.00 | $ | 16.32 to $23.20 | $ | 22.825 | # | $ | 22.995 | $ | 25.71 | ^ | $ | 26.82 | * | $ | 27.684 | $ | 31.80 | $ | 7.50 | Total | ||||||||||||||||||||||
|
|
|
|
|
|
|
|
|
|
|
|
|
|
|
|
|
|
|
|
|
|
|
|
|
|||||||||||||||||||||||||
| Share balances at: June 30, 2008 |
— | — | — | 49,640 | 37,000 | 108,750 | 28,000 | 95,500 | 10,000 | 12,000 | — | 340,890 | ||||||||||||||||||||||||||||||||||||
|
|
|
|
|
|
|
|
|
|
|
|
|
|
|
|
|
|
|
|
|
|
|
|
|
|||||||||||||||||||||||||
| Granted |
23,000 | 12,000 | 35,000 | |||||||||||||||||||||||||||||||||||||||||||||
| Forfeited |
(48,640 | ) | (6,000 | ) | (1,000 | ) | (3,000 | ) | (58,640 | ) | ||||||||||||||||||||||||||||||||||||||
| Exercised |
(1,000 | ) | (1,000 | ) | ||||||||||||||||||||||||||||||||||||||||||||
|
|
|
|
|
|
|
|
|
|
|
|
|
|
|
|
|
|
|
|
|
|
|
|
|
|||||||||||||||||||||||||
| June 30, 2009 |
— | 23,000 | 12,000 | — | 31,000 | 107,750 | 28,000 | 92,500 | 10,000 | 12,000 | — | 316,250 | ||||||||||||||||||||||||||||||||||||
|
|
|
|
|
|
|
|
|
|
|
|
|
|
|
|
|
|
|
|
|
|
|
|
|
|||||||||||||||||||||||||
| Granted |
12,000 | 12,000 | ||||||||||||||||||||||||||||||||||||||||||||||
| Forfeited |
(16,000 | ) | (16,000 | ) | ||||||||||||||||||||||||||||||||||||||||||||
|
|
|
|
|
|
|
|
|
|
|
|
|
|
|
|
|
|
|
|
|
|
|
|
|
|||||||||||||||||||||||||
| June 30, 2010 |
12,000 | 23,000 | 12,000 | — | 15,000 | 107,750 | 28,000 | 92,500 | 10,000 | 12,000 | — | 312,250 | ||||||||||||||||||||||||||||||||||||
|
|
|
|
|
|
|
|
|
|
|
|
|
|
|
|
|
|
|
|
|
|
|
|
|
|||||||||||||||||||||||||
| Granted |
12,000 | 12,000 | ||||||||||||||||||||||||||||||||||||||||||||||
| Forfeited |
(3,000 | ) | (7,000 | ) | (10,000 | ) | (6,500 | ) | (26,500 | ) | ||||||||||||||||||||||||||||||||||||||
|
|
|
|
|
|
|
|
|
|
|
|
|
|
|
|
|
|
|
|
|
|
|
|
|
|||||||||||||||||||||||||
| June 30, 2011 |
12,000 | 20,000 | 12,000 | — | 8,000 | 97,750 | 28,000 | 86,000 | 10,000 | 12,000 | 12,000 | 297,750 | ||||||||||||||||||||||||||||||||||||
|
|
|
|
|
|
|
|
|
|
|
|
|
|
|
|
|
|
|
|
|
|
|
|
|
| * | Represents the average exercise price of awards made in October 2007 and December 2007. |
| # | Represents the average remaining exercise price of awards made in fiscal 1999 through fiscal 2002. |
| ^ | Represents the average remaining exercise price of Director awards made in fiscal 2003 through fiscal 2005. |
Black-Scholes option pricing model assumptions are as follows:
| 2011 | 2010 | 2009 | ||||||||||
| Weighted average grant date fair value per option |
$ | 4.16 | $ | 2.26 | $ | 2.55 | ||||||
| Risk-free rate |
2.70 | % | 2.86 | % | 1.17 | % | ||||||
| Dividend yield |
1.07 | % | 2.36 | % | 2.60 | % | ||||||
| Volatility factor |
0.57 | 0.28 | 0.38 | |||||||||
| Expected Life in years |
8 | 8 | 8 | |||||||||
Note J — Net Gain (Loss) on Sale and (Writedown) of Assets
(Dollar amounts in thousands)
The following chart summarizes the gains, losses and writedowns by fiscal year ended June 30:
| 2011 | 2010 | 2009 | ||||||||||
| Loans held for sale |
$ | — | $ | — | $ | 186 | ||||||
| Fixed Assets |
(47 | ) | — | — | ||||||||
| Available for sale securities gains/recoveries |
1,364 | 2,372 | 2,060 | |||||||||
| (Writedown) for impairment losses on securities: |
||||||||||||
| Trust preferred securities |
(4,471 | ) | (45,068 | ) | (18,060 | ) | ||||||
| Bank of America preferred stocks |
— | — | (6,269 | ) | ||||||||
| Freddie Mac preferred stocks |
— | — | (2,772 | ) | ||||||||
| Common equities |
— | — | (1,401 | ) | ||||||||
| Corporate debt |
— | — | (1,361 | ) | ||||||||
| Non-agency CMO |
— | (19,594 | ) | (1,766 | ) | |||||||
|
|
|
|
|
|
|
|||||||
| Subtotal of writedowns and losses |
(4,471 | ) | (64,662 | ) | (31,629 | ) | ||||||
| Non-credit related losses on securities recognized in other comprehensive income |
2,157 | 25,685 | 1,266 | |||||||||
|
|
|
|
|
|
|
|||||||
| Net loss on sale and writedown of assets |
($ | 997 | ) | ($ | 36,605 | ) | ($ | 28,117 | ) | |||
|
|
|
|
|
|
|
|||||||
87
Notes to Consolidated Financial Statements — (Continued)
Note K — Leases
(Dollar amounts in thousands)
Parkvale’s rent expense for leased real properties amounted to approximately $1,307 in 2011, $1,319 in 2010 and $1,327 in 2009. At June 30, 2011, Parkvale was obligated under 23 noncancellable operating leases, which expire through 2040. The minimum rental commitments for the fiscal years subsequent to June 30, 2011 are as follows: 2012 — $1,255, 2013 — $1,184, 2014 — $974, 2015 — $610, 2016 — $504 and later years — $2,594.
Note L — Selected Balance Sheet Information
(Dollar amounts in thousands)
Selected balance sheet data at June 30 is summarized as follows:
| Prepaid expenses and other assets: |
2011 | 2010 | Other liabilities: |
2011 | 2010 | |||||||||||||
| Accrued interest on loans |
$ | 4,834 | $ | 4,936 | Accounts payable and accrued expenses | $ | 1,821 | $ | 1,976 | |||||||||
| Reserve for uncollected interest |
(1,237 | ) | (1,211 | ) | Other liabilities | 1,914 | 891 | |||||||||||
| Bank Owned Life Insurance |
26,356 | 25,288 | Dividends payable | 315 | 479 | |||||||||||||
| Accrued interest on investments |
2,655 | 2,473 | Accrued interest on debt | 847 | 902 | |||||||||||||
| Prepaid FDIC Insurance |
7,263 | 10,353 | Federal and state income taxes payable | 372 | 1 | |||||||||||||
| Other prepaids |
7,301 | 10,737 | ||||||||||||||||
| Net deferred tax asset |
21,598 | 23,959 | ||||||||||||||||
|
|
|
|
|
|
|
|
|
|||||||||||
| Total prepaid expenses and other assets |
$ | 68,770 | $ | 76,535 | Total other liabilities | $ | 5,269 | $ | 4,249 | |||||||||
|
|
|
|
|
|
|
|
|
|||||||||||
Note M — Quarterly Consolidated Statements of Operations (Unaudited)
(Dollar amounts in thousands, except per share data)
| Three Months Ended | Year Ended |
|||||||||||||||||||
| Sep. 10 | Dec. 10 | Mar. 11 | June 11 | June 11 | ||||||||||||||||
| Total interest income |
$ | 16,839 | $ | 16,363 | $ | 15,982 | $ | 15,610 | $ | 64,794 | ||||||||||
| Total interest expense |
7,980 | 7,151 | 6,883 | 6,685 | 28,699 | |||||||||||||||
|
|
|
|
|
|
|
|
|
|
|
|||||||||||
| Net interest income |
8,859 | 9,212 | 9,099 | 8,925 | 36,095 | |||||||||||||||
| Provision for loan losses |
1,034 | 1,015 | 691 | 791 | 3,531 | |||||||||||||||
|
|
|
|
|
|
|
|
|
|
|
|||||||||||
| Net interest income after provision for losses |
7,825 | 8,197 | 8,408 | 8,134 | 32,564 | |||||||||||||||
| Net impairment losses recognized in earnings |
(996 | ) | (946 | ) | (255 | ) | (117 | ) | (2,314 | ) | ||||||||||
| Noninterest income |
4,082 | 2,762 | 2,474 | 2,580 | 11,898 | |||||||||||||||
| Noninterest expense |
8,050 | 7,652 | 7,835 | 7,566 | 31,103 | |||||||||||||||
|
|
|
|
|
|
|
|
|
|
|
|||||||||||
| Income (loss) before income taxes |
2,861 | 2,361 | 2,792 | 3,031 | 11,045 | |||||||||||||||
| Income tax expense (benefit) |
638 | 520 | 845 | 928 | 2,931 | |||||||||||||||
|
|
|
|
|
|
|
|
|
|
|
|||||||||||
| Net income (loss) |
$ | 2,223 | $ | 1,841 | $ | 1,947 | $ | 2,103 | $ | 8,114 | ||||||||||
|
|
|
|
|
|
|
|
|
|
|
|||||||||||
| Preferred Stock Dividend |
397 | 397 | 397 | 397 | 1,588 | |||||||||||||||
| Income (loss) to common shareholders |
$ | 1,826 | $ | 1,444 | $ | 1,550 | $ | 1,706 | $ | 6,526 | ||||||||||
|
|
|
|
|
|
|
|
|
|
|
|||||||||||
| Net income (loss) per common share: |
||||||||||||||||||||
| Basic |
$ | 0.33 | $ | 0.26 | $ | 0.28 | $ | 0.30 | $ | 1.17 | ||||||||||
| Diluted |
$ | 0.33 | $ | 0.26 | $ | 0.28 | $ | 0.30 | $ | 1.17 | ||||||||||
|
|
|
|
|
|
|
|
|
|
|
|||||||||||
88
Notes to Consolidated Financial Statements — (Continued)
| Year Ended |
||||||||||||||||||||
| Three Months Ended | ||||||||||||||||||||
| Sep. 09 | Dec. 09 | Mar. 10 | June 10 | June 10 | ||||||||||||||||
| Total interest income |
$ | 20,022 | $ | 19,300 | $ | 18,632 | $ | 17,907 | $ | 75,861 | ||||||||||
| Total interest expense |
10,704 | 10,210 | 9,218 | 8,383 | 38,515 | |||||||||||||||
|
|
|
|
|
|
|
|
|
|
|
|||||||||||
| Net interest income |
9,318 | 9,090 | 9,414 | 9,524 | 37,346 | |||||||||||||||
| Provision for loan losses |
2,289 | 1,398 | 1,164 | 2,597 | 7,448 | |||||||||||||||
|
|
|
|
|
|
|
|
|
|
|
|||||||||||
| Net interest income after provision for losses |
7,029 | 7,692 | 8,250 | 6,927 | 29,898 | |||||||||||||||
| Net impairment losses recognized in earnings |
(2,761 | ) | (782 | ) | (1,044 | ) | (34,390 | ) | (38,977 | ) | ||||||||||
| Noninterest income |
3,664 | 3,588 | 2,551 | 2,640 | 12,443 | |||||||||||||||
| Noninterest expense |
7,792 | 7,542 | 7,966 | 7,648 | 30,948 | |||||||||||||||
|
|
|
|
|
|
|
|
|
|
|
|||||||||||
| Income (loss) before income taxes |
140 | 2,956 | 1,791 | (32,471 | ) | (27,584 | ) | |||||||||||||
| Income tax expense (benefit) |
(585 | ) | 679 | 437 | (11,315 | ) | (10,784 | ) | ||||||||||||
|
|
|
|
|
|
|
|
|
|
|
|||||||||||
| Net income (loss) |
$ | 725 | $ | 2,277 | $ | 1,354 | ($ | 21,156 | ) | ($ | 16,800 | ) | ||||||||
|
|
|
|
|
|
|
|
|
|
|
|||||||||||
| Preferred Stock Dividend |
397 | 397 | 397 | 397 | 1,588 | |||||||||||||||
| Income (loss) to common shareholders |
$ | 328 | $ | 1,880 | $ | 957 | ($ | 21,553 | ) | ($ | 18,388 | ) | ||||||||
|
|
|
|
|
|
|
|
|
|
|
|||||||||||
| Net income (loss) per common share: |
||||||||||||||||||||
| Basic |
$ | 0.06 | $ | 0.35 | $ | 0.17 | ($ | 3.94 | ) | ($ | 3.36 | ) | ||||||||
| Diluted |
$ | 0.06 | $ | 0.35 | $ | 0.17 | ($ | 3.94 | ) | ($ | 3.36 | ) | ||||||||
Note N — Parent Company Condensed Financial Statements (Dollar amounts in thousands)
The condensed balance sheets and statements of income and cash flows for Parkvale Financial Corporation as of June 30, 2011 and 2010 and the years then ended are presented below. PFC’s primary subsidiary is Parkvale Savings Bank (“PSB”).
| Statements of Financial Condition |
2011 | 2010 | ||||||
| Assets: |
||||||||
| Investment in PSB |
$ | 141,502 | $ | 139,818 | ||||
| Cash |
4,552 | 1,750 | ||||||
| Other equity investments |
— | 680 | ||||||
| Other assets |
60 | 343 | ||||||
| Deferred taxes |
30 | 157 | ||||||
|
|
|
|
|
|||||
| Total assets |
$ | 146,144 | $ | 142,748 | ||||
|
|
|
|
|
|||||
| Liabilities and Shareholders’ Equity: |
||||||||
| Accounts payable |
$ | 365 | $ | 645 | ||||
| Term debt |
21,250 | 23,750 | ||||||
| Dividends payable |
315 | 480 | ||||||
| Shareholders’ equity |
124,214 | 117,873 | ||||||
|
|
|
|
|
|||||
| Total liabilities and shareholders’ equity |
$ | 146,144 | $ | 142,748 | ||||
|
|
|
|
|
|||||
89
Notes to Consolidated Financial Statements — (Continued)
| Statements of Operations |
2011 | 2010 | 2009 | |||||||||
| Dividends from PSB |
$ | 6,786 | $ | 3,400 | $ | 1,950 | ||||||
| (Loss) gain on sale of assets |
191 | — | (1,376 | ) | ||||||||
| Other income |
152 | 162 | 200 | |||||||||
| Operating expenses |
(987 | ) | (1,274 | ) | (1,002 | ) | ||||||
|
|
|
|
|
|
|
|||||||
| Income before equity in undistributed earnings of subsidiary |
6,142 | 2,288 | (228 | ) | ||||||||
| Equity in undistributed income (loss) of PSB |
1,972 | (19,088 | ) | (10,050 | ) | |||||||
|
|
|
|
|
|
|
|||||||
| Net income (loss) |
$ | 8,114 | ($ | 16,800 | ) | ($ | 10,278 | ) | ||||
|
|
|
|
|
|
|
|||||||
| Year ended June 30, | ||||||||||||
| Statements of Cash Flows |
2011 | 2010 | 2009 | |||||||||
| Cash flows from operating activities: |
||||||||||||
| Management fee income received |
$ | 144 | $ | 144 | $ | 144 | ||||||
| Dividends received |
6,786 | 3,400 | 1,950 | |||||||||
| Taxes received from PSB |
400 | 425 | 276 | |||||||||
| Cash paid to suppliers |
(916 | ) | (1,779 | ) | (797 | ) | ||||||
|
|
|
|
|
|
|
|||||||
| Net cash provided by operating activities |
6,414 | 2,190 | 1,573 | |||||||||
|
|
|
|
|
|
|
|||||||
| Cash flows from investing activities: |
||||||||||||
| (Repayment) proceeds of term debt |
(2,500 | ) | (1,250 | ) | 25,000 | |||||||
| Proceeds of TARP CPP |
— | — | 31,762 | |||||||||
| Additional Investment in PSB |
— | — | (50,000 | ) | ||||||||
| Proceeds from available for sale security sales |
665 | — | 368 | |||||||||
|
|
|
|
|
|
|
|||||||
| Net cash (used in) provided by investing activities |
(1,835 | ) | (1,250 | ) | 7,130 | |||||||
|
|
|
|
|
|
|
|||||||
| Cash flows from financing activities: |
||||||||||||
| Payment for treasury stock |
— | — | (717 | ) | ||||||||
| Allocation of treasury stock to benefit plans |
421 | 703 | — | |||||||||
| Dividends paid to stockholders |
(2,198 | ) | (2,683 | ) | (5,426 | ) | ||||||
| Stock options exercised |
— | — | 21 | |||||||||
|
|
|
|
|
|
|
|||||||
| Net cash used in financing activities |
(1,777 | ) | (1,980 | ) | (6,122 | ) | ||||||
|
|
|
|
|
|
|
|||||||
| Net increase (decrease) in cash and cash equivalents |
2,802 | (1,040 | ) | 2,581 | ||||||||
| Cash and cash equivalents at beginning of year |
1,750 | 2,790 | 209 | |||||||||
|
|
|
|
|
|
|
|||||||
| Cash and cash equivalents at end of year |
$ | 4,552 | $ | 1,750 | $ | 2,790 | ||||||
|
|
|
|
|
|
|
|||||||
| Net income (loss) |
$ | 8,114 | ($ | 16,800 | ) | ($ | 10,278 | ) | ||||
| Adjustments to reconcile net income to net cash provided by operating activities: |
||||||||||||
| Distributed (undistributed) income of PSB |
(1,972 | ) | 19,088 | 10,050 | ||||||||
| Taxes received from PSB |
400 | 425 | 276 | |||||||||
| Decrease (increase) in other assets |
368 | 90 | 1,482 | |||||||||
| Decrease (increase) in accrued expenses |
(496 | ) | (613 | ) | 43 | |||||||
|
|
|
|
|
|
|
|||||||
| Net cash provided by operating activities |
$ | 6,414 | $ | 2,190 | $ | 1,573 | ||||||
|
|
|
|
|
|
|
|||||||
90
Notes to Consolidated Financial Statements — (Continued)
Note O — Fair Value of Financial Instruments
(Dollar amounts in thousands)
US GAAP requires a hierarchal disclosure framework associated with the level of pricing observations utilized in measuring assets and liabilities at fair value. This hierarchy requires the use of observable market data when available. The three broad levels of hierarchy are as follows:
| Level I - | Quoted prices are available in the active markets for identical assets or liabilities as of the measurement date. | |
| Level II - | Pricing inputs are other than quoted prices in active markets, which are either directly or indirectly observable as of the measurement date. The nature of these assets and liabilities includes items for which quoted prices are available but traded less frequently, and items that are fair valued using other financial instruments, the parameters of which can be directly observed. | |
| Level III - | Valuations derived from valuation techniques in which one or more significant inputs or significant value drivers are unobservable. Level III valuations incorporate certain assumptions and projections in determining the fair value assigned to such assets or liabilities. | |
The following table presents the assets and liabilities reported on the consolidated statements of financial condition at their fair value as of June 30, 2011 by level within the fair value hierarchy. Financial assets and liabilities are classified in their entirety based on the lowest level of input that is significant to the fair value measurement. Equity securities in the available-for-sale (“AFS”) security portfolio are measured at fair value using quoted market prices and classified within Level I of the valuation hierarchy. Mutual funds in the available-for-sale security portfolio are measured at fair value using Level II valuation hierarchy. Interest rate swaps are priced using other similar financial instruments and are classified as Level II.
| Financial Instruments - Measured on a recurring basis | ||||||||||||||||||||||||||||||||
| June 30, 2011 | June 30, 2010 | |||||||||||||||||||||||||||||||
| Level I | Level II | Level III | Total | Level I | Level II | Level III | Total | |||||||||||||||||||||||||
| Available for sale securities: |
||||||||||||||||||||||||||||||||
| CMOs – Non Agency (Residential) |
$ | — | $ | — | $ | — | $ | — | $ | — | $ | 59,804 | $ | — | $ | 59,804 | ||||||||||||||||
| Common Equities |
1 | — | — | 1 | 682 | — | — | 682 | ||||||||||||||||||||||||
| Mutual Fund – ARM mortgages |
— | 5,244 | — | 5,244 | — | 5,284 | — | 5,284 | ||||||||||||||||||||||||
| Interest rate swaps |
— | 539 | — | 539 | — | 494 | — | 494 | ||||||||||||||||||||||||
|
|
|
|
|
|
|
|
|
|
|
|
|
|
|
|
|
|||||||||||||||||
| Total |
$ | 1 | $ | 5,783 | $ | — | $ | 5,784 | $ | 682 | $ | 65,582 | $ | — | $ | 66,264 | ||||||||||||||||
|
|
|
|
|
|
|
|
|
|
|
|
|
|
|
|
|
|||||||||||||||||
The following table presents the assets measured on a nonrecurring basis on the consolidated statements of financial condition at their fair value as of June 30, 2011. In cases where valuation techniques included inputs that are unobservable and are based on estimates and assumptions developed by the reporting entity based on the best information available under each circumstance, the asset valuation is classified as Level III inputs. Pooled trust preferred securities and impaired loans are measured using Level III valuation hierarchy. Our pooled trust preferred securities are collateralized by the trust preferred securities of individual banks, thrifts and bank holding companies, and to a lesser extent, insurance companies. There has been little or no active trading in these securities for approximately twenty-four months; therefore it was more appropriate to determine estimated fair value using a discounted cash flow analysis. The discount rate applied to the cash flows is determined by evaluating the current market yields for comparable corporate and structured credit products along with an evaluation of the risks associated with the cash flows of the comparable security. Due to the fact that there is no active market for the pooled trust preferred collateralized debt obligations, one key reference point is the market yield for the single issue trust preferred securities issued by banks and thrifts for which there is more activity than for the pooled securities. Adjustments are then made to reflect the credit and structural differences between these two security types.
The estimated fair value of impaired loans is based upon the estimated fair value of the collateral less estimated selling costs when the loan is collateral dependent, or based upon the present value of expected future cash flows available to pay the loan. Collateral values are generally based upon appraisals from approved, independent state certified appraisers.
The estimated fair value of foreclosed real estate is comprised of commercial and residential real estate properties obtained in partial or total satisfaction of loan obligations. Foreclosed real estate acquired in settlement of
91
Notes to Consolidated Financial Statements — (Continued)
indebtedness is recorded at the lower of the carrying amount of the loan or fair value less costs to sell. Subsequently, these assets are carried at the lower of the carrying value or fair value less costs to sell. Accordingly, it may be necessary to record nonrecurring fair value adjustments. Fair value, when recorded, is generally based upon appraisals by licensed or certified appraisers and is classified as Level II.
| Level I | Level II | Level III | Total | |||||||||||||
| Assets Measured on a Nonrecurring Basis: |
||||||||||||||||
| OTTI – Held to maturity trust preferred securities |
— | — | $ | 11,363 | $ | 11,363 | ||||||||||
| Impaired loans |
— | — | 22,443 | 22,443 | ||||||||||||
| Impaired foreclosed real estate |
— | 3,494 | — | 3,494 | ||||||||||||
Impaired loans measured or re-measured at fair value on a nonrecurring basis during 2011 had a carrying amount of $28,925 and an allocated allowance for loan losses of $6,482 at June 30, 2011. The allocated allowance is based on a fair value of $22,443 and considers costs to sell. The carrying value of the foreclosed real estate was $4,216 with an allowance of $722 at June 30, 2011, and the charge to earnings during fiscal 2011 related to impaired foreclosed real estate was $671.
The following table presents the assets measured on a nonrecurring basis on the consolidated statements of financial condition at their fair value as of June 30, 2010.
| Level I | Level II | Level III | Total | |||||||||||||
| Assets Measured on a Nonrecurring Basis: |
||||||||||||||||
| OTTI – Held to maturity trust preferred securities |
— | — | $ | 6,652 | $ | 6,652 | ||||||||||
| Impaired loans |
— | — | 9,687 | 9,687 | ||||||||||||
| Impaired foreclosed real estate |
— | 2,347 | — | 2,347 | ||||||||||||
Impaired loans measured or re-measured at fair value on a nonrecurring basis during 2010 had a carrying amount of $14,882 and an allocated allowance for loan losses of $5,195 at June 30, 2010. The allocated allowance is based on a fair value of $9,687 and considers costs to sell. The carrying value of the foreclosed real estate was $3,136 with an allowance of $789 at June 30, 2010, and the charge to earnings during fiscal 2010 related to impaired foreclosed real estate was $745.
US GAAP requires the determination of fair value for certain assets, liabilities and contingent liabilities. The carrying amount approximates fair value for the following categories:
Cash and Noninterest-Bearing Deposits, which includes noninterest-bearing demand deposits
Federal Funds Sold
Interest-Earning Deposits in Other Banks
Accrued interest
Cash Surrender Value (CSV) of Bank Owned Life Insurance (BOLI)
Checking, savings and money market accounts
The following methods and assumptions were used to estimate the fair value of other classes of financial instruments as of June 30, 2011 and June 30, 2010.
Investment Securities: The fair values of investment securities are obtained from the Interactive Data Corporation pricing service and various investment brokers for securities not available from public sources. Prices on certain trust preferred securities were calculated using a discounted cash flow model based upon market spreads for longer term securities as permitted for Level III assets when market quotes are not available. See accompanying notes for additional information on investment securities.
Loans Receivable: Fair values were estimated by discounting contractual cash flows using interest rates currently being offered for loans with similar credit quality adjusted for prepayment assumptions.
Deposit Liabilities: Fair values of commercial investment agreements and fixed-maturity certificates of deposit are estimated using a discounted cash flow calculation that applies interest rates currently being offered on commercial investment agreements or time deposits of similar remaining maturities.
Advances from Federal Home Loan Bank: Fair value is determined by discounting the advances using estimated incremental borrowing rates for similar types of borrowing arrangements.
Term Debt and Other Debt: Fair value is determined by discounting the term and other debt using estimated incremental borrowing rates for similar types of borrowing arrangements.
Off-Balance-Sheet Instruments: Fair value for off-balance-sheet instruments (primarily loan commitments) are estimated using internal valuation models and are limited to fees charged to enter into similar agreements, taking into account the remaining terms of the agreements and the counterparties’ credit standing. Unused consumer and commercial lines of credit are assumed equal to the outstanding commitment amount due to the variable interest rate attached to these lines of credit.
92
Notes to Consolidated Financial Statements — (Continued)
| 2011 | 2010 | |||||||||||||||
| Estimated Fair Value |
Carrying Value |
Estimated Fair Value |
Carrying Value |
|||||||||||||
| Financial Assets: |
||||||||||||||||
| Cash and noninterest-earning deposits |
$ | 18,713 | $ | 18,713 | $ | 17,736 | $ | 17,736 | ||||||||
| Federal funds sold |
126,642 | 126,642 | 135,773 | 135,773 | ||||||||||||
| Interest-earning deposits in other banks |
4,463 | 4,463 | 801 | 801 | ||||||||||||
| Investment securities AFS |
5,245 | 5,245 | 65,770 | 65,770 | ||||||||||||
| Investment securities HTM |
531,116 | 532,189 | 437,931 | 443,452 | ||||||||||||
| FHLB stock |
12,310 | 12,310 | 14,357 | 14,357 | ||||||||||||
| Loans receivable |
1,033,775 | 1,001,749 | 1,087,009 | 1,050,755 | ||||||||||||
| Accrued interest receivable |
7,489 | 7,489 | 7,409 | 7,409 | ||||||||||||
| CSV of BOLI |
26,356 | 26,356 | 25,288 | 25,288 | ||||||||||||
|
|
|
|
|
|
|
|
|
|||||||||
| Financial Liabilities: |
||||||||||||||||
| Checking, savings and money market accounts |
$ | 743,021 | $ | 743,021 | $ | 696,664 | $ | 696,664 | ||||||||
| Certificates of deposit |
762,128 | 741,903 | 812,339 | 791,409 | ||||||||||||
| Advances from Federal |
||||||||||||||||
| Home Loan Bank |
168,725 | 150,857 | 204,699 | 185,973 | ||||||||||||
| Term Debt |
21,789 | 21,250 | 24,244 | 23,750 | ||||||||||||
| Commercial investment agreements |
11,893 | 12,518 | 13,156 | 13,865 | ||||||||||||
| Interest rate swap |
539 | 539 | 494 | 494 | ||||||||||||
| Accrued interest payable |
847 | 847 | 902 | 902 | ||||||||||||
|
|
|
|
|
|
|
|
|
|||||||||
| Off-Balance Sheet Instruments Loan Commitments |
$ | 126 | $ | — | $ | 118 | $ | — | ||||||||
|
|
|
|
|
|
|
|
|
|||||||||
Note P — Acquisition
(Dollar amounts in thousands)
On June 15, 2011, Parkvale Financial Corporation (“Parkvale”), the parent company of Parkvale Savings Bank (“Parkvale Savings”), and F.N.B. Corporation (“FNB”) the parent company of First National Bank of Pennsylvania (“FNB Bank”), entered into an Agreement and Plan of Merger (the “Merger Agreement”) pursuant to which Parkvale will merge with and into FNB (the “Merger”). Promptly following consummation of the Merger, it is expected that Parkvale Savings will merge with and into FNB Bank (the “Bank Merger”).
Under the terms of the Merger Agreement, shareholders of Parkvale will receive 2.178 shares (the “Exchange Ratio”) of FNB common stock for each share of common stock they own. The Merger Agreement also provides that all options to purchase Parkvale stock which are outstanding and unexercised immediately prior to the closing (“Continuing Options”) shall be converted into fully vested and exercisable options to purchase shares of FNB common stock, as adjusted for the Exchange Ratio.
The transaction is expected to close during the March 31, 2012 quarter.
Item 9. Changes In and Disagreements with Accountants on Accounting and Financial Disclosures.
None.
Item 9A. Controls and Procedures.
The Corporation’s management, under the supervision of and with the participation of the Corporation’s Chief Executive Officer and Chief Financial Officer, has carried out an evaluation of the design and effectiveness of the Corporation’s disclosure controls and procedures as defined in Rule 13a-15e and Rule 15d-15(e) of the Securities Exchange Act of 1934 as of the end of the period covered by this report. Based upon that evaluation, the Chief Executive Officer and Chief Financial Officer have concluded that while the Corporation’s disclosure controls and procedures are designed to ensure that all material information required to be disclosed in reports the Corporation files
93
or submits under the Securities Exchange Act of 1934 is recorded, processed, summarized and reported within the time periods specified in the Securities and Exchange Commission’s rules and forms, the internal control over financial reporting as it relates to the one deficiency described below was not effective as of June 30, 2011.
There were no significant changes in the Corporation’s internal control over financial reporting that occurred during the period covered by this report that have materially affected, or that are reasonably likely to affect, our internal control over financial reporting.
94
MANAGEMENT’S REPORT ON INTERNAL CONTROL OVER FINANCIAL REPORTING
The management of Parkvale Financial Corporation (the “Company”) is responsible for establishing and maintaining adequate internal control over financial reporting.
The Company’s internal control over financial reporting is a process designed to provide reasonable assurance regarding the reliability of financial reporting and the preparation of financial statements for external purposes in accordance with generally accepted accounting principles and includes those policies and procedures that:
| • | Pertain to the maintenance of records that, in reasonable detail, accurately and fairly reflect the transactions and dispositions of the assets of the Company; |
| • | Provide reasonable assurance that transactions are recorded as necessary to permit preparation of financial statements in accordance with generally accepted accounting principles, and that receipts and expenditures of the Company are being made only in accordance with authorizations of management and the board of directors of the Company; and |
| • | Provide reasonable assurance regarding prevention or timely detection of unauthorized acquisition, use, or disposition of the Company’s assets that could have a material effect on the financial statements. |
Because of its inherent limitations, internal control over financial reporting may not prevent or detect misstatements. Also, projections of any evaluation of effectiveness to future periods are subject to risk that controls may become inadequate because of changes in conditions or because of declines in the degree of compliance with the policies or procedures.
The Company’s management assessed the effectiveness of the Company’s internal control over financial reporting as of June 30, 2011. In making this assessment, the Company’s management used the criteria set forth by the Committee of Sponsoring Organizations of the Treadway Commission (“COSO”) in Internal Control-Integrated Framework.
In connection with the completion of our testing of the internal controls and an audit of our financial statements for the year ended June 30, 2011 under the COSO Framework, management identified a material weakness in our internal control over financial reporting as described below:
| • | incorrect accrual of FDIC deposit insurance premium expense related to the support for the manual posting of accounting entries. |
Based on our evaluation under the COSO Framework, management concluded that our internal control over financial reporting as it relates to the one deficiency noted was not effective as of June 30, 2011.
ParenteBeard LLC, the Company’s independent registered public accounting firm, has issued an audit report on our assessment of the Company’s internal control over financial reporting. See “Report of Independent Registered Public Accounting Firm on Internal Control Over Financial Reporting” within this report.
Remediation of Material Weakness
Management has evaluated the effect of the facts leading to this error and the Company’s prior conclusions of the adequacy of its internal control over financial reporting and disclosure controls and procedures reported on as part of the filing of Form 10-K for the year ended June 30, 2011. Management is committed to maintaining effective internal control over financial reporting and has taken steps to remediate the internal control weakness. The consolidated statements of operations for the fiscal years ended June 30, 2011, 2010 and 2009 as presented properly reflect the FDIC deposit insurance premium accrual.
| Robert J. McCarthy, Jr. | Gilbert A. Riazzi | |
| President and Chief Executive Officer |
Chief Financial Officer |
September 27, 2011
95
Report Of Independent Registered Public Accounting Firm
On Internal Control Over Financial Reporting
The Board of Directors and Shareholders of Parkvale Financial Corporation:
We have audited Parkvale Financial Corporation and subsidiaries (the Company) internal control over financial reporting as of June 30, 2011, based on criteria established in Internal Control — Integrated Framework issued by the Committee of Sponsoring Organizations of the Treadway Commission (COSO). The Company’s management is responsible for maintaining effective internal control over financial reporting and for its assessment of the effectiveness of internal control over financial reporting, included in the accompanying Management Report on Effectiveness on Internal Control over Financial Reporting in Item 9A. Our responsibility is to express an opinion on the Company’s internal control over financial reporting based on our audit.
We conducted our audit in accordance with the standards of the Public Company Accounting Oversight Board (United States). Those standards require that we plan and perform the audit to obtain reasonable assurance about whether effective internal control over financial reporting was maintained in all material respects. Our audit included obtaining an understanding of internal control over financial reporting, assessing the risk that a material weakness exists, and testing and evaluating the design and operating effectiveness of internal control based on the assessed risk. Our audit also included performing such other procedures as we considered necessary in the circumstances. We believe that our audit provides a reasonable basis for our opinion.
A company’s internal control over financial reporting is a process designed to provide reasonable assurance regarding the reliability of financial reporting and the preparation of financial statements for external purposes in accordance with generally accepted accounting principles. A company’s internal control over financial reporting includes those policies and procedures that (1) pertain to the maintenance of records that, in reasonable detail, accurately and fairly reflect the transactions and dispositions of the assets of the company; (2) provide reasonable assurance that transactions are recorded as necessary to permit preparation of financial statements in accordance with generally accepted accounting principles, and that receipts and expenditures of the company are being made only in accordance with authorizations of management and directors of the company; and (3) provide reasonable assurance regarding prevention or timely detection of unauthorized acquisition, use, or disposition of the company’s assets that could have a material effect on the financial statements.
Because of its inherent limitations, internal control over financial reporting may not prevent or detect misstatements. Also, projections of any evaluation of effectiveness to future periods are subject to the risk that controls may become inadequate because of changes in conditions, or that the degree of compliance with the policies or procedures may deteriorate.
A material weakness is a deficiency, or a combination of deficiencies, in internal control over financial reporting, such that there is a reasonable possibility that a material misstatement of the company’s annual or interim financial statements will not be prevented or detected on a timely basis. A material weakness has been identified and included in Management Report on Internal Controls Over Financial Reporting in the area of FDIC deposit insurance premium expense related to the support for the manual posting of accounting entries.
We also have audited, in accordance with the standards of the Public Company Accounting Oversight Board (United States), the consolidated statements of financial condition as of June 30, 2011 and 2010 and the related consolidated statements of operations, cash flows, and shareholders’ equity for each of the years in the three-year period ended June 30, 2011 of the Company. The aforementioned material weakness was considered in determining the nature, timing, and extent of audit tests applied in our audit of the June 30, 2011 consolidated financial statements, and this report does not affect our report dated September 27, 2011, which expressed an unqualified opinion on those consolidated financial statements.
In our opinion, because of the effect of the aforementioned material weakness on the achievement of the objectives of the control criteria, the Company has not maintained effective internal control over financial reporting as of June 30, 2011, based on criteria established in Internal Control — Integrated Framework issued by COSO.
| /s/ ParenteBeard LLC
ParenteBeard LLC Pittsburgh, Pennsylvania |
| September 27, 2011 |
96
Item 9B. Other Information
None.
Part III.
Item 10. Directors, Executive Officers and Corporate Governance.
Our Articles of Incorporation provide that the Board of Directors shall be divided into three classes as nearly equal in number as possible. The directors are elected by our shareholders for staggered terms and until their successors are elected and qualified.
The following tables present information concerning each director. Ages are reflected as of August 29, 2011. Where applicable, service as a director includes service as a director of Parkvale Bank.
| Directors Whose Term Expires in 2011 | ||||||
| Name |
Age | Principal Occupation During the Past Five Years |
Director Since | |||
| Fred P. Burger, Jr. |
84 | Director; retired, former President of Burger Agency, Inc., a real estate brokerage firm and insurance agency from 1948 to 2006. |
1981 | |||
| Harry D. Reagan |
78 | Director; retired, Chief Executive Officer of Masontown Division of Parkvale Bank from February 1, 2002 until retirement on December 31, 2002; formerly Chairman of the Board of The Second National Bank of Masontown (SNB) prior to the merger of SNB into Parkvale Bank on January 31, 2002; Chief Executive Officer of SNB from 1988 to 2002. |
2003 | |||
| Directors Whose Term Expires in 2012 | ||||||
| Name |
Age | Principal Occupation During the Past Five Years |
Director | |||
| Andrea F. Fitting, Ph.D. |
57 | Director; President and Chief Executive Officer of Fitting Group, Inc., formerly known as Fitting Creative, Inc., since 1995 and President of Fitting Communications, Inc. from 1986 to 1995, marketing communications firms; former Commissioner of the Pennsylvania Historical and Museum Commission. |
1998 | |||
| Stephen M. Gagliardi |
63 | Director; retired; formerly President, Chief Executive Officer and Chairman of the Board of Advance Financial Bancorp from 1985 until merger into the Corporation on December 31, 2004. |
2006 | |||
| Robert D. Pfischner |
89 | Chairman of the Board; retired, former President of E.T. Lippert Saw Co., a manufacturer of saw blades for industry and a fabricator of armor plate from 1973 to 2003; Trustee of St. Barnabas Health System, Inc. since 2008. |
1968 | |||
97
| Directors Whose Term Expires in 2013 | ||||||
| Name |
Age | Principal Occupation During the Past Five Years |
Director Since | |||
| Robert J. McCarthy, Jr. |
68 | Vice Chairman of the Board since October 2002; Director, President and Chief Executive Officer of the Bank since December 1984 and of the Corporation since its organization in August 1987; previously President and Chief Executive Officer of Metropolitan Federal Savings Bank, Bethesda, Maryland. |
1985 | |||
| Patrick J. Minnock |
54 | Director; President of Minnock Construction Company, a leading builder and land developer in the western Pennsylvania area since 1988; licensed real estate broker since 1987; Life Director and former President of the Builders Association of Metropolitan Pittsburgh. |
1998 | |||
Executive Officers Who Are Not Directors
Set forth below is information with respect to the principal occupations during the last five years for the four executive officers of Parkvale Financial Corporation and Parkvale Bank who do not also serve as directors. Ages are reflected as of August 29, 2011.
| Name |
Age | Principal Occupation During the Past Five Years | ||
| Gail B. Anwyll |
59 | Senior Vice President of the Bank since June 2000; Director of Human Resources, Marketing, Sales and Training; Assistant Corporate Secretary of the Bank since 1990 and the Corporation since December 2004; previously with Lyman Savings & Loan from 1976 until merging with Parkvale Bank in August 1989. | ||
| Thomas R. Ondek |
51 | Senior Vice President of the Bank since December 2001; Manager of Deposit Operations; Vice President from 1989 to 2001; Assistant Vice President from 1986 to 1989; branch manager from April to December 1985; joined the Bank in May 1984. | ||
| Gilbert A. Riazzi |
47 | Vice President and Chief Financial Officer of the Corporation since June 2010; Chief Financial Officer of the Bank since June 2010; Senior Vice President of the Bank since December 2003 and Chief Information Officer since July 2002; previously held position as Audit-Compliance Director; joined the Bank as Internal Auditor in May 1992; with Landmark Savings from 1989 to 1992 as Audit Supervisor. | ||
| Robert A. Stephens |
56 | Senior Vice President and Chief Lending Officer of the Bank since October 2007; Senior Vice President and Chief Lending Officer of Laurel Savings Bank from July 2003 to August 2006; previously with Parkvale as Senior Vice President from December 2000 to June 2003 and Assistant Chief Lending Officer from December 1998 to June 2003; Vice President from December 1989 to December 2000; Assistant Vice President from November 1984 to December 1989; joined the Bank in August 1981 as a loan officer. | ||
98
Set forth below is information with respect to the principal occupations during the last five years for other officers of Parkvale Financial Corporation and/or Parkvale Bank who play an essential role in the successful operations of the Corporation. Ages are reflected as of August 29, 2011.
| Name |
Age | Principal Occupation During the Past Five Years | ||
| Joseph C. DeFazio |
50 | Treasurer of the Corporation since October 2010; Assistant Treasurer of the Corporation since April 2003; Vice President of the Bank since December 2000 and Assistant Treasurer since December 1995; Assistant Controller from December 1986 to December 1995; joined the Bank in October 1984 as Accounting Supervisor. | ||
| Matthew J. Husak |
43 | Vice President and Audit/Compliance/Risk Director of the Bank since August 2009; Senior Manager-Audit for KPMG from July 2005 to July 2009; with Ernst & Young, LLP from 1998 to 2005, serving as Senior Manager-Assurance and Advisory Business Service; prior audit positions at PNC Financial Services Group, Inc and at First National Bank of Pennsylvania. | ||
| Patricia A. Lowe |
60 | Vice President, Branch Operations of the Bank since December 2005; previously held positions in Branch Operations, Security Officer, Assistant Savings Manager, Electronic Banking Manager, Training Director and Branch Manager; joined the Bank in April 1989. | ||
| Christopher M. Trombetta |
41 | Vice President of the Bank since January 2007; Manager of Commercial Services since January 2006; Senior Assistant Vice President from December 2005 to December 2006; joined Parkvale in July 2002 as Commercial Loan Officer. | ||
| Thomas A. Webb |
61 | Vice President, Manager of Consumer, Mortgage Lending and Asset Management of the Bank since September 2003; joined the Bank in June 2003; with Laurel Savings and Loan Association from 1998 to 2003 serving as Vice President and Chief Lending Officer. | ||
Committees and Meetings of the Board of Directors
During the fiscal year ended June 30, 2011, the Board of Directors of Parkvale Financial Corporation met twenty three times and the Board of Directors of Parkvale Bank met eighteen times. The individuals who serve as directors of the Corporation also serve as directors of the Bank. No director of the Corporation or the Bank attended fewer than 75% of the aggregate of the total number of Board meetings held during fiscal 2011 and the total number of meetings held by all committees of the Board on which he/she has served during fiscal 2011. A majority of our directors are independent directors as defined in the NASDAQ listing standards. The Board of Directors has determined that Messrs. Burger, Gagliardi, Minnock, Pfischner, Reagan, and Dr. Fitting are independent directors. The independent members of the Board of Directors met two times in fiscal year 2011, and it is Parkvale’s ongoing policy that independent directors will meet at least two times during a fiscal year. Parkvale Financial Corporation has not paid separate compensation to its directors.
99
Membership on Certain Board Committees. The Board of Directors of Parkvale Financial Corporation and Parkvale Bank have established an Audit-Finance Committee, an Executive Committee, a Compensation Committee, a Nominating and Corporate Governance Committee and a Site-Building Committee. In addition, the Corporation has established two other committees, the Employee Stock Option Committee and the Stock Option Plan Committee. While not all directors are independent as defined under the current NASDAQ listing standards and as such are not able to be voting members of some committees, all directors are welcome to attend any meeting they would like with the exception of the meetings of the independent directors as mentioned above. The following table sets forth the membership of such committees.
| Directors |
Audit- Finance |
Executive | Compensation | Nominating and Corporate Governance |
Site-Building | |||||
| Fred P. Burger, Jr. |
* | * | ** | * | * | |||||
| Andrea F. Fitting, Ph.D. |
* | * | * | * | * | |||||
| Stephen M. Gagliardi |
* | * | * | * | * | |||||
| Robert J. McCarthy, Jr. |
* | |||||||||
| Patrick J. Minnock |
** | * | * | * | ** | |||||
| Robert D. Pfischner |
** | * | ** | * | ||||||
| Harry D. Reagan |
* | * | * | * | * |
| * | Member |
| ** | Chair |
Audit-Finance Committee. The Audit-Finance Committee reviews with management and the independent registered public accounting firm the systems of internal control, reviews the annual financial statements, including the Annual Report on Form 10-K and monitors adherence in accounting and financial reporting to generally accepted accounting principles. The Audit-Finance Committee is comprised of five directors, all of whom are independent directors as defined in the NASDAQ’s listing standards and the rules and regulations of the Securities and Exchange Commission. While all of the members of the Audit-Finance committee are financially literate under the current NASDAQ listing standards, Mr. Minnock has been designated as our Audit Committee Financial Expert as such term is defined in the rules and regulations of the Securities and Exchange Commission. The Audit-Finance Committee met five times in fiscal year 2011. The Audit-Finance Committee has adopted a charter, which is reviewed annually and which was amended in the 2010 fiscal year. The Audit-Finance Committee’s charter is available on our website www.parkvale.com/home/investor click on “Financials” then “Corp Gov,” which is linked to “Governance Documents.”
Executive Committee. The Executive Committee is empowered to act in place of the full Board, with certain exceptions, between meetings of the full Board and acts as the primary contact between the Board and senior management. The Executive Committee’s functions include but are not limited to policy, interest rate risk, loan approvals, investment portfolio and peer data review, and strategic planning and initiatives. The Executive Committee serves as a pre-review forum for major projects, contracts and decisions prior to presentation to the Board. The Executive Committee did not meet during fiscal year 2011.
Compensation Committee. At its Board meeting held on August 16, 2007, the Board of Directors formed a Compensation Committee and adopted a charter as such. The charter of the Compensation Committee is available on our website at www.parkvale.com/home/investor click on “Financials” then “Corp Gov,” which is linked to “Governance Documents.” The Committee reviews and makes recommendations to the Board of Directors concerning compensation of executive officers, including the President and Chief Executive Officer. The Compensation Committee is comprised of six directors, all of whom are considered independent under NASDAQ’s listing standards. The Compensation Committee met three times during fiscal 2011.
Nominating and Corporate Governance Committee. It is the responsibility of the Nominating and Corporate Governance Committee to recommend nominees to the Board and consider candidates for election or re-election. The Committee also reviews Corporate Governance principles for the overall governance of the Corporation
100
and its subsidiaries. The committee’s charter is available on our website at www.parkvale.com/home/investor click on “Financials” then “Corp Gov,” which is linked to “Governance Documents.” The Nominating and Corporate Governance Committee met once during fiscal 2011.
Selection of Nominees for the Board. Nominations for directors of Parkvale Financial Corporation are made by the Nominating and Corporate Governance Committee of the Board of Directors and are ratified by the entire Board. The Nominating and Corporate Governance Committee considers candidates for director suggested by its members and other directors of Parkvale Financial Corporation, as well as management and shareholders. Nominees for election as director also may be obtained in connection with our acquisitions. We may retain qualified directors of acquired companies who have a proven record of performance and can assist us in expanding into new markets and areas. A shareholder who desires to recommend a prospective nominee for the Board should notify our Corporate Secretary or any member of the Nominating and Corporate Governance Committee in writing with whatever supporting material the shareholder considers appropriate. The Nominating and Corporate Governance Committee also considers whether to nominate any person nominated pursuant to the provision of Parkvale Financial Corporation’s Bylaws relating to shareholder nominations. Our Bylaws provide that all nominations for election to the Board of Directors, other than those made by the Board or a shareholder who has complied with the notice provisions in the Bylaws thereof, shall be made by the Nominating Committee. Written notice of a shareholder nomination generally must be communicated to the attention of the Corporate Secretary at least 30 days prior to the date of the annual meeting. Each written notice of a shareholder nomination is required to set forth certain information specified in Article IV, Section 3 of Parkvale Financial Corporation’s Bylaws. The Nominating and Corporate Governance Committee has the authority to retain a third-party search firm to identify and evaluate, or assist in identifying and evaluating, potential nominees if it so desires, although it has not done so to date.
Director Nominations. The Nominating and Corporate Governance Committee has adopted a written charter which sets forth certain criteria the committee may consider when recommending individuals for nomination, including ensuring that the Board of Directors, as a whole, is diverse and consists of individuals with various and relevant career experience, relevant technical skills, industry knowledge and experience, financial expertise (including expertise that could qualify a director as an “audit committee financial expert,” as that term is defined by the rules of the SEC), local or community ties, minimum individual qualifications, including strength of character, mature judgment, familiarity with our business and industry, independence of thought and an ability to work collegially. The committee also may consider the extent to which the candidate would fill a present need on the Board of Directors.
As required by the Sarbanes-Oxley Act of 2002, Parkvale has adopted a code of ethics that applies to all of its directors, officers (including its Chief Executive Officer and Chief Financial Officer) and employees and a Senior Financial Officer Code of Ethics that applies to its chief executive officer and chief financial officer. The codes of ethics may be found on our website at www.parkvale.com.
REPORT OF THE AUDIT-FINANCE COMMITTEE
The Audit-Finance Committee oversees Parkvale Financial Corporation’s financial reporting process on behalf of the Board of Directors. Management has the primary responsibility for the financial statements, for maintaining effective internal control over financial reporting, and for assessing the effectiveness of internal control over financial reporting. In fulfilling its oversight responsibilities, the Committee reviewed and discussed the audited financial statements with management, including a discussion of the quality, not just the acceptability, of the accounting principles; the reasonableness of significant judgments; and the clarity of disclosures in the financial statements.
The Committee reviewed with Parkvale Financial Corporation’s independent registered public accounting firm, ParenteBeard LLC (ParenteBeard), which is responsible for expressing an opinion on the conformity of those audited financial statements with U.S. generally accepted accounting principles, its judgments as to the quality, not just the acceptability, of Parkvale Financial Corporation’s accounting principles and such other matters as are required to be discussed with the Committee by the standards of the Public Company Accounting Oversight Board (United States) (“PCAOB”), the rules of the Securities and Exchange Commission, and other applicable regulations. In accordance with the PCAOB, the Committee has also discussed with ParenteBeard its’ independence and the compatibility of non-audit services. Based on the review and discussions referred to above in this report, the Audit-Finance Committee recommended to the Board of Directors that the audited financial statements be included in the Parkvale Financial Corporation’s Annual Report on Form 10-K for fiscal year 2011 for filing with the Securities and Exchange Commission.
101
The Committee also reviewed and discussed together with management and ParenteBeard the audited financial statements for the year ended June 30, 2011 and the results of management’s assessment of the effectiveness of the Company’s internal control over financial reporting and the independent registered public accounting firm’s audit of internal control over financial reporting.
In addition, the functions of the Parkvale Financial Corporation’s Audit-Finance Committee include the following:
| • | Selecting Parkvale Financial Corporation’s independent registered public accounting firm; |
| • | Reviewing with management and Parkvale Financial Corporation’s independent registered public accounting firm the financial statements issued pursuant to federal regulatory requirements; |
| • | Meeting with the independent registered public accounting firm to review the scope of audit services, significant accounting changes and audit conclusions regarding significant accounting estimates; |
| • | Assessing compliance with laws and regulations and overseeing the internal audit function; and |
| • | Performing all additional duties assigned by the Board of Directors |
Members of the Audit-Finance Committee
Patrick J. Minnock, Chairman
Fred P. Berger, Jr.
Andrea F. Fitting
Stephen M. Gagliardi
Harry D. Reagan
Item 11. Executive Compensation.
Compensation Committee Interlocks and Insider Participation
No person who served as a full member of the Compensation Committee during fiscal year 2011 was a current or former officer or employee of Parkvale Financial Corporation or Parkvale Bank or engaged in certain transactions with Parkvale Financial Corporation or Parkvale Bank required to be disclosed by regulations of the SEC, except for Harry D. Reagan, who previously served as Chief Executive Officer of the Masontown Division of Parkvale Bank from February 1, 2002 until his retirement on December 31, 2002. Additionally, there were no “interlocks” during fiscal 2011, which generally means that no executive officer of Parkvale Financial Corporation served as a director or a member of a committee regarding compensation of another entity, one of whose officers served as a director or member of the Compensation Committee of Parkvale Financial Corporation.
COMPENSATION COMMITTEE REPORT ON EXECUTIVE COMPENSATION
Parkvale Financial Corporation’s business consists primarily of the business of the Bank and its subsidiaries. The financial results of Parkvale Financial Corporation are a direct function of the Bank’s achievement of its goals as set forth in its strategic plan. Executives are compensated for their contribution to the achievement of these goals in the discretion of the Compensation Committee, which benefits the stockholders, customers, employees and communities in which the Bank operates.
The Compensation Committee of the Bank and Parkvale Financial Corporation administers executive compensation, with all compensation currently paid by the Bank. The members of the committee — Messrs. Fred P. Burger (chairman), Robert D. Pfischner, Stephen M. Gagliardi, Patrick J. Minnock, Harry D. Reagan and Dr. Andrea F. Fitting — meet all of the independence requirements under applicable laws and regulations, including the listing requirements of the NASDAQ Stock Market. The committee reviews all issues pertaining to executive compensation and submits its recommendations to the Board of Directors for approval. Mr. Robert J. McCarthy, Jr., in his capacity as a member of the Board of Directors of Parkvale Financial Corporation and the Bank, abstains from any Board of Directors’ vote concerning his compensation or benefits. The Committee’s compensation program for executive officers consists of annual payments of salary and, through December 2008, bonuses and periodic grants of options to purchase common stock under Parkvale Financial Corporation’s stock option plans. As discussed below under “Compensation
102
Discussion and Analysis — Impact of Issuing Preferred Stock,” the Corporation and the Bank are unable to pay any cash bonuses or grant any new stock options until the preferred stock issued by the Corporation is redeemed. Each element of the program has a different purpose. Salary and bonus payments are mainly designed to reward current and past performance. Stock options are designed to help attract and retain superior personnel for positions of substantial responsibility as well as to provide an additional incentive to contribute to the long-term success of Parkvale Financial Corporation.
On August 16, 2007, the Board of Directors formed a separate Compensation Committee to act in this capacity and approved a Charter for the Compensation Committee. The Charter for the Compensation Committee is on our website www.parkvale.com/home/investor click on “Financials” then “Corp Gov,” which is linked to “Governance Documents.”
The Corporation and the Bank offer the following plans in which the executive officers named in the Summary Compensation Table participate: (a) the ESOP, (b) the 401(k) Plan, (c) the Supplemental Executive Benefit Plan, (d) the 02004 Stock Incentive Plan, (e) the 1993 Key Employee Stock Compensation Program, (f) the Executive Deferred Compensation Plan, (g) a deferred compensation agreement with Mr. McCarthy, (h) an employment agreement with Mr. McCarthy, (i) change in control severance agreements with Mr. Ondek, Mr. Riazzi and Mrs. Anwyll, and (j) an annual bonus plan. We reviewed each of the above plans and agreements and determined that none of them encourage the senior executive officers to take unnecessary and excessive risks that threaten the value of the Corporation and the Bank. In this regard, the ESOP and the 401(k) Plan are tax-qualified plans that provide benefits to all employees who meet certain age and service requirements, and the Supplemental Executive Benefit Plan provides benefits that certain executive officers would have received under the ESOP in the absence of the limits under the Code on the amount of compensation which may be taken into account by tax-qualified plans. The 2004 Stock Incentive Plan and the 1993 Key Employee Stock Compensation Program were each approved by the shareholders of the Corporation and provide for the granting of stock options and restricted stock awards, with no new grants permitted under the 1993 plan. The Executive Deferred Compensation Plan provides benefits that certain executive officers would have received under the 401(k) Plan in the absence of the limits under the Code on the amount of compensation which may be taken into account by tax-qualified plans, and such plan also permits an additional employer contribution subject to the sole discretion of the Board of Directors and a deferral of compensation by the plan participants. Mr. McCarthy previously deferred salary or directors’ fees under his individual deferred compensation agreement, although no new deferrals have been made under this agreement in recent years. The employment and change in control agreements provide for severance payments in the event of a termination of employment under certain circumstances. Because the annual bonus plan provides that any bonus payments are subject to the sole discretion of the Board of Directors, we do not believe that such plan encourages officers or employees to take unnecessary and excessive risks. We do not believe that the above plans and agreements encourage behavior focused on short-term results rather than the creation of long-term value. In addition, as discussed below under “Compensation Discussion and Analysis – Impact of Issuing Preferred Stock,” the Corporation and the Bank are unable to pay any cash bonuses or grant any new stock options to our named executive officers until the preferred stock issued by the Corporation is redeemed, and the executive officers named in the Summary Compensation Table are unable to receive any severance payments if their employment is terminated for reasons other than death or disability before the preferred stock is redeemed, other than vested benefits under employee benefit plans.
We certify that:
(1) we reviewed with senior risk officers the senior executive officer compensation plans and made all reasonable efforts to ensure that these plans do not encourage the senior executive officers to take unnecessary and excessive risks that threaten the value of the Corporation and the Bank;
(2) we reviewed with senior risk officers the employee compensation plans and made all reasonable efforts to limit any unnecessary risks these plans pose to the Corporation and the Bank; and
(3) we reviewed the employee compensation plans to eliminate any features of these plans that would encourage the manipulation of reported earnings of the Corporation and the Bank to enhance the compensation of any employee.
In addition, we have reviewed and discussed with management the disclosures under “Compensation Discussion and Analysis”. Based on the review and discussions referred to above, we recommended to the Board of Directors that the “Compensation Discussion and Analysis” section be included in the Corporation’s Form 10-K for fiscal year 2011.
103
Members of the Compensation Committee
Fred P. Burger, Jr., Chairman
Andrea F. Fitting
Stephen M. Gagliardi
Patrick J. Minnock
Robert D. Pfischner
Harry D. Reagan
COMPENSATION DISCUSSION AND ANALYSIS
Overview of Compensation Philosophy and Program
Our compensation philosophy is designed to provide compensation to our executive officers that is competitive in the marketplace in order to attract and retain qualified and experienced officers. Decisions regarding the compensation of our executive officers, including the various components of such compensation, during fiscal year 2011 were made by our Compensation Committee, which reviews a number of factors, including performance of the individual executive officers, the performance of Parkvale Financial Corporation and publicly available compensation surveys for comparable companies. The Committee consists solely of non-employee directors who meet all applicable requirements to be independent of management. The compensation we provide to our executive officers primarily consists of the following:
| • | annual base salaries, |
| • | annual cash bonuses*, |
| • | stock options*, |
| • | retirement benefits and |
| • | other forms of compensation as approved by the Committee. |
| * | As noted above, we are unable to pay any cash bonuses or grant any new stock options to our named executive officers until the preferred stock issued by the Corporation is redeemed. |
Since our mutual to stock conversion and initial public stock offering in 1987, we have implemented various stock option plans in order to more closely align the interests of our directors and executive officers with our stockholders. Our stockholders approved each of these plans. Prior to the issuance of the Corporation’s preferred stock, grants of stock options were made to our executive officers periodically and directors annually both as a reward for past service as well as to provide an incentive for future performance. While Parkvale did not award stock options to executives from January 2003 through November 2007, the grants made in December 2007 and December 2008 were part of a plan to make equity compensation a more significant part of executive compensation due to our goal of linking executive compensation to the achievement of the Corporation’s business strategy and goals.
We also provide all of our employees, including executive officers, with tax-qualified retirement benefits through an employee stock ownership plan (the “ESOP”) and a 401(k) plan. In addition, certain of our executive officers participate in non-qualified benefit plans pursuant to which they receive benefits with respect to their compensation that exceeds the applicable IRS limits on covered compensation for tax-qualified plans equal to the benefits they would have received under the tax-qualified plans in the absence of such IRS limits.
We also offer various fringe benefits to all of our employees, including our executive officers on a non-discriminatory basis, including group policies for medical, dental, life, disability and accidental death insurance. Our President and Chief Executive Officer is permitted to use a company car and Parkvale pays his country club dues. The Committee believes that such additional benefits are appropriate and assist Mr. McCarthy in fulfilling his employment obligations.
104
In determining the amount and form of executive compensation to be paid or awarded in fiscal 2011, the Committee considered Parkvale Financial Corporation’s overall performance over a period of years, and its future objectives and challenges, rather than a guideline or formula based on any particular performance measure in a single year. Within this framework, the Committee considered, among other things, the following performance factors in making its compensation decisions in fiscal 2011: return on equity; earnings per share; fair market value of the Common Stock; and the Bank’s achievement of its annual goals related to earnings, asset quality, efficiency ratio and evaluation by regulators as to safety and soundness. The Committee’s decisions concerning the compensation of individual executive officers during fiscal 2011 were made in the context of historical practice and competitive environment, including comparisons with the compensation practices of companies of similar size and function in the financial services industry. The Committee has not addressed the adoption of a policy with respect to the issue of the deductibility of qualifying executive compensation under Section 162(m) of the Internal Revenue Code of 1986, as amended (“Code”) because no executive officer exceeds the $1,000,000 threshold.
Role of Executive Officers and Management. The President and Chief Executive Officer provides recommendations to the Committee on matters of compensation philosophy, plan design and the general guidelines for executive officer compensation. The Committee then considers these recommendations. The President and Chief Executive Officer generally attends the Committee meetings but is not present for the executive sessions or for any discussion of his own compensation.
Compensation Consultant. Parkvale’s Board of Directors as well as Parkvale’s Compensation Committee have the authority to engage the services of outside advisors, experts and others to assist the Board or the Committee. In accordance with this authority, in 2009 the Board engaged Blanchard Chase, a nationally recognized consulting firm specializing in compensation and employee benefits, to provide an independent review of the named executive officers and director compensation. The objectives of the independent review were to (i) assess the competitiveness of the Corporation’s total compensation program for named executive officers and non-employee directors; and (ii) review performance based on cash and stock based compensation practices among peer banks. The consultant compared base salary, benefits, annual incentive and long-term compensation for each named executive officer to a peer group, which contained nineteen banking institutions having similar characteristics to the Corporation. The peer group consisted of publicly traded thrifts with assets between $995 million and $3.7 billion located in Delaware, Maryland, New Jersey, New York, Ohio, Pennsylvania and West Virginia. The 2009 report indicated the Corporation’s total cash compensation benefits and long-term stock based incentives were competitive with market practice.
Elements of Executive Compensation
The financial performance of the Corporation on a period-to-period basis is primarily reflected in salary adjustments and cash bonuses. The Committee uses these elements of compensation to provide incentives to executives to achieve continuous, near-term results. Executives’ stock-based compensation, on the other hand, is focused on achievement of long-term success. As is true of most publicly traded entities, the Corporation’s stock performance fluctuates over time, typically more so than does our financial performance. However, over time, the Committee believes that the return to stockholders investing in our stock, including dividend payout, is a good indicator of corporate performance.
Base Salary. The salaries of the executive officers are reviewed on an annual basis, as well as at the time of promotion or other change in responsibilities. Increases in salary are based on an evaluation of the individual’s performance and level of pay compared to peer group pay levels. For fiscal year 2011, the Committee determined the base salaries of Messrs. McCarthy, Riazzi and Ondek and Mrs. Anwyll and submitted such determination to the full Board of Directors for review. Mr. McCarthy, the only named executive officer who is also a member of the Board, did not participate in discussions regarding his own compensation. In setting base salary, the Committee conducted a review of external competitiveness based on available salary surveys produced by L. R. Webber Associates, Inc. Generally, the peer groups consisted of Pennsylvania financial institutions with total assets of over $1 billion.
In determining base salary for calendar 2011, the Compensation Committee considered the overall financial performance of Parkvale, the individual’s contribution to the attainment of the Corporation’s internal budget
105
expectations, leadership, complexity of position, expense containment, asset quality and Parkvale’s ratings with our banking regulators; however, no particular weight was given to any particular factor. The base salaries for Messrs. McCarthy, Riazzi, and Ondek and Mrs. Anwyll were $375,000, $151,644, $109,457 and $108,826, respectively, for fiscal 2011 representing increases of 0%, 21.7%, 6.8% and 7.7%, respectively, from their fiscal 2010 salaries. Mr. Riazzi received a higher percentage increase in fiscal 2011 to reflect his appointment as Chief Financial Officer in June 2010. The Committee believes that the base salary paid to each member of the senior management team is commensurate with their duties, performance, and range for the industry compared with financial institutions of similar size within our region. The peer ranges included comparisons to minimum, midpoint and maximum levels. The Committee believes the salaries and adjustments made at the beginning of the calendar year were competitive, but are below the median salaries as most recently reported by peer institutions with assets of $1 billion to $3 billion that are located in Pennsylvania and connected states.
Cash Bonus. As discussed below under “Impact of Issuing Preferred Stock,” the Corporation is not able to pay or accrue any cash bonuses to its five most highly compensated employees until its preferred stock is redeemed. As a result, no cash bonuses were paid to the executive officers named in the Summary Compensation Table during fiscal 2011 or 2010.
Long-Term Compensation. The Committee believes that, from a motivational standpoint, the use of stock based compensation has contributed to the Corporation’s financial performance, eliciting maximum effort and dedication from our executive officers. The long-term incentive compensation portion of the Corporation’s compensation program to date has consisted of grants of stock options under the Corporation’s stock incentive and option plans. These grants are designed to provide incentives for long-term positive performance by the executive and other senior officers to align their financial interests with those of the Corporation’s stockholders by providing the opportunity to participate in any appreciation in the stock price of the Corporation’s common stock, which may occur after the date of grant of stock options.
The ability to exercise stock options depends upon the executive officer continuing to render services to the Corporation. The Corporation’s 2004 Stock Incentive Plan provides that awards may be made based upon specific performance goals, although no performance based stock options have been granted to date. All options granted under the Corporation’s stock option plans must have an exercise price at least equal to the market value of the common stock on the date of grant. Options may be exercised only for a limited period of time after the optionee’s departure from the Corporation, except that following a change in control of the Corporation or the Bank, the options may generally be exercised for the remainder of the original 10-year term of the option.
In the past, our long-term incentive compensation has consisted of stock options. We emphasized stock options primarily for two reasons. First, prior to the adoption of Financial Accounting Standards Board ASC Topic 718, (formerly Financial Accounting Standards Statement No. 123R), the granting and vesting of stock options did not result in any financial statement expenses, whereas restricted stock awards had to be expensed over the vesting period. Second, because the exercise price of all of our stock options equaled the fair market value of our common stock on the date of grant, our executive officers and directors only benefit from stock options if the market value of our common stock increases after the date of grant. By comparison, restricted stock awards have some value to the recipients of the awards even if the market value of our stock declines after the date of grant.
With the adoption of FASB ASC Topic 718, all stock options are now required to be expensed over the applicable vesting period. In addition, an increasing number of companies are using restricted stock awards, or a combination of restricted stock awards and stock options. While the Corporation has not issued or granted any restricted stock awards to date, the Committee may consider granting restricted stock awards in the future.
Under the stock incentive plans, the Committee has discretion in determining grants of stock options and restricted stock awards to executive officers, including the timing, the amounts, and types of awards. In the case of individual executives, our award decisions are based in part on corporate performance. There were no stock options granted during fiscal year 2011 or 2010. Stock options awarded in prior fiscal years were awarded with grant date fair value calculated under FASB ASC Topic 718 shown in the Summary Compensation Table. The absence of any stock option grants during 2003 through fiscal 2007 was partially due to the adoption of FASB ASC Topic 718 that requires all new option grants to be expensed over the vesting period and the Corporation’s desire to control operating expenses.
106
In determining the amount of the compensation to be paid to the executive officers each year, the Committee generally considers the current compensation being paid by comparable companies and the current performance of the Corporation. Any gains from prior grants of stock options or any appreciation or earnings on amounts previously deferred by the executive officers have generally not been taken into account by the Committee.
Impact of Issuing Preferred Stock. The Corporation is not able to pay or accrue any incentive compensation, including the granting of new stock options, to its five most highly compensated employees until the preferred stock is redeemed. However, the Corporation is able to grant long-term restricted stock awards while the preferred stock is outstanding, subject to certain conditions on the amount and vesting of such awards.
Additional Components of Executive Compensation. The Corporation and the Bank have also entered into an employment agreement with Mr. McCarthy and change in control agreements with Mr. Riazzi, Mr. Ondek and Mrs. Anwyll. The purpose of the employment and change in control agreements is to retain for the benefit of the Corporation and the Bank the talents of highly skilled officers who are integral to the development and implementation of the Corporation’s business. Such agreements, as discussed below, provide for termination benefits in the event of such executives’ termination or in the event of the occurrence of certain events. The severance payments in the agreements are intended to align the executive officers’ and the stockholders’ interests by enabling executive officers to consider corporate transactions that are in the best interest of the stockholders and the other constituents of the Corporation without undue concern over whether the transactions may jeopardize the executive officers’ own employment. The employment and change in control agreements are similar to the agreements for senior executive officers of comparable financial institutions. If a change in control was to occur, the executive officers do not receive change in control payments under their employment or change in control agreements unless their employment is terminated. However, as discussed above under “— Impact of Issuing Preferred Stock,” the Corporation is not able to make any severance payments to any of the executive officers named in the Summary Compensation Table or any of the next five most highly compensated employees, other than payments triggered by death or disability or vested benefits under employee benefit plans.
Loans to Management. In the ordinary course of business, the Bank makes loans available to its directors, officers and employees. Such loans are made in the ordinary course of business on substantially the same terms, including interest rates and collateral, as those prevailing at the time for comparable loans to other borrowers. It is the belief of management that these loans neither involve more than the normal collection risk nor present other unfavorable features. At June 30, 2011, the Bank had 30 loans outstanding to directors and officers of the Bank, or members of their immediate families or related entities. In total, these loans were less than 5% of total shareholders’ equity at June 30, 2011.
Non-qualified Deferred Compensation
The Corporation and the Bank have adopted a Supplemental Executive Benefit Plan for the benefit of certain executive officers who are subject to the limitations imposed by the Code on the maximum amount of compensation which may be taken into consideration under the ESOP and the maximum amount of benefits which may be allocated to an individual participant hereunder. The Bank has also adopted an Executive Deferred Compensation Plan for certain senior officers of the Bank to provide such individuals with the benefits that they cannot receive under the 401(k) Plan due to the limitations imposed by the Code.
Supplemental Executive Benefit Plan. Effective December 31, 1994, PFC and the Bank adopted the Supplemental Executive Benefit Plan (“SEBP”) for the benefit of certain executive officers who are subject to the limitations imposed by Sections 401(a)(17) and 415 of the Code on the maximum amount of compensation which may be taken into consideration for the purposes of the Parkvale Financial Corporation Employee Stock Ownership Plan (“ESOP”) and the maximum amount of benefits which may be allocated to an individual participant there under. In calendar year 1994, the maximum amount of base pay for qualified benefit plan purposes was reduced to $150,000 from $235,840 in 1993. From 1997 through 2001, the base amount gradually increased to $170,000. Effective January 1, 2002, this limit was increased to $200,000 with additional increases to $205,000 for 2003 and 2004, $210,000 for 2005, $220,000 for 2006, $225,000 for 2007, $230,000 for 2008 and $245,000 for 2009, 2010 and 2011. Persons earning more than these limits were deprived of tax-qualified retirement benefits otherwise available to them. The officer affected by the Code limitation in calendar year 2010 was Mr. McCarthy, and 484 treasury shares of PFC common stock applicable
107
to the 2010 distribution were allocated to the trust administered by an independent third party for his benefit. The value of those shares, based upon the closing price of $9.18 per share on the last trading day of calendar 2010 (December 31, 2010), is included in the Summary Compensation Table.
Executive Deferred Compensation Plan. Due to benefit limits imposed by the Code and/or discrimination tests of highly compensated employees, the Bank adopted, effective July 1, 1994, the Parkvale Savings Bank Executive Deferred Compensation Plan (“EDCP”) for certain senior executive officers of the Bank to compensate such individuals who participate in the 401(k) Plan for benefits lost under the Plan. The EDCP is an unfunded, non-qualified plan that provides for the accrual of matching contributions and investment returns that may not be accrued under the 401(k) Plan. Under the 401(k) Plan, participating employees may voluntarily make pre-tax contributions to their accounts up to 25% of covered plan compensation. The maximum deferral by eligible named executives has been 10% during the past two fiscal years. The Bank matches 50% of the employee’s pre-tax contributions up to a maximum of 6% of the employee’s covered compensation. In addition, the Bank may make a profit sharing contribution under the 401(k) Plan equal to a percentage of each eligible employee’s covered compensation during a plan year, subject to the Bank’s profitability and the discretionary approval of the Board of Directors. The historical discretionary contribution has been 2%. Participants in the EDCP may elect to defer compensation in addition to the deferrals permitted under the 401(k) Plan, and the Bank makes matching and discretionary contributions to the EDCP. Contributions to the 401(k) Plan and EDCP for the named executive officers are included in the Summary Compensation Table.
Deferred Compensation Agreements. The Bank entered into deferred compensation agreements with Mr. McCarthy and certain directors (including Mr. Burger) in the 1980s, pursuant to which Mr. McCarthy and the directors deferred a portion of their salary or directors’ fees without any contributions by the Bank or the Corporation. The Bank has continued to maintain these agreements, although no new deferrals have been made pursuant to these agreements in recent years.
Stock Ownership Guidelines
The Corporation has not established any formal policies or guidelines addressing expected levels of stock ownership by the directors or named executive officers or for other executive officers; however, this matter remains under consideration. The Corporation notes all four of the named executive officers own common stock in the Corporation with a value as of July 31, 2011 that exceeds the executive’s current annual base salary, and that the four named executive officers owned 565,072 shares or 10.12% of the outstanding common stock at July 31, 2011, not counting unexercised stock options. See “Beneficial Ownership of Common Stock by Certain Beneficial Owners and Management.”
Employment Agreement
The Bank entered into a five-year employment agreement with Mr. McCarthy in April 1987, and the Corporation became a party to the agreement upon consummation of the reorganization of the Bank into the holding company form of organization in January 1989. The initial term of the agreement has been extended automatically for an additional year on each anniversary date of the agreement. Effective January 1, 2000, a new five-year employment agreement was entered into by the parties to reflect the holding company formation, the Bank’s charter conversion to a savings bank and change in regulators, and changes in applicable law and regulatory policies since 1987. The 2000 agreement was amended and restated as of December 15, 2005 and December 20, 2007 in order to comply with Section 409A of the Code and the regulations under such section and to make certain other changes. The agreement provides for a minimum annual salary of $375,000, which may be increased from time to time in such amounts as may be determined by the Boards of Directors of the Corporation and the Bank. In addition, Mr. McCarthy may receive bonus payments as determined by the Boards of Directors. Prior to January 1st of each year, the Board of Directors shall consider all relevant factors, including Mr. McCarthy’s performance, and if appropriate approve a one-year extension of the remaining term of the agreement. The term of Mr. McCarthy’s agreement will be extended each year if the Boards of Directors of the Bank and the Corporation (“Parkvale”) approve the extension, unless Mr. McCarthy provides at least 30 days written notice not to extend the agreement beyond its remaining term. The agreement is terminable by Parkvale for cause at any time and currently expires on January 1, 2016.
The agreement with Mr. McCarthy provides for severance payments and other benefits in the event Parkvale terminates his employment for other than cause, disability, retirement or death or Mr. McCarthy resigns for “good
108
reason,” as defined in the agreement. Good reason includes a material breach of the agreement by the Corporation or the Bank, including a material diminution in Mr. McCarthy’s base compensation, a material diminution in his authority, duties or responsibilities or any requirement that he report to a corporate officer or employee instead of reporting directly to the Boards of Directors, and also includes any material change in the geographic location at which Mr. McCarthy must perform his duties under the agreement. Mr. McCarthy may only terminate his agreement for good reason if he provides written notice of the event within 90 days of its initial existence and the Corporation and the Bank thereafter fail to remedy the condition within 30 days after receiving the written notice. In such event, Parkvale will provide a lump sum cash payment to Mr. McCarthy equal to 2.99 times the sum of (a) his then current base salary per year, (b) the highest bonus or other incentive compensation paid to him during the preceding three calendar years, (c) the average contributions by Parkvale to his accounts under the 401(k) Plan, the ESOP, the Executive Deferred Compensation Plan (excluding elective deferrals) and the Supplemental Executive Benefit Plan for the preceding three calendar years, and (d) the average of all other components of his taxable income from Parkvale for the preceding three calendar years. In addition, Parkvale will continue at no cost to the executive his participation in all life, disability and medical insurance plans for the then remaining term of the employment agreement or pay a lump sum cash equivalency amount if such coverage cannot be provided, plus make an additional lump sum cash payment equal to the projected cost of providing Mr. McCarthy benefits under Parkvale’s other employee benefit plans, programs and arrangements (including the use of an automobile and club dues but excluding stock benefit plans) for the then remaining term of the employment agreement. Under Mr. McCarthy’s employment agreement, Mr. McCarthy could receive payments and benefits that constitute a parachute payment. Parachute payments generally are payments in excess of three times the base amount, which is defined to mean the recipient’s average annual compensation from the employer includible in the recipient’s gross income during the most recent five taxable years ending before the date on which a change in control of the employer occurred. Recipients of parachute payments are subject to a 20% excise tax on the amount by which such payments exceed the base amount, in addition to regular income taxes, and payments in excess of the base amount are not deductible by the employer as compensation expense for federal income tax purposes. In such event, Parkvale has agreed to pay the 20% excess tax that would otherwise be owed by Mr. McCarthy and such additional amounts as may be necessary to reimburse Mr. McCarthy for the federal, state and local income taxes and excise taxes on such amounts. However, as discussed above under “— Impact of Issuing Preferred Stock,” the Corporation is currently not able to make any severance payments to any of the executive officers named in the Summary Compensation Table or any of the next five most highly compensated employees, other than payments triggered by death or disability or vested benefits under employee benefit plans.
The employment agreement with Mr. McCarthy provides that if he dies during the term of the agreement, then his spouse or other named beneficiaries shall receive his base salary for a period of one year plus the continuation of medical, dental and hospitalization coverage for one year. If Mr. McCarthy’s employment is terminated due to disability, his employment agreement provides that he will receive his base salary and other benefits for the then remaining term of the agreement, minus any disability benefits which he is entitled to receive under any disability plan of Parkvale or any governmental plan, including Social Security disability benefits or workman’s compensation benefits.
The agreement also precludes Mr. McCarthy from owning (excluding the ownership of 1% or less of the stock of a public corporation), managing, operating and controlling, being employed by or participating in or being in any way connected with any other business covered by federal deposit insurance which is located in the Pennsylvania counties of Allegheny, Armstrong, Beaver, Butler, Fayette, Washington and Westmoreland, together with any other counties within Pennsylvania, Ohio or West Virginia in which the Bank has an office. Such restriction shall continue throughout Mr. McCarthy’s employment with Parkvale.
The employment agreement with Mr. McCarthy and the change in control agreements with Mr. Riazzi, Mr. Ondek and Mrs. Anwyll described below, to the extent they increase the cost of any acquisition of control of the Corporation, could be deemed to have an anti-takeover effect. As a result, the agreements may discourage takeover attempts which (1) are deemed by certain stockholders to be in their best interests, (2) might be at prices in excess of the then market value of the Corporation’s common stock, and (3) as a result, may tend to perpetuate existing management.
Change In Control Agreements
The Corporation and the Bank (“Parkvale”) entered into a three-year change in control severance agreement with Mr. Riazzi effective February 1, 2010 and with Mr. Ondek and Mrs. Anwyll effective January 1, 2007. The term of each agreement will be extended for an additional year on each January 1st until such time as the Boards of Directors of
109
Parkvale or the executive gives notice not to extend the term of the agreement. As a consequence, the remaining term of each agreement will stay between two and three years unless notice of non-renewal is given not less than thirty (30) days prior to any anniversary date. If either party gives timely notice that the term will not be extended as of any annual anniversary date, then the agreement shall terminate at the conclusion of its remaining term. The agreements currently expire on December 31, 2013.
The agreements provide for severance payments and other benefits in the event employment with Parkvale is terminated subsequent to a change in control of Parkvale by (i) Parkvale for other than cause, disability, retirement or death, or (ii) the executive for good reason, with the definition of good reason similar to that contained in Mr. McCarthy’s employment agreement. A “change in control” of Parkvale is defined to include any of the following: (1) the acquisition of over 50% of the outstanding common stock of the Corporation or the Bank by any person or group, (2) the acquisition within any 12-month period of 30% or more of the outstanding common stock of the Corporation by any person or group, (3) a change in a majority of the board of directors of the Corporation within any 12-month period if the appointment or election of the new directors is not approved by a majority of the board of directors in office prior to such appointment or election, and (4) the acquisition of 40% or more of the total assets of the Corporation or the Bank within any 12-month period by any person or group. In such event, Parkvale shall (a) pay to the executive a lump sum cash severance amount equal to two (2) times the executive’s annual compensation, (b) maintain and provide for a period ending at the earlier of (i) the expiration of the remaining term of the agreement as of the date of termination or (ii) the date of full-time employment by another employer, at no cost to the executive, continued participation in all group insurance, life insurance, health and accident insurance, and disability insurance , and (c) make an additional lump sum cash payment equal to the projected cost of providing the executive with benefits under Parkvale’s other employee benefit plans, programs and arrangements in which the executive was entitled to participate immediately prior to the date of termination (excluding stock benefit plans and cash incentive compensation). If such payments would constitute a “parachute payment” under Section 280G of the Code, then the payments and benefits payable shall be reduced by the minimum amount necessary to avoid constituting a parachute payment. However, as discussed above under “— Impact of Issuing Preferred Stock,” the Corporation is currently not able to make any severance payments to any of the executive officers named in the Summary Compensation Table or any of the next five most highly compensated employees, other than payments triggered by death or disability or vested benefits under employee benefit plans.
Parkvale may assign the agreements and its rights and obligations there under in whole, but not in part, to any corporation, bank or other entity with or into which either the Corporation or the Bank may merge or consolidate or which either may transfer all or substantially all of its respective assets. The executives may not assign or transfer the agreement or any rights or obligations there under.
MANAGEMENT COMPENSATION
General
For fiscal 2011 and 2010, the Corporation is deemed to be a smaller reporting company rather than an accelerated filer. Because there are fewer disclosure requirements applicable to smaller reporting companies, the disclosures in this Management Compensation section and in the section entitled “Compensation Discussion and Analysis” have been reduced in several respects from the disclosures provided for fiscal 2009.
Summary Compensation Table
The following table sets forth a summary of certain information concerning the compensation awarded to or paid by the Corporation or its subsidiaries for services rendered in all capacities during the last fiscal year to our principal executive officer, as well as the next three highest compensated executive officers. We refer to these individuals as the “named executive officers.” None of the named executive officers received any non-equity incentive plan compensation during fiscal 2011, 2010 or 2009, as the Corporation has not made any such awards to date. In addition, the Corporation and its subsidiaries do not have any defined benefit or actuarial pension plans, and they have not provided any above-market or preferential earnings on deferred compensation under any non-tax-qualified benefit plan.
110
| Name & Principal Position |
Fiscal Year Ended June 30 |
Salary (1) ($) |
Bonus (2) ($) |
Stock Awards (3) ($) |
Option Awards (4) ($) |
All Other Compensation (5) ($) |
Total ($) | |||||||||||
| Robert J. McCarthy, Jr ., President and Chief Executive Officer |
2011 | 375,000 | 0 | 0 | 0 | 40,225 | 415,225 | |||||||||||
| 2010 | 375,000 | 0 | 0 | 0 | 31,320 | 406,320 | ||||||||||||
| 2009 | 375,000 | 150,000 | 0 | 17,397 | 55,876 | 598,273 | ||||||||||||
| Gilbert A. Riazzi, Vice President and Chief Financial Officer |
2011 | 151,644 | 0 | 0 | 0 | 8,441 | 160,085 | |||||||||||
| 2010 | 124,602 | 0 | 0 | 0 | 5,903 | 130,505 | ||||||||||||
| 2009 | 114,783 | 24,000 | 0 | 5,799 | 9,677 | 154,259 | ||||||||||||
| Thomas R. Ondek, Senior Vice President of the Bank |
2011 | 109,457 | 0 | 0 | 0 | 4,847 | 114,304 | |||||||||||
| 2010 | 102,486 | 0 | 0 | 0 | 8,279 | 110,765 | ||||||||||||
| 2009 | 99,489 | 24,000 | 0 | 5,799 | 11,642 | 140,930 | ||||||||||||
| Gail B. Anwyll, Senior Vice President of the Bank |
2011 | 108,826 | 0 | 0 | 0 | 7,948 | 116,774 | |||||||||||
| 2010 | 101,065 | 0 | 0 | 0 | 8,110 | 109,175 | ||||||||||||
| 2009 | 98,293 | 24,000 | 0 | 5,799 | 11,525 | 139,617 | ||||||||||||
| (1) | Includes amounts deferred by the executive and contributed to the Parkvale 401(k) Plan. |
| (2) | No bonuses were paid in the fiscal years ended June 30, 2011 and 2010. |
| (3) | No restricted stock awards have been granted to date. |
| (4) | The Corporation did not grant any stock options to the named executive officers from January 2003 through November 2007. Stock options awarded in fiscal year 2009 were awarded with grant date fair value calculated under FASB ASC Topic 718. Because the stock price declined significantly below the option price of the stock options granted in December 2007, no expense was recognized for the pro-rata portion of the vesting that occurred in December 2008. The Corporation did not grant any stock options to the named executive officers during fiscal 2011 or 2010. |
| (5) | All other compensation listed here includes the Bank’s contributions to defined contribution plans, including (a) the Parkvale 401(k) Plan for matching and discretionary contributions, (b) the Corporation’s contribution to the Employee Stock Ownership Plan (ESOP), and (c) the non-tax qualified plans related to the 401(k) Plan and the ESOP, as well as the dollar value of premiums paid on life insurance for the benefit of the above named executive officers. No plan contributions or premiums exceeded $10,000 for any of the named executive officers. None of the named executive officers received perquisites during fiscal 2011 with an aggregate value of $10,000 or more. |
Outstanding Equity Awards at Fiscal Year-End
The following table sets forth information concerning the outstanding stock options held by each named executive officer as of June 30, 2011. To date, the Corporation has not granted any stock awards or any non-equity or equity incentive plan awards that provide for payments based upon achievement of threshold, target or maximum goals.
| Option Awards | ||||||||||||||||||||
| Number of Securities Underlying Unexercised Options |
Option Exercise | |||||||||||||||||||
| Exercisable | Unexercisable | Price (1) | Option Expiration Date | |||||||||||||||||
| Robert J. McCarthy, Jr. |
30,000 | 0 | 22.995 | 12/19/2012 | ||||||||||||||||
| 18,000 | 0 | 26.45 | 12/20/2017 | |||||||||||||||||
| 7,500 | 0 | 12.97 | 12/18/2018 | |||||||||||||||||
| Gilbert A. Riazzi |
3,750 | 0 | 22.995 | 12/19/2012 | ||||||||||||||||
| 6,000 | 0 | 26.45 | 12/20/2017 | |||||||||||||||||
| 2,500 | 0 | 12.97 | 12/18/2018 | |||||||||||||||||
| Thomas R. Ondek |
8,000 | 0 | 22.995 | 12/19/2012 | ||||||||||||||||
| 6,000 | 0 | 26.45 | 12/20/2017 | |||||||||||||||||
| 2,500 | 0 | 12.97 | 12/18/2018 | |||||||||||||||||
| Gail B. Anwyll |
8,000 | 0 | 22.995 | 12/19/2012 | ||||||||||||||||
| 6,000 | 0 | 26.45 | 12/20/2017 | |||||||||||||||||
| 2,500 | 0 | 12.97 | 12/18/2018 | |||||||||||||||||
| (1) | In each case, the option exercise price was based upon the fair market value of the Corporation’s common stock on the date of grant. |
111
Grants of Plan-Based Awards
No stock options were granted to the named executive officers during the fiscal year ended June 30, 2011. No non-equity incentive plan awards or equity incentive plan awards were granted to the named executive officers during fiscal 2011.
Option Exercises and Stock Vested
During the fiscal year ended June 30, 2011, no stock options were exercised by the named executive officers. None of our executive officers held any restricted stock awards during the fiscal year ended June 30, 2011.
Item 12. Security Ownership of Certain Beneficial Owners and Management and Related Stockholder Matters.
The following tables set forth as of September 21, 2011, certain information as to the common stock beneficially owned by (a) each person or entity, including any “group” as that term is used in Section 13(d)(3) of the Securities Exchange Act of 1934, who or which was known to us to be the beneficial owner of more than 5% of our issued and outstanding common stock, (b) each director of PFC and Parkvale Bank, (c) each executive officer of PFC and Parkvale Bank named in the Summary Compensation Table, and (d) all directors and executive officers of PFC and Parkvale Bank as a group.
| Name and Address of Beneficial Owner |
Amount and Nature of Beneficial Ownership as of September 21, 2011 (1) |
Percent of Common Stock | ||
| Parkvale Financial Corporation |
759,464(2)(3) | 13.60% | ||
| Employee Stock Ownership Plan |
||||
| 4220 William Penn Highway |
||||
| Monroeville, PA 15146 |
||||
| AQR Capital Management LLC |
403,979(4) | 7.24% | ||
| 2 Greenwich Plaza 3rd Floor |
||||
| Greenwich, CT 06830 |
||||
| Dimensional Fund Advisors LP |
328,912(5) | 5.89% | ||
| Palisades West, Building One 6300 Bee Cave Road |
||||
| Austin, TX 78746 |
112
| Name of Beneficial Owner or Number of Persons in Group |
Amount and Nature |
Number of Shares Underlying Stock Options |
Total Beneficial Ownership |
Percent of Common Stock (13) |
||||||||||||
| Directors: |
||||||||||||||||
| Fred P. Burger Jr. |
159,500 | (6) | 23,500 | 183,000 | 3.26 | % | ||||||||||
| Andrea F. Fitting, Ph.D. |
10,085 | (7) | 23,500 | 33,585 | * | |||||||||||
| Robert J. McCarthy, Jr. |
496,928 | (3)(8) | 55,500 | 552,428 | 9.80 | % | ||||||||||
| Patrick J. Minnock |
29,387 | (9) | 23,500 | 52,887 | * | |||||||||||
| Robert D. Pfischner |
82,394 | (10) | 26,500 | 108,894 | 1.94 | % | ||||||||||
| Harry D. Reagan |
5,323 | (11) | 16,000 | 21,323 | * | |||||||||||
| Stephen M. Gagliardi |
1,600 | 10,000 | 11,600 | * | ||||||||||||
| Other Named Executive Officers: |
||||||||||||||||
| Gilbert A. Riazzi |
8,433 | (3) | 12,250 | 20,683 | * | |||||||||||
| Thomas R. Ondek |
37,490 | (3)(12) | 16,500 | 53,990 | * | |||||||||||
| Gail B. Anwyll |
22,221 | (3) | 16,500 | 38,721 | * | |||||||||||
| All directors and executive officers of Parkvale Financial Corporation and Parkvale Bank as a group (13) |
916,994 | (3) | 232,750 | 1,149,744 | 19.77 | % | ||||||||||
| * | Represents less than 1% of our outstanding common stock. |
| (1) | Based upon filings made pursuant to the Securities Exchange Act of 1934 and information furnished by the respective entities and individuals. Under regulations promulgated pursuant to the Securities Exchange Act of 1934, shares of common stock are deemed to be beneficially owned by a person if he or she directly or indirectly has or shares (i) voting power, which includes the power to vote or to direct the voting of the shares, or (ii) investment power, which includes the power to dispose or to direct the disposition of the shares. Unless otherwise indicated, the named beneficial owner has sole voting and dispositive power with respect to the shares. |
| (2) | As of September 21, 2011, the PFC Employee Stock Ownership Plan (“ESOP”) has allocated all but 5,769 shares to plan participants. The plan participants are entitled to direct the ESOP Trustees with respect to the shares allocated to their accounts. |
| (3) | Includes 125,141 shares allocated to named executive officers pursuant to the PFC Employee Stock Ownership Plan, consisting of 80,586 shares for Mr. McCarthy, 14,278 for Mrs. Anwyll, 21,844 shares for Mr. Ondek and 8,433 shares for Mr. Riazzi. |
| (4) | AQR Capital Management LLC is an investment management firm with 403,979 shares held as of September 21, 2011 according to its Form 13F. |
| (5) | Dimensional Fund Advisors L.P. is an investment adviser registered under the Investment Advisers Act of 1940 with 328,912 shares held as of September 21, 2011 in portfolios of certain affiliated entities. Dimensional disclaims beneficial ownership of all such shares. According to its Schedule 13G, Dimensional Fund furnishes investment advice to four investment companies registered under the Investment Company Act of 1940 and serves as investment manager to certain other commingled group trusts and separate accounts. In its role as investment advisor or manager, Dimensional Fund disclosed that it possesses investment and/or voting power over the shares of our common stock held by such investment companies, trusts and accounts. David G. Booth is the founder and co-chief executive officer of Dimensional Fund. |
| (6) | Includes 50,000 shares held under Mr. Burger’s deferred compensation agreement with PFC Bank. |
| (7) | Includes 1,140 shares held by Dr. Fitting’s spouse and 8,945 shares held jointly by Dr. Fitting and her spouse. |
113
| (8) | Includes 15,254 shares held by Mr. McCarthy as trustee for his children, 113,880 shares held under deferred compensation agreements with PFC Bank, 61,737 shares held in the Executive Deferred Compensation Plan (“EDCP”) and 39,236 shares held in the Supplemental Executive Benefit Plan (“SEBP”). |
| (9) | Includes 3,281 shares held by Mr. Minnock’s spouse and 20,000 shares held by the Minnock Family Limited Partnership. |
| (10) | Includes 1,525 shares held by Mr. Pfischner’s spouse. |
| (11) | Includes 5,323 shares held jointly by Mr. Reagan and his spouse. |
| (12) | Includes 132 shares held by Mr. Ondek under the EDCP. |
| (13) | Percentage of ownership is determined by assuming that options held by such person or group (but not those held by any other person) and that are exercisable within 60 days of the voting record date have been exercised. |
Section 16(a) of the Securities Exchange Act of 1934, as amended, requires the officers and directors and persons who own more than 10% of the Corporation’s common stock to file reports of ownership and changes in ownership with the Securities and Exchange Commission. We know of no person or entity who owns 10% or more of the Corporation’s common stock, other than the ESOP. Based solely on our review of the copies of such forms furnished to us, or written representations from our officers and directors, we believe that during, and with respect to, the fiscal year ended June 30, 2011, our officers and directors complied in all respects with the reporting requirements promulgated under Section 16(a) of the Securities Exchange Act of 1934.
The following table provides Equity Compensation Plan information as of June 30, 2011 with respect to shares of Parkvale Common Stock that may be issued under our existing equity compensation plans, which consists of the 1993 Directors’ Stock Option Plan, the 1993 Key Employee Stock Compensation Program and the 2004 Stock Incentive Plan.
| Number of securities to be issued upon exercise of outstanding options, warrants and rights (a) |
Weighted average exercise price of outstanding options, warrants and rights (b) |
Number of securities remaining available for future issuance under equity compensation plans (excluding securities reflected in column (a)) (c) |
||||||||||
| Equity compensation plans approved by security holders |
297,750 | $ | 21.07 | 80,500 | ||||||||
| Equity compensation plans not approved by security holders |
— | — | — | |||||||||
| Warrants (1) |
376,327 | 12.66 | — | |||||||||
|
|
|
|
|
|
|
|||||||
| Total |
674,077 | $ | 16.38 | 80,500 | ||||||||
|
|
|
|
|
|
|
|||||||
| (1) | These warrants were issued to the U.S. Department of the Treasury in connection with our issuance of preferred stock and are not a compensation plan covering our directors, officers or employees. |
Item 13. Certain Relationships and Related Transactions, and Director Independence.
During fiscal 2011, Parkvale Bank has had, and expects to have in the future, banking transactions in the ordinary course of business with its directors and officers, and other related parties. These transactions have been made on substantially the same terms, including interest rates, collateral and repayment terms, as those prevailing at the same time for comparable transactions with affiliated parties. The extension of credit to these persons has not involved, and does not currently involve, more than the normal risk of collection risk or present other unfavorable features. None of these loans or other extensions of credit are disclosed as non-accrual, past due, restructured or potential problem loans. The aggregate amount of these loans was less than 5% of total shareholders’ equity at June 30, 2011.
114
The Board of Directors is required to review and approve all related party transactions, as described in Item 404 of Regulation S-K of the SEC’s rules. To the extent such transactions are ongoing business relationships with Parkvale Financial Corporation or Parkvale Bank, such transactions are reviewed annually and such relationships shall be on terms not materially less favorable than what would be usual and customary in similar transactions between unrelated persons dealing at arm’s length.
Item 14. Principal Accountant Fees and Services
The following table sets forth the aggregate fees paid by us to ParenteBeard LLC for professional services rendered by ParenteBeard LLC in connection with the audit of Parkvale Financial Corporation’s consolidated financial statements for fiscal 2011, 2010, and 2009, as well as the fees paid by us to ParenteBeard LLC for audit-related services, tax services and all other services rendered by ParenteBeard LLC to us during fiscal 2011, 2010, and 2009.
| Year Ended June 30, | ||||||||||||
| 2011 | 2010 | 2009 | ||||||||||
| Audit Fees (1) |
$ | 140,200 | $ | 117,000 | $ | 138,000 | ||||||
| Audit-related fees (2) |
37,550 | 19,500 | 18,000 | |||||||||
| Tax fees (3) |
12,000 | 10,000 | 15,000 | |||||||||
|
|
|
|
|
|
|
|||||||
| Total |
$ | 189,750 | $ | 146,500 | $ | 171,000 | ||||||
|
|
|
|
|
|
|
|||||||
| (1) | Audit fees consist of fees incurred in connection with the audit of our annual financial statements and the review of the interim financial statements included in our quarterly reports filed with the Securities and Exchange Commission, as well as work generally only the independent registered public accountant can reasonably be expected to provide, such as statutory audits, consents and assistance with and review of documents filed with the Securities and Exchange Commission. |
| (2) | Audit-related fees primarily consist of fees incurred in connection with the audit of certain benefit plans. |
| (3) | Tax fees consist of fees incurred in connection with the preparation of state and federal tax returns. |
As provided in its charter, the Audit-Finance Committee selects our independent registered public accounting firm and pre-approves all audit services to be provided by the independent registered public accounting firm to Parkvale Financial Corporation. The Audit-Finance Committee also reviews and pre-approves all audit related and non-audit related services rendered by our independent registered public accounting firm in accordance with the Audit-Finance Committee’s charter. In its review of these services and related fees and terms, the Audit-Finance Committee considers, among other things, the possible effect of the performance of such services on the independence of our independent registered public accounting firm. The Audit-Finance Committee pre-approves certain audit-related services and certain non-audit related tax services, which are specifically described by the Audit-Finance Committee on an annual basis, and separately approves other individual engagements as necessary.
During fiscal 2011, each new engagement of ParenteBeard LLC was approved in advance by the Audit-Finance Committee and none of those engagements made use of the de minimis exception to pre-approval contained in the Securities and Exchange Commission rules.
Part IV.
Item 15. Exhibits and Financial Statement Schedules
(a) (1) Financial Statements
| The following information is filed in the Items of this Form 10-K indicated below. Selected Financial Data |
Item 6 | |
| Management’s Discussion and Analysis of Financial Condition and Results of Operations |
Item 7 | |
| Management’s Report on Internal Control over Financial Reporting |
Item 9A | |
| Report of Independent Registered Public Accounting Firm on Internal Control over Financial Reporting |
Item 9A | |
| Report of Independent Registered Public Accounting Firm on Consolidated Financial Statements |
Item 8 | |
| Consolidated Statements of Financial Condition at June 30, 2011 and 2010 |
Item 8 | |
| Consolidated Statements of Operations for each of the three years in the period ended June 30, 2011 |
Item 8 | |
| Consolidated Statements of Cash Flows for each of the three years in the period ended June 30, 2011 |
Item 8 | |
| Consolidated Statements of Shareholders’ Equity for each of the three years in the period ended June 30, 2011 |
Item 8 | |
| Notes to Consolidated Financial Statements |
Item 8 |
115
(a) (2) Financial Statements Schedules
All financial statement schedules have been omitted as the required information is inapplicable or has been included in the Consolidated Financial Statements or notes thereto.
(a) (3) Exhibits
| No. | Exhibits |
Reference | ||
| 3.1 | Articles of Incorporation | A | ||
| 3.2 | Amendment to Articles of Incorporation | D | ||
| 3.3 | Amended and Restated Bylaws | D | ||
| 4 | Common Stock Certificate | A | ||
| 10.1 | 1993 Key Employee Stock Compensation Program | B | ||
| 10.2 | 1993 Directors’ Stock Option Plan | E | ||
| 10.3 | Amended and Restated 2004 Stock Incentive Plan | D | ||
| 10.4 | Consulting Agreement with Robert D. Pfischner | C | ||
| 10.5 | Amended and Restated Employment Agreement with Robert J. McCarthy, Jr. | D | ||
| 10.6 | Change in Control Severance Agreement with Gilbert A. Riazzi | F | ||
| 10.7 | Amended and Restated Change in Control Severance Agreement with Gail B. Anwyll | D | ||
| 10.8 | Amended and Restated Change in Control Severance Agreement with Thomas R. Ondek | D | ||
| 10.9 | Amended and Restated Executive Deferred Compensation Plan | D | ||
| 10.10 | Amended and Restated Supplemental Executive Benefit Plan | D | ||
| 10.11 | Form of Letter Agreement and Amendment to Executive Compensation and Benefit Plans | G | ||
| 22 | Subsidiaries of Registrant Reference is made to Item 1. Business — Subsidiaries for the required information |
|||
| 23 | Consent of Independent Registered Public Accounting Firm | |||
| 31.1 | Certification of Chief Executive Officer pursuant to Rule 13a-14(a)/15d-14(a) of the Securities Exchange Act of 1934, as amended, as adopted pursuant to Section 302 of the Sarbanes-Oxley Act of 2002 | |||
| 31.2 | Certification of Chief Financial Officer pursuant to Rule 13a-14(a)/15d-14(a) of the Securities Exchange Act of 1934, as amended, as adopted pursuant to Section 302 of the Sarbanes-Oxley Act of 2002 | |||
| 32.1 | Certifications of Chief Executive Officer and Chief Financial Officer pursuant to 18 U.S.C. Section 1350 as adopted pursuant to Section 906 of the Sarbanes-Oxley Act of 2002 | |||
| 99.1 | Certifications of Chief Executive Officer and Chief Financial Officer pursuant to 31 C.F.R. Section 30.15 | |||
| A | Incorporated by reference to the Registrant’s Form 8-B filed with the SEC on January 5, 1989. |
| B | Incorporated by reference, as amended, to Form S-8 at File No. 33-98812 filed by the Registrant with the SEC on November 1, 1995. |
| C | Incorporated by reference to Form 10-K filed by the Registrant with the SEC on September 28, 1994. |
| D | Incorporated by reference to Form 8-K filed by the Registrant with the SEC on December 28, 2007. |
| E | Incorporated by reference to Form 10-K filed by the Registrant with the SEC on September 24, 1998. |
| F | Incorporated by reference to Form 8-K filed by the Registrant with the SEC on February 3, 2010 |
| G | Incorporated by reference to Form 10-K filed by the Registrant with the SEC on September 10, 2009. |
116
SIGNATURES
Pursuant to the requirements of Section 13 or 15(d) of the Securities Exchange Act of 1934, the Registrant has duly caused this report to be signed on its behalf by the undersigned, thereunto duly authorized.
| PARKVALE FINANCIAL CORPORATION | ||||||
| Date: September 27, 2011 |
By: |
/s/ Robert J. McCarthy, Jr. | ||||
| Robert J. McCarthy, Jr. Director, President and Chief Executive Officer | ||||||
Pursuant to the requirements of the Securities Exchange Act of 1934, this report has been signed below by the following persons on behalf of the Registrant and in the capacities and on the dates indicated.
| /s/ Robert J. McCarthy, Jr. Robert J. McCarthy, Jr. Director, President and Chief Executive Officer |
September 27, 2011 Date | |
| /s/ Gilbert A. Riazzi Gilbert A. Riazzi Chief Financial Officer |
September 27, 2011 Date | |
| /s/ Robert D. Pfischner Robert D. Pfischner, Chairman of the Board |
September 27, 2011 Date | |
| /s/ Fred P. Burger, Jr. Fred P. Burger, Jr., Director |
September 27, 2011 Date | |
| /s/ Andrea F. Fitting Andrea F. Fitting, Director |
September 27, 2011 Date | |
| /s/ Stephen M. Gagliardi Stephen M. Gagliardi, Director |
September 27, 2011 Date | |
| /s/ Patrick J. Minnock Patrick J. Minnock, Director |
September 27, 2011 Date | |
| /s/ Harry D. Reagan Harry D. Reagan, Director |
September 27, 2011 Date | |
117