Attached files
| file | filename |
|---|---|
| 8-K - SURMODICS, INC. 8-K - SURMODICS INC | a6860882.htm |
Exhibit 99.1
Investor Presentation Maharaj Gary Maharaj, President and CEO © 2011 SurModics, Inc. 1 © 2011 SurModics, Inc. September 2011
Safe Harbor Statement Some of the statements made during this meeting may be considered forward-looking statements. The 10-K for fiscal year 2010 identifies certain factors that could cause the Company’s actual results to differ materially from those projected in any forward-looking statements made during this meeting. The 10-K and subsequent filings are available www surmodics com through the Company or online at www.surmodics.com. This presentation contains non-GAAP financial measures to provide information pertinent to ongoing business performance. These measures are reconciled to the reported GAAP measures within this presentation. © 2011 SurModics, Inc. 2
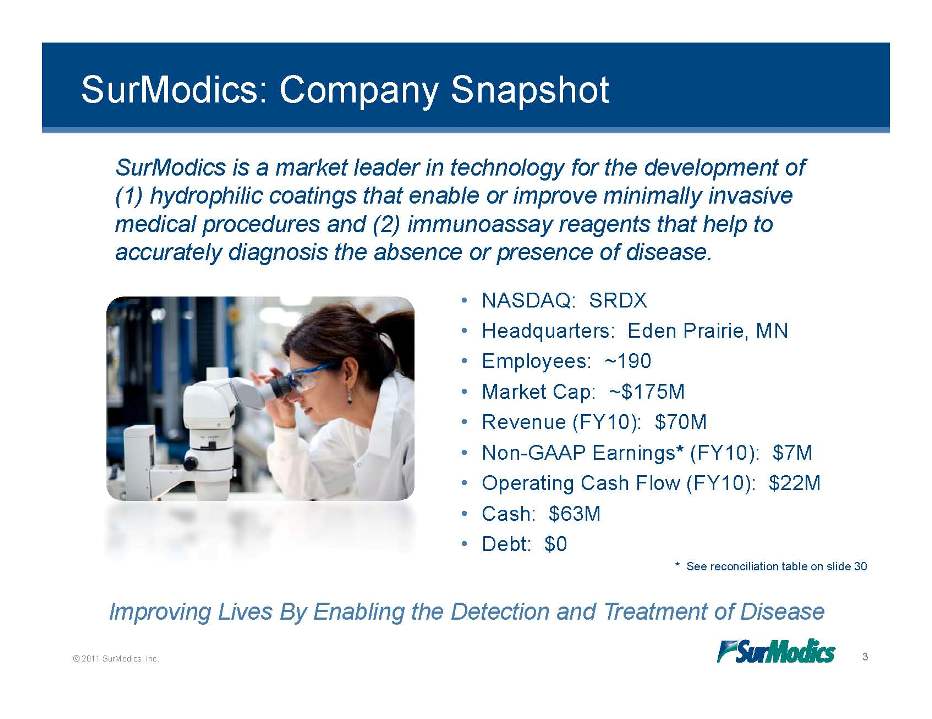
SurModics: Company Snapshot SurModics is a market leader in technology for the development of (1) hydrophilic coatings that enable or improve minimally invasive • NASDAQ: SRDX medical procedures and (2) immunoassay reagents that help to accurately diagnosis the absence or presence of disease. • Headquarters: Eden Prairie, MN • Employees: ~190 • Market Cap: ~$175M • Revenue (FY10): $70M • Non-GAAP Earnings* (FY10): $7M • Operating Cash Flow (FY10): $22M • Cash: $63M • Debt: $0 * See reconciliation table on slide 30 © 2011 SurModics, Inc. 3 Improving Lives By Enabling the Detection and Treatment of Disease
Where We Are Today Refocused on our core businesses • Core businesses have a pedigree of consistently outperforming the market • Commitment to R&D activities provides our Medical Device and IVD businesses with the potential for meaningful, differentiated products Leading market positions aided by differentiated offering • Technical superiority – industry “gold standard” • Excellent brand recognition and reputation • Deep Intellectual portfolio Property Strong market trends underpinning long-term growth opportunities • Significant presence in fastest growing medical device market segments – neurovascular, percutaneous valve therapy and peripheral applications • © 2011 SurModics, Inc. 4 Growing customer base that is sourcing SRDX immunoassay reagents into their new diagnostic tests
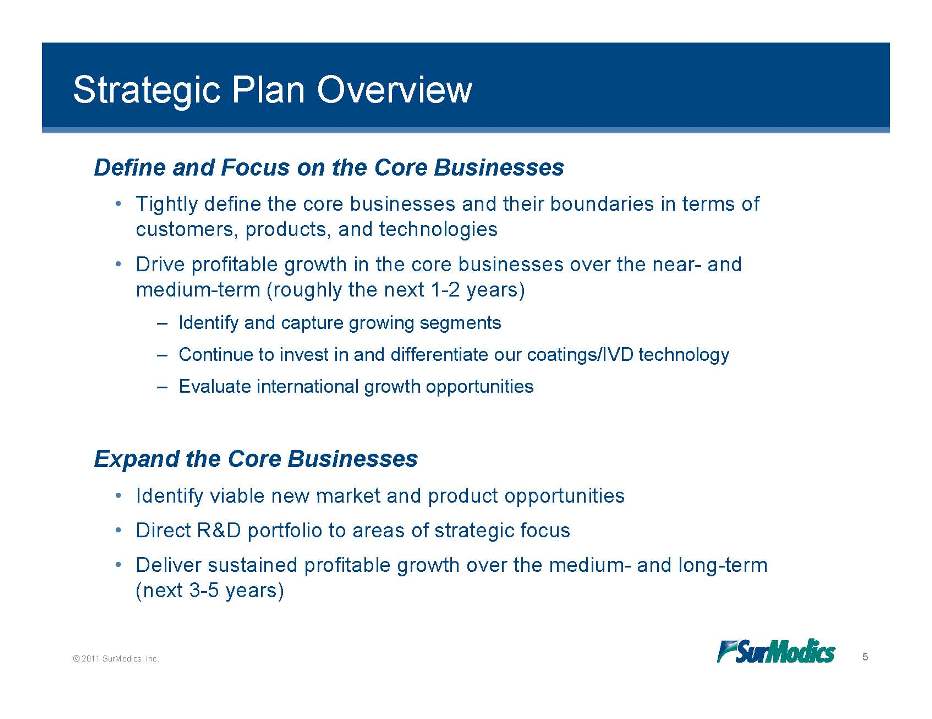
Strategic Plan Overview Define and Focus on the Core Businesses • Tightly define the core businesses and their boundaries in terms of customers, products, and technologies • Drive profitable growth in the core businesses over the near- and medium-term (roughly the next 1-2 years) – Identify and capture growing segments – Continue to invest in and differentiate our coatings/IVD technology – Evaluate international growth opportunities Expand the Core Businesses • Identify viable new market and product opportunities • Direct R&D portfolio to areas of strategic focus • Deliver sustained profitable growth over the medium- and long-term (next 3 5 years) © 2011 SurModics, Inc. 5 3-
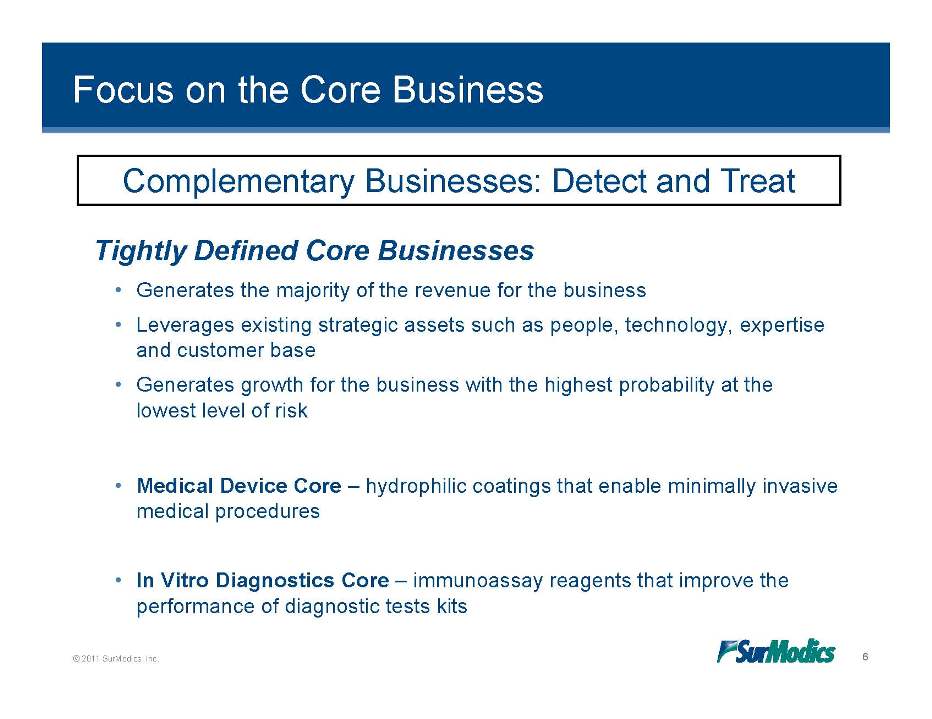
Focus on the Core Business Complementary Businesses: Detect and Treat Tightly Defined Core Businesses • Generates the majority of the revenue for the business • Leverages existing strategic assets such as people, technology, expertise and customer base • Generates growth for the business with the highest probability at the lowest level of risk • Medical Device Core – hydrophilic coatings that enable minimally invasive medical procedures • In Vitro Diagnostics Core – immunoassay © 2011 SurModics, Inc. 6 reagents that improve the performance of diagnostic tests kits
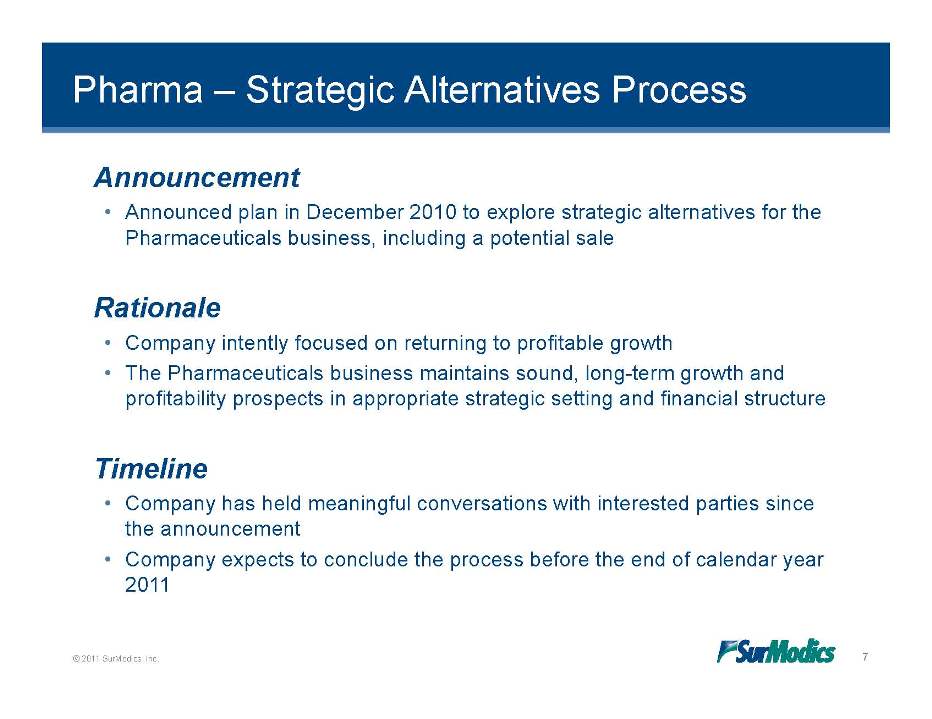
Pharma – Strategic Alternatives Process Announcement • Announced plan in December 2010 to explore strategic alternatives for the Pharmaceuticals business, including a potential sale Rationale • Company intently focused on returning to profitable growth • The Pharmaceuticals business maintains sound, long-term growth and profitability prospects in appropriate strategic setting and financial structure Timeline • Company has held meaningful conversations with interested parties since the announcement • Company expects to conclude the process before the end of calendar year 2011 © 2011 SurModics, Inc. 7
Business Overview © 2011 SurModics, Inc. 8
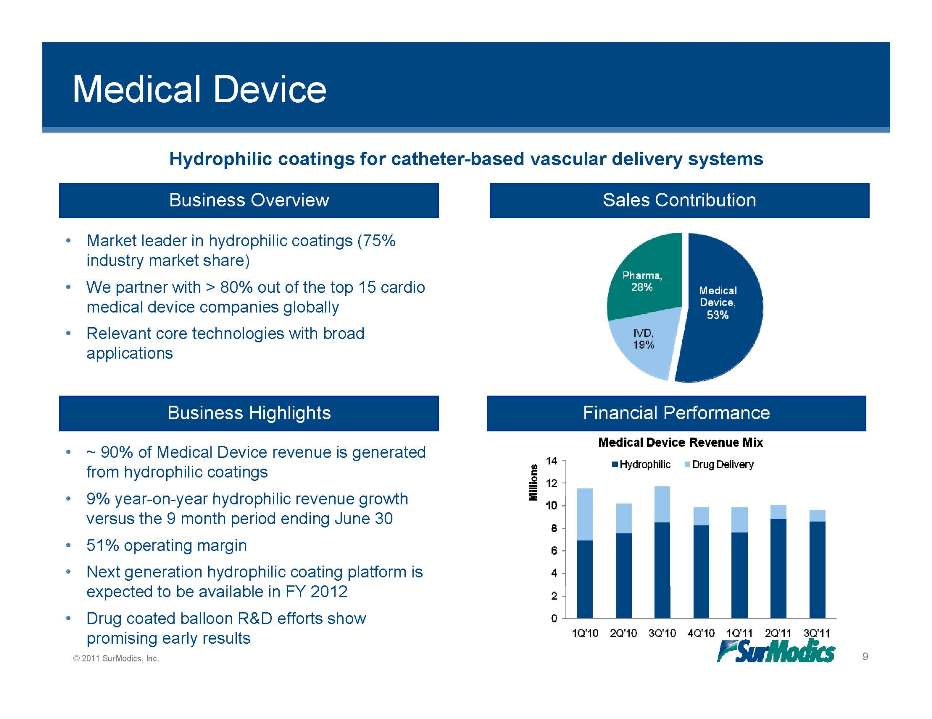
Medical Device Business Overview Sales Contribution Hydrophilic coatings for catheter-based vascular delivery systems • Market leader in hydrophilic coatings (75% industry market share) • We partner with > 80% out of the top 15 cardio medical device companies globally • Relevant core technologies with broad applications Business Highlights Financial Performance • ~ 90% of Medical Device revenue is generated from hydrophilic coatings 9% ear on ear h drophilic re en e gro th • year-on-year hydrophilic revenue growth versus the 9 month period ending June 30 • 51% operating margin • Next generation hydrophilic coating platform is © 2011 SurModics, Inc. 9 expected to be available in FY 2012 • Drug coated balloon R&D efforts show promising early results Pharma. 28% Medical Device. 53% IVD, 19% Medical Device Revenue Mix Hydrophilic Drug Delivery 0 2 4 6 8 10 12 14 Millions 1Q’10 2Q’10 3Q’10 4Q’10 1Q’11 2Q’11 3Q’11
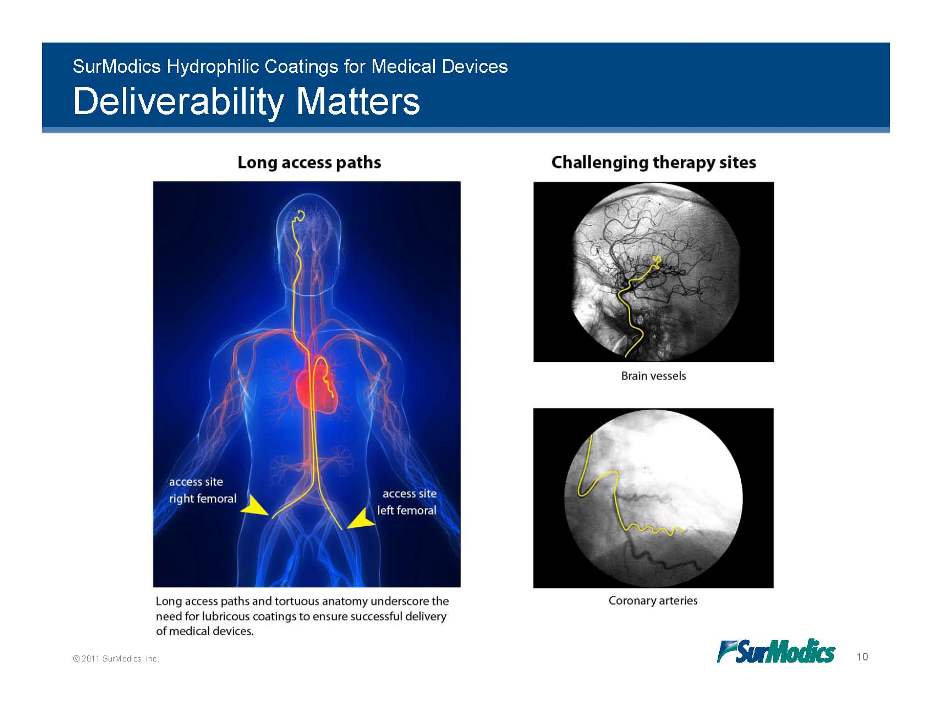
SurModics Hydrophilic Coatings for Medical Devices Deliverability Matters © 2011 SurModics, Inc. 10 Long access paths Challenging therapy sites Brain vessels Coronary arteries Long access paths and tortuous anatomy underscore the need for lubricous coatings to ensure successful delivery of medical devices.
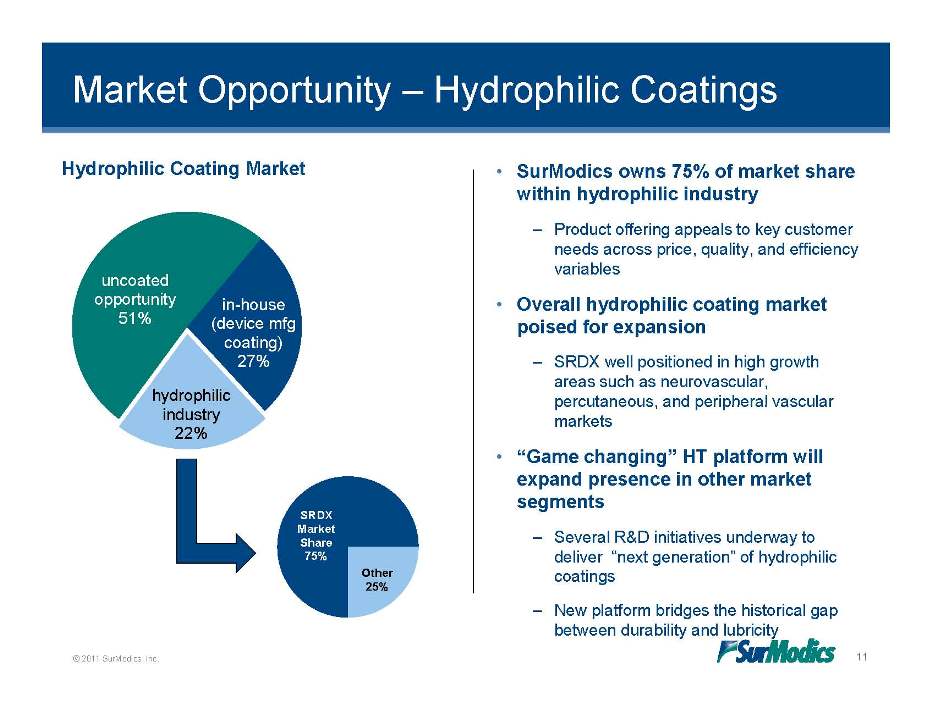
Market Opportunity – Hydrophilic Coatings Hydrophilic Coating Market • SurModics owns 75% of market share within hydrophilic industry in-house uncoated opportunity 51% – Product offering appeals to key customer needs across price, quality, and efficiency variables • Overall hydrophilic coating market (device mfg coating) 27% hydrophilic poised for expansion – SRDX well positioned in high growth areas such as neurovascular, percutaneous peripheral industry 22% percutaneous, and vascular markets • “Game changing” HT platform will expand presence in other market segments – Several R&D initiatives underway to deliver “next generation” of hydrophilic coatings SRDX Market Share 75% Other 25% © 2011 SurModics, Inc. 11 – New platform bridges the historical gap between durability and lubricity
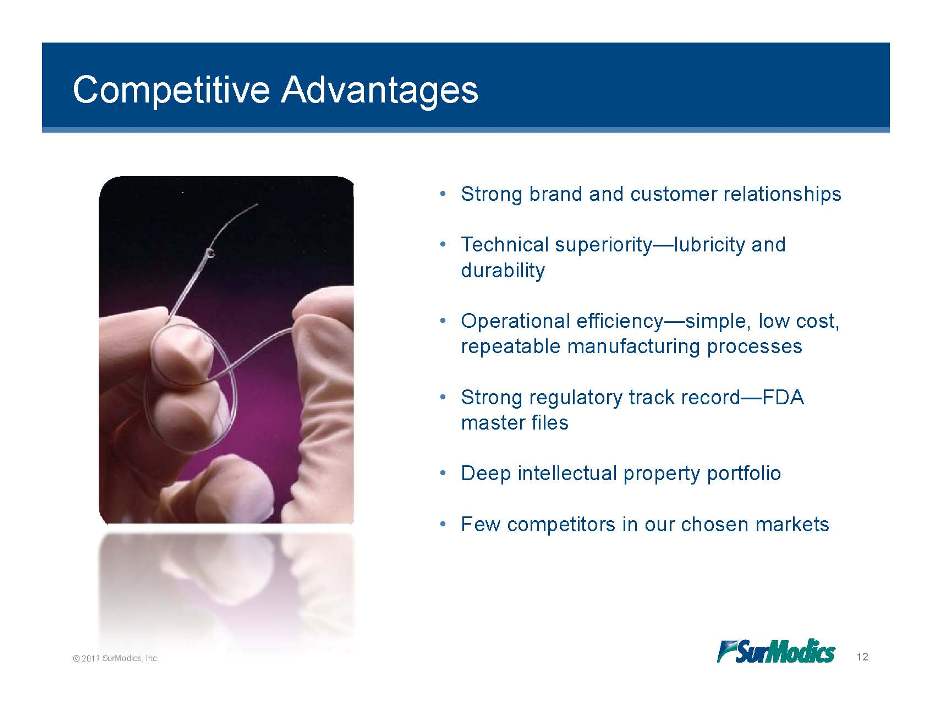
Competitive Advantages • Strong brand and customer relationships • Technical superiority—lubricity and durability • Operational efficiency—simple, low cost, repeatable manufacturing processes • Strong regulatory track record—FDA master files • Deep intellectual property portfolio • Few competitors in our chosen markets © 2011 SurModics, Inc. 12
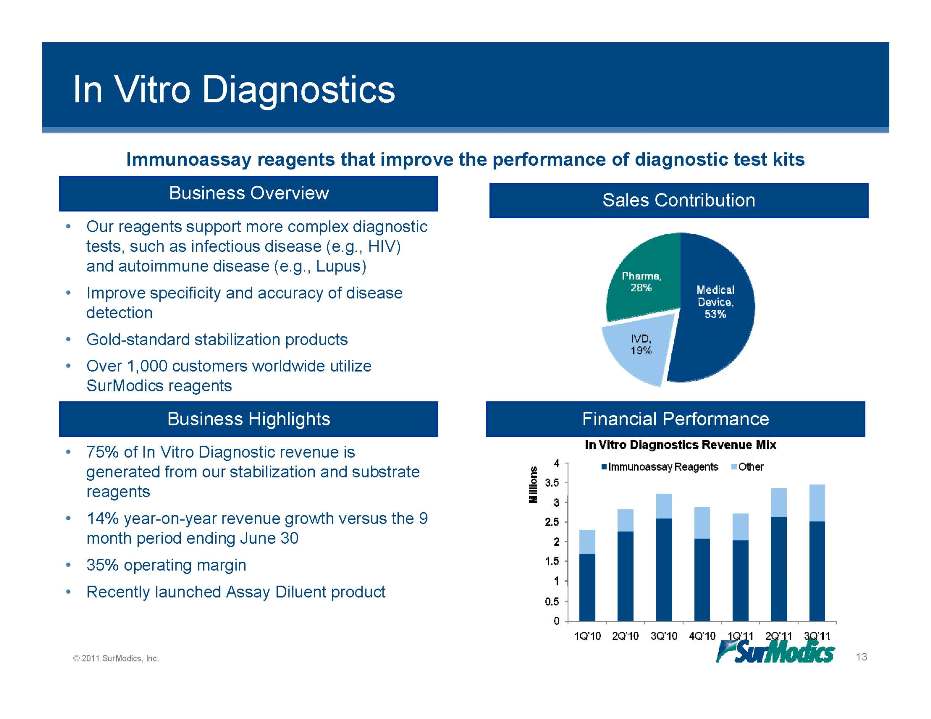
In Vitro Diagnostics Business Overview Sales Contribution Our reagents support more complex Immunoassay reagents that improve the performance of diagnostic test kits • diagnostic tests, such as infectious disease (e.g., HIV) and autoimmune disease (e.g., Lupus) • Improve specificity and accuracy of disease detection • Gold-standard stabilization products • Over 1,000 customers worldwide utilize SurModics reagents Business Highlights Financial Performance • 75% of In Vitro Diagnostic revenue is generated from our stabilization and substrate reagents • 14% year-on-year revenue growth versus the 9 month period ending June 30 • 35% operating margin © 2011 SurModics, Inc. 13 • Recently launched Assay Diluent product In Vitro Diagnostics Revenue Mix Immunoassay Reagents Other Millions 0 0.5 1 1.5 2 2.5 3 3.5 4 1Q’10 2Q’10 3Q’10 4Q’10 1Q’11 2Q’11 3Q’11
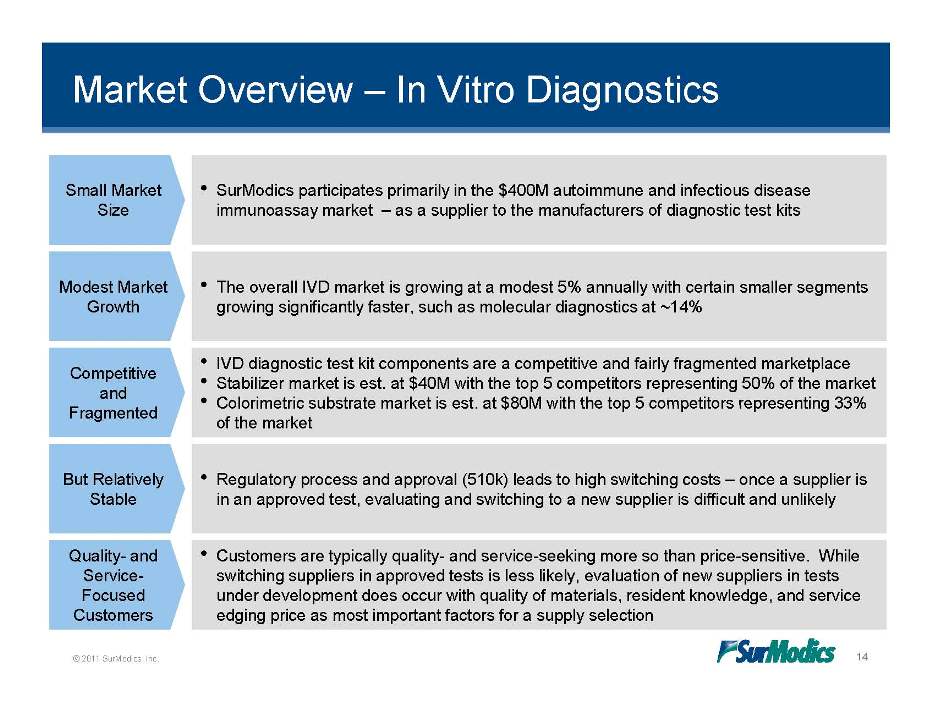
Market Overview – In Vitro Diagnostics • SurModics participates primarily in the $400M autoimmune and infectious disease immunoassay market – as a supplier to the manufacturers of diagnostic test kits Small Market Size • The overall IVD market is growing at a modest 5% annually with certain smaller segments growing significantly faster, such as molecular diagnostics at ~14% Growth Modest Market • IVD diagnostic test kit components are a competitive and fairly fragmented marketplace • Stabilizer market is est. at $40M with the top 5 competitors representing 50% of the market • Colorimetric substrate est representing 33% Competitive and market is est. at $80M with the top 5 competitors of the market Fragmented • Regulatory process and approval (510k) leads to high switching costs – once a supplier is But Relatively in an approved test, evaluating and switching to a new supplier is difficult and unlikely Stable • Customers are typically quality- and service-seeking more so than price-sensitive. While switching suppliers in approved tests is less likely, evaluation of new suppliers in tests Quality- and Service-© 2011 SurModics, Inc. 14 under development does occur with quality of materials, resident knowledge, and service edging price as most important factors for a supply selection Focused Customers
Strategy Overview • Increase use of SurModics’ reagents in customer diagnostic kits – Increase customer base (# of kit manufacturer customers) – Increase “share of kit” (more SRDX components per diagnostic kit) • Develop and launch new immunoassay components that… – Improve test result accuracy – Reduce test times – Improve selectivity and sensitivity of tests (improve disease detection) • Expand new geographies into • Enter new (e.g., molecular diagnostic) or underserved (blotting) market segments © 2011 SurModics, Inc. 15 with existing products
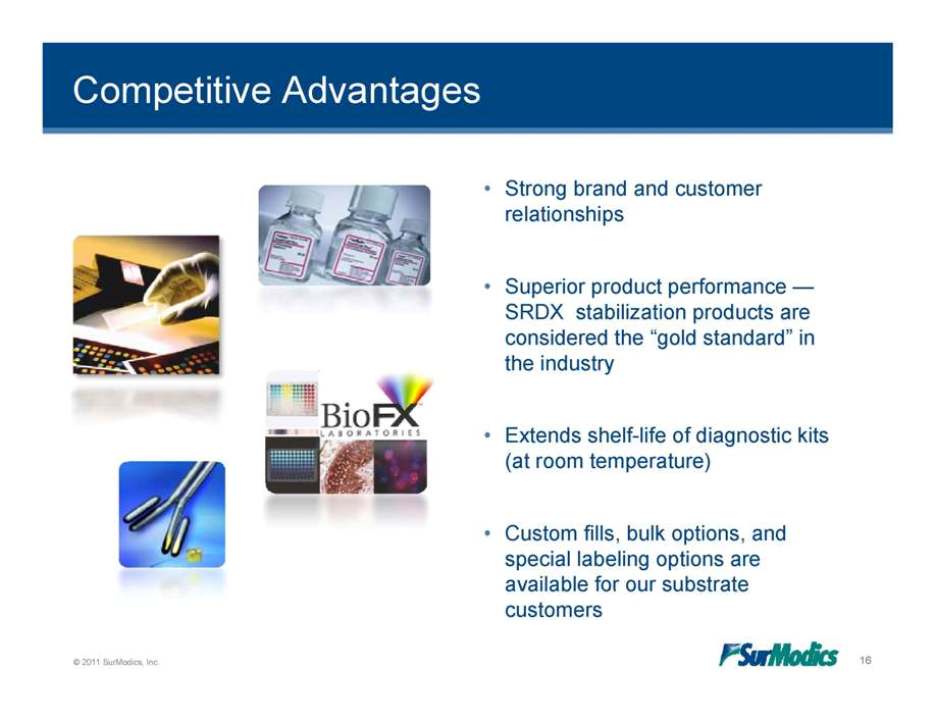
Competitive Advantages • Strong brand and customer relationships • Superior product performance — SRDX stabilization products are considered the “gold standard” in the industry • Extends shelf-life of diagnostic kits (at room temperature) • Custom fills, bulk options, and special labeling options are © 2011 SurModics, Inc. 16 available for our substrate customers
Financial Review Tim Arens, Vice President of Finance and Interim CFO © 2011 SurModics, Inc. 17 © 2011 SurModics, Inc.
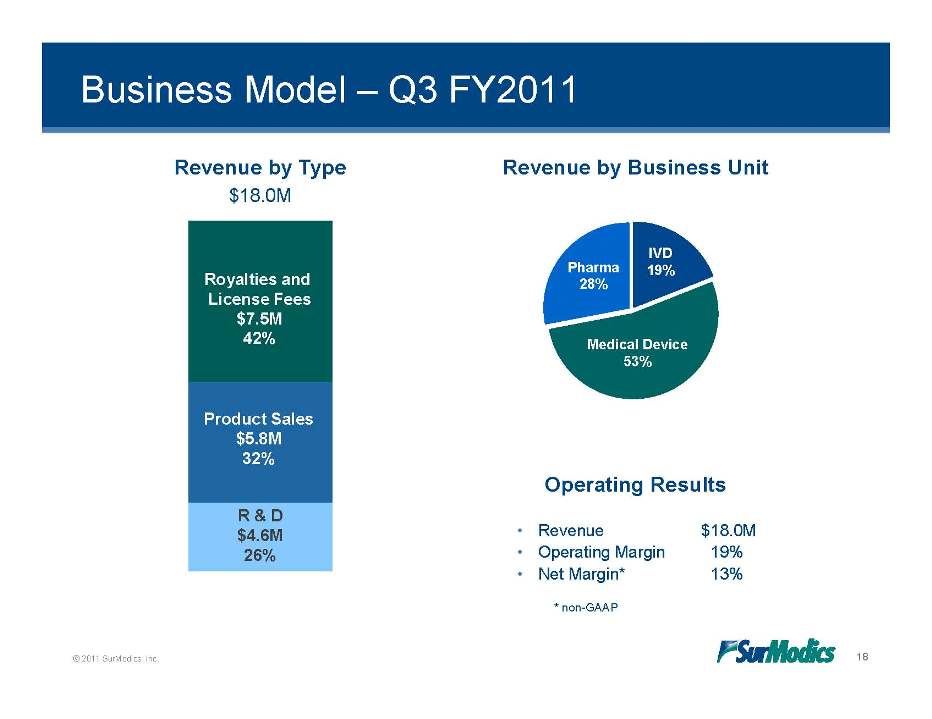
Business Model – Q3 FY2011 Revenue by Type $18.0M Revenue by Business Unit IVD 19% Royalties and License Fees $7 5M Pharma 28% Medical Device 53% 7.5M 42% Operating Results Product Sales $5.8M 32% • Revenue $18.0M • Operating Margin 19% • Net Margin* 13% R & D $4.6M 26% © 2011 SurModics, Inc. 18 *non-GAAP
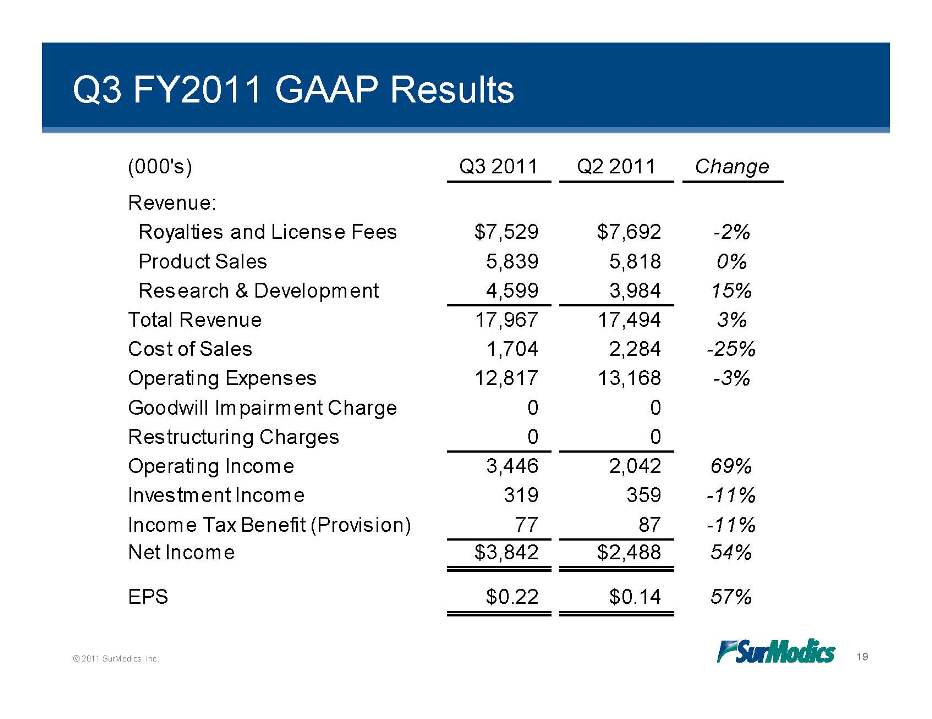
Q3 FY2011 GAAP Results (000's) Q3 2011 Q2 2011 Change Revenue: $ $ Royalties and License Fees 7,529 7,692 -2% Product Sales 5,839 5,818 0% Research & Development 4,599 3,984 15% 17 967 17 494 3% Total Revenue 17,967 17,494 Cost of Sales 1,704 2,284 -25% Operating Expenses 12,817 13,168 -3% Impairment 0 0 Goodwill Charge Restructuring Charges 0 0 Operating Income 3,446 2,042 69% Investment 319 359 11% Income –Income Tax Benefit (Provision) 77 87 -11% Net Income $3,842 $2,488 54% © 2011 SurModics, Inc. 19 EPS $0.22 $0.14 57%
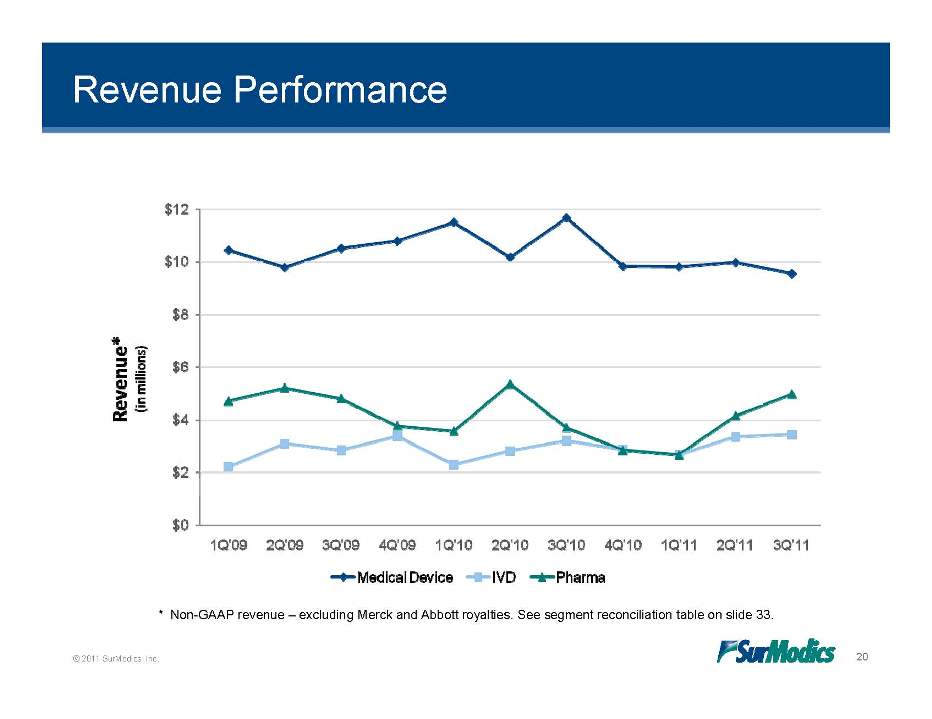
Revenue Performance © 2011 SurModics, Inc. 20 * Non-GAAP revenue – excluding Merck and Abbott royalties. See segment reconciliation table on slide 33. Revenue* (in millions) Medical Device IVD Pharma 1Q’10 2Q’10 3Q’10 4Q’10 1Q’11 2Q’11 3Q’11 1Q’09 2Q’09 3Q’09 4Q’09 $0 $2 $4 $6 $8 $10 $12
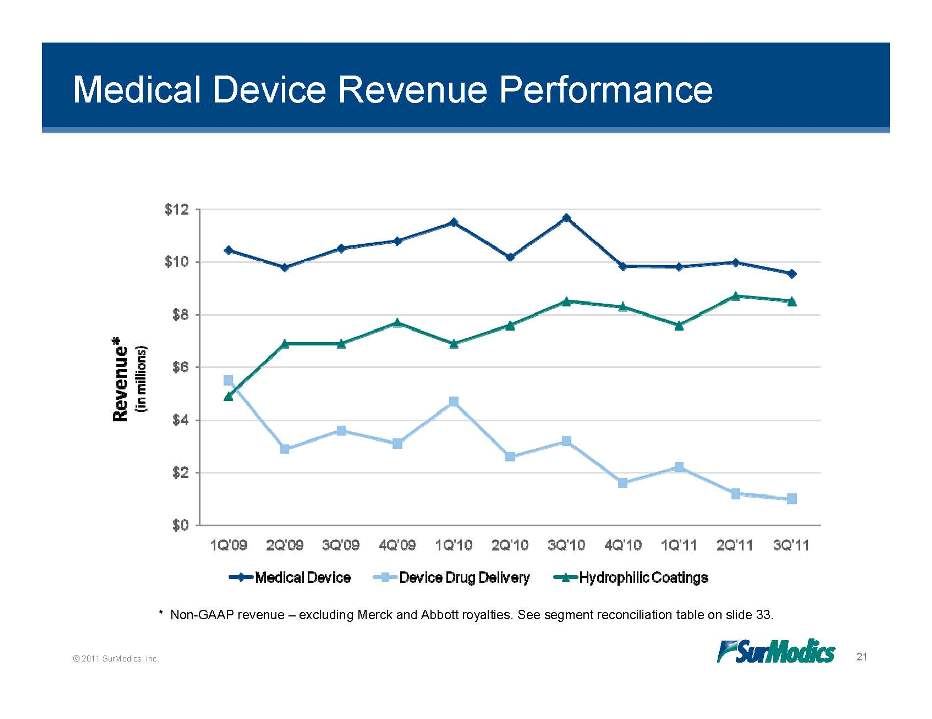
Medical Device Revenue Performance © 2011 SurModics, Inc. 21 * Non-GAAP revenue – excluding Merck and Abbott royalties. See segment reconciliation table on slide 33. 1Q’10 2Q’10 3Q’10 4Q’10 1Q’11 2Q’11 3Q’11 1Q’09 2Q’09 3Q’09 4Q’09 $0 $2 $4 $6 $8 $10 $12 Medical Device Device Drug Delivery Hydrophilic Coatings
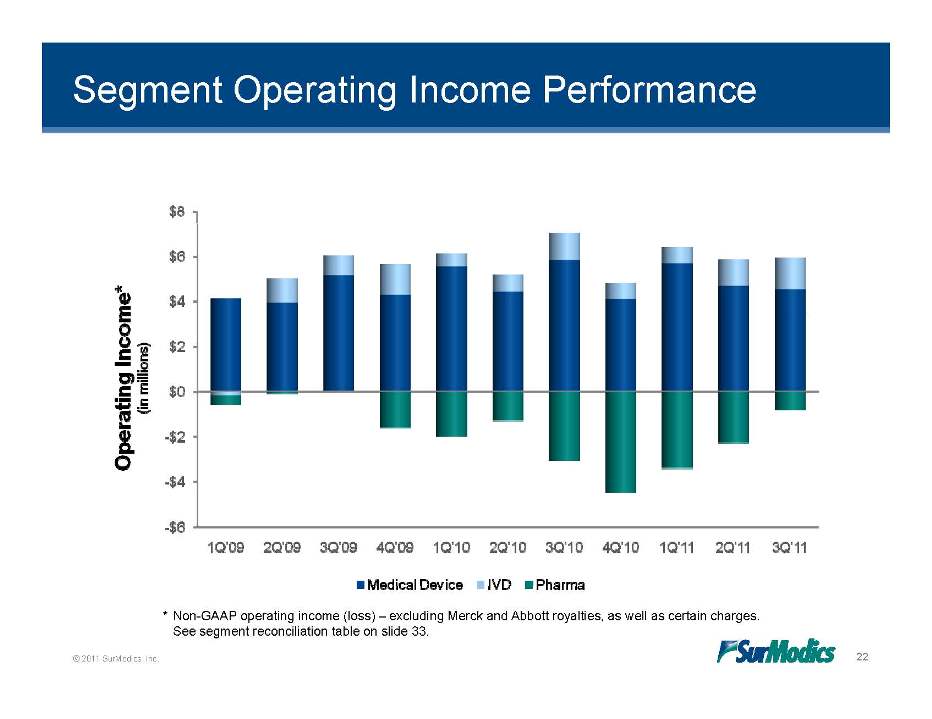
Segment Operating Income Performance © 2011 SurModics, Inc. 22 * Non-GAAP operating income (loss) – excluding Merck and Abbott royalties, as well as certain charges. See segment reconciliation table on slide 33. 1Q’10 2Q’10 3Q’10 4Q’10 1Q’11 2Q’11 3Q’11 1Q’09 2Q’09 3Q’09 4Q’09 -$6 -$4 -$2 $0 $2 $4 $6 $8 Medical Device IVD Pharma Operating Income* (in millions)
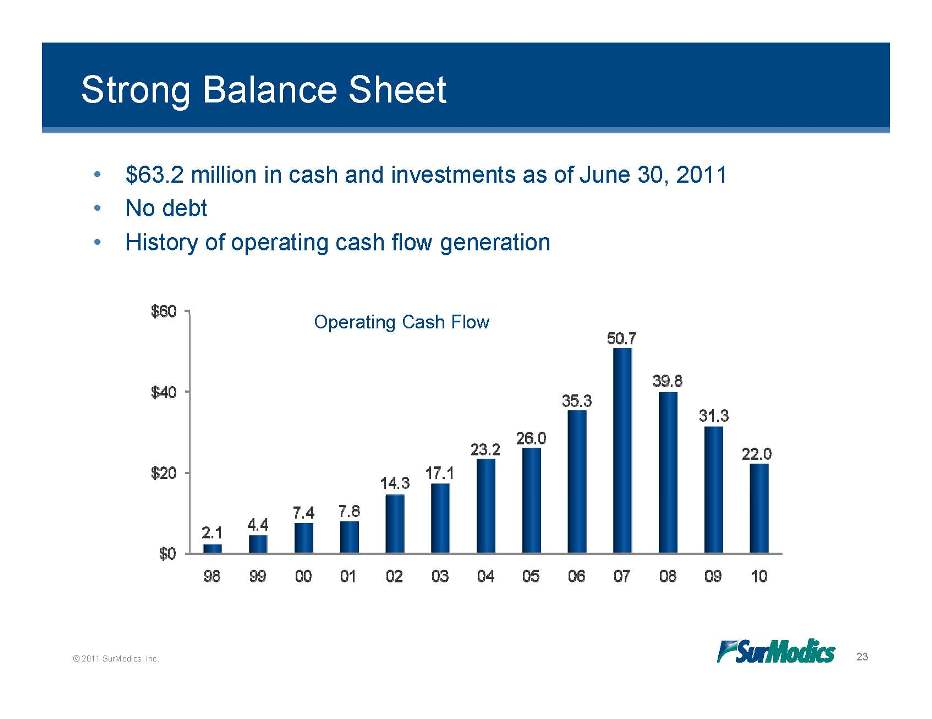
Strong Balance Sheet • $63.2 million in cash and investments as of June 30, 2011 • No debt • History of operating cash flow generation Operating Cash Flow © 2011 SurModics, Inc. 23 $0 $20 $40 $60 98 99 00 01 02 03 04 05 06 07 08 09 10 2.1 4.4 7.4 7.8 14.3 17.1 23.2 26.0 35.3 50.7 39.8 31.3 22.0
Investor Relations Contact For additional inquiries, please contact: Tim Arens 952-500-7056 © 2011 SurModics, Inc. 24
Appendix © 2011 SurModics, Inc. 25
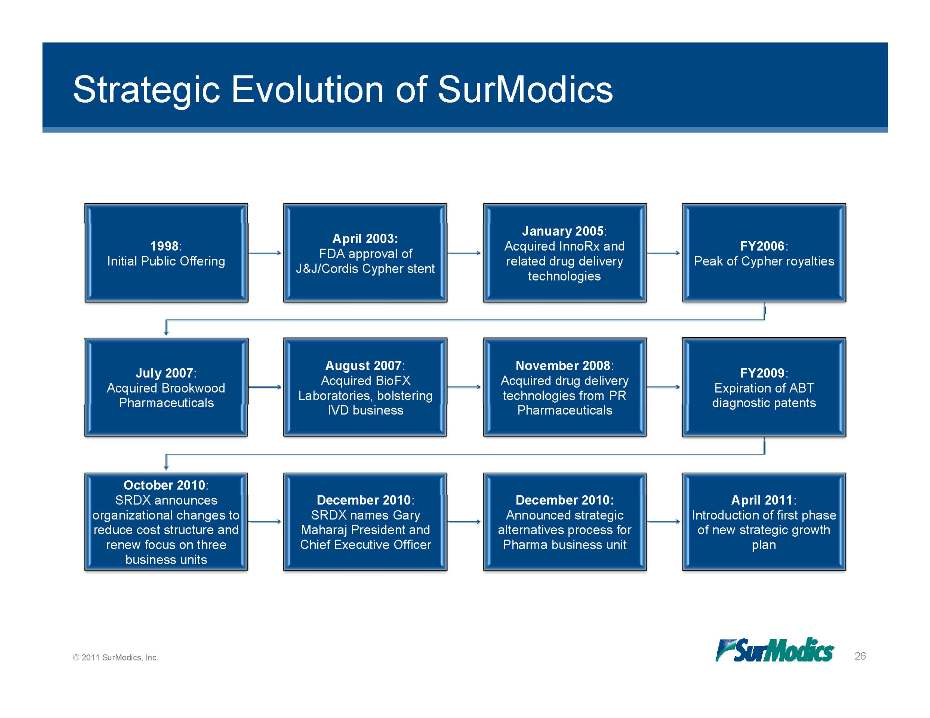
Strategic Evolution of SurModics 1998: Initial Public Offering April 2003: FDA approval of J&J/Cordis Cypher stent January 2005: Acquired InnoRx and related drug delivery technologies FY2006: Peak of Cypher royalties July 2007: Acquired Brookwood August 2007: Acquired BioFX Laboratories, bolstering November 2008: Acquired drug delivery technologies from PR FY2009: Expiration of ABT Pharmaceuticals IVD business Pharmaceuticals diagnostic patents October 2010: SRDX announces organizational changes to reduce cost structure and renew focus on three business units December 2010: SRDX names Gary Maharaj President and Chief Executive Officer December 2010: Announced strategic alternatives process for Pharma business unit April 2011: Introduction of first phase of new strategic growth plan © 2011 SurModics, Inc. 26
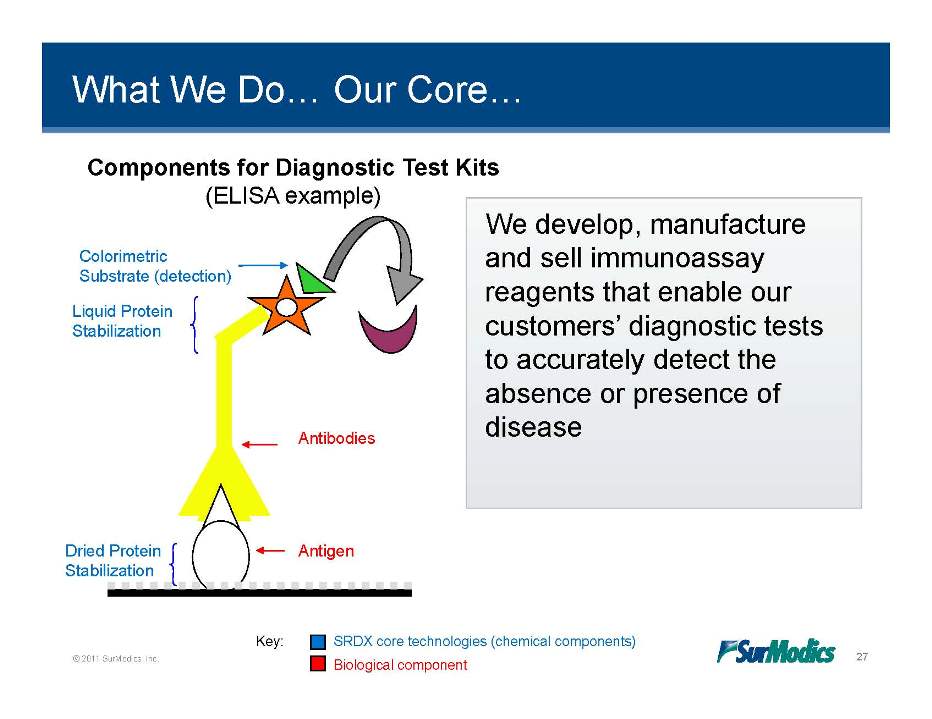
What We Do… Our Core… Components for Diagnostic Test Kits (ELISA example) develop manufacture Colorimetric Substrate (detection) Liquid We develop, and sell immunoassay reagents that enable our Protein Stabilization customers’ diagnostic tests to accurately detect the absence or presence of Antibodies disease Antigen Dried Protein Stabilization © 2011 SurModics, Inc. 27 Key: SRDX core technologies (chemical components) Biological component
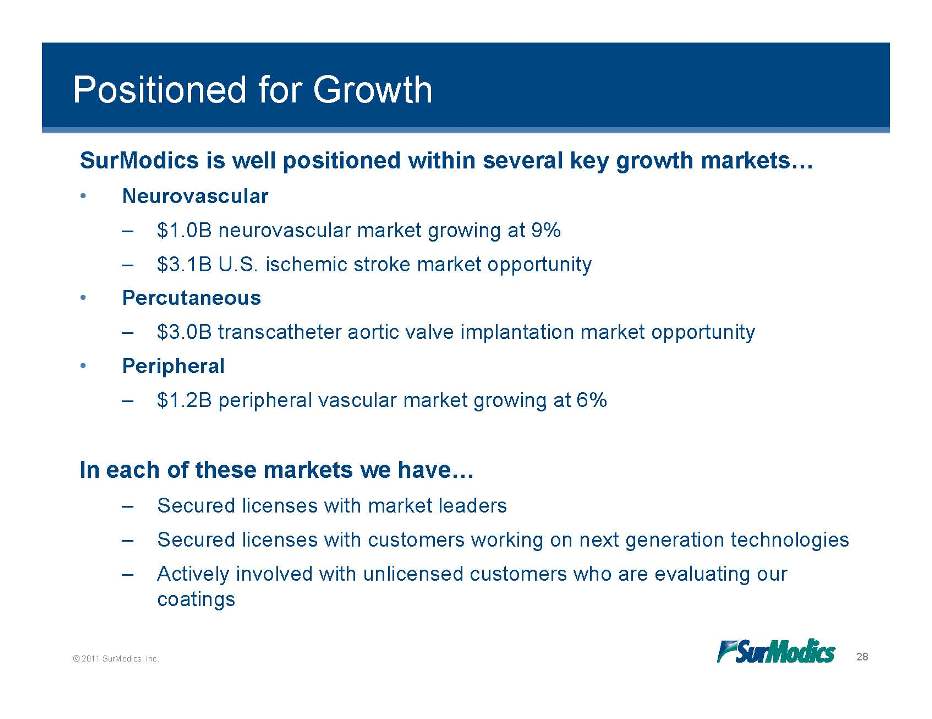
Positioned for Growth SurModics is well positioned within several key growth markets… • Neurovascular $1 0B – 1.0B neurovascular market growing at 9% – $3.1B U.S. ischemic stroke market opportunity • Percutaneous – $3.0B transcatheter aortic valve implantation market opportunity • Peripheral – $1.2B peripheral vascular market growing at 6% In each of these markets we have… – Secured licenses with market leaders – Secured licenses with customers working on next generation technologies – Actively involved with unlicensed customers who are evaluating our © 2011 SurModics, Inc. 28 coatings
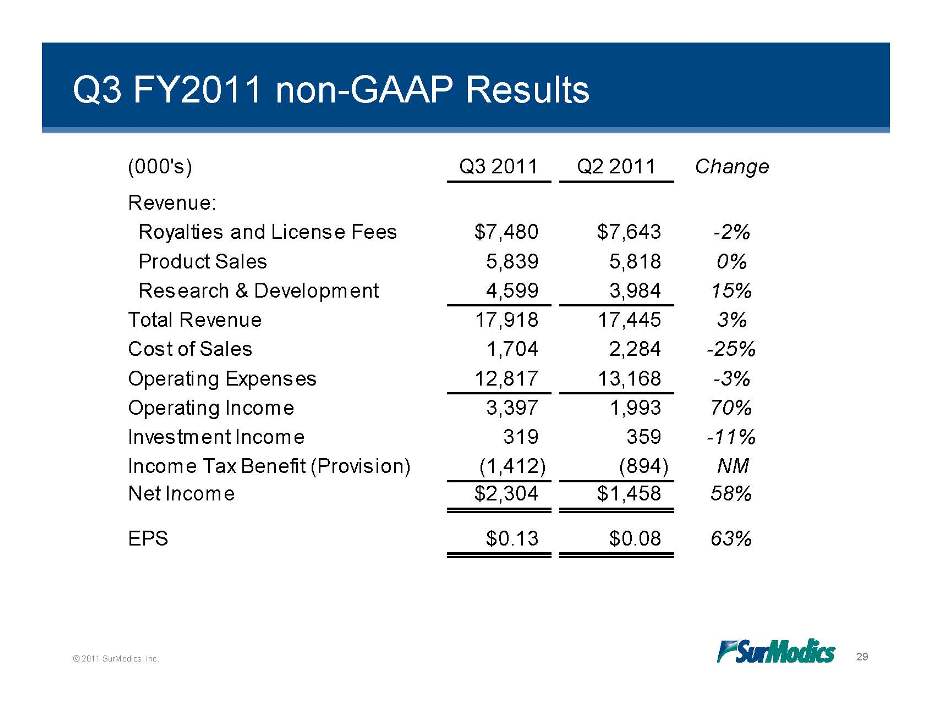
Q3 FY2011 non-GAAP Results (000's) Q3 2011 Q2 2011 Change Revenue: $ $ Royalties and License Fees 7,480 7,643 -2% Product Sales 5,839 5,818 0% Research & Development 4,599 3,984 15% 17 918 17 445 3% Total Revenue 17,918 17,445 Cost of Sales 1,704 2,284 -25% Operating Expenses 12,817 13,168 -3% Income 3 397 1 993 70% Operating 3,397 1,993 Investment Income 319 359 -11% Income Tax Benefit (Provision) (1,412) (894) NM Net Income $2 304 $1 458 58% 2,304 1,458 EPS $0.13 $0.08 63% © 2011 SurModics, Inc. 29
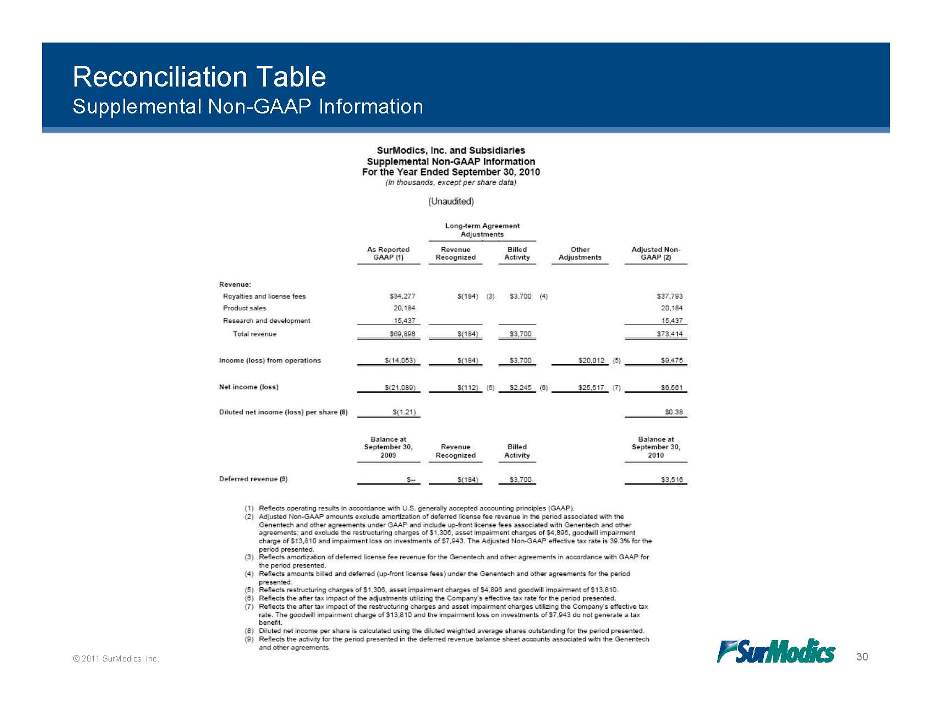
Reconciliation Table Supplemental Non-GAAP Information © 2011 SurModics, Inc. 30
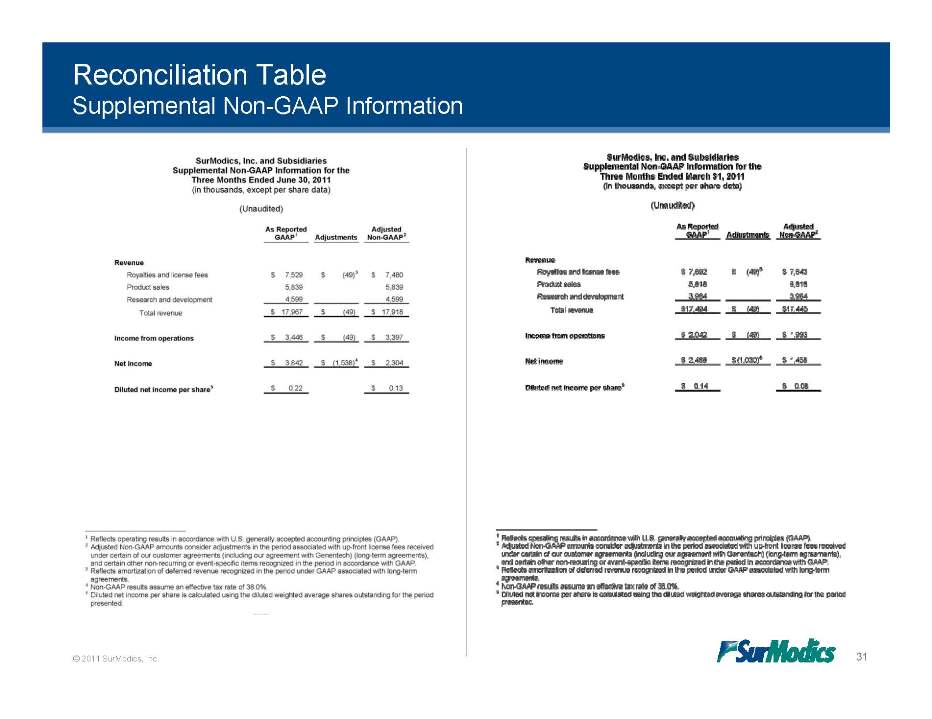
Reconciliation Table Supplemental Non-GAAP Information © 2011 SurModics, Inc. 31
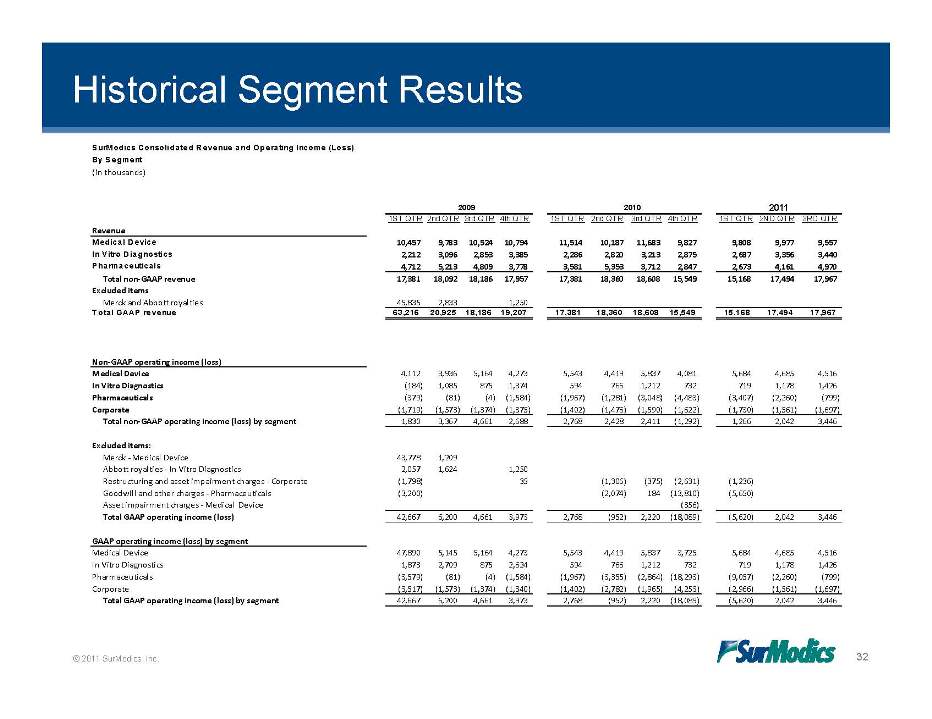
Historical Segment Results SurModics Consolidated Revenue and Operating Income (Loss) By Segment (in thousands) 2009 2010 2011 1ST QTR 2nd QTR 3rd QTR 4th QTR 1ST QTR 2nd QTR 3rd QTR 4th QTR 1ST QTR 2ND QTR 3RD QTR Revenue Medical Device 10,457 9,783 10,524 10,794 11,514 10,187 11,683 9,827 9,808 9,977 9,557 In Vitro Diagnostics 2,212 3,096 2,853 3,385 2,286 2,820 3,213 2,875 2,687 3,356 3,440 Pharmaceuticals 4,712 5,213 4,809 3,778 3,581 5,353 3,712 2,847 2,673 4,161 4,970 Total non‐GAAP revenue 17,381 18,092 18,186 17,957 17,381 18,360 18,608 15,549 15,168 17,494 17,967 Excluded items Merck and Abbott royalties 45,835 2,833 1,250 Total GAAP revenue 63,216 20,925 18,186 19,207 17,381 18,360 18,608 15,549 15,168 17,494 17,967 Non‐GAAP operating income (loss) Medical Device 4,112 3,936 5,164 4,273 5,543 4,419 5,837 4,081 5,684 4,685 4,516 In Vitro Diagnostics (184) 1,085 875 1,374 594 766 1,212 732 719 1,178 1,426 Pharmaceuticals (379) (81) (4) (1,584) (1,967) (1,281) (3,048) (4,483) (3,407) (2,260) (799) Corporate (1,719) (1,573) (1,374) (1,375) (1,402) (1,476) (1,590) (1,622) (1,730) (1,561) (1,697) Total non‐GAAP operating income (loss) by segment 1,830 3,367 4,661 2,688 2,768 2,428 2,411 (1,292) 1,266 2,042 3,446 Excluded items: Merck ‐ Medical Device 43,778 1,209 Abbott royalties ‐ In Vitro Diagnostics 2,057 1,624 1,250 Restructuring and asset impairment charges ‐ Corporate (1,798) 35 (1,306) (375) (2,631) (1,236) Goodwill and other charges ‐ Pharmaceuticals (3,200) (2,074) 184 (13,810) (5,650) Asset impairment charges ‐ Medical Device (356) Total GAAP operating income (loss) 42,667 6,200 4,661 3,973 2,768 (952) 2,220 (18,089) (5,620) 2,042 3,446 GAAP operating income (loss) by segment Medical Device 47,890 5,145 5,164 4,273 5,543 4,419 5,837 3,725 5,684 4,685 4,516 In Vitro Diagnostics 1,873 2,709 875 2,624 594 766 1,212 732 719 1,178 1,426 Pharmaceuticals (3,579) (81) (4) (1,584) (1,967) (3,355) (2,864) (18,293) (9,057) (2,260) (799) (3 517) (1 573) (1 374) (1 340) (1 402) (2 782) (1 965) (4 253) (2 966) (1 561) (1 697) © 2011 SurModics, Inc. 32 Corporate 3,517) 1,573) 1,374) 1,340) 1,402) 2,782) 1,965) 4,253) 2,966) 1,561) 1,697) Total GAAP operating income (loss) by segment 42,667 6,200 4,661 3,973 2,768 (952) 2,220 (18,089) (5,620) 2,042 3,446