Attached files
| file | filename |
|---|---|
| EX-24.1 - EX-24.1 - BARRY R G CORP /OH/ | d230707dex241.htm |
| EX-31.1 - EX-31.1 - BARRY R G CORP /OH/ | d230707dex311.htm |
| EX-31.2 - EX-31.2 - BARRY R G CORP /OH/ | d230707dex312.htm |
| EX-32.1 - EX-32.1 - BARRY R G CORP /OH/ | d230707dex321.htm |
| EX-23.1 - EX-23.1 - BARRY R G CORP /OH/ | d230707dex231.htm |
| EX-21.1 - EX-21.1 - BARRY R G CORP /OH/ | d230707dex211.htm |
| EX-10.45 - EX-10.45 - BARRY R G CORP /OH/ | d230707dex1045.htm |
| EX-10.36 - EX-10.36 - BARRY R G CORP /OH/ | d230707dex1036.htm |
| EX-10.44 - EX-10.44 - BARRY R G CORP /OH/ | d230707dex1044.htm |
| EX-10.46 - EX-10.46 - BARRY R G CORP /OH/ | d230707dex1046.htm |
Table of Contents
UNITED STATES SECURITIES AND EXCHANGE COMMISSION
Washington, D.C. 20549
FORM 10-K
(Mark One)
| þ | ANNUAL REPORT PURSUANT TO SECTION 13 OR 15(d) OF THE SECURITIES EXCHANGE ACT OF 1934 |
| For the fiscal year ended July 2, 2011 |
OR
| ¨ | TRANSITION REPORT PURSUANT TO SECTION 13 OR 15(d) OF THE SECURITIES EXCHANGE ACT OF 1934 |
| For the transition period from _____________________ to _____________________ |
Commission File Number 001-08769
R.G. BARRY CORPORATION
(Exact name of Registrant as specified in its charter)
| Ohio | 31-4362899 | |
| (State or other jurisdiction of incorporation or organization) |
(I.R.S. Employer Identification No.) |
| 13405 Yarmouth Road N.W. Pickerington, Ohio 43147 |
(614) 864-6400 | |
| (Address of principal executive offices, including zip code) | (Registrant’s telephone number, including area code) |
Securities registered pursuant to Section 12(b) of the Act:
| Title of Each Class |
Name of Each Exchange on Which Registered | |
| Common Shares, Par Value $1.00 per share | The NASDAQ Stock Market (The NASDAQ Global Market) | |
| Series II Junior Participating Class A Preferred Share Purchase Rights |
The NASDAQ Stock Market | |
Securities registered pursuant to Section 12(g) of the Act: None
Indicate by check mark if the Registrant is a well-known seasoned issuer, as defined in Rule 405 of the Securities Act. Yes ¨ No þ
Indicate by check mark if the Registrant is not required to file reports pursuant to Section 13 or Section 15(d) of the Act. Yes ¨ No þ
Indicate by check mark whether the Registrant (1) has filed all reports required to be filed by Section 13 or 15(d) of the Securities Exchange Act of 1934 during the preceding 12 months (or for such shorter period that the Registrant was required to file such reports), and (2) has been subject to such filing requirements for the past 90 days. Yes þ No ¨
Indicate by check mark whether the registrant has submitted electronically and posted on its corporate Web site, if any, every Interactive Data File required to be submitted and posted pursuant to Rule 405 of Regulation S-T (§232.405 of this chapter) during the preceding 12 months (or for such shorter period that the registrant was required to submit and post such files). Yes ¨ No ¨
Indicate by check mark if disclosure of delinquent filers pursuant to Item 405 of Regulation S-K (§229.405 of this chapter) is not contained herein, and will not be contained, to the best of Registrant’s knowledge, in definitive proxy or information statements incorporated by reference in Part III of this Form 10-K or any amendment to this Form 10-K. ¨
Indicate by check mark whether the registrant is a large accelerated filer, an accelerated filer, a non-accelerated filer, or a smaller reporting company. See the definitions of “large accelerated filer”, “accelerated filer” and “smaller reporting company” in Rule 12b-2 of the Exchange Act.
| Large accelerated filer ¨ | Accelerated filer þ | Non-accelerated filer ¨ | Smaller reporting company ¨ | |||
| (Do not check if a smaller reporting company) | ||||||
Indicate by check mark whether the Registrant is a shell company (as defined in Rule 12b-2 of the Act). Yes ¨ No þ
The aggregate market value of the common shares (the only common equity of the Registrant) held by non-affiliates of the Registrant was $110,759,659 based on the closing price per common share of $11.12 on The NASDAQ Global Market on December 31, 2010 (the last business day of the most recently completed second fiscal quarter).
Indicate the number of shares outstanding of each of the Registrant’s classes of common stock, as of the latest practicable date: 11,056,703 common shares, $1.00 par value, as of September 14, 2011.
DOCUMENT INCORPORATED BY REFERENCE
Portions of the Registrant’s definitive Proxy Statement to be furnished to shareholders of the Registrant in connection with the 2011 Annual Meeting of Shareholders, which definitive Proxy Statement will be filed not later than 120 days after July 2, 2011, are incorporated by reference into Part III of this Annual Report on Form 10-K to the extent provided herein.
Table of Contents
R.G. BARRY CORPORATION
FISCAL 2011
Form 10-K
ANNUAL REPORT
Exhibit 10.36
Exhibit 10.44
Exhibit 10.45
Exhibit 10.46
Exhibit 21.1
Exhibit 23.1
Exhibit 24.1
Exhibit 31.1
Exhibit 31.2
Exhibit 32.1
| * | The information required to be disclosed under each Item is incorporated by reference from the Registrant’s definitive Proxy Statement to be furnished to shareholders of the Registrant in connection with the 2011 Annual Meeting of Shareholders, which definitive Proxy Statement will be filed no later than 120 days after July 2, 2011. |
2
Table of Contents
“Safe Harbor” Statement under the Private Securities Litigation Reform Act of 1995:
Some of the disclosures in this Annual Report on Form 10-K for the fiscal year ended July 2, 2011 (the “2011 Form 10-K”) contain forward-looking statements that involve substantial risks and uncertainties. You can identify these statements by forward-looking words such as “may,” “expect,” “could,” “should,” “anticipate,” “believe,” “estimate,” or words with similar meanings. Any statements that refer to projections of our future performance, anticipated trends in our business and other characterizations of future events or circumstances are forward-looking statements. These statements, which are forward-looking statements as that term is defined in the Private Securities Litigation Reform Act of 1995, are based upon our current plans and strategies and reflect our current assessment of the risks and uncertainties related to our business. These risks include, but are not limited to: our continuing ability to source products from third parties located within and outside North America; competitive cost pressures; the loss of retailer customers to competitors, consolidations, bankruptcies or liquidations; shifts in consumer preferences; the impact of the global financial crisis and general economic conditions on consumer spending; the impact of the highly seasonal nature of our footwear business upon our operations; inaccurate forecasting of consumer demand; difficulties liquidating excess inventory; disruption of our supply chain or distribution networks; our ability to implement new enterprise resource information systems; the unexpected loss of any of the skills and experience of any of our senior officers; our ability to successfully integrate any business acquisitions; and our investment of excess cash in certificates of deposit and other variable rate demand note securities. You should read this 2011 Form 10-K carefully, because the forward-looking statements contained in it (1) discuss our future expectations; (2) contain projections of our future results of operations or of our future financial condition; or (3) state other “forward-looking” information. The risk factors described in this 2011 Form 10-K and in our other filings with the Securities and Exchange Commission (the “SEC”), in particular “Item 1A. Risk Factors” of Part I of this 2011 Form 10-K, give examples of the types of uncertainties that may cause actual performance to differ materially from the expectations we describe in our forward-looking statements. If the events described in this “Safe Harbor” Statement or in “Item 1A. Risk Factors” of Part I of this 2011 Form 10-K occur, they could have a material adverse effect on our business, operating results and financial condition. You should also know that it is impossible to predict or identify all risks and uncertainties related to our business. Consequently, no one should consider any such list to be a complete set of all potential risks and uncertainties. Forward-looking statements speak only as of the date on which they are made, and we undertake no obligation to update any forward-looking statement to reflect circumstances or events that occur after the date on which the statement is made to reflect unanticipated events. Any further disclosures in our filings with the SEC should also be considered.
All references in this 2011 Form 10-K to “we”, “us”, “our”, and the “Company” refer to R.G. Barry Corporation, an Ohio corporation (the registrant) or, where appropriate, to R.G. Barry Corporation and its subsidiaries. The Company’s annual reporting period is either a fifty-two or fifty-three-week period (“fiscal year”) ending annually on the Saturday nearest June 30. For definitional purposes, as used herein, the terms listed below include the respective periods noted:
| Fiscal 2012 | 52 weeks ending June 30, 2012 | |
| Fiscal 2011 | 52 weeks ended July 2, 2011 | |
| Fiscal 2010 | 53 weeks ended July 3, 2010 | |
| Fiscal 2009 | 52 weeks ended June 27, 2009 |
3
Table of Contents
PART I
BUSINESS AND PRODUCTS
Overview
Since introducing the world’s first foam-soled, soft, washable slipper in 1947, R.G. Barry Corporation’s operating model and product focus have evolved to serve the changing marketplace. Today, we develop and market consumer products in the retail accessories category. These products include: footwear, such as slippers and sandals; foot and shoe care products, such as cushioned insoles; and handbags, tote bags and travel products. Our products are primarily sold in North America by a broad cross-section of retailers of varying size and classification.
During fiscal 2011, we acquired the principal assets of two businesses that significantly transformed the profile of our Company from exclusively a marketer of accessories footwear to a marketer of accessories products sold through multiple subcategories of the accessories business. The business of Foot Petals, Inc. (“Foot Petals”), a Long Beach, California-based developer and marketer of premium insoles and comfort solutions for footwear problems, was acquired on January 27 for $14 million cash. The business of baggallini, Inc. (“Baggallini”), a Portland, Oregon-based developer and marketer of handbags, tote bags and travel products, was acquired on March 31 for approximately $33.8 million cash plus an additional $802 thousand paid subsequent to the end of fiscal 2011. This additional payment was based on certain minimum working capital at the time of closing under the terms of the purchase agreement.
Beginning with the quarter ended April 2, 2011, our business was divided into two reportable segments: the Footwear segment, which includes slippers and sandals; and the Accessories segment, which includes foot and shoe care products, handbags, tote bags and travel products (see “Reporting Segments” below). Prior to this change, our business had been reported under a single segment, footwear.
Approximately 85% of our consolidated net sales in fiscal 2011 came from products bearing trademarks we own. The remainder of our net sales came from products sold under licensed brand names or from products we developed and sourced for sale by retailers under their own private or exclusive labels.
We use a flexible sourcing model under which many of the costs and expenses related to product procurement and distribution can expand and contract with our business needs. All of our products are produced by contract manufacturers, primarily located in the Peoples Republic of China (“China”); and a significant portion of our products are warehoused and shipped by third-party logistics providers. We adopted the flexible sourcing model for our footwear business in 2004, and the two businesses acquired during fiscal 2011 utilize similar sourcing approaches.
We are an Ohio corporation with executive offices located in a Company-owned facility at 13405 Yarmouth Road N.W., Pickerington, Ohio 43147. Our telephone number is 614.864.6400, and our corporate Internet website can be accessed at www.rgbarry.com (this uniform resource locator, or URL, is an inactive textual reference only and is not intended to incorporate our website into this 2011 Form 10-K). We have been a public company since 1962. Our common shares primarily are traded on The NASDAQ Global Market (“NASDAQ-GM”) under the trading symbol DFZ, which is meant to evoke the name of our flagship slipper brand, Dearfoams*.
* Denotes Company trademark registered in the United States Department of Commerce Patent and Trademark Office.
4
Table of Contents
Reporting Segments
Our two reporting segments – Footwear and Accessories – are comprised of three individual business units: footwear; foot and shoe care products; and handbags, tote bags and travel products. These business units are organized around specific accessories product categories and trademarked brand names that we own. We think our trademarks have significant commercial value. In general, trademarks remain valid and enforceable as long as they are used in connection with our products and services and the required registration renewals are filed. We intend to continue the use of each of our trademarks and to renew each of our registered trademarks accordingly. See additional information on segment reported results in Note (17) of the Notes to Consolidated Financial Statements included in “Item 8. Financial Statements and Supplementary Data.” In this 2011 Form 10-K.
Each of our business units is managed by a Business Unit President, who reports to the Company’s President and Chief Executive Officer. A team of design, marketing, sales, merchandising and finance professionals supports each business unit. In-house corporate administrative, finance, human resource, information technology and logistics services (“shared services”) are used in varying degrees by all of our business units. We maintain sales offices and showrooms that are shared by our three business units at 9 East 37th Street in New York City, New York.
We established our reporting segments using generally accepted aggregation criteria under which we analyzed each business unit’s products, brand names, distribution channels, customer bases, sourcing and production methods and anticipated performance. Our foot and shoe care products business unit and our handbags, tote bags and travel products business unit share similar qualitative and quantitative characteristics that lend themselves to aggregation and that differentiate them from our footwear business. We believe that utilizing these two reporting segments allows us to fairly represent our business and its financial results.
Footwear
Footwear is a component of the overall accessories category and a subset of the highly competitive footwear industry. According to independent industry research, annual retail sales of accessories footwear totals less than $1 billion. The category includes slippers, sandals, hybrid and active fashion footwear and slipper socks. We believe that we are one of the world’s largest marketers of accessories footwear products and estimate on an annualized basis that approximately 75% of our net sales will be represented in this segment in the foreseeable future.
We have sold more than 1 billion pairs of accessory footwear under a variety of brand names since our founding in 1947. Today, Dearfoams* is our principal footwear brand. Since its introduction in 1958, Dearfoams* has, according to our proprietary consumer research, become one of the most-recognized brand names in accessories footwear. In addition to Dearfoams*, our current primary footwear brand names include Angel Treads*, DF by Dearfoams*, Utopia by Dearfoams* and Terrasoles*. We also market Levi’s** brand slippers and sandals under license from Levi Strauss & Co.
In recent years, many companies that are engaged in marketing apparel and footwear have begun selling accessories footwear. Many of these competitors have significantly greater financial, distribution and marketing resources than we do. We do not, however, believe that they have committed the necessary resources to effectively compete long-term within the category. In addition, some retailers have sought to source their own accessories footwear products directly from overseas manufacturers.
** Denotes a licensor trademark registered in the United States Department of Commerce Patent and Trademark Office.
5
Table of Contents
Most competitors in this segment are either privately-owned sourcing companies producing products under various licensed brand names or retailers sourcing their own private or proprietary label goods. We compete in this segment primarily on the basis of the quality, innovation and comfort of our products; price; value; service to our customers; marketing and merchandising expertise; and reputation within the trade. We believe that we are the only accessories footwear resource capable of providing the high level of comprehensive service, quality and support that we offer retailers, and we expect to continue growing our business in this segment based upon these strengths.
We debut new footwear collections each spring and fall in conjunction with national retail accessory buying markets and other national trade events. We plan to continue the introduction of updated and new products in response to fashion changes, consumer taste preferences and changes in the demographic makeup of our business.
Several basic footwear profiles are standard in all of our footwear brand lines. Many of these classic footwear silhouettes are in demand throughout the year. The most significant changes to these traditional products are made in response to broadly accepted fashion trends and can include slight variations in design, ornamentation, fabric and color.
We have, at various times, licensed well-known brand names in an effort to spur additional growth within our Footwear segment. In March 2009, we entered into a four-year agreement with Levi Strauss & Co. to develop and market a collection of Levi’s** brand slippers and sandals for the United States market. Under this license, we agreed to certain minimum royalty payments. Levi’s brand footwear performed modestly for us during fiscal 2011.
We announced our decision to exit two licensing relationships during fiscal 2011. Our arrangement with Basic Properties America, Inc., to act as exclusive North American licensee for Superga,** a canvas footwear brand, ended in May 2011; and expect to complete our final shipments to retailers of Nautica** slippers in fall 2011 under an arrangement with Nautica Apparel, Inc. to act as their exclusive accessories footwear licensee for the United States, Canada, Mexico and Puerto Rico.
We also licensed certain footwear brand names we own to Olivet International, Inc., in July 2010. The five-year exclusive agreement gives Olivet the sole right to develop and market a variety of sleepwear, active wear and accessories products bearing the Dearfoams*, DF by Dearfoams*, DF Sport by Dearfoams* and Utopia by Dearfoams* trademarks in North and South American markets. Royalty payments under this agreement were modest in fiscal 2011.
Our footwear products are sold through multiple retail channels including mass merchandisers, national chain stores, warehouse clubs, mid-tier department stores, specialty discount stores and internet and catalog retailers. Suggested retail prices for our footwear products range from approximately $7-to-$50 per pair, depending upon the style, retail channel and retailer mark-up. Most buyers and consumers of our footwear are adult females.
We do not finance customers’ purchases beyond granting traditional payment terms at the time shipments to the retailers are made. We do grant limited return privileges and allowances to fund advertising and in-season promotional activities to certain of our footwear customers. Our direct-to-consumer footwear sales are limited to those conducted through our dearfoams.com website.
Our footwear business is comprised of two components, replenishment and seasonal. In the replenishment component, retailers carry a relatively consistent, planned assortment of products on a year-round basis. These products are purchased by consumers on a repeat basis and the in-store assortment is regularly replenished by us to ensure product availability for shoppers. The seasonal component is comprised of a
6
Table of Contents
variety of more fashion-forward and boxed items that generally are found in stores only during the key retail selling periods, such as the period around the Christmas holiday selling season. Approximately 70% of our annual net sales in the footwear business unit traditionally occur from July through December. We have identified the popularity of slippers as a great holiday gift item as the main reason for this heavy seasonal weighting.
During fiscal 2011, we continued a multi-year, multi-million dollar advertising/marketing initiative begun in fiscal 2009 that is focused on increasing our dominance in accessories footwear and expanding the appeal of our Dearfoams* brand to a broader demographic. We also continued our use of seasonal in-store merchandisers during the critical holiday period as a tool for managing the flow of our products to the selling floor. We believe that when combined with modern automatic demand-pull replenishment systems and various other merchandising and sales techniques, the temporary merchandisers we use helps us optimize critical holiday sales.
Due to the highly seasonal nature of our Footwear segment, the backlogs of unfilled footwear orders as of August month-end periods that ended on September 3, 2011, September 4, 2010 and August 29, 2009 were $34.3 million, $30.3 million and $31.5 million, respectively. The backlogs of unfilled sales orders at the end of fiscal 2011, fiscal 2010 and fiscal 2009 were approximately $31.3 million, $33.4 million and $19.3 million, respectively; comparisons between years reflect differences in the timing of order receipts only and do not necessarily indicate a growth or decline in sales volume.
In an effort to more effectively align our sourcing and logistics efforts with our customers’ evolving needs, we shifted our footwear procurement cycle forward by approximately eight weeks beginning with the sourcing of goods for fall/winter 2011. As a result, footwear inventory at fiscal 2011 year-end was higher than historical levels. We believe that the earlier inventory flow pattern established for the fall/winter 2011 selling season will be more representative of our future footwear operating model.
We operate a footwear sourcing office in Dongguan City, China to facilitate the development and procurement of our products. Thirty-one people work out of this office. We purchase our footwear products from approximately 14 different third-party manufacturers, most of whom are located in China. Our overall experience with third-party footwear manufacturers has been very good in terms of reliability, delivery times and product quality. All of our third-party purchases are conducted on an open account basis and in U.S. Dollars.
Our Dongguan City office aligns our U.S. operations and third-party suppliers to generally ensure the quality and timely delivery of our products. During fiscal 2011, we experienced difficulty with initial fall 2010 shipments to some retailers as a result of transitional issues related to the expansion of our China operations. In order to maintain on-time delivery of these shipments and to protect our reputation with retailers, we consciously incurred unplanned delivery costs that negatively impacted our planned level of profitability in fiscal 2011. The issues related to this problem have been resolved.
We are dependent on methods of third-party transport to move our products from our third-party manufacturers to distribution facilities we utilize, and from those facilities to our customers. In our Footwear segment, we warehouse and distribute goods from a third-party logistics facility in Long Beach, California, and a leased distribution center we operate in San Angelo, Texas.
Accessories Products
Our newly-acquired business units — Foot Petals and Baggallini — collectively comprise our Accessories segment. Independent industry research indicates that the product classifications where these business units compete, foot and shoe care as well as handbags, tote bags and, travel products, represent approximately 4% and 30%, respectively, of annual accessories sales at retail. We believe that our entry into these accessories subcategories presents us with significant opportunities for profitable growth, based
7
Table of Contents
upon the business units past operating performances and their sizes in relation to the markets in which they compete.
Foot Petals
Foot Petals was founded in 2001. It currently sells approximately 30 foot and shoe care products priced between $7 and $45, which primarily are targeted toward the foot comfort of women aged 14-to-55. Many Foot Petals products are made from high-performance urethane or similar man-made materials and various fabrics. The products generally are sold at premium, non-promotional prices and yield higher margins than those earned in our Footwear segment.
Foot Petals products are sold under a variety of brand names including Foot Petals*, Fab Feet*, Glamour Toez*, Heavenly Heelz* and Killer Kushionz*. Sales to retailers are handled by a combination of Company-employed and independent sales representatives. Products also are presented to retailers at various national markets and accessories trade shows. We do not finance retailers’ purchases beyond granting traditional payment terms at the time shipments to the retailers are made.
Foot Petals’ products principally are sold to consumers through upper-tier department stores, independent retailers, internet and home shopping venues. We also sell direct-to-consumer via our footpetals.com consumer website. Due in part to its non-seasonal nature, the business has minimal exposure to obsolete inventory and net sales are relatively evenly distributed across the fiscal year. The at-once replenishment nature of the Foot Petals’ business model contributes to making it a fast-turning, low inventory volume business.
Foot Petals brand cushions are considered premium products within their category and carry the Seal of Acceptance of the American Podiatric Medical Association. Among our major competitors are Dr. Scholl’s®, Implus® Footcare and Profoot®.
Since acquiring Foot Petals, we have assisted our business unit’s management team in developing brand extensions for sale through mass merchandisers. We also have provided a variety of professional planning and management tools and replaced previously outsourced business functions with our shared services.
Foot Petals’ products primarily are manufactured by a third-party supplier based in Ohio, and warehoused and distributed through a third-party logistics provider located adjacent to the supplier’s manufacturing plant. We rely on third-party transport to move Foot Petals products to our customers.
In addition to showroom and office space in our New York City location, Foot Petals operates an administrative office and showroom in Long Beach, California and a sales office in Glen Rock, New Jersey.
Baggallini
Baggallini was founded in 1995. Its product line of more than 60 styles of handbags, tote bags and travel products retail between $16 and $90, and primarily are targeted to women aged 34-to-55. Baggallini products are recognized for their lightweight construction and intelligent, solution-oriented organization. They are primarily made from durable nylons and other man-made materials and are sold at premium, non-promotional prices. The Baggallini business unit generates higher margins than those earned in our Footwear segment.
Baggallini’s principal trademarks include baggallini* and Le Bagg*. Sales are handled by a combination of Company-employed and independent sales representatives. Products also are presented to retailers at various gift and trade shows, conducted throughout the country at various times of the year. We do not finance retailers’ purchases beyond granting traditional payment terms at the time shipments to the retailers are made.
8
Table of Contents
Baggallini’s products primarily are sold to consumers through a network of several thousand independent retail locations, non-promotional chain stores and on-line retailers. We currently do no direct-to-consumer sales. Branded competitors include Kipling® and LeSportsac®. The business is relatively non-seasonal and evenly distributed across the fiscal year.
Since our acquisition of Baggallini, we have assisted the business unit’s management team, primarily in developing marketing and branding strategies and have supported them with our shared services.
All Baggallini products are developed and sourced through a network of four contract manufacturers in China. This business unit utilizes a sourcing agent who is not affiliated with our China-based footwear sourcing operations. As in our Footwear segment, all of Baggallini’s third-party purchases are conducted on an open account basis and in U.S. Dollars. We are dependent on methods of third-party transport to move Baggallini products from contract manufacturers to our leased company-operated distribution facility in Oregon, and from our Oregon distribution center to retailers.
Although some of the business unit’s products contain elements of fashion, they focus more on function, thus lessening our exposure to obsolete inventory resulting from changing fashion trends. The business unit traditionally has operated with an inventory level that ensures quick customer order fulfillment and replenishment.
In addition to office and showroom space in our New York City location, Baggallini operates a leased administrative office and showroom in Milwaukie, Oregon.
Ethics, Human Rights & the Environment
It is a fundamental goal of the Company to incorporate our core values of integrity, quality, innovation, leadership, teamwork and community into all aspects of our business. We demand the highest business and personal ethical standards, as well as compliance with all applicable governmental laws, rules and regulations from all of our team members and from all with whom we do business. We only do business with suppliers and vendors who operate legally and ethically.
We are committed to protecting human rights and we require our suppliers to fairly compensate their employees by: providing wages and benefits that meet or exceed applicable local and national laws; scheduling reasonable work hours; and providing reasonable days off, vacation and leave privileges. Many of our key customers conduct their own independent human rights audits of our third-party suppliers and share their findings with us. We also conduct direct supplier audits under licensed product agreements held by the Company.
The Company is C-TPAT (Customs-Trade Partnership Against Terrorism) certified, which means we comply with the U.S. Government’s standards to ensure that our shipments out of other countries are safe from tampering during the exporting process. A part of this certification process includes periodic inspections of our foreign manufacturers’ factories to ensure safe, fair working conditions for employees.
We are concerned about preserving and protecting our environment. We strive to comply with all federal, state and local environmental protection laws at all Company locations. Compliance with provisions regulating the discharge of materials into the environment, or otherwise relating to the protection of the environment, has not had a material effect on our capital expenditures, earnings or competitive position. We believe that the nature of our operations has little, if any, environmental impact, and we anticipate no material capital expenditures for environmental control facilities for the foreseeable future.
We encourage our team members to conserve energy and other resources, to reduce the amount of waste the Company produces, and to participate actively in recycling efforts. We also expect all of our suppliers to comply with appropriate environmental laws.
9
Table of Contents
MATERIAL RESEARCH AND DESIGN DEVELOPMENT
During fiscal 2011, all of our design and product development activities were conducted in the United States of America and China and, for the most part, related to fabric selection and product testing in our Footwear segment.
The principal raw materials used in our footwear, foot care and handbag, tote bag and travel products are textile fabrics, threads, foams, nylons, other synthetic products, recycled micro fleece, mesh and high performance urethane. Our raw materials also include organic materials such as cotton and bamboo fibers as well as packaging materials and are available from a wide range of suppliers. The Company has not experienced any significant difficulty in obtaining raw materials from our respective suppliers in China.
During fiscal 2011, fiscal 2010 and fiscal 2009, we spent approximately $1.9 million, $2.3 million and $2.4 million, respectively, to support the design and development of new products and make improvements in existing products. These design and development activities were primarily supported by 14 full-time employees.
SIGNIFICANT CUSTOMERS
As our business base has grown in recent years, the percentage of net sales from our largest customers has declined relative to our consolidated net sales. Walmart Stores, Inc. and its affiliates accounted for 32%, 35% and 38% of our consolidated net sales during fiscal 2011, fiscal 2010 and fiscal 2009, respectively. Our sales to Walmart Stores, Inc. and its affiliates are primarily in our Footwear segment and are less seasonal in nature than sales to many of our other footwear customers. J.C. Penney Company, Inc. accounted for 10% of our consolidated net sales during both fiscal 2010 and fiscal 2009.
FACILITIES
Our principal administrative, sales and distribution facilities are described above and more fully below under “Item 2. Properties.” of this 2011 Form 10-K.
EMPLOYEES
At the close of fiscal 2011, we employed 163 full-time team members. Approximately 80% of our team members are employed in the United States.
AVAILABLE INFORMATION
We make available free of charge through our Internet website all annual reports on Form 10-K, all quarterly reports on Form 10-Q, all current reports on Form 8-K, and all amendments to those reports, filed or furnished by the Company pursuant to Section 13(a) or 15(d) of the Securities Exchange Act of 1934, as amended (the “Exchange Act”), as well as our definitive annual meeting proxy materials as filed pursuant to Section 14 of the Exchange Act. These reports and proxy materials are available as soon as reasonably practicable after they are submitted electronically to the Securities and Exchange Commission (the “SEC”).
There are certain risks and uncertainties in our business that could cause our actual results to differ materially from those anticipated. The following risk factors should be read carefully in connection with evaluating our business and in connection with the forward-looking statements contained in this 2011 Form 10-K. Any of these risks could materially adversely affect our business, our operating results, or our financial condition and the actual outcome of matters as to which forward-looking statements are made.
10
Table of Contents
The global financial and general economic conditions that are largely out of our control may adversely affect our financial condition and results of operations.
Uncertainty about current and future global economic conditions may affect consumer spending or our customers’ buying habits, which would adversely affect demand for our products. Our customers may be impacted by the significant decrease in available credit. If credit pressures or other financial difficulties result in insolvency for these customers, it could adversely impact our overall financial results.
Furthermore, reduced traffic in retail stores or limitations on the prices we can charge for our products could reduce our sales and profit margins and have a material adverse effect on our financial condition and results of operations. Our business, financial condition, results of operations and access to credit as well as the trading price of our common shares could be materially and adversely affected if the economy fails to stabilize, or if current economic conditions do not improve or worsen.
Our North America business, which is our primary business, is dependent on our ability to continue sourcing products from third-party manufacturers primarily from outside North America, and to a lesser extent, sourcing products for foot and shoe care products from third-party manufacturers in North America.
We do not own or operate any manufacturing facilities and depend upon independent third parties to manufacture all of our products. During fiscal 2011, most of our products were manufactured in China. The inability of our third-party manufacturers to ship orders of our products in a timely manner or to meet our quality standards could cause us to miss customer delivery date requirements and could result in cancellation of orders, refusals to accept deliveries, or harm our ongoing business relationships. Furthermore, because quality is a leading factor when customers and retailers accept or reject goods, any decline in the quality of the products produced by our third-party manufacturers could be detrimental not only to a particular order but to future relationships with our customers.
We compete with other companies for the production capacity of our third-party manufacturers. Some of these competitors have greater financial and other resources than we have and may have an advantage in securing production from these manufacturers. If we experience a significant increase in demand for our products or if one of our existing third-party manufacturers must be replaced, we may have to find additional third-party manufacturing capacity. There can be no assurance that this additional capacity will be available when required or will be available on terms that are similar to the terms that we have with our existing third-party manufacturers or that are otherwise acceptable to us. If it is necessary for us to replace one or more of our third-party manufacturers, particularly one that we rely on for a substantial portion of our products, we may experience an adverse financial or operational impact, such as increased costs for replacement manufacturing capacity or delays in distribution and delivery of our products to our customers, which could cause us to lose customers or revenues because of late shipments or customers being unwilling to absorb increased costs.
Our international manufacturing operations are subject to the risks of doing business abroad.
We currently purchase most of our products for all brands from China. We expect to continue to purchase our products from China at approximately the same levels in the future. This international sourcing subjects us to the risks of doing business abroad. These risks include:
| • | the impact on product development, sourcing or manufacturing from public health and contamination risks in China or other countries where we obtain or market our products; |
| • | acts of war and terrorism; |
| • | the impact of disease pandemics; |
| • | social and political disturbances and instability and similar events; |
11
Table of Contents
| • | strikes or other labor disputes; |
| • | export duties, import controls, tariffs, quotas and other trade barriers; |
| • | shipping and transport problems; |
| • | increased expenses, particularly those impacted by any increase in oil prices; |
| • | fluctuations in currency values; and |
| • | general economic conditions in overseas markets. |
Because we rely primarily on Chinese third-party manufacturers for a substantial portion of our product needs, any disruption in our relationships with these manufacturers could adversely affect our operations. While we believe these relationships are strong, if trade relations between the United States and China deteriorates or are threatened by instability, our business could be adversely affected. Although we believe that we could find alternative manufacturing sources, there can be no assurance that these sources would be available on terms that are favorable to us or comparable to those with our current manufacturers. Furthermore, a material change in the valuation of the Chinese currency could adversely impact our product costs, resulting in a significant negative impact on our results of operations.
Our concentration of customers could have a material adverse effect on us, and our success is dependent on the success of our customers.
As a result of the continuing consolidation in the retail industry, our customer base has decreased, thus increasing the concentration of our customers. Our largest customer, Wal-Mart Stores, Inc. and its affiliates, accounted for approximately 32%, 35%, and 38% of our consolidated net sales in fiscal 2011, fiscal 2010 and fiscal 2009, respectively. If this customer reduced or discontinued its product purchases from us, it would adversely affect our results of operations. Additionally, in recent years, several major department stores have experienced consolidation and ownership changes. In the future, retailers may undergo additional changes that could decrease the number of stores that carry our products, which could adversely affect our results.
Our success is also impacted by the financial results and success of our customers. If any of our major customers, or a substantial portion of our customers, generally, experiences a significant downturn in business, fails to remain committed to our products or brands or realigns affiliations with suppliers or decides to purchase products directly from the manufacturer, then these customers may reduce or discontinue purchases from us, which could have a material adverse effect on our business, results of operations and financial condition. We are also subject to the buying plans of our customers, and if our customers do not inform us of changes in their buying plans until it is too late for us to make necessary adjustments to our product supply, we may be adversely affected. We do not have long-term contracts with our customers and sales normally occur on an order-by-order basis. As a result, customers can generally terminate their relationship with us at any time.
Our business faces cost pressures, which could affect our business results.
While we rely on third-party manufacturers as the source of our products, the cost of these products depends, in part, on these manufacturers’ raw materials, labor and energy costs. Thus, our own costs are subject to fluctuations, particularly due to changes in the cost of raw materials and cost of labor in the locations where our products are manufactured, foreign exchange and interest rates.
The footwear and accessory product categories are highly competitive.
The product categories in which we do most of our business are highly competitive businesses. If we fail to compete effectively, we may lose market position. We operate in a relatively small segment of the overall footwear and accessory industries. We believe that we are among the world’s largest marketers of
12
Table of Contents
slipper footwear products. However, this category is a very small component of the overall footwear industry. In recent years, companies that are engaged in other areas of the footwear industry and apparel companies have begun to market slipper footwear and many of these competitors have substantially greater financial, distribution and marketing resources than we do. In addition, many of the retail customers for our products have sought to import competitive products directly from manufacturers in China and elsewhere for sale in their stores on a private label basis. The primary methods we use to compete in our industry include product design, product performance, quality, brand image, price, marketing and promotion and our ability to meet delivery commitments to retailers. A major marketing or promotional success or a technical innovation by one of our competitors could adversely impact our competitive position.
Our business is subject to consumer preferences, and unanticipated shifts in tastes or styles could adversely affect our sales and results of operations.
Our product categories can be subject to rapid changes in consumer preferences. Our performance may be hurt by our competitors’ product development, sourcing, pricing and innovation as well as general changes in consumer tastes and preferences. These categories are also subject to sudden shifts in consumer spending, and a reduction in such spending could adversely affect our results of operations. Consumer spending may be influenced by the amount of consumer disposable income, which may fluctuate based on a number of factors, including general economic conditions, consumer confidence and business conditions. Further, consumer acceptance of new products may fall below expectations and may result in excess inventories or the delay of the launch of new product lines.
If we inaccurately forecast consumer demand, we may experience difficulties in handling consumer orders or liquidating excess inventories and results of operations may be adversely affected.
The slipper footwear business is highly seasonal and has relatively long lead times for the design and manufacture of products. Consequently, we must commit to production in advance of orders based on our forecast of consumer demands. If we fail to forecast consumer demand accurately, we may under- or over-source a product and encounter difficulty in handling customer orders or liquidating excess inventory, and we may have to sell excess inventory at a reduced cost. Further, due to the fashion-oriented nature of our products, rapid changes in consumer preferences lead to an increased risk of inventory obsolescence. While we believe we have successfully managed this risk in recent years and believe we can successfully manage it in the future, our operating results will be adversely affect if we are unable to do so.
We rely on distribution centers to store and distribute our products and if there is a natural disaster or other serious disruption affecting any of these facilities or our methods of transport, we may be unable to effectively deliver products to our customers.
We rely on our leased distribution centers as well as third-party logistics providers to store and distribute product to our customers. Significant disruptions affecting the flow of products to and from these facilities due to natural disasters, labor disputes such as dock strikes, or any other cause could delay receipt and shipment of a portion of our inventory. This could impair our ability to timely deliver our products to our customers and negatively impact our operating results. Although we have insured our finished goods inventory for the amount equal to its carrying cost plus normal profit expected in the sale of that inventory against losses due to fire, earthquake, tornado, flood and terrorist attacks, our insurance program does not protect us against losses due to delays in our receipt and distribution of products due to transport difficulties, cancelled orders or damaged customer relationships that could result from a major disruption affecting the flow of products to and from our distribution facilities.
Further, we are dependent on methods of third-party transport to move our products to and from these facilities. Circumstances may arise where we are unable to find available or reasonably priced shipping to the United States from our manufacturers in China and elsewhere or road and rail transport to our
13
Table of Contents
customers. If our methods of transport are disrupted or if costs increase sharply or suddenly, due to price increases of oil in the world markets or other inflationary pressures, we may not be able to affordably or timely deliver our products to our customers.
The seasonal nature of our footwear business makes management more difficult, and severely reduces cash flow and liquidity during certain parts of the year.
A significant portion of our footwear business is highly seasonal and much of the results of our operations are dependent on strong performance during the last six months of the calendar year, particularly the holiday selling season. The majority of our marketing and sales activities take place at industry market week and trade shows in the spring and fall. Our inventory is largest in the early fall to support our customers’ requirements for the fall and holiday selling seasons. Historically, our cash position is strongest in the first six months of the calendar year. Unfavorable economic conditions affecting retailers during the fall and through the holiday season in any year could have a material adverse effect on the results of our operations for the year. Although our acquisitions during fiscal 2011 have added businesses with year-round replenishment shipments, we can offer no assurance that the overall significant seasonal nature of our business will change in the future.
Our unsecured credit agreement includes financial and other covenants that impose restrictions on our financial and business operations.
Our unsecured credit agreement signed March 1, 2011 contains financial covenants that require us to maintain minimum levels regarding our financial condition and operating performance. If we fail to comply with the covenants and are unable to obtain a waiver or amendment, an event of default would result, and the lender could declare outstanding borrowings immediately due and payable. If that should occur, we cannot guarantee that we would have sufficient liquidity at that time to repay or refinance borrowings under the unsecured credit agreement.
Modifications and/or upgrades to our information technology systems may disrupt our operations.
We regularly evaluate our information technology systems and requirements and are currently implementing modifications and/or upgrades to the information technology systems that support our business. Modifications include replacing legacy systems with successor systems, making changes to legacy systems, or acquiring new systems with new functionality. We are aware of the inherent risks associated with replacing and modifying these systems, including inaccurate system information, system disruptions and user acceptance and understanding. We believe we are taking appropriate action to mitigate the risks through disciplined adherence to methodology, program management, testing and user involvement, as well as securing appropriate commercial contracts with third-party vendors supplying the replacement technologies. Information technology system disruptions and inaccurate system information, if not anticipated and appropriately mitigated, could have a material adverse effect on our financial condition and results of operations. Additionally, there is no assurance that a successfully implemented system will deliver the anticipated value to us.
We rely on the experience and skills of our senior executive officers, the loss of whom could have a material adverse effect on our business.
Our senior executive officers closely supervise all aspects of our business. Our senior executive officers have substantial experience and expertise in our business and have made significant contributions to the growth and success of our brands. If we were to lose the benefit of their involvement without adequate succession plans, our business could be adversely affected. Competition for such senior executive officers is intense, and we cannot be sure we will be able to attract, retain and develop a sufficient number of qualified senior executive officers in future periods.
14
Table of Contents
For any business acquisitions we undertake, we depend on our ability to successfully integrate and operate those newly acquired businesses.
We may be unable to consummate, manage or integrate our acquisitions. A portion of our growth has occurred through acquisitions. We may from time to time seek opportunities to acquire attractive businesses. There are no assurances, however, that any acquisition opportunities will arise or, if they do, that they will be consummated, or that any needed additional financing for such opportunities will be available on satisfactory terms when required. In addition, acquisitions involve risks that the businesses acquired will not perform in accordance with expectations, and that business judgment concerning the value, strengths and weaknesses of businesses acquired will prove incorrect. The acquired businesses may be integrated successfully and the acquisition may strain our management resources or divert management’s attention from other business concerns. Failure to successfully integrate any of our acquisitions may cause significant operating inefficiencies and could adversely affect our operations and financial condition.
We periodically invest funds in marketable securities, and the ultimate repayment of amounts invested depends on the financial capacity of the related financial institutions and corporations involved.
At July 2, 2011, as part of our cash management and investment program, we maintained a portfolio of $15.6 million in short-term investments, including $12.1 million in marketable investment securities consisting of variable rate demand notes and $3.5 million in other short-term investments. The marketable investment securities are classified as available-for-sale. These marketable investment securities are carried at cost, which approximates fair value. The other short-term investments are classified as held-to-maturity securities and include several commercial paper investments, which mature in August 2011.
Item 1B. Unresolved Staff Comments.
No response required.
The Company owns its corporate headquarters and executive offices located at 13405 Yarmouth Road N.W. in Pickerington, Ohio, a facility that contains approximately 55,000 square feet. The Company leases space aggregating approximately 263,488 square feet at an approximate total annual rent of $944,700. The following table describes the Company’s principal leased properties during fiscal 2011 and the operating status of those properties at July 2, 2011:
| Location | Use | Approximate Square Feet |
Approximate Annual Rental |
Lease Expires |
Renewals | |||||
| 9 East 37th Street, 11th Floor New York City, N.Y. |
Sales Office/ Showroom |
5,000 | $ 200,000 | 2015 | None | |||||
| 3301 Barry Avenue San Angelo, Texas |
Shipping, Distribution Center |
172,800 | $ 302,500 | 2012 | Month to month | |||||
| Brain Building, 1st Floor, Nanwu Chisheng Industry Zone, Houjie Town, Dongguan City, Guangdong Province , China |
Sourcing Representative Office |
9,700 | $ 16,700 | 2014 | None | |||||
| 903 S.E. 28th Street Suite 7 Bentonville, Arkansas |
Sales Administration Office |
1,300 | $ 19,500 | Month to month |
Month to month | |||||
15
Table of Contents
| Location | Use | Approximate Square Feet |
Approximate Annual Rental |
Lease Expires |
Renewals | |||||
| 194 Rock Road Glen Rock, New Jersey |
Sales office | 1,500 | $ 25,500 | 2013 | None | |||||
| 6615 Pacific Coast Highway Long Beach, California |
Sales/Marketing office |
3,188 | $ 94,600 | 2012 | None | |||||
| 1887 SE Milport, Milwaukie, Oregon |
Office, Shipping, Distribution Center |
70,000 | $ 285,900 | 2014 | 1 year | |||||
The Company believes that all of our owned or leased buildings are well maintained, in good operating condition and suitable for their present uses.
The Company is from time to time involved in claims and litigation considered normal in the ordinary course of our business. There are no significant legal proceedings pending for the Company. While it is not feasible to predict the ultimate outcome, in the opinion of management, the resolution of pending legal proceedings is not expected to have a material effect on the Company’s financial position, results of operations or cash flows.
Supplemental Item. Executive Officers of the Registrant.
The following table lists the names and ages of the executive officers of the Company as of September 14, 2011, the positions with the Company presently held by each executive officer and the business experience of each executive officer during the past five years. Unless otherwise indicated, each individual has had his or her principal occupation for more than five years. The executive officers serve at the discretion of the Board of Directors subject, when applicable, to their respective contractual rights with the Company and, in the case of Mr. Tunney, Ms. Aldatz and Mr. Eckols, pursuant to an employment agreement. There are no family relationships among any of the Company’s executive officers or directors.
16
Table of Contents
| Name | Age | Position(s) Held with the Company and Principal Occupation (s) for Past Five Years | ||
| Greg A. Tunney |
50 | Chief Executive Officer of the Company since May 2006; President of the Company since February 2006; Director of the Company since August 2006; Chief Operating Officer of the Company from February 2006 to May 2006; President and Chief Operating Officer of Phoenix Footwear Group, Inc., a supplier of a diversified selection of men’s and women’s dress and casual footwear, belts, personal items, outdoor sportswear and travel apparel, from 1998 to February 2005. | ||
| Jose G. Ibarra |
52 | Senior Vice President – Finance and Chief Financial Officer of the Company since January 2009; Secretary of the Company from January 2009 to October 2009; Senior Vice President – Treasurer of the Company from July 2008 to January 2009; Vice President – Treasurer of the Company from December 2004 to June 2008. | ||
| Glenn D. Evans |
50 | Senior Vice President – Global Operations of the Company since November 2006; Senior Vice President – Creative Services and Sourcing of the Company from November 2003 to November 2006. | ||
| Yvonne E. Kalucis |
46 | Senior Vice President – Human Resources of the Company since February 2008; Vice President – Human Resources of the Company from September 2007 to February 2008; Director of Human Resources for Limited Brands, Inc., a specialty retailer of women’s intimate and other apparel, beauty and personal care products and accessories under various trade names, from September 2005 to September 2007. | ||
| Lee F. Smith |
49 | Senior Vice President – Creative Services of the Company since January 2009; Senior Vice President – Design and Product Development of the Company from December 2006 to January 2009; President of Pacific Footwear Services, a footwear business development company engaged primarily in the research, design, development and commercialization of footwear products for a variety of customers, from 2004 to 2006. | ||
| Nancy N. Coons |
51 | Business Unit President – Footwear since June 2011; President, Dearfoams*, from July 2010 to June 2011; Principal of Coons Consulting Co., brand strategy, product development and merchandising consultant services, from April 2008 to June 2010; General Manager, Apparel of New Balance Athletic Shoe, Inc., a privately-held performance athletic and lifestyle brand, from February 2005 to October 2007. | ||
| Tina G. Aldatz |
42 | Business Unit President – Foot Petals, Inc. since June 2011; President, Foot Petals, Inc. from January to June 2011; Founder and President of Foot Petal, Inc., a developer and marketer of solution-oriented foot care and comfort products, January 2001 to January 2011. | ||
| Dennis D. Eckols |
62 | Business Unit President – Baggallini, Inc. since June 2011; President, Baggallini, Inc., from April to June 2011; Chief Operating Officer, baggallini, Inc., January 2003 to April 2011. | ||
17
Table of Contents
PART II
Item 5. Market for Registrant’s Common Equity, Related Stockholder Matters and Issuer Purchases of Equity Securities.
Market and Dividend Information
Sales Price Per Common Share
| Quarter | High | Low | Close | Dividends Declared per Common Share | ||||||||||||
| Fiscal 2011 |
First | $ | 11.99 | $ | 9.53 | $ | 10.38 | $ 0.07 | ||||||||
| Second | 11.80 | 9.91 | 11.12 | 0.07 | ||||||||||||
| Third | 13.35 | 9.48 | 13.09 | 0.07 | ||||||||||||
| Fourth | 13.30 | 10.36 | 11.44 | 0.07 | ||||||||||||
| Fiscal 2010 |
First | $ | 9.00 | $ | 6.48 | $ | 7.95 | $ — | ||||||||
| Second | 9.20 | 7.68 | 8.60 | 0.05 | ||||||||||||
| Third | 10.50 | 8.27 | 10.44 | 0.05 | ||||||||||||
| Fourth | 12.00 | 8.10 | 11.30 | 0.05 | ||||||||||||
Since March 1, 2008, common shares of the Company have traded on NASDAQ-GM under the “DFZ” symbol. The high, low and close sales prices shown above reflect the prices as reported in NASDAQ-GM.
Approximate Number of Registered Shareholders: 1,900 as of September 14, 2011.
The declaration and payment of future dividends with respect to the Company’s common shares will depend on net earnings, financial condition, shareholders’ equity levels, cash flow and business requirements of the Company, as determined by the Board of Directors.
The unsecured Credit Agreement (the “New Facility”) between the Company and The Huntington National Bank (“Huntington”), as entered into on March 1, 2011, places no direct restrictions on the Company’s ability to pay cash dividends. See the discussion of the New Facility in Note (6) of the Notes to Consolidated Financial Statements included in “Item 8. Financial Statements and Supplementary Data.” and in “Item 7. Management’s Discussion and Analysis of Financial Condition and Results of Operations.” in this 2011 Form 10-K.
Information Regarding Recent Sales of Unregistered Securities
No disclosure is required under Item 701 of SEC Regulation S-K.
Purchases of Equity Securities by Registrant
Neither the Company nor any “affiliated purchaser,” as defined in Rule 10b-18(a) (3) under the Securities Exchange Act of 1934, as amended, purchased any common shares of the Company during the fiscal quarter ended July 2, 2011. The Company does not currently have in effect a publicly announced repurchase plan or program. However, the Company is authorized under the terms of its stock-based compensation plans to withhold common shares which would otherwise be issued in order to satisfy related individual tax liabilities upon issuance of common shares in accordance with the terms of restricted stock unit (“RSU”) agreements.
18
Table of Contents
Stock Performance Graph and Cumulative Total Shareholder Return
The graph below shows the cumulative total shareholder return assuming the investment of $100 on July 1, 2006 (and the reinvestment of dividends thereafter) on each of R.G. Barry Corporation common shares, the NASDAQ Composite, the Russell 2000, the Dow Jones U.S. Footwear and the Dow Jones U.S. Clothing & Accessories. With the acquisition of accessory product businesses during fiscal 2011, the Dow Jones U.S. Clothing &Accessories index has been added to reflect this new segment for the Company. The comparisons in the graph below are based upon historical data and are not indicative of, or intended to forecast, future performance of R.G. Barry Corporation common shares.
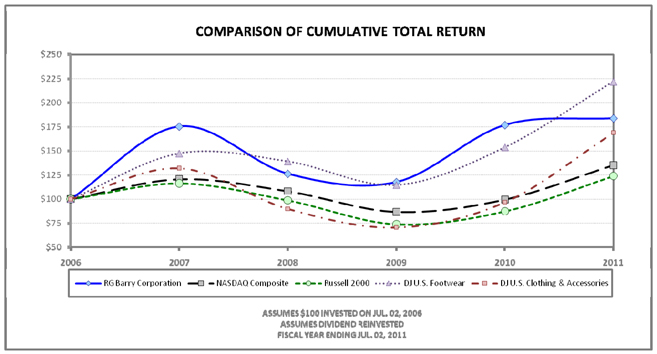
| Company/Market/Peer Group | 7/1/2006 | 6/30/2007 | 6/28/2008 | 6/27/2009 | 7/3/2010 | 7/2/2011 | ||||||||||||||||||
| R.G. Barry Corporation | $100.00 | $175.56 | $126.37 | $117.74 | $177.08 | $184.10 | ||||||||||||||||||
| NASDAQ Composite | $100.00 | $120.72 | $108.16 | $86.74 | $99.60 | $135.34 | ||||||||||||||||||
| Russell 2000 | $100.00 | $116.43 | $98.78 | $73.88 | $87.37 | $124.01 | ||||||||||||||||||
| DJ U.S. Footwear | $100.00 | $147.48 | $139.20 | $114.63 | $153.87 | $222.22 | ||||||||||||||||||
| DJ U.S. Clothing & Accessories | $100.00 | $132.17 | $89.89 | $70.53 | $96.76 | $169.02 | ||||||||||||||||||
19
Table of Contents
Item 6. Selected Financial Data.
Selected Financial Data (1), (2), (3), (4)
(Dollars in thousands, except per common share amounts)
| 2011 | 2010 | 2009 | 2008 | 2007 | ||||||||||||||||
| Net sales |
$ | 129,568 | $ | 123,787 | $ | 113,817 | $ | 109,499 | $ | 105,332 | ||||||||||
| Gross profit |
48,163 | 51,359 | 43,467 | 44,979 | 41,771 | |||||||||||||||
| Gross profit as percent of net sales |
37.2% | 41.5% | 38.2% | 41.1% | 39.7% | |||||||||||||||
| Selling, general and administrative expenses |
36,483 | 36,623 | 32,971 | 32,126 | 30,367 | |||||||||||||||
| Operating profit |
11,680 | 14,736 | 10,496 | 14,215 | 12,103 | |||||||||||||||
| Earnings from continuing operations |
7,510 | 9,400 | 6,992 | 9,785 | 25,735 | |||||||||||||||
| Loss from discontinued operations, net of income taxes (including $1,240 impairment loss in fiscal 2007) |
— | — | — | — | (590 | ) | ||||||||||||||
| Net earnings |
7,510 | 9,400 | 6,992 | 9,785 | 25,145 | |||||||||||||||
| Basic earnings per common share – continuing operations |
0.68 | 0.86 | 0.66 | 0.93 | 2.55 | |||||||||||||||
| Diluted earnings per common share – continuing operations |
0.67 | 0.85 | 0.65 | 0.92 | 2.46 | |||||||||||||||
| Basic loss per common share – discontinued operations |
— | — | — | — | (0.06 | ) | ||||||||||||||
| Diluted loss per common share – discontinued operations |
— | — | — | — | (0.06 | ) | ||||||||||||||
| Basic earnings per common share |
0.68 | 0.86 | 0.66 | 0.93 | 2.49 | |||||||||||||||
| Diluted earnings per common share |
0.67 | 0.85 | 0.65 | 0.92 | 2.40 | |||||||||||||||
| Dividends declared per common share |
0.28 | 0.15 | 0.25 | — | — | |||||||||||||||
| Long-term debt, excluding current installments |
24,286 | — | 97 | 187 | 272 | |||||||||||||||
| Total assets |
115,979 | 83,369 | 75,083 | 67,643 | 63,528 | |||||||||||||||
| Other Data |
||||||||||||||||||||
| Capital expenditures |
$ | 676 | $ | 1,181 | $ | 1,365 | $ | 1,569 | $ | 633 | ||||||||||
| Depreciation and amortization expense |
1,891 | 867 | 775 | 641 | 560 | |||||||||||||||
| (1) | See “Item 7. Management’s Discussion and Analysis of Financial Condition and Results of Operations.” for information regarding the factors that have affected the financial results of the Company. The Company’s annual reporting period is either a fifty-two or fifty-three-week period (“fiscal year”). Fiscal 2010 was a fifty-three week period. For all periods, the selected financial data set forth above is derived from the Company’s audited consolidated financial statements. |
| (2) | The selected financial data set forth above reflect the impact of the decision made in fiscal 2007 by the Board of Directors of R.G. Barry Corporation to sell the Company’s 100% ownership in Escapade, S.A. and its Fargeot et Compagnie, S.A subsidiary (collectively, “Fargeot”). As a result of this action, and consistent with established accounting standards, the results of operations for Fargeot have been reported as discontinued operations for the periods reported. Furthermore, the assets and liabilities related to these discontinued operations were reclassified to current assets held for disposal and current liabilities associated with assets held for disposal at June 30, 2007. The sale of Fargeot was completed in July 2007. |
| (3) | In fiscal 2007, the Company reversed tax valuation reserves of $17,792 due to the determination that deferred tax assets held by the Company were more likely than not to be realized. |
| (4) | Results for fiscal 2011 include those of businesses acquired during fiscal 2011 (Foot Petals at January 27, 2011 and Baggallini at March 31, 2011) starting from the date of the respective acquisitions. |
20
Table of Contents
Item 7. Management’s Discussion and Analysis of Financial Condition and Results of Operations.
Introduction
Our Management’s Discussion and Analysis of Financial Condition and Results of Operations (“MD&A”) is intended to provide investors and others with information we believe is necessary to understand the Company’s financial condition, changes in financial condition, results of operations and cash flows. This MD&A should be read in conjunction with our Consolidated Financial Statements and related Notes to Consolidated Financial Statements and other information included in “Item 8. Financial Statements and Supplementary Data.” in this 2011 Form 10-K. All dollar amounts, except as stated on a per common share basis, are rounded and represent approximate amounts when cited in the text within this section.
Unless the context otherwise requires, references in this MD&A to “our”, “us”, “we” or the “Company” refer to R.G. Barry Corporation and its consolidated subsidiaries.
Our Company and its subsidiaries, Foot Petals Inc. and Baggallini, Inc., are engaged in designing, sourcing, marketing and distributing footwear, foot and shoe care products and hand bag, tote bag and other travel accessories. We operate with three operating segments, two of which are aggregated into a single reportable segment. The two reportable segments include: footwear that encompasses primarily slippers, sandals, hybrid and fashion footwear, slipper socks and hosiery; and accessories products including foot and shoe care products, handbags, tote bags and other travel accessories. Our products are sold predominantly in North America through the accessory sections of department stores, chain stores, warehouse clubs, specialty stores, independent stores, television shopping networks, e-tailing/internet based retailers, discount stores and mass merchandising channels of distribution. Unless the context otherwise requires, references in this MD&A to the “Company” refer to R.G. Barry Corporation and its consolidated subsidiaries when applicable.
All comments made herein relative to period over period comparisons refer to results reported for fiscal 2011 as compared to fiscal 2010.
Summary of Results for Fiscal 2011
During fiscal 2011, we remained focused on achieving our principal goals:
| q | grow our business profitably by pursuing key initiatives based on innovation within our product lines and acquisition opportunities outside of our core footwear business; |
| q | continue efforts to strengthen the relationships with our retailing partners and open distribution of our products in new retail channels; and |
| q | further enhance the image of our brands through both customer and consumer advertising. |
During fiscal 2011, we accomplished the following:
| q | We completed two separate acquisitions for an aggregate purchase price of $49 million, involving the principal business assets of accessory products companies engaged in the shoe and foot care market and in the handbag, tote and other travel accessory market. These acquisitions were completed during the third quarter of fiscal 2011 and contributed to both our revenue and profit in fiscal 2011. |
| q | As part of our acquisition initiative, we entered into a five-year term loan debt financing, which provided $30 million in funds, and a new revolving credit facility. During fiscal 2011, we did not access our revolving credit facility. Both the term loan and the revolving credit facility are described under the caption “Liquidity and Capital Resources” below. |
| q | We took actions to exit certain licensed brand and other initiatives in our footwear business in order to eliminate areas where sales growth and profit performance did not meet our financial expectations. |
| q | We reported consolidated pre-tax earnings of $11.8 million, or 9.1% of net sales. |
| q | We reported cash and cash equivalents on hand of $9.1 million and short-term investments of $15.6 million at the end of fiscal 2011. |
21
Table of Contents
Looking Ahead to Fiscal 2012 and Beyond
Looking ahead to fiscal 2012 and beyond, our strategy continues to center on growing channels within our footwear business; growing our newly-acquired accessory products businesses within their traditional as well as new channels, achieving levels of profitability that are at or above a top quartile performance within our peer group, and delivering financial performance that drives growth and long-term shareholder value.
See the discussion under the caption “Item 1A. Risk Factors” in this 2011 Form 10-K.
Summary of Consolidated Results of Operations – Fiscal 2011 Compared to Fiscal 2010
Fiscal 2010 had fifty-three weeks compared to fifty-two weeks for fiscal 2011; however, the additional week in fiscal 2010 had no significant effect on sales or operating results as compared to fiscal 2011.
Listed below are excerpts from our consolidated statements of income:
| 2011 | % of Net Sales |
2010 | % of Net Sales |
Increase (Decrease) |
||||||||||||||
| Net sales |
$ | 129,568 | 100.0 | $ | 123,787 | 100.0 | $ 5,781 | |||||||||||
| Gross profit |
48,163 | 37.2 | 51,359 | 41.5 | (3,196 | ) | ||||||||||||
| Selling, general & administrative expenses (“SGA”) |
36,483 | 28.2 | 36,623 | 29.6 | (140 | ) | ||||||||||||
| Operating profit |
11,680 | 9.0 | 14,736 | 11.9 | (3,056 | ) | ||||||||||||
| Other income and interest, net |
158 | 0.1 | 247 | 0.2 | (89 | ) | ||||||||||||
| Earnings, before income tax |
11,838 | 9.1 | 14,983 | 12.1 | (3,145 | ) | ||||||||||||
| Income tax expense |
4,328 | 3.3 | 5,583 | 4.5 | (1,255 | ) | ||||||||||||
| Net earnings |
7,510 | 5.8 | 9,400 | 7.6 | (1,890 | ) | ||||||||||||
Net sales increased by 4.7% due primarily to incremental net sales from our newly-acquired businesses. Net sales achieved by our new businesses were consistent with their pre-acquisition historical levels and also reflected the benefit of revenue synergies obtained through efficiencies in customer order fulfillment identified during our acquisition due diligence process. Excluding the net sales from our new businesses, our footwear business net sales decreased by 4.0%, reflecting some of the challenges we experienced in certain of our key distribution channels during fiscal 2011. See further comments to this effect in the Footwear segment’s results of operations section below.
Gross profit in dollars and as a percent of net sales decreased primarily due to the decreased volume of footwear shipments during the period and the impact from higher costs paid to our third-party footwear manufacturers and other third-party supply chain providers, offset in part by the additive gross profit on accessory segment shipments, which typically yield higher margins as a percent of net sales as compared to our footwear shipments.
SGA expenses were relatively flat, reflecting the net of $5.1 million in lower payroll and incentive bonus expenses, $1.6 million in higher trade advertising-related expense in support of our Dearfoams® brand name, $1.1 million in acquisition-related expenses, $3.1 million incremental expenses related to the operations of the new businesses and $900 thousand in other net lower expense in other areas.
Other income increased due to royalty income from the licensing agreement with Olivet. The increase in other income was offset primarily by higher interest expense from borrowings obtained in the period to fund our business acquisitions.
The effective tax rates for fiscal 2011 and fiscal 2010 were 36.6% and 37.3%, respectively. Year-over-year changes to tax rates were due to permanent tax items, primarily represented by higher investment income on cash surrender assets held in the form of two insurance policies we own.
22
Table of Contents
Based on the results of operations noted above, we reported net earnings of approximately $7.5 million in fiscal 2011, or $0.67 per diluted common share, which represented a 20.2% decrease when compared to the net earnings of $9.4 million in fiscal 2010, or $0.85 per common diluted share.
Fiscal 2011 Compared to Fiscal 2010 Results of Operations - Footwear Segment
Our Footwear segment includes primarily slippers, sandals, hybrid and active fashion footwear. Our footwear products are sold in North America primarily through the accessory sections of department stores, chain stores, warehouse clubs, discount stores and mass merchandising channels of distribution.
Selected financial results for fiscal 2011 and fiscal 2010 were:
| 2011 | %
of Net Sales |
2010 | %
of Net Sales |
Increase (Decrease) | ||||||
| Net sales |
$ 118,844 | 100.0 | $ 123,787 | 100.0 | $ (4,943) | |||||
| Gross profit |
41,776 | 35.2 | 51,359 | 41.5 | (9,583) | |||||
| Operating profit |
8,435 | 7.1 | 14,736 | 11.9 | (6,301) |
The year-over-year decrease in net sales of 4.0% was due primarily to lower shipments to customers in the warehouse club, department store and mass merchandising channels, offset in part by higher shipments to customers in the discount store channel.
Gross profit decreased in both dollars and as a percentage of net sales due primarily to the following: (i) higher product costs incurred with our third-party manufacturers, reflecting the cost pressures we experienced in our supply chain during fiscal 2011; (ii) lower volume of shipments; and (iii) additional costs incurred during the 2010 fall season, which support the actions we took in order to ensure timely delivery to our customers and to provide adequate promotional funding to certain of our key customers.
The decrease in operating profit reflected primarily the impact of the decline of approximately 19% in gross profit for the reasons noted above. The decline in operating profit was also impacted by $1.6 million in higher advertising expense, reflecting our ongoing strategic marketing program in support of our Dearfoams® brand and $1.1 million in acquisition-related expenses incurred during fiscal 2011, partially offset by lower SGA expenses, represented primarily in $5.1 million in lower payroll, benefits and incentive bonus expenses and $900 thousand in net lower expense in other areas.
Fiscal 2011 Compared to Fiscal 2010 Results of Operations - Accessories Products Segment
Our accessories products segment is comprised of Foot Petals® and Baggallini®. This segment encompasses designing, sourcing, marketing and distributing a variety of accessory category products, including shoe and foot care products and handbags, tote bags and other travel accessories. These products are sold predominately in North America through customers primarily in the specialty and independent store, television shopping network, e-tailing/ internet based retail, upper tier department store, mass merchandising and discount store channels. Our business with these customers is primarily replenishment in nature, with sales spread evenly throughout the year.
Since these two business acquisitions occurred during fiscal 2011, on January 27 and March 31, respectively, there were no comparable financial results for fiscal 2010. Selected financial results for fiscal 2011 are shown below:
| 2011 | %
of Net Sales |
2010 | Increase | |||||
| Net sales |
$ 10,724 | 100.0 | — | $ 10,724 | ||||
| Gross profit |
6,387 | 59.6 | — | 6,387 | ||||
| Operating profit |
3,245 | 30.3 | — | 3,245 |
23
Table of Contents
Net sales included shipments primarily to customers in the specialty and independent store, television shopping network, mass merchandising, department store, internet/E- tailing based retail and other channels. Gross profit on shipments to these customers during the period was consistent with their historical levels and uniformly at higher rates than our Footwear segment.
Operating income reflected SGA expenses incurred related to this segment’s selling, marketing and distribution activities, and costs incurred in a variety of corporate-support expenses. In addition, we reported as part of SGA expenses approximately $500 thousand of non-cash, amortization expense with respect to the customer relationship intangible assets that resulted from the assignment of a portion of the purchase price to the assets acquired in the acquisition of the Foot Petals and Baggallini businesses.
Summary of Consolidated Results from Operations – Fiscal 2010 Compared to Fiscal 2009
The discussion in this section compares our results of operations for fiscal 2010 to fiscal 2009. The Company operated in a single segment, our footwear business, in both reporting periods, thus commentary for these periods is based on results associated with our footwear business only.
Each dollar amount and percentage change noted below reflects the change between these periods unless otherwise indicated. Fiscal 2010 had fifty-three weeks compared to fifty-two weeks for fiscal 2009; however, the additional week in fiscal 2010 had no significant effect on sales or operating results as compared to fiscal 2009.
During fiscal 2010, net sales increased by $10.0 million or 8.8%. This net sales increase reflected primarily increased shipments in the mass merchandising and discount channels, and reflected our continued success with product offerings and sales initiatives with customers in those channels. All other channels combined had flat to nominal net sales increases over fiscal 2009.
Gross profit increased by $7.9 million. Gross profit as a percent of net sales was 41.5% in fiscal 2010 and 38.2% in fiscal 2009. The increases in gross profit dollars and in gross profit as a percent of net sales reflected year-over-year increase in shipments and the impact of lower product costs due primarily to the then availability of supplier capacity and the reduction of oil prices in the period in which we placed our fall season orders in fiscal 2010 versus the same period in the prior year. In addition, the increase in gross profit as a percentage of net sales reflected in part the positive impact of higher margin in certain of our products shipped during the third quarter of fiscal 2010 as compared to the same period in fiscal 2009.
SGA expense increased by $3.7 million or 11.1%. As a percent of net sales, SGA expenses were 29.6% for fiscal 2010 versus 29.0% for fiscal 2009. The net increase in SG&A expenses was due primarily to the following:
| q | a $2.4 million increase in payroll costs, represented primarily by increases in incentive, severance and health benefit costs. |
| q | a $1.5 million increase in customer and consumer advertising expense as part of a multi-year marketing program in support of our Dearfoams® brand. |
| q | a $623 thousand increase in pension expense, due primarily to the effect of lower discount rates and pension asset market values on our annual pension expense and to the one-time impact of a settlement loss incurred on a lump-sum payment made to a former executive as full settlement of his nonqualified supplemental retirement plan benefit upon his retirement. |
| q | The higher expenses noted above were partially offset by a $393 thousand decrease in bad debt expense and a $524 thousand decrease in expenses in a broad range of areas, none of which were individually significant. |
The decrease in interest income of $438 thousand resulted from the lower interest rates available during fiscal 2010 than had been available during fiscal 2009.
Interest expense decreased nominally in fiscal 2010 compared to fiscal 2009. Due to our continuing profitability over time, we had no borrowings under our then Bank Facility, as described further under the caption “Liquidity and Capital Resources” below.
24
Table of Contents
Based on the results of operations noted above, we reported net earnings of approximately $9.4 million in fiscal 2010, or $0.85 per diluted common share, which represented a 34.4% increase when compared to the net earnings results of $7.0 million in fiscal 2009, or $0.65 per common diluted share.
Liquidity and Capital Resources
Our primary source of revenue and cash flow is our operating activities in North America. When cash inflows are less than cash outflows, we also have access to amounts under our New Facility subject to its terms, as described in the 2012 Liquidity Section below. We may seek to finance future capital investment programs through various methods, including, but not limited to, cash flow from operations and borrowings under our current or additional credit facilities.
Our liquidity requirements arise from the funding of our working capital needs, which include primarily inventory, other operating expenses and accounts receivable, funding of capital expenditures and repayment of our indebtedness. Generally, most of our product purchases from third-party manufacturers are acquired on an open account basis, and to a lesser extent, through trade letters of credit. Such trade letters of credit are drawn against our New Facility at the time of shipment of the products and reduce the amount available under our New Facility when issued.
Total cash and cash equivalents were $9.1 million at July 2, 2011, compared to $17.0 million at July 3, 2010. Short-term investments were $15.6 million at July 2, 2011, compared to $28.0 million at July 3, 2010.
At July 2, 2011, as part of our cash management and investment program, we maintained a portfolio of $15.6 million in short-term investments, including $12.1 million in marketable investment securities consisting of variable rate demand notes and $3.5 million in other short-term investments. The marketable investment securities are classified as available-for-sale. These marketable investment securities are carried at cost, which approximates fair value. The other short-term investments are classified as held-to-maturity securities and include several commercial paper investments, which matured in August 2011.
Operating Activities
During fiscal 2011, our operations generated $2.5 million in cash. This operating cash flow was primarily the result of our net earnings of $7.5 million for the period, adjusted for (a) non-cash activities such as deferred income tax expense of $932 thousand with an offsetting $128 thousand excess tax benefit credit recognized on stock options exercised and restricted stock unit vested; depreciation and amortization expense of $1.9 million; and stock-based compensation expense of $1.2 million, (b) changes in our working capital accounts and (c) payments on our pension and other obligations. In fiscal 2011, significant changes in working capital accounts included higher amounts of inventory, which were partially offset by lower amounts of accounts receivable and higher trade payables, as discussed in more detail below.
During fiscal 2010, our operations generated $6.8 million in cash. This operating cash flow was primarily the result of our net earnings of $9.4 million for the period, adjusted for (a) non-cash activities such as deferred income tax expense of $4.0 million, gross of an offsetting $1.3 million excess tax benefit credit recognized on stock options exercised and restricted stock unit vested; depreciation expense of $867 thousand; and stock-based compensation expense of $840 thousand, (b) changes in our working capital accounts and (c) payments on our pension and other debt obligations. In fiscal 2010, significant changes in working capital accounts included higher amounts of inventory, which were partially offset by lower amounts of accounts receivable.
During fiscal 2009, our operations generated $17.3 million in cash. This operating cash flow was primarily the result of our net earnings of $7 million for the period, adjusted for (a) non-cash activities such as deferred income tax expense of $3.5 million, depreciation and stock-based compensation expense of $775 thousand and $938 thousand, respectively, and (b) changes in our working capital accounts as well as payments on our pension and other obligations. In fiscal 2009, significant changes in working capital accounts included lower amounts of accounts receivable and inventory.
Our working capital ratio, which is calculated by dividing total current assets by total current liabilities, was 3.6:1 at July 2, 2011, 6.7:1 at July 3, 2010 and 6.2:1 at June 27, 2009. The decrease in our working capital ratio from the end of fiscal 2010 to the end of fiscal 2011 was primarily driven by the funds spent in the acquisitions made during 2011.
25
Table of Contents
Changes during fiscal 2011 in the primary components of our working capital accounts were as follows:
| q | Net accounts receivable decreased by approximately $496 thousand during fiscal 2011 primarily due to faster collections and the timing of customer deductions. |
| q | Inventories increased by $7.1 million during fiscal 2011, reflecting primarily accelerated purchases in support of our footwear business in order to mitigate cost pressures in both product and logistics and to ensure on time delivery of product to our customers in the 2011 fall season. |
| q | Accounts payable increased by $4.4 million during fiscal 2011, due primarily to the timing of and payment for inventory from third-party manufacturers. |
| q | Accrued expenses decreased by $3.0 million during fiscal 2011, primarily due to a reduction in incentive bonus accruals. |
Investing Activities
During fiscal 2011, investing activities used $36.0 million in cash. We used $47.8 million in cash for acquisitions completed during fiscal 2011. Sales and redemptions, net of purchases, of short-term investments generated $12.4 million. Capital expenditures were $676 thousand and primarily consisted of building and leasehold improvements as well as purchases of software and computer equipment.
During fiscal 2010, investing activities used $4.2 million in cash. Purchases, net of sales and redemptions, of short-term investments comprised $3.0 million of this amount. Capital expenditures were $1.2 million and primarily consisted of building and leasehold improvements as well as purchases of software and computer equipment.
During fiscal 2009, investing activities used $14.5 million in cash. Purchases, net of sales and redemptions, of short-term investments comprised $13.1 million of this amount. Capital expenditures were $1.4 million and primarily consisted of leasehold improvements to our New York showroom, warehouse equipment for our leased distribution facility in Texas and purchases of software and computer equipment.
Financing activities
During fiscal 2011, financing activities provided $25.6 million in cash. Debt proceeds of $30 million were obtained and used to fund acquisitions during fiscal 2011. Debt payments of $1.5 million and dividend payments of $3.1 million were made during the period.
During fiscal 2010, financing activities provided $74 thousand in cash. This financing cash inflow was primarily due to $1.3 million in gross excess tax benefits realized on the exercise of stock options and vesting of restricted stock units granted to certain employees of the Company and directors of R.G. Barry Corporation, $468 thousand provided from the exercise of employee stock options, offset, in part, by a $1.6 million payment of cash dividends.
During fiscal 2009, financing activities consumed $2.7 million in cash. This financing cash outflow was primarily due to the payment of a special cash dividend of $0.25 per common share, which amounted to approximately $2.7 million, as part of a Company dividend program implemented late in fiscal 2009. In addition, approximately $500 thousand of debt was paid in fiscal 2009, with an offsetting inflow of approximately $500 thousand provided from the exercise of employee stock options and gross excess state and local tax benefits associated with vesting of restricted stock units and stock option exercises during the period.
2012 Liquidity
We believe our sources of cash and cash equivalents on hand, short-term investments and funds available under our New Facility will be adequate to fund our operations and capital expenditures through fiscal 2012.
Credit Agreement
On March 1, 2011, we entered into an unsecured Credit Agreement (the “New Facility”) with The Huntington National Bank (“Huntington”). The New Facility replaced the previously existing unsecured revolving credit agreement with
26
Table of Contents
Huntington dated March 29, 2007 (as amended, the “Prior Credit Agreement”), which would have expired December 31, 2011. The Prior Credit Agreement with Huntington was terminated in connection with the New Facility.
Under the terms of the New Facility, Huntington is obligated to advance funds to us for a period of three years under a revolving credit facility (the “Revolving Credit Facility”). We may have outstanding indebtedness of up to $5 million under the Revolving Credit Facility from January through June of each calendar year and up to $10 million from July through December of each calendar year. The Revolving Credit Facility includes a $1.5 million sub-facility for letters of credit. Under the terms of the New Facility, we may request that Huntington increase the Revolving Credit Facility by an amount of up to $5 million. The termination and maturity date of the Revolving Credit Facility is March 1, 2014. The interest rate on the Revolving Credit Facility is a rate equal to LIBOR plus 1.75%. The Revolving Credit Facility must not have any outstanding borrowings for at least 30 consecutive days during each period commencing on July 1 and continuing through June 30 of the following year.
The applicable interest rate on the Revolving Credit Facility based on a 30-day LIBOR rate of 0.19% at July 2, 2011 was 1.94 %. Additionally, the Revolving Credit Facility requires the Company to pay a quarterly unused line fee at the rate of 0.25% of the average unused Revolving Credit Facility balance. During fiscal 2011, the Company did not use its prior or current facility and incurred unused line fees of $21 thousand. We incurred a commitment fee of $25 thousand when the Revolving Credit Facility was signed. This fee is being amortized over the term of the Revolving Credit Facility.
At July 2, 2011, we had $9.2 million available under the Revolving Credit Facility, as reduced by the aggregate amount of $800 thousand in letters of credit outstanding.
In addition, under the terms of the New Facility, Huntington provided us $30 million under a term loan facility (the “Term Loan Facility”). Under the Term Loan Facility, Huntington disbursed $15 million on March 1, 2011 and the remaining $15 million on March 31, 2011. We will make equal monthly principal payments in the amount of $357 thousand, together with accrued interest, beginning on April 1, 2011, with the remaining outstanding balance and accrued interest due and payable on March 1, 2016. The interest rate on the Term Loan Facility is a rate equal to LIBOR plus 1.85%. Under the terms of the New Facility, we entered into an interest rate contract that provided for a fixed interest rate of 3.94% on a notional amount of at least 50% of the outstanding principal balance of the Term Loan Facility.
The applicable interest rate on the Term Loan Facility at July 2, 2011 was 2.04%, based on a 30-day LIBOR rate of 0.19%.
We paid Huntington a one-time facility commitment fee of $75 thousand in connection with the Term Loan Facility and this fee is being amortized over the term of the loan.
As required under the terms of the New Facility, we are required to satisfy certain financial covenants, including (a) satisfying a minimum fixed charge coverage ratio test of not less than 1.1 to 1.0, which is calculated quarterly on a trailing 12-month basis beginning with the fiscal quarter ending on or nearest to March 31, 2012, (b) satisfying a funded debt leverage ratio test of not greater than 2.25 to 1.00, which is calculated quarterly beginning with the fiscal quarter ending on or nearest to March 31, 2012 and (c) maintaining a consolidated net worth of at least $52 million, increased annually by an amount equal to 50% of the Company’s consolidated net income subsequent to July 2, 2011. At July 2, 2011, we were in compliance with all these financial covenants.
Other Short-term Debt
During fiscal 2009, we paid $450 thousand of $2.2 million we previously borrowed against the cash surrender value of life insurance policies insuring our non-executive chairman. Approximately $1.8 million of this indebtedness was classified within short-term notes payable in each of our Consolidated Balance Sheets at July 2, 2011 and July 3, 2010.
Other Long-term Indebtedness and Current Installments of Long-term Debt
As of July 2, 2011, we reported approximately $4.3 million as current installments of long-term debt, under the Term Loan Facility.
27
Table of Contents
Other Matters Impacting Liquidity and Capital Resources
Contractual Obligations
We have traditionally leased facilities under operating lease transactions for varying term lengths, ranging generally from two years to seven years, often with options for renewal. On occasion, we have also leased certain equipment utilizing operating leases. These leasing arrangements have allowed us to pay for the facilities and equipment over the time periods they are utilized, rather than committing our resources initially to acquire the facilities or equipment. All leases have been accounted for as operating leases, consistent with the provisions of U.S. Generally Accepted Accounting Principles (“U.S. GAAP”). Our off-balance sheet non-cancelable operating lease obligations are discussed in Note (8) of the Notes to Consolidated Financial Statements included in “Item 8. Financial Statements and Supplementary Data.” in this 2011 Form 10-K.
The following table summarizes our contractual obligations for both short-term and long-term obligations as of July 2, 2011:
| Payments due by period | ||||||||||||||||||||||||
| Total | Less than 1 year |
1 – 3 years |
3 – 5 Years |
More than 5 years |
Other | |||||||||||||||||||
|
|
|
|||||||||||||||||||||||
| (in thousands of dollars) | ||||||||||||||||||||||||
| Short-Term Debt |
$ | 1,750 | $ | 1,750 | None | None | None | None | ||||||||||||||||
| Long-Term Debt, Current and Non-Current Portions * |
$ | 28,571 | $ | 4,285 | $ | 8,572 | $ | 15,714 | None | None | ||||||||||||||
| Other Long-Term Liabilities reflected on the Consolidated Balance Sheet of the Company ** |
$ | 11,070 | ** | ** | ** | ** | $ | 11,070 | ** | |||||||||||||||
| OTHER CONTRACTUAL OBLIGATIONS: |
||||||||||||||||||||||||
| Operating Leases – see also Note (8) of the Notes to Consolidated Financial Statements |
$ | 2,104 | $ | 925 | $ | 990 | $ | 189 | None | None | ||||||||||||||
| Minimum payments under third- party logistics distribution services contract |
$ | 900 | $ | 900 | None | None | None | None | ||||||||||||||||
| Purchase obligations in the ordinary course of business *** |
$ | 31,254 | $ | 31,254 | None | None | None | None | ||||||||||||||||
OFF-BALANCE SHEET ARRANGEMENTS:
None
* Interest has been excluded from the amount shown under Long-Term Debt, Current and Non-Current Portions above. The interest amounts are determined using a floating interest rate, with 50% of the loan balance effectively hedged with an interest rate contract, which results in a fixed annual interest rate of 3.94% on 50% of the loan balance.
28
Table of Contents
** Other Long-Term Liabilities reflected on the Consolidated Balance Sheet of the Company as of July 2, 2011 represented accrued cumulative obligations under our Associates’ Retirement Plan of approximately $3,540; accrued cumulative obligations under our Supplemental Retirement Plan of approximately $6,935; and various other accruals of approximately $595 thousand. The timing of future cash outflows related to most of these obligations is not readily determinable, as it is primarily dependent upon the annual actuarially-determined qualified pension plan contributions as well as the timing of future associate retirements.
*** We acquire inventory and merchandise in the ordinary course of business, issuing both purchase orders and, to a lesser extent, letters of credit to acquire merchandise from our suppliers. Commitments in the ordinary course of business outstanding as of July 2, 2011 are included above. There were no material outstanding commitments other than those represented as part of our ordinary course of business.
Other Matters Relevant to Financial Condition and Results of Operations
Critical Accounting Policies and Use of Significant Estimates
The preparation of financial statements in accordance with U.S. GAAP requires that we make certain estimates. These estimates can affect reported revenues, expenses and results of operations, as well as the reported values of certain assets and liabilities. We make these estimates based on information from as many resources, both internal and external, as are available at the time. After reasonably assessing the conditions that exist at the time, we make these estimates and prepare consolidated financial statements accordingly. These estimates are made in a consistent manner from period to period, based upon historical trends and conditions and after review and analysis of current events and circumstances. We believe these estimates reasonably reflect the current assessment of the financial impact of events whose actual outcomes will not become known to us with certainty until sometime in the future.
The following discussion of critical accounting policies is intended to bring to the attention of readers those accounting policies that management believes are critical to the Company’s consolidated financial statements and other financial disclosures. It is not intended to be a comprehensive list of all of our significant accounting policies that are more fully described in Notes (1) (a) through (1) (t) of the Notes to Consolidated Financial Statements in this 2011 Form 10-K.
A summary of the critical accounting policies requiring management estimates follows:
| (a) | Revenue recognition - We recognize revenue when the following criteria are met: |
| q | goods are shipped from our warehouse and other third-party distribution locations, at which point our customers take ownership and assume risk of loss; |
| q | collection of the relevant receivable is probable; |
| q | persuasive evidence of an arrangement exists; and |
| q | the sales price is fixed or determinable. |
In certain circumstances, we sell products to customers under special arrangements, which provide for return privileges, discounts, promotions and other sales incentives. When selling under these special arrangements, at the time we recognize revenue, we reduce our measurement of revenue by an estimate of the potential future returns and allowable retailer promotions and sales incentives, and recognize a corresponding reduction in reported trade accounts receivable. These estimates have traditionally been, and continue to be, sensitive to and dependent on a variety of factors including, but not limited to, quantities sold to our customers and the related selling and marketing support programs; channels of distribution; sell-through rates at retail; the acceptance of the styling of our products by consumers; the overall economic environment; consumer confidence leading towards and through the holiday selling season; and other related factors.
The estimates established for these allowances at the end of these reporting periods reflected our current practice of collaborating closely with key retailing partners to offer the appropriate in-season consumer promotions and sales incentives to achieve mutually satisfactory sell-through rates, thus reducing or eliminating returns. As of July 2, 2011, our allowance for returns was approximately $1.1 million. A hypothetical change of 10 percent in our returns allowance, net of the value of related inventory to be returned, would have an impact on income before income taxes
29
Table of Contents
of approximately $28 thousand. As of July 2, 2011, our allowance for promotions, cooperative advertising and other sales incentives was $2.2 million. A hypothetical change of 10 percent in this allowance would have an impact on income before income taxes of $220 thousand.
Due to the continuing seasonal nature of our business and the current economic climate, it is possible that allowances for returns, promotions and other sales incentives, and the related charges reported in our consolidated results of operations could be different than those estimates noted above.
We monitor the creditworthiness of our customers and the related collection of monies owed to us. In circumstances where we become aware of a specific customer’s inability to meet its financial obligations, a specific reserve for doubtful accounts is taken as a reduction to accounts receivable to reduce the net recognized receivable to the amount reasonably expected to be collected. For all other customers, we recognize estimated reserves for bad debts based on our historical collection experience, the financial condition of our customers, an evaluation of current economic conditions and anticipated trends, each of which is subjective and requires certain assumptions. At the end of fiscal 2011 and fiscal 2010, our allowance for doubtful accounts was $229 thousand and $228 thousand, respectively.
| (b) | Inventory valuation - We value inventories using the lower of cost or market, based upon the first-in, first-out (“FIFO”) costing method. We evaluate our inventories for any reduction in realizable value in light of the prior selling season, the overall economic environment and our expectations for the upcoming selling seasons, and we record the appropriate write-downs based on this evaluation. At the end of fiscal 2011 and the end of fiscal 2010, we estimated the FIFO cost of a portion of our inventory exceeded the estimated net realizable value of that inventory by $1.1 million and $336 thousand, respectively. The increase from fiscal 2010 to fiscal 2011 reflected our on-going initiatives to properly manage our inventory investment, including both continuing brands and those brands being discontinued. |
| (c) | Deferred tax asset realizability and uncertain tax positions - We make an assessment of the amount of income taxes that will become currently payable or recoverable for the just concluded period, and the deferred tax costs or benefits that will become realizable for income tax purposes in the future, as a consequence of differences between results of operations as reported in conformity with U.S. GAAP, and the requirements of the income tax codes existing in the various jurisdictions where we operate. In assessing the realizability of deferred tax assets, we consider whether it is more likely than not that some portion or all of the deferred tax assets will not be realized. The ultimate realization of deferred tax assets is dependent on the generation of future taxable income. Management considers scheduled reversal of deferred items, projected future taxable income and tax planning strategies in making this assessment. In addition, we make ongoing assessments of income tax exposures that may arise at the Federal, state or local tax levels. U.S. GAAP principles require that a position taken or expected to be taken in a tax return be recognized in the financial statements when it is more likely than not (i.e., a likelihood of more than 50%) that the position would be sustained upon examination by tax authorities. A recognized tax position is then measured at the largest amount of benefit that has a greater than fifty percent likelihood of being realized upon settlement. Any identified exposures will be subjected to continuing assessment and estimates will be revised accordingly as information becomes available to us. We had no reserve for uncertain tax positions at the end of fiscal 2011 or at the end of fiscal 2010, since there were no tax positions at the federal, state or local tax levels which did not meet the more likely than not recognition threshold as determined by management. |
| (d) | Impairment of long-lived assets - We review the carrying value of our long-lived assets, including property, plant and equipment and intangible assets with finite useful lives, for impairment whenever events or change in circumstances warrant such review. Impairment testing involves a comparison of the sum of the undiscounted future cash flows of the asset or asset group to its respective carrying amount. If the sum of the undiscounted future cash flows exceeds the carrying amount, then no impairment exists. If the carrying amount exceeds the sum of the undiscounted future cash flows, then a second step is performed to determine the amount of impairment, which would be recorded as an impairment charge in our consolidated statements of income. There were no impairment indicators present during fiscal 2011. |
Goodwill and intangible assets with indefinite lives are not amortized, but instead will be tested for impairment annually, during the Company’s second fiscal quarter, or more frequently if events or changes in circumstances indicate that impairment may be present. Application of goodwill impairment testing involves judgment, including but not limited to, the identification of reporting units and estimating the fair value of each reporting unit. A reporting
30
Table of Contents
unit is defined as an operating segment or one level below an operating segment. We test goodwill at the reporting unit level. The goodwill impairment test consists of comparing the fair value of each reporting unit, determined using discounted cash flows, to each reporting unit’s respective carrying value. If the estimated fair value of a reporting unit exceeds its carrying value, there is no impairment. If the carrying amount of the reporting unit exceeds its estimated fair value, goodwill impairment is indicated. The amount of the impairment is determined by comparing the fair value of the net assets of the reporting unit, excluding goodwill, to its estimated fair value, with the difference representing the implied fair value of the goodwill. If the implied fair value of the goodwill is lower than its carrying value, the difference is recorded as an impairment charge in the consolidated statements of income. No impairment indicators were present with regard to our goodwill or intangible assets with indefinite useful lives during the fiscal year ended July 2, 2011.
| (e) | Interest rate contract - The Company manages interest rate volatility on our floating interest-rate term debt borrowing. As a result of interest rate fluctuations, cash flow requirements on floating interest rate borrowings increase or decrease and impact both expected cash outflows as well as interest expense over time. We use a derivative instrument, an interest rate contract, as part of our interest rate risk management strategy to manage cash flow exposure from changes in interest rates. An interest rate contract generally involves the exchange of fixed-rate and variable-rate interest payments between two parties, based on a common notional principal amount and maturity date. A derivative instrument which is deemed highly effective qualifies for hedge accounting treatment under GAAP, and accordingly, the effective portion of unrealized gains and losses on an interest rate contract accounted for as a cash flow hedge is deferred as a component of accumulated other comprehensive income (loss). Any deferred portion is recognized as a component of interest expense when we incur the interest expense. Any ineffective portion is directly recorded as a component of interest expense. |
At the end of each quarter, fair value of the interest rate contract is measured and re-tested under GAAP criteria to determine and/or reconfirm status with regards to being an effective cash flow hedge. If determined to be effective, any gain or loss outstanding on the interest rate contract is recorded as an asset or liability, with an offset to other comprehensive income (loss). If some or all of the interest rate contract is deemed ineffective as a cash flow hedge, any gain or loss on the ineffective portion of the interest rate contract is recognized immediately in earnings.
| (f) | Pension liability - Our noncontributory retirement plan for the benefit of salaried and nonsalaried employees, the Associates’ Retirement Plan (“ARP”) was frozen effective March 31, 2004, and has remained frozen since that time. Our Supplemental Retirement Plan (“SRP”) for certain officers and other key employees as designated by our Board of Directors was also frozen effective March 31, 2004. The SRP is unfunded, noncontributory, and provides for the payment of monthly retirement benefits. |
The actuarial valuation of our ARP and SRP benefit costs, assets and obligations affects our financial position, results of operations and cash flow. These valuations require the use of assumptions and long-range estimates. These assumptions include, among others, assumptions regarding interest and discount rates, and assumed long-term rates of return on pension plan assets. We regularly evaluate these assumptions and estimates as new information becomes available. Changes in assumptions, which may be caused by conditions in the debt and equity markets, changes in asset mix, and plan experience, could have a material effect on our pension obligations and expenses, and can affect our net income, assets and shareholders’ equity. In addition, changes in assumptions such as rates of return, fixed income rates used to value liabilities or declines in the fair value of plan assets, may result in voluntary decisions or mandatory requirements to make additional contributions to our ARP.
The discount rate was determined based on an analysis of interest rates for high-quality, long-term corporate debt at each measurement date. In order to appropriately match the bond maturities with expected future cash payments, we utilize differing bond portfolios to estimate the discount rates for the defined benefit plans. The weighted average discount rate used to determine the defined benefit plans’ obligation as of the balance sheet date is the rate in effect at the measurement date. The same rate is also used to determine the defined benefit plans’ expense for the following fiscal year. The long-term rate of return for the defined benefit plans’ assets is based on our historical experience, the defined benefit plans’ investment guidelines and our expectations for long-term rates of return. The defined benefit plans’ investment guidelines are established based upon an evaluation of market conditions, tolerance for risk and cash requirements for benefit payments. Holding all other assumptions constant, we estimate that a 100 basis point decrease in the expected discount rate would decrease our fiscal 2011 pretax earnings by approximately $233 thousand, and it would increase our total pension liability by approximately $4.2 million as of July 2, 2011.
31
Table of Contents
We establish assumptions to measure our pension liabilities and project the long-term rate of return expected on the invested pension assets in our qualified ARP. Changes in assumptions, which may be caused by conditions in the debt and equity markets, changes in asset mix, and plan experience, could have a material effect on our pension obligations and expenses, and can affect our net income, assets, and shareholders’ equity. Changes in assumptions may also result in voluntary or mandatory requirements to make additional contributions to our qualified ARP. These assumptions are reviewed and reset as appropriate at the pension measurement date commensurate with the end of our fiscal year end, and we monitor these assumptions over the course of the fiscal year.
Expected rate of return on ARP assets is also an important element of plan expense. In fiscal 2011, we used 7.9 % as the rate of return on ARP assets. To determine the rate of return on plan assets, we consider the historical experience and expected future performance of the plan assets, as well as the current and expected allocation of the plan assets. Our ARP’s asset allocation as of July 2, 2011, the measurement date for fiscal 2011, was approximately 41% in domestic and foreign equity investments, 56% in domestic fixed income securities, and 3% in cash investments. This asset allocation was in line with our investment policy guidelines and the transitioning of our asset portfolio from an equity dominant mix to a debt dominant mix more in line with future cash outflows expected with our pension payment obligations. As this shifting in equity versus debt mix within our asset portfolio continues, the return on asset assumption will change as well. We periodically evaluate the allocation of plan assets among the different investment classes to ensure that they are within policy guidelines. Holding all other assumptions constant, we estimate that a 100 basis point decrease in the expected rate of return on ARP assets would lower our fiscal 2011 pre-tax earnings by approximately $259 thousand.
| (g) | Stock-based compensation - FASB ASC 718 (the Stock Compensation topic) requires the recognition of the fair value of stock-based compensation in the results of operations. The Company recognizes stock-based compensation expense over the requisite service period of the individual grantees, which generally equals the vesting period. When restricted stock units are granted, the fair value of the grant is determined based on the market value of the underlying common shares at the date of grant and is adjusted for anticipated forfeitures based on our historical experience and management judgment. In fiscal 2011, the equity-based grants were primarily in the form of restricted stock units, with a nominal amount of stock options granted. For fiscal 2010 and fiscal 2009, all equity-based grants made by the Company were in the form of restricted stock units. |
| (h) | Other - There are various other accounting policies that also require management’s judgment. We follow these policies consistently from year to year and period to period. For an additional discussion of all of our significant accounting policies, please see Notes (1) (a) through (1) (t) of the Notes to Consolidated Financial Statements. |
Actual results may vary from these estimates as a consequence of activities after the period-end estimates have been made. These subsequent activities will have either a positive or negative impact upon the results of operations in a period subsequent to the period when we originally made the estimate.
Recently Issued Accounting Standards
See Note 1 (u) of the Notes to Consolidated Financial Statements included in “Item 8. Financial Statements and Supplementary Data.” in this 2011 Form 10-K for disclosure that as of July 2, 2011, of any significant recently issued accounting standards that would impact the Company when these standards are implemented.
Item 7A. Quantitative and Qualitative Disclosures About Market Risk.
Interest Rates
Our principal market risk exposure relates to the impact of changes in short-term interest rates that may result from the floating rate nature of the Company’s New Facility. At July 2, 2011, we had $28.6 million in acquisition financing related term-debt outstanding under the New Facility and no outstanding balance on the revolving credit portion of the New Facility. Based on our projected funding needs for operations during fiscal 2012, we do not expect any additional significant borrowings under the revolving credit portion of our New Facility. With respect to the term debt under the New Facility, we entered into an interest rate contract which matches the loan term for 50% of the outstanding loan balance, and this contract fixes our interest rate on that 50% portion to a fixed annual interest rate of 3.94%. We typically do not hedge our exposure to floating interest rates in the normal course of business.
32
Table of Contents
Interest rate changes impact the level of earnings for short-term investments. Changes in long-term interest rates also affect the measurement of pension liabilities performed on an annual basis.
Market Risk Sensitive Instruments - Foreign Currency
Substantially all of our sales were conducted in North America and denominated in U.S. Dollars during fiscal 2011. At the end of each of fiscal 2011, fiscal 2010 and fiscal 2009, the Company did not have any foreign exchange contracts outstanding.
33
Table of Contents
Item 8. Financial Statements and Supplementary Data.
Report of Independent Registered Public Accounting Firm
The Board of Directors and Shareholders
R.G. Barry Corporation:
We have audited the accompanying consolidated balance sheets of R.G. Barry Corporation and subsidiaries as of July 2, 2011 and July 3, 2010, and the related consolidated statements of income, shareholders’ equity and comprehensive income, and cash flows for the years ended July 2, 2011, July 3, 2010 and June 27, 2009. These consolidated financial statements are the responsibility of the Company’s management. Our responsibility is to express an opinion on these consolidated financial statements based on our audits.
We conducted our audits in accordance with the standards of the Public Company Accounting Oversight Board (United States). Those standards require that we plan and perform the audit to obtain reasonable assurance about whether the financial statements are free of material misstatement. An audit includes examining, on a test basis, evidence supporting the amounts and disclosures in the financial statements. An audit also includes assessing the accounting principles used and significant estimates made by management, as well as evaluating the overall financial statement presentation. We believe that our audits provide a reasonable basis for our opinion.
In our opinion, the consolidated financial statements referred to above present fairly, in all material respects, the financial position of R.G. Barry Corporation and subsidiaries as of July 2, 2011 and July 3, 2010, and the results of their operations and their cash flows for the years ended July 2, 2011, July 3, 2010 and June 27, 2009, in conformity with U.S. generally accepted accounting principles.
We also have audited, in accordance with the standards of the Public Company Accounting Oversight Board (United States), R.G. Barry Corporation and subsidiaries’ internal control over financial reporting as of July 2, 2011, based on the criteria established in Internal Control-Integrated Framework issued by the Committee of Sponsoring Organizations of the Treadway Commission (COSO), and our report dated September 14, 2011, expressed an unqualified opinion on the effectiveness of the Company’s internal control over financial reporting.
/s/ KPMG LLP
Columbus, Ohio
September 14, 2011
34
Table of Contents
R.G. BARRY CORPORATION AND SUBSIDIARIES
(in thousands)
| ASSETS | July 2, 2011 | July 3, 2010 | ||||||
| Current assets: |
||||||||
| Cash and cash equivalents |
$ | 9,107 | $ | 16,988 | ||||
| Short-term investments |
15,565 | 27,954 | ||||||
| Accounts receivable: |
||||||||
| Trade (less allowances of $3,522 and $3,446, respectively) |
11,819 | 7,440 | ||||||
| Other |
— | 862 | ||||||
| Inventory |
25,500 | 13,486 | ||||||
| Deferred tax assets |
1,996 | 1,676 | ||||||
| Prepaid expenses |
799 | 999 | ||||||
|
|
|
|
|
|||||
| Total current assets |
64,786 | 69,405 | ||||||
|
|
|
|
|
|||||
| Property, plant and equipment, at cost |
12,805 | 11,669 | ||||||
| Less accumulated depreciation and amortization |
8,822 | 7,544 | ||||||
|
|
|
|
|
|||||
| Net property, plant and equipment |
3,983 | 4,125 | ||||||
|
|
|
|
|
|||||
| Deferred tax assets-noncurrent |
4,303 | 6,936 | ||||||
| Goodwill |
15,510 | — | ||||||
| Trade names |
9,200 | — | ||||||
| Other intangible assets (net of accumulated amortization of $1,059 and $451, respectively) |
15,253 | 171 | ||||||
| Other assets |
2,944 | 2,732 | ||||||
|
|
|
|
|
|||||
| Total assets |
$ | 115,979 | $ | 83,369 | ||||
|
|
|
|
|
|||||
| LIABILITIES AND SHAREHOLDERS’ EQUITY | ||||||||
| Current liabilities: |
||||||||
| Short-term notes payable |
$ | 1,750 | $ | 1,750 | ||||
| Current installments of long-term debt |
4,285 | 97 | ||||||
| Accounts payable |
10,118 | 3,598 | ||||||
| Accrued expenses |
1,947 | 4,867 | ||||||
|
|
|
|
|
|||||
| Total current liabilities |
18,100 | 10,312 | ||||||
|
|
|
|
|
|||||
| Long-term debt, excluding current installments |
24,286 | — | ||||||
| Accrued retirement costs and other |
11,070 | 18,461 | ||||||
|
|
|
|
|
|||||
| Total liabilities |
53,456 | 28,773 | ||||||
|
|
|
|
|
|||||
| Commitments and contingencies (note 18) |
— | — | ||||||
| Shareholders’ equity: |
||||||||
| Preferred shares, $1 par value per share: Authorized 3,775 Class A shares, 225 Series II Junior Participating Class A shares and 1,000 Class B shares; none issued |
— | — | ||||||
| Common shares, $1 par value per share: Authorized 22,500 shares; issued and outstanding 11,053 and 10,930 shares, respectively (excluding treasury shares of 1,047 and 1,025, respectively) |
11,053 | 10,930 | ||||||
| Additional capital in excess of par value |
20,271 | 19,195 | ||||||
| Accumulated other comprehensive loss |
(10,242) | (12,594) | ||||||
| Retained earnings |
41,441 | 37,065 | ||||||
|
|
|
|
|
|||||
| Total shareholders’ equity |
62,523 | 54,596 | ||||||
|
|
|
|
|
|||||
| Total liabilities and shareholders’ equity |
$ | 115,979 | $ | 83,369 | ||||
|
|
|
|
|
|||||
See accompanying notes to consolidated financial statements.
35
Table of Contents
R.G. BARRY CORPORATION AND SUBSIDIARIES
Consolidated Statements of Income
Fiscal Years Ended July 2, 2011, July 3, 2010 and June 27, 2009
(in thousands, except per common share data)
| 2011 | 2010 | 2009 | ||||||||||
| Net sales |
$ | 129,568 | $ | 123,787 | $ | 113,817 | ||||||
| Cost of sales |
81,405 | 72,428 | 70,350 | |||||||||
|
|
|
|
|
|
|
|||||||
| Gross profit |
48,163 | 51,359 | 43,467 | |||||||||
| Selling, general and administrative expenses |
36,483 | 36,623 | 32,971 | |||||||||
|
|
|
|
|
|
|
|||||||
| Operating profit |
11,680 | 14,736 | 10,496 | |||||||||
| Interest income |
163 | 341 | 779 | |||||||||
| Interest expense |
(370) | (94) | (109) | |||||||||
| Other income |
365 | — | 15 | |||||||||
|
|
|
|
|
|
|
|||||||
| Income before income tax |
11,838 | 14,983 | 11,181 | |||||||||
| Income tax expense |
4,328 | 5,583 | 4,189 | |||||||||
|
|
|
|
|
|
|
|||||||
| Net earnings |
$ | 7,510 | $ | 9,400 | $ | 6,992 | ||||||
|
|
|
|
|
|
|
|||||||
| Net earnings per common share |
||||||||||||
| Basic |
$ | 0.68 | $ | 0.86 | $ | 0.66 | ||||||
|
|
|
|
|
|
|
|||||||
| Diluted |
$ | 0.67 | $ | 0.85 | $ | 0.65 | ||||||
|
|
|
|
|
|
|
|||||||
| Weighted average number of common shares outstanding |
||||||||||||
| Basic |
11,097 | 10,893 | 10,633 | |||||||||
|
|
|
|
|
|
|
|||||||
| Diluted |
11,227 | 11,036 | 10,737 | |||||||||
|
|
|
|
|
|
|
|||||||
See accompanying notes to consolidated financial statements.
36
Table of Contents
R.G. BARRY CORPORATION
Consolidated Statements of Shareholders’ Equity and Comprehensive Income
Fiscal Years Ended July 2, 2011, July 3, 2010 and June 27, 2009
(in thousands)
| Common shares |
Additional capital in excess of par value |
Accumulated other comprehensive (loss) |
Retained earnings |
Net shareholders’ equity |
||||||||||||||||
| Balance at June 28, 2008 |
$ | 10,548 | $ | 15,763 | $ | (5,352) | $ | 25,070 | $ | 46,029 | ||||||||||
| Comprehensive income: |
||||||||||||||||||||
| Net earnings |
— | — | — | 6,992 | 6,992 | |||||||||||||||
| Other comprehensive loss: |
||||||||||||||||||||
| Pension liability adjustment, net of tax of $3,372 |
— | — | (5,742) | — | (5,742) | |||||||||||||||
|
|
|
|||||||||||||||||||
| Total comprehensive income |
1,250 | |||||||||||||||||||
|
|
|
|||||||||||||||||||
| Incremental effect of applying the measurement date change on the employee retirement plan, net of tax of $26 |
— | — | 45 | (86) | (41) | |||||||||||||||
| Stock-based compensation expense |
— | 938 | — | — | 938 | |||||||||||||||
| Stock-based compensation tax benefit realized |
— | (5) | — | — | (5) | |||||||||||||||
| Restricted stock units vested and stock options exercised, net of common shares withheld for taxes |
174 | 244 | — | — | 418 | |||||||||||||||
| Dividend declared at $0.25 per common share |
— | — | — | (2,681) | (2,681) | |||||||||||||||
|
|
|
|
|
|
|
|
|
|
|
|||||||||||
| Balance at June 27, 2009 |
$ | 10,722 | $ | 16,940 | $ | (11,049) | $ | 29,295 | $ | 45,908 | ||||||||||
| Comprehensive income: |
||||||||||||||||||||
| Net earnings |
— | — | — | 9,400 | 9,400 | |||||||||||||||
| Other comprehensive loss: |
||||||||||||||||||||
| Pension liability adjustment, net of tax of $946 |
— | — | (1,545) | — | (1,545) | |||||||||||||||
|
|
|
|||||||||||||||||||
| Total comprehensive income |
7,855 | |||||||||||||||||||
|
|
|
|||||||||||||||||||
| Stock-based compensation expense |
— | 840 | — | — | 840 | |||||||||||||||
| Stock-based compensation tax benefit realized |
— | 1,285 | — | — | 1,285 | |||||||||||||||
| Restricted stock units vested and stock options exercised, net of common shares withheld for taxes |
208 | 130 | — | — | 338 | |||||||||||||||
| Dividends declared at $0.15 per common share |
— | — | — | (1,630) | (1,630) | |||||||||||||||
|
|
|
|
|
|
|
|
|
|
|
|||||||||||
| Balance at July 3, 2010 |
$ | 10,930 | $ | 19,195 | $ | (12,594) | $ | 37,065 | $ | 54,596 | ||||||||||
| Comprehensive income: |
||||||||||||||||||||
| Net earnings |
— | — | — | 7,510 | 7,510 | |||||||||||||||
| Other comprehensive income (loss): |
||||||||||||||||||||
| Cash flow hedging derivative, net of tax of $95 |
(161) | (161) | ||||||||||||||||||
| Pension liability adjustment, net of tax of $1,476 |
— | — | 2,513 | — | 2,513 | |||||||||||||||
|
|
|
|||||||||||||||||||
| Total comprehensive income |
9,862 | |||||||||||||||||||
|
|
|
|||||||||||||||||||
| Stock-based compensation expense |
— | 1,186 | — | — | 1,186 | |||||||||||||||
| Stock-based compensation tax benefit realized |
— | 128 | — | — | 128 | |||||||||||||||
| Restricted stock units vested and stock options exercised, net of common shares withheld for taxes |
123 | (238) | — | — | (115) | |||||||||||||||
| Dividends declared at $0.28 per common share |
— | — | — | (3,134) | (3,134) | |||||||||||||||
|
|
|
|
|
|
|
|
|
|
|
|||||||||||
| Balance at July 2, 2011 |
$ | 11,053 | $ | 20,271 | $ | (10,242) | $ | 41,441 | $ | 62,523 | ||||||||||
|
|
|
|
|
|
|
|
|
|
|
|||||||||||
See accompanying notes to consolidated financial statements.
37
Table of Contents
R.G. BARRY CORPORATION
Consolidated Statements of Cash Flows
Fiscal Years Ended July 2, 2011, July 3, 2010 and June 27, 2009
(in thousands)
| 2011 |
2010 |
2009 |
||||||||||
| Operating activities: |
||||||||||||
| Net earnings |
$ | 7,510 | $ | 9,400 | $ | 6,992 | ||||||
| Adjustments to reconcile net earnings to net cash provided by operating activities: |
||||||||||||
| Depreciation and amortization |
1,891 | 867 | 775 | |||||||||
| Loss on disposal of property, plant and equipment, net |
10 | 47 | — | |||||||||
| Deferred income tax expense |
932 | 2,640 | 3,495 | |||||||||
| Gross excess tax (benefit) expense from exercise of stock options and vesting of restricted stock units |
(128) | (1,327) | 5 | |||||||||
| Stock-based compensation expense |
1,186 | 840 | 938 | |||||||||
| Changes in: |
||||||||||||
| Accounts receivable |
496 | 1,201 | 3,150 | |||||||||
| Inventory |
(7,089) | (4,986) | 2,342 | |||||||||
| Prepaid expenses and other assets |
42 | (107) | 968 | |||||||||
| Accounts payable |
4,414 | (289) | (282) | |||||||||
| Accrued expenses |
(3,038) | 1,929 | 604 | |||||||||
| Accrued retirement cost, net |
(3,659) | (3,260) | (1,520) | |||||||||
| Other liabilities |
(29) | (142) | (212) | |||||||||
|
|
|
|
|
|
|
|||||||
| Net cash provided by operating activities |
2,538 | 6,813 | 17,255 | |||||||||
|
|
|
|
|
|
|
|||||||
| Investing activities: |
||||||||||||
| Funds used in purchase of short-term investments |
(9,865) | (34,823) | (38,434) | |||||||||
| Proceeds from the sale of short-term investments |
22,254 | 31,846 | 25,327 | |||||||||
| Purchases of property, plant and equipment |
(676) | (1,181) | (1,365) | |||||||||
| Acquisitions of principal assets of Foot Petals, LLC and baggallini, Inc. business operations, net of assumed liabilities |
(47,750) | — | — | |||||||||
|
|
|
|
|
|
|
|||||||
| Net cash used in investing activities |
(36,037) | (4,158) | (14,472) | |||||||||
|
|
|
|
|
|
|
|||||||
| Financing activities: |
||||||||||||
| Proceeds from long-term debt |
30,000 | — | — | |||||||||
| Repayment of short-term and long-term debt |
(1,525) | (91) | (534) | |||||||||
| Gross excess tax benefit (expense) from exercise of stock options and vesting of restricted stock units |
128 | 1,327 | (5) | |||||||||
| Proceeds from common shares issued |
107 | 468 | 486 | |||||||||
| Dividends paid |
(3,092) | (1,630) | (2,681) | |||||||||
|
|
|
|
|
|
|
|||||||
| Net cash provided by (used in) financing activities |
25,618 | 74 | (2,734) | |||||||||
|
|
|
|
|
|
|
|||||||
| Net (decrease) increase in cash and cash equivalents |
(7,881) | 2,729 | 49 | |||||||||
| Cash and cash equivalents at the beginning of the year |
16,988 | 14,259 | 14,210 | |||||||||
|
|
|
|
|
|
|
|||||||
| Cash and cash equivalents at the end of the year |
$ | 9,107 | $ | 16,988 | $ | 14,259 | ||||||
|
|
|
|
|
|
|
|||||||
| Supplemental cash flow disclosures: |
||||||||||||
| Interest paid |
$ | 352 | $ | 96 | $ | 119 | ||||||
| Income taxes paid, net of taxes refunded |
2,599 | 2,464 | 636 | |||||||||
See accompanying notes to consolidated financial statements.
38
Table of Contents
Notes to Consolidated Financial Statements
R.G. Barry Corporation and Subsidiaries
(dollar amounts in thousands, except share and per common share data)
| (1) | Summary of Significant Accounting Policies |
| (a) | Principal Business Activity |
R.G. Barry Corporation, an Ohio corporation , is engaged, with its subsidiaries, including Foot Petals Inc. and Baggallini, Inc. (collectively, the “Company”), in designing, sourcing, marketing and distributing footwear, foot and shoe care products and hand bags, tote bags and other travel accessories. The Company operates in two reportable segments: (1) footwear that encompasses primarily slippers, sandals, hybrid and fashion footwear, slipper socks and hosiery; and (2) accessories with products including foot and shoe care products, handbags, tote bags and other travel accessories. The Company’s products are sold predominantly in North America through the accessory sections of department stores, chain stores, warehouse clubs, specialty stores, television shopping networks, e-tailing/internet based retailers, discount stores and mass merchandising channels of distribution.
The Company’s reporting period is a fifty-two or fifty-three-week period (“fiscal year”), ending annually on the Saturday nearest June 30. For definitional purposes, as used herein, the terms listed below include the respective periods noted:
| Fiscal 2011 |
52 weeks ended July 2, 2011 | |
| Fiscal 2010 |
53 weeks ended July 3, 2010 | |
| Fiscal 2009 |
52 weeks ended June 27, 2009 |
| (b) | Principles of Consolidation |
The financial statements include the accounts of the Company. All inter-company balances and transactions, where appropriate, have been eliminated in consolidation.
| (c) | Use of Estimates |
The Company’s financial statements have been prepared in conformity with U.S. generally accepted accounting principles (“GAAP”), and accordingly, require management to make estimates and assumptions that affect the reported amounts of assets and liabilities and disclosure of contingent assets and liabilities at the date of the financial statements and the reported amounts of revenues and expenses during the reporting periods. Actual results could differ from those estimates.
| (d) | Cash and Cash Equivalents |
Cash includes deposits with banks and other financial institutions, which are accessible at any time without prior notice or penalty. Cash equivalents include $5,803 and $7,289 in money market accounts at July 2, 2011 and July 3, 2010, respectively, with maturities of three months or less.
| (e) | Short-Term Investments |
At July 2, 2011, as part of its cash management and investment program, the Company maintained a portfolio of $15,565 in short-term investments, including $12,073 in marketable investment securities consisting of variable rate demand notes and $3,492 in other short-term investments. The marketable investment securities are classified as available-for-sale. These marketable investment securities are carried at cost, which approximates fair value. The other short-term investments are classified as held-to-maturity securities and include several commercial paper investments which matured in August 2011. Held-to-maturity debt securities are those debt securities as to which the Company has the ability and intent to hold
39
Table of Contents
Notes to Consolidated Financial Statements
R.G. Barry Corporation and Subsidiaries
(dollar amounts in thousands, except share and per common share data)
until maturity. Held-to-maturity debt securities are recorded at amortized cost, adjusted for the amortization or accretion of premiums or discounts.
At July 3, 2010, as part of its cash management and investment program, the Company maintained a portfolio of $27,954 in short-term investments, including $21,769 in marketable investment securities consisting of variable rate demand notes and $6,185 in other short-term investments. The marketable investment securities were classified as available-for-sale. These marketable investment securities were carried at cost, which approximated fair value. The other short-term investments were classified as held-to-maturity securities and include several corporate bonds which had individual maturity dates ranging from July 2010 to January 2011.
| (f) | Inventory |
Inventory is valued at the lower of cost or market, with cost determined on the first-in, first-out (FIFO) basis.
| (g) | Depreciation and Amortization |
Depreciation and amortization expense has been computed using the straight-line method over the estimated useful lives of the assets. Depreciation and amortization expense is reflected as part of selling, general and administrative expenses in the accompanying consolidated statements of income.
| (h) | Trademarks, Patents and Acquired Customer Relationships |
The Company incurs costs in obtaining and perfecting trademarks and patents related to its products and production-related processes. These costs are generally amortized over a period subsequent to asset acquisition not to exceed five years. The value of acquired customer relationships is amortized over their projected economic life using the straight-line method.
| (i) | Revenue Recognition and Trade Accounts Receivable |
The Company recognizes revenue when the following criteria are met:
| q | goods are shipped from its warehouse and other third-party distribution locations, at which point the Company’s customers take ownership and assume risk of loss; |
| q | collection of the relevant receivable is probable; |
| q | persuasive evidence of an arrangement exists; and |
| q | the sales price is fixed or determinable. |
Trade accounts receivable are recorded at the invoiced amount and do not bear interest. In certain circumstances, the Company sells to its customers under special arrangements, which in certain instances provide for return privileges, as well as discounts, promotions and other sales incentives. When selling under these special arrangements, the Company reduces its measurement of revenue by the estimated cost of potential future returns and allowable retailer promotions and sales incentives. The Company bases its estimates for sales returns and promotions and sales incentive allowances on current and historical trends and experience.
Allowances established for returns were approximately $1,088 and $1,431 at the end of fiscal 2011 and fiscal 2010, respectively, and are classified in trade accounts receivable on the
40
Table of Contents
Notes to Consolidated Financial Statements
R.G. Barry Corporation and Subsidiaries
(dollar amounts in thousands, except share and per common share data)
accompanying consolidated balance sheets; these allowances were for specific spring season programs initiated with certain customers in each respective fiscal year. During fiscal 2011 and fiscal 2010, the Company recorded approximately $3,711 and $2,884, respectively, as the sales value of merchandise returned by customers.
Allowances for promotions, cooperative advertising and other sales incentives established at the end of fiscal 2011 and fiscal 2010 were approximately $2,204 and $1,787, respectively, and are classified in trade accounts receivable on the accompanying consolidated balance sheets. Charges to revenue for consumer promotion, cooperative advertising and other sales incentive activities, including support for display fixtures, for fiscal 2011, fiscal 2010 and fiscal 2009 were approximately $13,445, $11,467 and $10,592, respectively.
| (j) | Distribution and Warehousing Costs |
Distribution and warehousing costs for finished product, including occupancy costs, are classified within selling, general and administrative expenses in the accompanying consolidated statements of income. These costs amounted to $6,872, $6,123 and $6,089 for fiscal 2011, fiscal 2010 and fiscal 2009, respectively.
| (k) | Advertising and Promotion |
The Company uses a variety of programs to advertise and promote the sale of its products to customers and consumers. Customer advertising is expensed as incurred. The cost of consumer advertising is expensed when first used. For fiscal 2011, fiscal 2010 and fiscal 2009, advertising and promotion expenses of $4,924, $3,285 and $1,798, respectively, have been reported in selling, general and administrative expenses in the accompanying consolidated statements of income.
| (l) | Income Taxes |
Income taxes are accounted for under the asset and liability method. Deferred tax assets and liabilities are recognized for the future tax consequences attributable to differences between the financial statement carrying amounts of existing assets and liabilities and their respective tax bases and operating loss and tax credit carryforwards. Deferred tax assets and liabilities are measured using enacted tax rates expected to apply to taxable income in the years in which those temporary differences are expected to be recovered or settled. The effect on deferred tax assets and liabilities of a change in tax rates is recognized in income in the period that includes the enactment date.
In assessing the realizability of deferred tax assets, the Company’s management considers whether it is more likely than not that some portion or all of the deferred tax assets will not be realized. The ultimate realization of deferred tax assets is dependent on the generation of future taxable income or the ability to carry back tax losses for recovery against prior years with taxable income. Management considers the scheduled reversal of deferred items, projected future taxable income and tax planning strategies in making this assessment.
| (m) | Per Common Share Information |
Basic net earnings per common share is based on the weighted average number of common shares outstanding during each reporting period. Diluted net earnings per common share are based on the weighted average number of common shares outstanding as well as, when their effect is dilutive, potential common shares consisting of certain common shares subject to stock options and restricted stock units.
41
Table of Contents
Notes to Consolidated Financial Statements
R.G. Barry Corporation and Subsidiaries
(dollar amounts in thousands, except share and per common share data)
| (n) | Comprehensive Income |
Comprehensive income, consisting of net earnings, deferred gains and losses on interest rate hedging contracts and pension liability adjustments, is presented in the accompanying consolidated statements of shareholders’ equity and comprehensive income.
| (o) | Shareholders’ Equity |
Financial Accounting Standards Board Accounting Standard Codification (FASB ASC) 718 (the Stock Compensation topic) requires the recognition of the fair value of stock-based compensation in the results of operations. The Company recognizes the stock-based compensation expense over the requisite service period of the individual grantees, which generally equals the vesting period. All of the stock-based compensation is accounted for as an equity instrument, and expense is recognized over the service period for the entire award. This recognition, under FASB ASC 718, is subject to the requirement that the cumulative amount of stock-based compensation expense recognized at any point in time must at least equal to the portion of the grant-date fair value of the award that is vested at that date.
The Company’s Amended and Restated 2005 Long-Term Incentive Plan (the “2005 Plan”) is the only equity-based compensation plan under which future awards may be made to employees and non-employee directors of R.G. Barry Corporation other than the employee stock purchase plan in which employees of the Company may participate, as described in further detail in Note (12). The Company’s previous equity-based compensation plans remained in effect with respect to the then outstanding awards following the approval of the 2005 Plan.
During fiscal 2011, fiscal 2010 and fiscal 2009, the Company recognized net excess federal, state and local tax benefit (expense) of $128, $1,285 and ($5), respectively, associated with stock-based compensation and recognized this excess benefit (expense) as an addition to (deduction from) the paid-in capital account. Excess tax benefits are recognized only when they impact taxes paid or payable.
| (p) | Fair Value Measurements |
FASB ASC 820-10 (the overall Subtopic of topic 820 on fair value measurements and disclosures) provides guidance on fair value measurements of assets and liabilities that are recognized or disclosed at fair value in the financial statements. This accounting standard provides a fair value hierarchy that prioritizes the inputs to valuation techniques used to measure fair value. The hierarchy gives the highest priority to unadjusted quoted prices in active markets for identical assets or liabilities (Level 1 measurements) and the lowest priority to measurements involving significant unobservable inputs (Level 3 measurements). The three levels of the fair value hierarchy are as follows:
| • | Level 1 inputs are quoted prices (unadjusted) in active markets for identical assets or liabilities that the Company has the ability to access at the measurement date. |
| • | Level 2 inputs are inputs other than quoted prices included within Level 1 that are observable for the asset or liability, either directly or indirectly. |
| • | Level 3 inputs are unobservable inputs for the asset or liability. |
The level in the fair value hierarchy within which a fair value measurement falls is based on the lowest level input that is significant to the fair value measurement in its entirety.
42
Table of Contents
Notes to Consolidated Financial Statements
R.G. Barry Corporation and Subsidiaries
(dollar amounts in thousands, except share and per common share data)
| (q) | Impairment of Long-Lived Assets and Long-Lived Assets to Be Disposed Of |
The carrying value of long-lived assets including property, plant and equipment and intangible assets with finite useful lives, are reviewed for impairment whenever events or change in circumstances warrant such review. Impairment testing involves a comparison of the sum of the undiscounted future cash flows of the asset or asset group to its respective carrying amount. If the sum of the undiscounted future cash flows exceeds the carrying amount, then no impairment exists. If the carrying amount exceeds the sum of the undiscounted future cash flows, then a second step is performed to determine the amount of impairment, which would be recorded as an impairment charge in the consolidated statements of earnings. There were no impairment indicators present during the fiscal year ended July 2, 2011.
Assets to be disposed of, if any, would be presented separately in the consolidated balance sheets, reported at the lower of the carrying amount or fair value less costs to sell, and are no longer depreciated.
Goodwill and intangible assets with indefinite lives are not amortized, but instead are tested for impairment annually, during the Company’s second fiscal quarter, or more frequently, if events or changes in circumstances indicate that impairment may be present. Application of goodwill impairment testing involves judgment, including but not limited to, the identification of reporting units and estimating the fair value of each reporting unit. A reporting unit is defined as an operating segment or one level below an operating segment. Goodwill is tested at the reporting unit level. The goodwill impairment test consists of comparing the fair value of each reporting unit, determined using discounted cash flows, to each reporting unit’s respective carrying value. If the estimated fair value of a reporting unit exceeds its carrying value, there is no impairment. If the carrying amount of the reporting unit exceeds its estimated fair value, goodwill impairment is indicated. The amount of the impairment is determined by comparing the fair value of the net assets of the reporting unit, excluding goodwill, to its estimated fair value, with the difference representing the implied fair value of the goodwill. If the implied fair value of the goodwill is lower than its carrying value, the difference is recorded as an impairment charge in the consolidated statements of income. No impairment indicators were present with regard to our goodwill or intangible assets with indefinite useful lives during the fiscal year ended July 2, 2011.
| (r) | Allowances Granted to Resellers |
The Company provided consideration to customers in the form of discounts and other allowances which were reflected as a reduction of net sales of approximately $12,150, $10,188 and $9,340 for fiscal 2011, fiscal 2010 and fiscal 2009, respectively.
| (s) | Interest and Penalties Associated with Income Tax |
The Company’s policy is to recognize and classify any interest and penalties associated with unrecognized tax benefits relating to uncertain tax positions as part of the Company’s income tax expense.
| (t) | Derivative Instruments and Hedging |
A derivative instrument, an interest rate contract, is used as part of the Company’s interest rate risk management strategy to manage cash flow exposure from changes in interest rates. An interest rate contract generally involves the exchange of fixed-rate and variable-rate interest payments between two parties, based on a common notional principal amount and maturity date. Under an interest rate contract, the Company agrees with another party to
43
Table of Contents
Notes to Consolidated Financial Statements
R.G. Barry Corporation and Subsidiaries
(dollar amounts in thousands, except share and per common share data)
exchange, at specified intervals, the difference between fixed-rate and floating-rate interest amounts, which is calculated based on an agreed-upon notional amount. A derivative instrument deemed highly effective qualifies for hedge accounting treatment under GAAP, and accordingly, the effective portion of unrealized gains and losses on interest rate swaps accounted for as a cash flow hedge is deferred as a component of accumulated other comprehensive income (loss). Any deferred portion is a component of interest expense when the interest expense is incurred. Any ineffective portion is directly recorded as a component of interest expense.
At the end of each quarter, the interest rate contract is recorded on the consolidated balance sheet at fair value and re-tested under GAAP criteria to determine and/or reconfirm status with regards to being an effective cash flow hedge. If determined to be effective, any gain or loss outstanding on the interest rate contract is recorded to other comprehensive income (loss). If some or all of the interest rate contract is deemed ineffective as a cash flow hedge, any gain or loss on the ineffective portion of the interest rate contract is recognized immediately in earnings.
| (u) | Recently Issued Accounting Standards |
The Financial Accounting Standards Board (“FASB”) issued Accounting Standards Update (“ASU”) No. 2011-05, Comprehensive Income (Topic 220): Presentation of Comprehensive Income, in June 2011. The ASU will supersede some of the guidance in Topic 220 of the accounting Codification. The main provisions of this ASU provide that an entity that reports items of other comprehensive income has the option to present comprehensive income in either one or two consecutive financial statements. One option involves use of a single statement which must present the components of net income and total net income, the components of other comprehensive income and total other comprehensive income, and a total for comprehensive income. The second option involves a two-statement approach, in which an entity must present the components of net income and total net income in the first statement. That statement must be immediately followed by a financial statement that presents the components of other comprehensive income, a total for other comprehensive income and a total for comprehensive income.
The prior option in current GAAP that permits the presentation of other comprehensive income in the statement of changes in equity will be eliminated upon adoption of this new ASU.
The amendments in this ASU will be applied retrospectively. For the Company, the amendments are effective for fiscal 2013, and interim periods within that year. Early adoption is permitted, because compliance with the amendments is already permitted. Adoption of this standard change will only affect the presentation format of the Company’s consolidated financial statements.
| (2) | Fair Value Measurements |
Fair Value of Financial Instruments
Cash, cash equivalents, short-term investments, accounts receivable, accounts payable, accrued expenses, and short-term notes payable as reported in the consolidated financial statements, approximate their fair value because of the short-term maturity of those instruments. The fair value of the Company’s long-term debt is based on the present value of expected cash flows, considering expected maturities and using current interest rates available to the Company for
44
Table of Contents
Notes to Consolidated Financial Statements
R.G. Barry Corporation and Subsidiaries
(dollar amounts in thousands, except share and per common share data)
borrowings with similar terms. The carrying amount of the Company’s long-term debt approximates its fair value. The fair value of the Company’s long-term debt is disclosed in Note (6).
The following table presents assets and liabilities that are measured at fair value on a recurring basis at July 2, 2011:
| Fair Value Measurements at Reporting Date Using: |
||||||||||||||||
| Carrying Amount
|
Quoted Prices in Active Markets for Identical Assets (Level 1) |
Significant Other Observable Inputs (Level 2) |
Significant Unobservable Inputs (Level 3) |
|||||||||||||
| Assets: |
||||||||||||||||
| Available-for-sale securities |
$ | 12,073 | — | $ | 12,073 | — | ||||||||||
|
|
|
|
|
|
|
|
|
|||||||||
| Total |
$ | 12,073 | — | $ | 12,073 | — | ||||||||||
|
|
|
|
|
|
|
|
|
|||||||||
| Liabilities: |
||||||||||||||||
| Interest rate contract |
$ | 268 | — | $ | 268 | — | ||||||||||
|
|
|
|
|
|
|
|
|
|||||||||
| Total |
$ | 268 | — | $ | 268 | — | ||||||||||
|
|
|
|
|
|
|
|
|
|||||||||
The following table presents assets and liabilities that are measured at fair value on a recurring basis at July 3, 2010:
| Fair Value Measurements at Reporting Date Using: |
||||||||||||||||
| Carrying Amount
|
Quoted Prices in Active Markets for Identical Assets (Level 1) |
Significant Other Observable Inputs (Level 2) |
Significant Unobservable Inputs (Level 3) |
|||||||||||||
| Assets: |
||||||||||||||||
| Available-for-sale securities |
$ | 21,769 | — | $ | 21,769 | — | ||||||||||
|
|
|
|
|
|
|
|
|
|||||||||
| Total |
$ | 21,769 | — | $ | 21,769 | — | ||||||||||
|
|
|
|
|
|
|
|
|
|||||||||
The Company had no assets or liabilities measured at fair value on a non-recurring basis during fiscal 2011 or fiscal 2010.
| (3) | Inventory |
Inventory by category at July 2, 2011 and July 3, 2010 consisted of the following:
| 2011 | 2010 | |||||||
| Raw materials |
$ | 1,097 | $ | 73 | ||||
| Finished goods |
24,403 | 13,413 | ||||||
|
|
|
|
|
|||||
| Total Inventory |
$ | 25,500 | $ | 13,486 | ||||
|
|
|
|
|
|||||
45
Table of Contents
Notes to Consolidated Financial Statements
R.G. Barry Corporation and Subsidiaries
(dollar amounts in thousands, except share and per common share data)
Inventory was valued at the lower of cost or market, at the end of fiscal 2011 and the end of fiscal 2010; adjustments to market at the end of each of these periods were $1,142 and $336, respectively.
Inventory adjustments to reduce cost to market recognized as a part of cost of sales were $2,114, $1,617 and $1,069 in fiscal 2011, fiscal 2010 and fiscal 2009, respectively.
| (4) | Property, Plant and Equipment |
Property, plant and equipment at cost at July 2, 2011 and July 3, 2010 consisted of the following:
| 2011 | 2010 | Estimated life in years | ||||||||
| Land and improvements |
$ | 279 | $ | 279 | 5–15 | |||||
| Buildings and improvements |
3,738 | 3,751 | 5–45 | |||||||
| Machinery and equipment |
7,198 | 6,454 | 2–10 | |||||||
| Leasehold improvements |
1,241 | 1,102 | 2–6 | |||||||
| Construction in progress |
349 | 83 | ||||||||
|
|
|
|
|
|||||||
| Total property, plant and equipment |
$ | 12,805 | $ | 11,669 | ||||||
| Less total accumulated depreciation |
8,822 | 7,544 | ||||||||
|
|
|
|
|
|||||||
| Net property, plant and equipment |
$ | 3,983 | $ | 4,125 | ||||||
|
|
|
|
|
|||||||
| (5) | Goodwill and Other Intangible Assets |
The Company uses the acquisition method of accounting for any business acquisitions and recognizes intangible assets separately from goodwill. The acquired assets and assumed liabilities in an acquisition are measured and recognized based on their estimated fair value at the date of acquisition, with goodwill representing the excess of the consideration transferred over the fair value of the identifiable net assets.
With the purchase of the principal business assets of Foot Petals, LLC in January 2011 as disclosed in Note (15), the Company recognized goodwill of $5,420, a finite life intangible asset of $3,200 and indefinite life intangible assets of $3,600. The finite life intangible asset consisted of customer relationships and is being amortized over a seven-year expected life, as determined through valuation analysis at the time of acquisition, using the straight-line method. The indefinite life intangible assets acquired for $3,600 consisted of trade names. All goodwill and intangible assets recognized were reported within the Company’s Accessories segment.
Also, in March 2011, the Company recognized goodwill of $10,089, a finite life intangible asset of $12,400 and indefinite life intangible assets of $5,600 as a result of the purchase of the principal business assets of baggallini, Inc. as disclosed in Note (15). The finite life intangible asset consisted of customer relationships and is being amortized over a ten-year expected life, as determined through valuation analysis at the time of acquisition, using the straight-line method. The indefinite life intangible assets acquired for $5,600 consisted of trade names. All goodwill recognized and any intangible assets were reported within the Company’s Accessories segment.
Purchased goodwill and intangible assets with indefinite lives are not amortized, but instead will be tested for impairment annually, during the second fiscal quarter, or more frequently if events or changes in circumstances indicate that impairment may be present. The Company’s impairment testing for both goodwill and other long-lived assets, including intangible assets with finite useful lives, is primarily based on cash flow models that require significant judgment and assumptions about future trends, revenue and expense growth rates, and in addition, external factors such as
46
Table of Contents
Notes to Consolidated Financial Statements
R.G. Barry Corporation and Subsidiaries
(dollar amounts in thousands, except share and per common share data)
changes in economic trends and cost of capital. Significant changes in any of these assumptions could impact the outcome of the tests performed.
Goodwill and indefinite life intangible assets included the following:
| Goodwill | Trade names | |||||||
| Balance as of July 3, 2010 |
$ | — | $ | — | ||||
| Acquired during fiscal 2011 |
15,510 | 9,200 | ||||||
|
|
|
|
|
|||||
| Balance as of July 2, 2011 |
$ | 15,510 | $ | 9,200 | ||||
|
|
|
|
|
|||||
Other intangible assets included the following:
| July 2, 2011 | ||||||||||||||||
| Weighted average amortization period |
Gross Carrying amount |
Accumulated amortization |
Net carrying amount |
|||||||||||||
| Amortizing intangible assets: |
||||||||||||||||
| Customer relationships |
9.4 years | $ | 15,600 | $ | (500) | $ | 15,100 | |||||||||
| Trademarks, patents and fees |
5 years | 712 | (559) | 153 | ||||||||||||
|
|
|
|
|
|
|
|||||||||||
| Total amortizing intangible assets |
$ | 16,312 | $ | (1,059) | $ | 15,253 | ||||||||||
|
|
|
|
|
|
|
|||||||||||
| July 3, 2010 | ||||||||||||||||
| Weighted average amortization period |
Gross Carrying amount |
Accumulated amortization |
Net
carrying amount |
|||||||||||||
| Amortizing intangible assets: |
||||||||||||||||
| Trademarks, patents and fees |
5 years | $ | 622 | $ | (451) | $ | 171 | |||||||||
|
|
|
|
|
|
|
|||||||||||
| Total amortizing intangible assets |
$ | 622 | $ | (451) | $ | 171 | ||||||||||
|
|
|
|
|
|
|
|||||||||||
The Company recognized aggregate customer relationships and trademark, patents and fees amortization expense of $625, $191 and $190 in fiscal 2011, fiscal 2010 and fiscal 2009, respectively, and reported that expense as part of selling, general and administrative expenses in the accompanying consolidated statements of income.
Based on the Company’s amortization methods, remaining customer relationships and trademarks, patents and fees costs will be recognized as amortization expense of $1,738, $1,735, $1,730, $1,724 and $1,712 in each of the next five years, respectively. The Company would accelerate the expensing of these costs should circumstances change and an impairment condition be determined for customer relationships, trademarks or patents that have a remaining value.
47
Table of Contents
Notes to Consolidated Financial Statements
R.G. Barry Corporation and Subsidiaries
(dollar amounts in thousands, except share and per common share data)
| (6) | Short-term Notes Payable and Long-term Debt |
On March 1, 2011, the Company and The Huntington National Bank (“Huntington”) entered into an unsecured Credit Agreement (the “New Facility”). The New Facility replaced the previously existing unsecured revolving credit agreement between the Company and Huntington dated March 29, 2007 (as amended, the “Prior Credit Agreement”), which would have expired December 31, 2011. The Prior Credit Agreement with Huntington was terminated in connection with the New Facility.
Under the terms of the New Facility, Huntington is obligated to advance funds to the Company for a period of three years under a revolving credit facility (the “Revolving Credit Facility”). The Company may have outstanding indebtedness of up to $5,000 under the Revolving Credit Facility from January through June of each calendar year and up to $10,000 from July through December of each calendar year. The Revolving Credit Facility includes a $1,500 sub-facility for letters of credit. Under the terms of the New Facility, the Company may request that Huntington increase the Revolving Credit Facility by an amount of up to $5,000. The termination and maturity date of the Revolving Credit Facility is March 1, 2014. The interest rate on the Revolving Credit Facility is a rate equal to LIBOR plus 1.75%. Additionally, the Company will pay a quarterly fee equal to 0.25% of the daily average unused amount of the Revolving Credit Facility, as well as a one-time $25 facility fee effective as of March 1, 2011 in connection with the Revolving Credit Facility, which is being amortized over the term of the Revolving Credit Facility. Further, the Revolving Credit Facility must be without any outstanding borrowings for at least 30 consecutive days during each period commencing on July 1 and continuing through June 30 of the following year. At July 2, 2011, there were no outstanding borrowings on the Revolving Credit Facility. At July 2, 2011, the Company had available borrowing capacity under the Revolving Credit Facility of $9,200, net of $800 of open letters of credit.
Under the terms of the New Facility, the Company borrowed $30,000 under a term loan facility (the “Term Loan Facility”). Under the Term Loan Facility, Huntington disbursed $15,000 on March 1, 2011 and the remaining $15,000 on March 31, 2011. The Company started making equal monthly principal payments in the amount of $357, together with accrued interest, beginning on April 1, 2011, with the remaining outstanding balance and accrued interest due and payable on March 1, 2016. The interest rate under the Term Loan Facility is a rate equal to LIBOR plus 1.85%. As required under the terms of the New Facility, the Company entered into an interest rate contract that provided for a fixed interest rate of 3.94% on a notional amount equal to fifty percent of the outstanding principal balance of the term loan. See “Note (7), “Derivative Instruments and Hedging Activities”.
The Company paid Huntington a one-time facility commitment fee of $75 in connection with the Term Loan Facility and this fee is being amortized over the term of the term loan. The applicable interest rate on the Term Loan Facility at July 2, 2011 was 2.04% based on a 30-day LIBOR rate of .19% on that date.
Under the terms of the New Facility, the Company is required to satisfy certain financial covenants, including (a) satisfying a minimum fixed charge coverage ratio test of not less than 1.1 to 1.0, which is calculated quarterly on a trailing 12-month basis beginning with the fiscal quarter ending on or nearest to March 31, 2012, (b) satisfying a funded debt leverage ratio test of not greater than 2.25 to 1.00, which is calculated quarterly beginning with the fiscal quarter ending on or nearest to March 31, 2012 and (c) maintaining a consolidated net worth of at least $52 million, increased annually by an amount equal to 50% of the Company’s consolidated net income subsequent to July 2, 2011. At July 2, 2011, the Company was in compliance with all these financial covenants.
48
Table of Contents
Notes to Consolidated Financial Statements
R.G. Barry Corporation and Subsidiaries
(dollar amounts in thousands, except share and per common share data)
The Company and its co-founder, the mother of the Company’s non-executive chairman (“chairman”), entered into an agreement in August 2005 whereby she transferred all of her product designs and patent rights to the Company and released all unpaid claims that would have accrued under a previous agreement. Under the August 2005 agreement, the Company was obligated to make 24 quarterly payments of $25 each on the last business day of every October, January, April and July until the last business day in April 2011. On March 24, 2008, the remaining payment rights under the agreement were assigned to a fund established with a philanthropic organization. Final payment on this obligation was made during fiscal 2011.
The fair value of the Company’s long-term debt is based upon the present value of expected cash flows, considering expected maturities and using current interest rates available to the Company for borrowings with similar terms. The carrying amount of the Company’s long-term debt approximates its fair value. Long-term debt consisted of the following:
| July 2, 2011 | July 3, 2010 | |||||||
| Long-term debt |
$ | 28,571 | $ | 97 | ||||
| Less current installments |
4,285 | 97 | ||||||
|
|
|
|
|
|||||
| Long-term debt excluding current installments |
$ | 24,286 | $ | — | ||||
|
|
|
|
|
|||||
The aggregate minimum principal maturities of the long-term debt for each of the next five years following July 2, 2011 are as follows:
| 2012 |
$ | 4,286 | ||
| 2013 |
4,286 | |||
| 2014 |
4,286 | |||
| 2015 |
4,286 | |||
| 2016 |
3,213 | |||
| 2016 due at end of term loan |
8,214 | |||
|
|
|
|||
| $ | 28,571 | |||
|
|
|
| (7) | Derivative Instruments and Hedging Activities |
The Company may utilize derivative financial instruments to manage exposure to certain risks related to its ongoing operations. The primary risk managed through the use of derivative instruments is interest rate risk. In January 2011, the Company entered into an interest rate contract with an initial notional amount of $15,000 and a maturity date of March 1, 2016 to hedge the changes in cash flows attributable to changes in the LIBOR rate associated with the Term Loan Facility. Under this interest rate contract, the Company pays a fixed interest rate of 3.94% and receives a variable rate based on LIBOR plus 1.85%. The notional amount of this interest rate contract is required to be 50% of the amount of the term loan through the expiration of the term loan under the Term Loan Facility described in Note (6), “Short-term Notes Payable and Long-term Debt”.
The Company’s objective is to manage the impact of interest rate changes on cash flows and the market value of its borrowings under the floating rate term loan. In addition, the Company may enter into interest rate contracts to further manage exposure to interest rate variations related to borrowings and to lower overall borrowing costs. The Company does not use derivative instruments for trading or speculative purposes. The Company’s derivative instrument is designated as a hedging instrument, which is adjusted to fair value at the end of each reporting
49
Table of Contents
Notes to Consolidated Financial Statements
R.G. Barry Corporation and Subsidiaries
(dollar amounts in thousands, except share and per common share data)
period with the effective portion of the adjustment recorded to other comprehensive income. Any ineffective portion is recorded in earnings.
The Company is exposed to counterparty credit risk on any derivative instrument. Accordingly, the Company has established and maintains strict counterparty credit guidelines and enters into any derivative instrument only with a major financial institution. The Company does not have significant exposure to any counterparty and management believes the risk of loss is remote and, in any event, would not be material.
Refer to Note 2, “Fair Value Measurements” for additional information regarding the fair value of the derivative instrument.
The following table summarizes the fair value of the Company’s derivative instrument and the line item in which it was recorded in the consolidated balance sheet at July 2, 2011:
| Liability Derivative |
||||||||
| Balance Sheet Location | Fair Value | |||||||
| Derivative designated as hedging instrument: |
||||||||
| Interest rate contract |
|
Accrued retirement costs and other |
|
$ | 268 | |||
|
|
|
|||||||
| $ | 268 | |||||||
|
|
|
|||||||
Cash Flow Hedges
The Company may enter into derivative instruments to hedge exposure to changes in cash flows attributable to interest rate fluctuations associated with certain forecasted transactions. These derivative instruments are designated and qualify as cash flow hedges. Accordingly, the effective portion of the gain or loss on any such derivative instrument is reported as a component of other comprehensive income (“OCI”) and reclassified into earnings in the same line item associated with the forecasted transaction and in the same period during which the hedged transaction affects earnings. The ineffective portion of the gain or loss on the derivative instrument, if any, is recognized in earnings immediately.
The following table summarizes the loss recognized in OCI and the loss reclassified from accumulated OCI into earnings for the derivative instrument designated as a cash flow hedge during the fiscal year ended July 2, 2011. There were no derivative instruments held by the Company during the fiscal year ended July 3, 2010.
| Gross Loss Recognized in OCI (Effective Portion) |
Location of Loss Reclassified from Accumulated OCI (Effective Portion) |
Loss Reclassified from Accumulated OCI (Effective) |
Location of Loss (Ineffective Portion) Excluded from Effectiveness |
Loss (Ineffective Portion) Excluded from Effectiveness Testing |
||||||||||||||||
| Interest rate contract |
$ | 256 | Interest expense | $ | — | Interest expense | $ | 13 | ||||||||||||
50
Table of Contents
Notes to Consolidated Financial Statements
R.G. Barry Corporation and Subsidiaries
(dollar amounts in thousands, except share and per common share data)
The estimated net amount of the loss in accumulated other comprehensive income at July 2, 2011 expected to be reclassified into net earnings within the next twelve months is $219.
| (8) | Lease Commitments |
The Company occupies certain distribution and office sales facilities under cancelable and noncancelable operating lease arrangements. A summary of the noncancelable operating lease commitments at July 2, 2011 is as follows:
| 2012 |
$ | 925 | ||
| 2013 |
547 | |||
| 2014 |
443 | |||
| 2015 |
189 | |||
| 2016 |
— | |||
| Thereafter |
— | |||
|
|
|
|||
| $ | 2,104 | |||
|
|
|
Substantially all of these operating lease agreements have no further contractual renewals and require the Company to pay insurance, taxes and maintenance expenses. Rent expense under cancelable and noncancelable operating lease arrangements in fiscal 2011, fiscal 2010 and fiscal 2009, reported as part of continuing operations was $1,028, $1,046 and $1,212, respectively.
| (9) | Income Taxes |
Income tax expense for fiscal 2011, fiscal 2010 and fiscal 2009, consisted of the following:
| 2011 | 2010 | 2009 | ||||||||||
| Current expense: |
||||||||||||
| Federal |
$ | 2,959 | $ | 2,439 | $ | 216 | ||||||
| State |
437 | 504 | 478 | |||||||||
|
|
|
|
|
|
|
|||||||
| 3,396 | 2,943 | 694 | ||||||||||
| Deferred expense |
932 | 2,640 | 3,495 | |||||||||
|
|
|
|
|
|
|
|||||||
| Total expense |
$ | 4,328 | $ | 5,583 | $ | 4,189 | ||||||
|
|
|
|
|
|
|
|||||||
|
The differences between income taxes computed by applying the statutory federal income tax rate (34 percent in fiscal 2011, fiscal 2010 and fiscal 2009), and income tax expense reported in the consolidated statements of income is:
|
| |||||||||||
| 2011 | 2010 | 2009 | ||||||||||
| Computed “expected” tax expense |
$ | 4,025 | $ | 5,094 | $ | 3,802 | ||||||
| State income taxes expense, net of federal income tax |
361 | 437 | 400 | |||||||||
| Other, net |
(58) | 52 | (13) | |||||||||
|
|
|
|
|
|
|
|||||||
| Total expense |
$ | 4,328 | $ | 5,583 | $ | 4,189 | ||||||
|
|
|
|
|
|
|
|||||||
51
Table of Contents
Notes to Consolidated Financial Statements
R.G. Barry Corporation and Subsidiaries
(dollar amounts in thousands, except share and per common share data)
The tax effects of temporary differences and loss carryforwards that give rise to significant portions of the deferred tax assets and deferred tax liabilities are presented below.
| 2011 | 2010 | |||||||
| Deferred tax assets: |
||||||||
| Current assets |
$ | 1,267 | $ | 923 | ||||
| Accrued expenses, including self-insurance costs, vacation costs and others |
795 | 819 | ||||||
| Pension liability |
5,663 | 7,139 | ||||||
| Acquisition intangible assets and expenses |
99 | — | ||||||
| Interest rate contract liability |
95 | — | ||||||
| Capital loss carryforward |
482 | 482 | ||||||
|
|
|
|
|
|||||
| Total deferred tax assets |
$ | 8,401 | $ | 9,363 | ||||
| Less valuation allowance |
(482) | (482) | ||||||
|
|
|
|
|
|||||
| Deferred tax assets, net |
$ | 7,919 | $ | 8,881 | ||||
| Deferred tax liabilities: |
||||||||
| Accrued pension costs |
1,509 | 159 | ||||||
| Prepaid insurance |
66 | 66 | ||||||
| Property, plant and equipment |
45 | 44 | ||||||
|
|
|
|
|
|||||
| Total deferred tax liabilities |
1,620 | 269 | ||||||
|
|
|
|
|
|||||
| Net deferred tax assets |
$ | 6,299 | $ | 8,612 | ||||
|
|
|
|
|
|||||
The net temporary differences incurred to date will reverse in future periods as the Company generates taxable earnings. The Company believes it is more likely than not that the results of future operations will generate sufficient taxable income to realize the net deferred tax assets recorded. The Company records a valuation allowance when it is more likely than not that some portion or all of the deferred tax assets will not be realized.
As a result of the Company’s disposal of its ownership of Fargeot in July 2007, the Company incurred a capital loss, and it was able to utilize part of this loss to offset prior year capital gains. The portion of the capital loss, which could not be utilized in fiscal 2008, is included as a capital loss carryforward. This capital loss deferred tax asset is subject to expiration after five years as a carryforward item, with any realization permitted only by offsetting against future capital gains generated by the Company. Approximately $482 of this capital loss remains without any immediate offsetting capital gain expected at July 2, 2011. Accordingly, all of the $482 has been reserved through a valuation allowance established at the end of fiscal 2008.
At the end of fiscal 2011, fiscal 2010 and fiscal 2009, there were approximately $0, $0, and $1,757 of net operating loss carryforwards, respectively, available for U.S. federal, state, and local income tax purposes. Due to the deferred recognition of additional paid in capital (“APIC”) created from excess tax benefits realized on the exercises and/or vesting of various equity-based compensation instruments, the net operating loss carryforwards, as measured in the Company’s tax returns, are higher than those amounts considered for book purposes. FASB ASC 718 requires recognition of excess tax benefits as APIC only when cash payments on taxes are directly impacted. This timing for federal income tax return purposes will not occur until all net operating loss carryforwards are completely used to offset U.S. federal income tax expense. Accordingly, net operating loss carryforwards, as measured for U.S. federal income tax return purposes, as of the end of fiscal 2011, fiscal 2010 and fiscal 2009, were $0, $0, and $4,600, respectively. Loss carryforwards in the U.S. are generally available for up to twenty years in the future. All net operating loss
52
Table of Contents
Notes to Consolidated Financial Statements
R.G. Barry Corporation and Subsidiaries
(dollar amounts in thousands, except share and per common share data)
carryforwards were used during fiscal 2010, and the Company recognized both deferred prior year and current year excess tax benefits as APIC during fiscal 2010.
FASB ASC 740-10 (the overall Subtopic of topic 740 on income taxes) prescribes a recognition threshold and measurement attribute for the financial statement recognition and measurement of a tax position taken or expected to be taken in a tax return and also provides guidance on derecognition, classification, interest and penalties, accounting in interim periods, disclosure and transition. The Company did not record an accrual for tax related uncertainties or unrecognized tax positions at the end of fiscal 2011 or the end of fiscal 2010. The Company does not expect a change to the reserve for uncertain tax positions within the next twelve months that would have a material impact on the consolidated financial statements.
The Company recorded no interest or penalties during or at the end of fiscal 2011, fiscal 2010 and fiscal 2009 in either its consolidated statement of income or consolidated balance sheet.
The Company files a consolidated U.S. Federal income tax return and consolidated and separate company income tax returns in various state and local jurisdictions. Generally, the Company is no longer subject to income tax examinations by federal tax authorities through the tax year ended June 28, 2008 and by state and local tax authorities for the tax years through June 30, 2007.
| (10) | Accrued Expenses |
Accrued expenses at July 2, 2011 and July 3, 2010 consisted of the following:
| 2011 | 2010 | |||||||
| Salaries and wages |
$ | 418 | $ | 3,320 | ||||
| Other taxes |
110 | 105 | ||||||
| Current pension liabilities |
685 | 675 | ||||||
| Other |
734 | 767 | ||||||
|
|
|
|
|
|||||
| $ | 1,947 | $ | 4,867 | |||||
|
|
|
|
|
|||||
| (11) | Employee Retirement Plans |
The Company maintains a tax qualified pension plan, the Associates’ Retirement Plan (“ARP”).The Company intends to fund the minimum amounts required under the Employee Retirement Income Security Act of 1974 (ERISA). The Company also sponsors a tax nonqualified pension plan, the Supplemental Retirement Plan (“SRP”), for certain officers and other key employees as designated by R.G. Barry Corporation’s Board of Directors. The SRP is unfunded, noncontributory and provides for the payment of monthly retirement benefits. Benefits are based on a formula applied to the recipients’ final average monthly compensation, reduced by a certain percentage of their social security benefits. For certain participants, the SRP provides an alternative benefit formula for years worked past the normal retirement age assumed by the SRP. Effective as of close of business on March 31, 2004, both the ARP and SRP were frozen.
The funded status of the ARP and the SRP and the accrued retirement costs, measured on July 2, 2011 and July 3, 2010, respectively, were:
53
Table of Contents
Notes to Consolidated Financial Statements
R.G. Barry Corporation and Subsidiaries
(dollar amounts in thousands, except share and per common share data)
| ARP | SRP | |||||||||||||||
|
|
|
|
|
|||||||||||||
| 2011 | 2010 | 2011 | 2010 | |||||||||||||
|
|
|
|
|
|||||||||||||
| Change in projected benefit obligation: |
||||||||||||||||
| Benefit obligation at the beginning of the year |
$ | 33,139 | $ | 29,770 | $ | 7,650 | $ | 8,272 | ||||||||
| Service cost |
— | — | — | 9 | ||||||||||||
| Interest cost |
1,606 | 1,840 | 367 | 445 | ||||||||||||
| Actuarial loss |
334 | 3,753 | 290 | 701 | ||||||||||||
| Benefits paid |
(2,301) | (2,224) | (687) | (1,418) | ||||||||||||
| Actuarial gain due to settlement |
— | — | — | (359) | ||||||||||||
|
|
|
|
|
|
|
|
|
|||||||||
| Benefit obligation at the end of the year |
$ | 32,778 | $ | 33,139 | $ | 7,620 | $ | 7,650 | ||||||||
|
|
|
|
|
|
|
|
|
|||||||||
| Change in plan assets: |
||||||||||||||||
| Fair value of plan assets at the beginning of the year |
$ | 21,988 | $ | 17,659 | $ | — | $ | — | ||||||||
| Actual return on plan assets |
5,608 | 2,901 | — | — | ||||||||||||
| Contributions |
4,155 | 3,856 | 687 | 1,418 | ||||||||||||
| Expenses |
(212) | (204) | — | — | ||||||||||||
| Benefits paid |
(2,301) | (2,224) | (687) | (1,418) | ||||||||||||
|
|
|
|
|
|
|
|
|
|||||||||
| Fair value of plan assets at end of the year |
$ | 29,238 | $ | 21,988 | $ | — | $ | — | ||||||||
|
|
|
|
|
|
|
|
|
|||||||||
| Funded status at end of the year |
$ | (3,540) | $ | (11,151) | $ | (7,620) | $ | (7,650) | ||||||||
|
|
|
|
|
|
|
|
|
|||||||||
| Noncurrent liabilities |
||||||||||||||||
| Current liabilities |
$ | — | $ | — | $ | (685) | $ | (675) | ||||||||
| Noncurrent liabilities |
(3,540) | (11,151) | (6,935) | (6,975) | ||||||||||||
|
|
|
|
|
|
|
|
|
|||||||||
| Net pension liability at end of year |
$ | (3,540) | $ | (11,151) | $ | (7,620) | $ | (7,650) | ||||||||
|
|
|
|
|
|
|
|
|
|||||||||
| Amounts recognized in accumulated other comprehensive loss-pretax |
||||||||||||||||
| Prior service costs |
$ | — | $ | — | $ | 13 | $ | 55 | ||||||||
| Net actuarial loss |
13,187 | 17,355 | 2,039 | 1,819 | ||||||||||||
|
|
|
|
|
|
|
|
|
|||||||||
| Balance in accumulated other comprehensive loss at end of year-pretax |
$ | 13,187 | $ | 17,355 | $ | 2,052 | $ | 1,874 | ||||||||
|
|
|
|
|
|
|
|
|
|||||||||
| ARP | SRP | |||||||||||||||
|
|
|
|
|
|||||||||||||
| 2011 | 2010 | 2011 | 2010 | |||||||||||||
|
|
|
|
|
|||||||||||||
| Other changes in plan assets and benefit obligations recognized in accumulated comprehensive loss | ||||||||||||||||
| Net actuarial (gain) loss |
$ | (3,019) | $ | 3,028 | $ | 290 | $ | 157 | ||||||||
| Amortization of: |
||||||||||||||||
| Prior service costs |
— | — | (42) | (42) | ||||||||||||
| Net actuarial losses |
(1,149) | (577) | (70) | (75) | ||||||||||||
|
|
|
|
|
|
|
|
|
|||||||||
| Total recognized in comprehensive (income) loss |
$ | (4,168) | $ | 2,451 | $ | 178 | $ | 40 | ||||||||
|
|
|
|
|
|
|
|
|
|||||||||
54
Table of Contents
Notes to Consolidated Financial Statements
R.G. Barry Corporation and Subsidiaries
(dollar amounts in thousands, except share and per common share data)
Actuarial gains and losses primarily reflect the differences between expected and actual rates of return on pension plan assets, demographic differences between actual and projected mortality and other factors, and the effect of changes in discount rate on the measure of pension liabilities at the end of each fiscal year. The estimated net actuarial loss and prior service cost for the defined benefit plans that will be amortized from accumulated other comprehensive income into net periodic benefit cost during fiscal 2012 are $1,378 and $13, respectively.
At July 2, 2011, expected benefit payments to plan participants in the ARP and the SRP for each of the next five years and the five-year period thereafter in the aggregate are:
| ARP | SRP | |||
| 2012 |
$ 2,351 | $ 685 | ||
| 2013 |
2,363 | 683 | ||
| 2014 |
2,351 | 713 | ||
| 2015 |
2,374 | 701 | ||
| 2016 |
2,365 | 623 | ||
| 2017-2021 |
11,771 | 3,107 |
| Weighted average assumptions used to determine net costs for both the ARP and the SRP: |
2011 | 2010 | 2009 | |||||||||
| Discount rate |
5.02% | 6.42% | 6.69% | |||||||||
| Rate of compensation increase |
— | 4.00% | 4.00% | |||||||||
| Expected return on plan assets |
7.90% | 8.25% | 8.50% | |||||||||
| Components of Net Periodic Benefit Cost: | ||||||||||||
| Service cost |
$ | — | $ | 9 | $ | 45 | ||||||
| Interest cost |
1,974 | 2,285 | 2,420 | |||||||||
| Expected return on plan assets |
(2,043) | (1,973) | (2,204) | |||||||||
| Net amortization |
1,261 | 693 | 285 | |||||||||
| Settlement expense |
— | 185 | — | |||||||||
|
|
|
|
|
|
|
|||||||
| Total pension expense |
$ | 1,192 | $ | 1,199 | $ | 546 | ||||||
|
|
|
|
|
|
|
|||||||
| Weighted average assumptions used to determine benefit obligations: |
2011 | 2010 | 2009 | |||||||||
| Discount rate |
5.20% | 5.02% | 6.42% | |||||||||
| Rate of compensation increase |
— | — | 4.00% | |||||||||
The ARP is funded on a periodic basis as required under ERISA/IRS guidelines. The general principles guiding investment of pension plan assets are those embodied under ERISA. These principles include discharging the Company’s investment responsibilities for the exclusive benefit of plan participants and in accordance with the “prudent expert” standards and other ERISA rules and regulations. Investment objectives for the Company’s pension plan assets are to optimize the long-term return on plan assets while maintaining an acceptable level of risk, diversify assets among asset classes and investment styles and maintain a long-term focus. The plan asset allocation shown below is consistent with the Company’s investment policy objectives and reflects
55
Table of Contents
Notes to Consolidated Financial Statements
R.G. Barry Corporation and Subsidiaries
(dollar amounts in thousands, except share and per common share data)
the ongoing transition of the asset portfolio from an equity-based investment portfolio to a debt-security investment portfolio. This change over time is designed to better match assets and anticipated cash outflows with the underlying future expected payment streams associated with the Company’s ARP obligation. With the assistance of a consulting firm, the plan fiduciaries are responsible for selecting investment managers, setting asset allocation targets and monitoring asset allocation and investment performance.
The qualified plan assets invested as of the measurement date for fiscal 2011, fiscal 2010 and fiscal 2009 were as follows:
| 2011 | 2010 | 2009 | ||||||||||
| Cash and equivalents |
3% | 5% | 2% | |||||||||
| Domestic equities |
23% | 42% | 48% | |||||||||
| Domestic fixed income securities |
56% | 20% | 6% | |||||||||
| Foreign equities |
18% | 22% | 24% | |||||||||
| Hedge funds |
0% | 11% | 20% | |||||||||
|
|
|
|
|
|
|
|||||||
| Total pension plan assets invested |
100% | 100% | 100% | |||||||||
|
|
|
|
|
|
|
|||||||
The table below highlights assets held in trust in the ARP, and the fair value categories applicable to the various investments held at July 2, 2011:
| Fair Value Measurements at Reporting Date Using: | ||||||||||||||||
| Quoted Prices in Active Markets for Identical Assets |
Significant Other Observable Inputs |
Significant Unobservable Inputs |
||||||||||||||
| Carrying Amount |
(Level 1) | (Level 2) | (Level 3) | |||||||||||||
| Assets: |
||||||||||||||||
| Cash and equivalents |
$ | 864 | $ | — | $ | — | $ | — | ||||||||
| Domestic equities |
6,679 | 6,679 | — | — | ||||||||||||
| Domestic fixed income securities |
16,415 | 16,415 | — | — | ||||||||||||
| Foreign equities |
5,280 | 5,280 | — | — | ||||||||||||
|
|
|
|
|
|
|
|
|
|||||||||
| Total pension plan assets |
$ | 29,238 | $ | 28,374 | $ | — | $ | — | ||||||||
|
|
|
|
|
|
|
|
|
|||||||||
The table below highlights assets held in trust in the ARP, and the fair value categories applicable to the various investments held at July 3, 2010:
56
Table of Contents
Notes to Consolidated Financial Statements
R.G. Barry Corporation and Subsidiaries
(dollar amounts in thousands, except share and per common share data)
| Fair Value Measurements at Reporting Date Using: | ||||||||||||||||
| Quoted Prices in Active Markets for Identical Assets |
Significant Other Observable Inputs |
Significant Unobservable Inputs |
||||||||||||||
| Carrying Amount |
(Level 1) | (Level 2) | (Level 3) | |||||||||||||
| Assets: |
||||||||||||||||
| Cash and equivalents |
$ | 1,116 | $ | — | $ | — | $ | — | ||||||||
| Domestic equities |
9,199 | 9,199 | — | — | ||||||||||||
| Domestic fixed income securities |
4,364 | 4,364 | — | — | ||||||||||||
| Foreign equities |
4,851 | 4,851 | — | — | ||||||||||||
| Hedge funds |
2,458 | — | 1,347 | 1,111 | ||||||||||||
|
|
|
|
|
|
|
|
|
|||||||||
| Total pension plan assets |
$ | 21,988 | $ | 18,414 | $ | 1,347 | $ | 1,111 | ||||||||
|
|
|
|
|
|
|
|
|
|||||||||
Our level 3 hedge fund investment existing at July 3, 2010 did not have quotes on an active market or exchange and this investment was a master hedge fund that invests in a variety of underlying individual hedge funds that are not quoted on an active market or exchange. Net asset values were determined by this master hedge fund on a monthly basis by reference to net asset values computed and determined by the individual hedge funds it invests in. This hedge fund investment was completely liquidated during fiscal 2011 and the funds were re-invested in other investment categories.
| Level 3
pension investment reconciliation | ||
| Balance at July 3, 2010 |
$ 1,111 | |
| Realized gain |
63 | |
| Unrealized gain (loss) relating to instrument still held at July 2, 2011 |
— | |
| Purchases, sales and settlements, net |
(1,174) | |
| Transfers in/out of category level 3 |
— | |
|
| ||
| Balance at July 2, 2011 |
$ — | |
|
|
The expected return on plan assets used in the pension computations for the qualified ARP is based on management’s best judgment of future anticipated performance of those invested assets based on past long-term experience and judgment on how future long-term performance will occur.
57
Table of Contents
Notes to Consolidated Financial Statements
R.G. Barry Corporation and Subsidiaries
(dollar amounts in thousands, except share and per common share data)
The Company’s SRP is unfunded and payments, as required, are made when due from the Company’s general funds. In fiscal 2012, the Company anticipates total payments of $1,769 related to its SRP and ARP.
The discount rate was determined based on an analysis of interest rates for high-quality, long-term corporate debt at each measurement date. In order to appropriately match the bond maturities with expected future cash payments, the Company utilizes differing bond portfolios to estimate the discount rates for the defined benefit plans. The weighted average discount rate used to determine the defined benefit plans obligation as of the balance sheet date is the rate in effect at the measurement date. The same rate is also used to determine the defined benefit plans expense for the following fiscal year.
During fiscal 2010, the Company made a lump sum payment of $748 to a former executive upon his retirement as full settlement of his SRP benefit. Based on interest rates existing at the date of settlement, the Company recognized a settlement loss of $185 in pension expense and an additional other comprehensive loss adjustment, net of tax, of $99 based on a re-measurement of remaining SRP liabilities.
The Company sponsors a 401(k) plan for all its eligible salaried and nonsalaried employees. Effective January 1, 2005, the Company adopted a 3% non-contributory Safe Harbor 401 provision for all eligible plan participants. The Company’s contributions in cash to the 401(k) plan were $267, $375 and $278 for fiscal 2011, fiscal 2010 and fiscal 2009, respectively.
| (12) | Shareholders’ Equity |
As of July 2, 2011, there were approximately 137 employees and seven non-employee directors who were eligible to participate in the 2005 Plan.
The 2005 Plan authorizes the issuance of 1,000,000 common shares, plus:
| q | the number of common shares that were authorized to be the subject of awards under the 1997 Incentive Stock Plan (the “1997 Plan”) and the 2002 Stock Incentive Plan (the “2002 Plan”), but which had not yet been granted as of May 20, 2005; and |
| q | any common shares underlying awards granted under the 1997 Plan and the 2002 Plan, which are forfeited after May 20, 2005. |
At July 2, 2011, the number of common shares available for grant pursuant to the 2005 Plan was 453,100.
The selection of participants and the nature and size of awards granted under the 2005 Plan is within the discretion of the Compensation Committee of R.G. Barry Corporation’s Board of Directors (the “Committee”), in the case of grants to employees of the Company or the full Board of Directors, in the case of grants to non-employee directors of R.G. Barry Corporation. The 2005 Plan provides for the following types of awards, each as defined in the 2005 Plan:
| q | nonqualified stock options (“NQs”) and incentive stock options (“ISOs”) that qualify under Section 422 of the Internal Revenue Code of 1986, as amended; |
| q | stock appreciation rights; |
| q | restricted stock and restricted stock units (“RSUs”); and |
| q | stock grants, stock units and cash awards. |
58
Table of Contents
Notes to Consolidated Financial Statements
R.G. Barry Corporation and Subsidiaries
(dollar amounts in thousands, except share and per common share data)
Grants of restricted stock, RSUs, stock units and cash awards may, as determined by the Committee or the full Board of Directors, as appropriate, also be performance-based awards, as defined in the 2005 Plan.
If an award granted under the 2005 Plan is forfeited, cancelled, terminated, relinquished, exchanged or otherwise settled without the issuance of common shares or the payment of cash equal to the difference between the fair market value of the award and any exercise price, the common shares associated with that award will be available for future grants. The maximum number of common shares with respect to which awards may be issued under the 2005 Plan to any individual during any calendar year is 200,000. The common shares issued pursuant to the 2005 Plan may consist of authorized and unissued common shares or treasury shares.
Prior to the 2005 Plan, the Company had various equity-based compensation plans, under which ISOs and NQs had been granted, some of which remain outstanding. All outstanding ISOs and NQs are currently exercisable for periods of up to ten years from the date of grant at exercise prices of not less than the fair market value of the underlying common shares at the grant date.
FASB ASC 718 (the Stock Compensation topic) requires the recognition of the fair value of stock-based compensation in the results of operations. The Company recorded, as part of selling, general and administrative expenses, $1,186 of stock-based compensation expense for fiscal 2011. All of the total stock-based compensation expense was related to ISOs, NQs and RSUs granted after the Company adopted FASB ASC 718.
The total unrecognized compensation cost of RSUs granted but not yet vested as of July 2, 2011 was approximately $1,905, all of which related to the compensation cost for stock-based awards issued after the adoption of FASB ASC 718. The Company expects to recognize the total remaining compensation cost over the weighted-average period of approximately two years.
The Company granted 12,300 non-qualified stock options to certain members of management during fiscal 2011. The fair value of these stock options, based on the Black-Scholes option-pricing model, calculated at the grant dates, was between $3.07 and $3.67 per share, or $43 in total.
Total unrecognized compensation cost of stock options granted, but not yet vested, as of July 2, 2011 was $36. This amount is expected to be recognized over the remaining pro-rata vesting period of three years associated with these stock option grants. The following assumptions were used to value these stock options:
| Dividend yield |
2.6% | |||
| Expected volatility |
48.4% | |||
| Risk-free interest rate |
1.4% | |||
| Expected term |
3 years |
The risk-free interest rate was based on the United States Treasury daily yield curve rates for the expected term of the stock options. The expected volatility was based on the historical volatility of the Company’s common shares.
Plan activity for grants under the 2005 Plan and the other equity-based compensation plans under which ISOs and NQs have been granted was as follows:
59
Table of Contents
Notes to Consolidated Financial Statements
R.G. Barry Corporation and Subsidiaries
(dollar amounts in thousands, except share and per common share data)
| Number of common shares subject to ISOs |
Number of common shares subject to NQs |
Weighted- average exercise price |
||||||||||
| Outstanding at June 28, 2008 |
212,600 | 238,200 | $ | 5.23 | ||||||||
| Granted |
— | — | — | |||||||||
| Exercised |
(94,100) | (36,200) | 3.74 | |||||||||
| Expired/Cancelled |
(1,500) | (55,800) | 8.38 | |||||||||
|
|
|
|
|
|
|
|||||||
| Outstanding at June 27, 2009 |
117,000 | 146,200 | $ | 5.21 | ||||||||
| Granted |
— | — | — | |||||||||
| Exercised |
(81,000) | (40,700) | 4.03 | |||||||||
| Expired/Cancelled |
— | — | — | |||||||||
|
|
|
|
|
|
|
|||||||
| Outstanding at July 3, 2010 |
36,000 | 105,500 | $ | 6.11 | ||||||||
| Granted |
— | 12,300 | 11.36 | |||||||||
| Exercised |
(13,300) | (5,000) | 5.85 | |||||||||
| Expired/Cancelled |
— | — | — | |||||||||
|
|
|
|
|
|
|
|||||||
| Outstanding at July 2, 2011 |
22,700 | 112,800 | $ | 6.63 | ||||||||
|
|
|
|
|
|
|
|||||||
| Options exercisable at July 2, 2011 |
22,700 | 100,500 | ||||||||||
|
|
|
|
|
|||||||||
| Options outstanding | Options exercisable | |||||||||||||
| Range of |
Number outstanding at July 2, 2011 |
Weighted- average remaining contractual life (years) |
Weighted- average exercise price |
Number exercisable at July 2, 2011 |
Weighted- average exercise price | |||||||||
| $ 2.51 – 5.00 |
14,000 | 1.98 | $ 3.96 | 14,000 | $ 3.96 | |||||||||
| 5.01 – 10.00 |
109,200 | 1.56 | 6.43 | 109,200 | 6.43 | |||||||||
| 10.01 – 15.00 |
12,300 | 9.65 | 11.36 | — | — | |||||||||
|
|
|
|
|
|||||||||||
| 135,500 | 123,200 | |||||||||||||
|
|
|
|
|
|||||||||||
The intrinsic values of the stock options exercisable and outstanding at the end of fiscal 2011 were $898 and $758, respectively. The intrinsic value of stock options exercised during fiscal 2011 was $66.
At the end of fiscal 2011, fiscal 2010 and fiscal 2009, the stock options outstanding under these equity-based compensation plans were held by 9, 8 and 21 individuals, respectively, and had expiration dates ranging from 2012 to 2021.
Consistent with its non-employee directors compensation policy, the Company also awarded an aggregate of 25,100 common shares (i.e., unrestricted stock) with immediate vesting to the non-employee directors of R.G. Barry Corporation during the second quarter of fiscal 2011. The aggregate fair value of this award of common shares was $257 based on the market price of the
60
Table of Contents
Notes to Consolidated Financial Statements
R.G. Barry Corporation and Subsidiaries
(dollar amounts in thousands, except share and per common share data)
Company’s common shares at the date of grant, and was included as part of the total stock-based compensation expense cited above.
During fiscal 2011, the Company granted 124,500 RSUs to members of its senior and other management. Upon vesting, the RSUs will be settled in an equivalent number of common shares. The RSUs awarded to the members of senior and other management will vest in full on the fifth anniversary of the date of the award, although 20% of the RSUs may vest on each of the first four anniversaries of the date of the award if the Company meets certain financial performance goals. The intrinsic value of RSUs that vested during fiscal 2011 was $1,040.
At the end of fiscal 2011, fiscal 2010 and fiscal 2009, RSUs outstanding under these equity-based compensation plans were held by 26, 38 and 31 employees, respectively, and had vesting dates ranging from 2012 to 2017. These RSU vesting dates were subject to partial acceleration on an annual basis if certain Company financial performance objectives were met for a fiscal year.
The following is a summary of the status of the Company’s RSUs as of July 2, 2011, July 3, 2010 and June 27, 2009 and activity during the fiscal year then ended:
| 2011 | 2010 | 2009 | ||||||||||||
| RSUs | Weighted average grant- date fair value |
RSUs | Weighted average grant- date fair value |
RSUs | Weighted average grant- date fair value | |||||||||
| Unvested RSUs at beginning of the year |
314,000 | $ 7.49 | 319,500 | $ 6.86 | 190,900 | $ 7.94 | ||||||||
| Granted |
124,500 | 9.92 | 145,400 | 8.08 | 230,600 | 6.27 | ||||||||
| Vested |
(94,600) | 8.05 | (119,000) | 6.56 | (81,300) | 7.99 | ||||||||
| Forfeited/Cancelled |
(24,000) | 7.80 | (31,900) | 7.25 | (20,700) | 7.69 | ||||||||
|
|
|
|
|
|
|
| ||||||||
| Unvested RSUs at the end of the year |
319,900 | $ 8.24 | 314,000 | $ 7.49 | 319,500 | $ 6.86 | ||||||||
|
|
|
|
|
|
|
| ||||||||
61
Table of Contents
Notes to Consolidated Financial Statements
R.G. Barry Corporation and Subsidiaries
(dollar amounts in thousands, except share and per common share data)
| (13) | Net Earnings per Common Share |
The following table presents a reconciliation of the denominator used for each period in computing basic and diluted earnings per common share, with common shares in the table represented in thousands:
| 2011 | 2010 | 2009 | ||||||||||
| Numerator: |
||||||||||||
| Net earnings |
$ | 7,510 | $ | 9,400 | $ | 6,992 | ||||||
|
|
|
|
|
|
|
|||||||
| Denominator: |
||||||||||||
| Weighted-average common shares outstanding |
11,097 | 10,893 | 10,633 | |||||||||
| Effect of potentially dilutive securities: employee stock options and RSUs |
130 | 143 | 104 | |||||||||
|
|
|
|
|
|
|
|||||||
| Weighted-average common shares outstanding, assuming dilution |
11,227 | 11,036 | 10,737 | |||||||||
|
|
|
|
|
|
|
|||||||
| Basic net earnings per common share |
$ | 0.68 | $ | 0.86 | $ | 0.66 | ||||||
|
|
|
|
|
|
|
|||||||
| Diluted net earnings per common share |
$ | 0.67 | $ | 0.85 | $ | 0.65 | ||||||
|
|
|
|
|
|
|
|||||||
The Company excludes stock options to purchase common shares from the calculation of diluted earnings per common share when they are anti-dilutive, measured using the average market price of the underlying common shares during that fiscal year. Stock options excluded from the computation of diluted net earnings per common share for fiscal 2011, fiscal 2010 and fiscal 2009 were 5,000, zero, and 105,000 respectively.
| (14) | Preferred Share Purchase Rights |
On May 1, 2009, the Board of Directors of R.G. Barry Corporation declared a dividend distribution of one Preferred Share Purchase Right (“Right”) for each outstanding common share to shareholders of record on May 15, 2009. Under certain conditions, each Right may be exercised to purchase from R.G. Barry Corporation a unit consisting of one one-hundredth of a share (a “Unit”) of Series II Junior Participating Class A Preferred Shares, par value $1 per share, at an initial exercise price of $25 per Unit, subject to adjustment. The Rights initially will be attached to R.G. Barry Corporation’s common shares. The Rights will separate from the common shares and a Distribution Date will occur upon the earlier of (a) 10 business days after a public announcement that a person or group of affiliated or associated persons has acquired, or obtained the right to acquire, beneficial ownership of 15% or more of R.G. Barry Corporation’s outstanding common shares (“Share Acquisition Date”), other than as a result of repurchases of common shares by R.G. Barry Corporation or certain inadvertent actions by institutional or certain other shareholders, or (b) 10 business days (or such later date as the Board of Directors of R.G. Barry Corporation shall determine) after the commencement of a tender offer or exchange offer that would result in a person or group beneficially owning 15% or more of R.G. Barry Corporation’s outstanding common shares. The Rights are not exercisable until the Distribution Date.
In the event that any person becomes the beneficial owner of 15% or more of the then outstanding common shares of R.G. Barry Corporation, each holder of a Right will thereafter be entitled to receive, upon exercise, common shares of R.G. Barry Corporation (or in certain circumstances, cash, property or other securities of R.G. Barry Corporation) having a market value equal to two times the exercise price of the Right. In the event that, at any time following the Share Acquisition
62
Table of Contents
Notes to Consolidated Financial Statements
R.G. Barry Corporation and Subsidiaries
(dollar amounts in thousands, except share and per common share data)
Date, R.G. Barry Corporation is acquired in a merger or other business combination transaction in which R.G. Barry Corporation is not the surviving corporation or 50% or more of the Company’s consolidated assets, cash flow or earning power is sold or transferred, the holder of a Right will be entitled to receive, upon exercise of the Right, the number of shares of common stock of the acquiring company which at the time of such transaction will have a market value equal to two times the exercise price of the Right.
The Rights, which do not have any voting or dividend rights, expire on May 1, 2014, and may be redeemed by R.G. Barry Corporation at a price of $0.01 per Right at any time until 10 business days following the Share Acquisition Date.
Each Class A Preferred Share entitles the holder thereof to one-tenth of one vote, while Class B Preferred Shares, should they become authorized for issuance by action of R.G. Barry Corporation’s Board of Directors, entitle the holders thereof to ten votes. The preferred shares are entitled to a preference in liquidation. None of the preferred shares have been issued.
| (15) | Acquisitions |
Acquisition of assets of Foot Petals LLC
On January 27, 2011, the Company purchased, through a wholly-owned subsidiary, Foot Petals, Inc. (“Foot Petals”), selected assets including accounts receivable, finished goods inventory, trade names and various other assets, assumed certain liabilities and paid $14,000 in cash in its acquisition of the business of Foot Petals, LLC, a privately-owned Long Beach, California-based developer and marketer of foot and shoe care products. Management believes the product lines, customer bases and core values of the Company and this acquired business have numerous synergies. As a result, this acquisition is expected to be an integral part of the Company’s long-range vision and strategic growth plans. Goodwill of $5,420 arising from this acquisition consists of the value of synergies and economies of scale expected from combining the operations of the Company and Foot Petals. All of the goodwill was assigned to the Company’s Accessories segment and will be deductible for tax purposes.
The following table summarizes the consideration paid for certain assets of Foot Petals, LLC and the amounts of the assets acquired and liabilities recognized at the acquisition date.
| At January 27, 2011 | ||||
| Fair value of total consideration transferred-cash |
$ | 14,000 | ||
|
|
|
|||
| Acquisition-related costs (included in selling, general and administrative expenses) |
$ | 869 | ||
|
|
|
|||
| Recognized amounts of identifiable assets acquired and liabilities assumed |
||||
| Accounts receivable |
$ | 1,472 | ||
| Inventory |
648 | |||
| Property, plant and equipment |
63 | |||
| Other assets |
27 | |||
| Identifiable intangible assets |
6,800 | |||
| Accounts payable and accrued expenses |
(430 | ) | ||
| Goodwill |
5,420 | |||
|
|
|
|||
| $ | 14,000 | |||
|
|
|
|||
63
Table of Contents
Notes to Consolidated Financial Statements
R.G. Barry Corporation and Subsidiaries
(dollar amounts in thousands, except share and per common share data)
Foot Petals’ net sales and net earnings were not significant in respect of the Company’s consolidated statement of income for fiscal 2011. Any pro forma net sales and net earnings of the combined entity, had the acquisition date been July 4, 2010, or June 28, 2009, were likewise not significant to any combined view of pro forma Company consolidated statements of income for fiscal 2011 and fiscal 2010, respectively.
Acquisition of assets of baggallini, Inc.
On March 31, 2011, the Company purchased, through a wholly-owned subsidiary, Baggallini, Inc. (“Baggallini”), selected assets including accounts receivable, finished goods inventory, trade names and various other assets, assumed certain liabilities and paid $33,750 in cash in its acquisition of the business of baggallini, inc. Based on certain minimum thresholds for inventory, customer accounts receivable and trade accounts payable as compared to the value of those assets and liabilities existing at the time of closing under the terms of the purchase agreement, the Company was obligated to make an additional payment of $802 to the sellers of baggallini, Inc. This obligation was reported within accounts payable at July 2, 2011 and was paid subsequent to that date.
baggallini, Inc. was a privately-owned Portland, Oregon-based developer and marketer of handbags, tote bags and other travel accessories to meet the needs of travelers. The product lines, customer bases and core values acquired with this business offer the opportunity to both broaden and diversify the Company’s business base and reach, and provide numerous synergies. This acquisition is expected to be an integral part of the Company’s long-range vision and strategic growth plans.
Goodwill of $10,089 arising from the acquisition consists of the value of synergies and economies of scale expected between the operations of the Company and Baggallini. All of the goodwill was assigned to the Company’s Accessories segment and is expected to be deductible for tax purposes.
The following table summarizes the consideration paid for certain assets of baggallini, Inc. and the amounts of the assets acquired and liabilities recognized at the acquisition date.
| At March 31, 2011 | ||||
| Consideration |
||||
| Cash |
$ | 33,750 | ||
| Additional consideration owed to seller |
802 | |||
|
|
|
|||
| Fair value of total consideration |
$ | 34,552 | ||
|
|
|
|||
| Acquisition-related costs (included in selling, general and administrative expenses) |
$ | 182 | ||
|
|
|
|||
| Recognized amounts of identifiable assets acquired and liabilities assumed |
||||
| Accounts receivable |
$ | 2,541 | ||
| Inventory |
4,277 | |||
| Property, plant and equipment |
151 | |||
| Identifiable intangible assets |
18,000 | |||
| Other assets |
11 | |||
| Accounts payable and accrued expenses |
(517 | ) | ||
| Goodwill |
10,089 | |||
|
|
|
|||
| $ | 34,552 | |||
|
|
|
|||
64
Table of Contents
Notes to Consolidated Financial Statements
R.G. Barry Corporation and Subsidiaries
(dollar amounts in thousands, except share and per common share data)
Net sales and net earnings for Baggallini and unaudited supplemental pro forma net sales and net earnings for the Company as a whole assuming the Baggallini acquisition occurred on the first day of fiscal 2010 were:
| Net Sales |
Net Earnings |
Diluted Net per share |
||||||||||
| Actual Baggallini results for fiscal 2011 (March 31, 2011 to July 2, 2011) |
$ | 5,063 | $ | 815 | $ | 0.07 | ||||||
| Supplemental pro forma for fiscal 2011 |
143,117 | 9,497 | 0.85 | |||||||||
| Supplemental pro forma for fiscal 2010 |
138,990 | 11,535 | 1.05 | |||||||||
| (16) | Related-party Transactions |
Under an existing agreement, the Company is obligated for up to two years after the death of the chairman to purchase, if the estate elects to sell, up to $4,000 of the Company’s common shares owned by the chairman at the time of his death, at their fair market value. For a period of 24 months following the chairman’s death, the Company has a right of first refusal to purchase any common shares owned by the chairman at the time of his death if his estate elects to sell such common shares and has the right to purchase such common shares on the same terms and conditions as the estate proposes to sell such common shares to a third party. To fund its potential obligation to purchase such common shares, the Company maintains two insurance policies on the life of the chairman. The cumulative cash surrender value of the policies approximates $2,591, which is included in other assets in the accompanying consolidated balance sheets.
The Company and its co-founder, the mother of the chairman, entered into an agreement in August 2005 whereby she transferred all of her product designs and patent rights to the Company and released all unpaid claims that would have accrued under a previous agreement. Under the August 2005 agreement, the Company was obligated to make 24 quarterly payments of $25 through the last business day in April 2011. As of July 3, 2010, the Company reported the remaining $97 liability under this agreement as current installments of long-term debt and this remaining balance was paid during fiscal 2011.
| (17) | Segment Reporting |
FASB ASC 280 (the Segment Reporting topic) establishes standards for the manner in which public enterprises report information about operating segments, their products and the geographic areas where they operate.
The Company primarily markets footwear and accessories products sold predominantly in North America and operates with two reportable segments, which include: (1) footwear that encompasses primarily slippers, sandals, hybrid and fashion footwear, slipper socks and hosiery; and (2) accessories with products including shoe and foot care products, handbags, tote bags and other travel accessories. The accounting policies of the reportable segments are the same, except that the disaggregated information has been prepared using certain management reports, which by their very nature require estimates. While corporate expenses directly associated with operational support provided to the Accessories segment have been charged to that segment, certain items, including acquisition-related costs of $1,051, were reported within administrative functions contained in the Footwear segment and were not allocated. Operating profit or loss is the primary indicator of financial performance used by management, since it encompasses sales, gross profit and supporting selling, general and administrative expenses.
65
Table of Contents
Notes to Consolidated Financial Statements
R.G. Barry Corporation and Subsidiaries
(dollar amounts in thousands, except share and per common share data)
| 2011 |
Footwear | Accessories | Total | |||||||||
| Net sales |
$ | 118,844 | $ | 10,724 | $ | 129,568 | ||||||
| Gross profit |
41,776 | 6,387 | 48,163 | |||||||||
| Depreciation and amortization |
1,351 | 540 | 1,891 | |||||||||
| Operating profit |
8,435 | 3,245 | 11,680 | |||||||||
| Total assets |
63,473 | 52,506 | 115,979 | |||||||||
During fiscal 2010 and fiscal 2009, the Company operated with a single segment representing its footwear business.
Net sales as reported in the consolidated statements of income relate primarily to markets in the United States of America. At July 2, 2011 and July 3, 2010, substantially all of the Company’s long-lived assets were located in the United States of America.
For fiscal 2011, fiscal 2010 and fiscal 2009, one customer accounted for approximately 32%, 35% and 38%, respectively, of the Company’s consolidated net sales. A second customer accounted for 10% and 10% of the Company’s consolidated net sales for fiscal 2010 and fiscal 2009, respectively. All significant customers noted above were in the Footwear segment.
| (18) | Contingent Liabilities |
The Company is from time to time involved in claims and litigation considered normal in the course of its business. While it is not feasible to predict the ultimate outcome, in the opinion of management, the resolution of pending legal proceedings is not expected to have a material effect on the Company’s financial position, results of operations or cash flows.
66
Table of Contents
Notes to Consolidated Financial Statements
R.G. Barry Corporation and Subsidiaries
(dollar amounts in thousands, except share and per common share data)
| (19) | Accounts Receivable Reserves |
| Description |
Balance at Beginning of Year |
Current Charges to Expenses |
Other Adjustments |
Deductions | Balance at End of Year |
|||||||||||||||
| Allowance for doubtful accounts: |
||||||||||||||||||||
| Period ended: |
||||||||||||||||||||
| 7/02/2011 |
$ | 228 | $ | 28 | $ | — | $ | 27 | $ | 229 | ||||||||||
| 7/03/2010 |
427 | 71 | — | 270 | 228 | |||||||||||||||
| 6/27/2009 |
200 | 464 | — | 237 | 427 | |||||||||||||||
| Returns Allowance: |
||||||||||||||||||||
| Period ended: |
||||||||||||||||||||
| 7/02/2011 |
$ | 1,431 | $ | 3,711 | $ | — | $ | 4,054 | $ | 1,088 | ||||||||||
| 7/03/2010 |
1,075 | 2,884 | — | 2,528 | 1,431 | |||||||||||||||
| 6/27/2009 |
151 | 1,418 | — | 494 | 1,075 | |||||||||||||||
| Promotions Allowance: |
||||||||||||||||||||
| Period ended: |
||||||||||||||||||||
| 7/02/2011 |
$ | 1,787 | $ | 13,828 | $ | (935 | ) | $ | 12,475 | $ | 2,205 | |||||||||
| 7/03/2010 |
1,223 | 11,170 | (572 | ) | 10,034 | 1,787 | ||||||||||||||
| 6/27/2009 |
1,534 | 9,879 | (484 | ) | 9,706 | 1,223 | ||||||||||||||
The amounts under the “Other Adjustments” column in the table above reflects the difference between estimates made at the end of the prior fiscal year and actual claims processed during the applicable fiscal year.
67
Table of Contents
| Quarterly Financial Data (Unaudited) (in thousands, except per common share data) |
||||||||||||||||
| Fiscal 2011 | First | Second | Third | Fourth | ||||||||||||
| Net sales |
$ | 36,269 | $ | 49,660 | $ | 20,113 | $ | 23,526 | ||||||||
| Gross profit |
14,196 | 17,229 | 7,930 | 8,808 | ||||||||||||
| Net earnings (loss) |
4,103 | 4,312 | (42 | ) | (863 | ) | ||||||||||
| Basic net earnings (loss) per common share |
0.37 | 0.39 | 0.00 | (0.08 | ) | |||||||||||
| Diluted net earnings (loss) per common share |
0.37 | 0.38 | 0.00 | (0.08 | ) | |||||||||||
| Weighted-average common shares outstanding: |
||||||||||||||||
| Basic |
11,044 | 11,090 | 11,123 | 11,132 | ||||||||||||
| Diluted |
11,151 | 11,220 | 11,123 | 11,132 | ||||||||||||
| Fiscal 2010 | First | Second | Third | Fourth | ||||||||||||
| Net sales |
$ | 29,449 | $ | 55,574 | $ | 22,212 | $ | 16,552 | ||||||||
| Gross profit |
12,291 | 23,962 | 8,963 | 6,143 | ||||||||||||
| Net earnings (loss) |
2,265 | 8,226 | 539 | (1,630 | ) | |||||||||||
| Basic net earnings (loss) per common share |
0.21 | 0.76 | 0.05 | (0.15 | ) | |||||||||||
| Diluted net earnings (loss) per common share |
0.21 | 0.74 | 0.05 | (0.15 | ) | |||||||||||
| Weighted-average common shares outstanding: |
||||||||||||||||
| Basic |
10,803 | 10,857 | 10,914 | 10,986 | ||||||||||||
| Diluted |
10,948 | 11,042 | 11,112 | 11,154 | ||||||||||||
The above information is a summary of unaudited quarterly results of operations of the Company for fiscal 2011 and fiscal 2010. The sum of the quarterly net earnings (loss) per common share data in the table above may not equal the results for the applicable fiscal year due to rounding and, where applicable, the impact of dilutive securities on the annual versus the quarterly net earnings (loss) per common share calculations.
The Company acquired business assets and operations of Foot Petals on January 27, 2011 and business assets and operations of Baggallini on March 31, 2011. Results for both acquired businesses were included in the results above from the dates of the respective acquisitions.
Item 9. Changes in and Disagreements With Accountants on Accounting and Financial Disclosure.
None.
Item 9A. — Controls and Procedures
Evaluation of Disclosure Controls and Procedures
We maintain disclosure controls and procedures [as defined in Rules 13a-15(e) and 15d-15(e) under the Securities Exchange Act of 1934, as amended (the “Exchange Act”)] that are designed to provide reasonable assurance that information required to be disclosed in the reports that we file or submit under
68
Table of Contents
the Exchange Act is recorded, processed, summarized and reported within the time periods specified in the SEC’s rules and forms, and that such information is accumulated and communicated to our management, including our principal executive officer and our principal financial officer, as appropriate, to allow timely decisions regarding required disclosure.
Management, with the participation of our principal executive officer and our principal financial officer, performed an evaluation of the effectiveness of our disclosure controls and procedures as of the end of the fiscal year covered by this Annual Report on Form 10-K (the fiscal year ended July 2, 2011). Based on that evaluation, our principal executive officer and our principal financial officer have concluded that such disclosure controls and procedures were effective at a reasonable assurance level as of the end of the fiscal year covered by this Annual Report on Form 10-K.
Changes in Internal Control Over Financial Reporting
There were no changes in our internal control over financial reporting that occurred in the last fiscal quarter (the fiscal quarter ended July 2, 2011) that have materially affected, or are reasonably likely to materially affect, our internal control over financial reporting.
Annual Report of Management on Internal Control Over Financial Reporting
Management is responsible for establishing and maintaining adequate internal control over financial reporting to provide reasonable assurance regarding the reliability of our financial reporting and the preparation of financial statements for external purposes in accordance with accounting principles generally accepted in the United States. Internal control over financial reporting includes those policies and procedures that (i) pertain to the maintenance of records that, in reasonable detail, accurately and fairly reflect the transactions and dispositions of the assets of R.G. Barry Corporation and our consolidated subsidiaries; (ii) provide reasonable assurance that transactions are recorded as necessary to permit preparation of financial statements in accordance with accounting principles generally accepted in the United States, and that receipts and expenditures of R. G. Barry Corporation and our consolidated subsidiaries are being made only in accordance with authorizations of management and directors of R.G. Barry Corporation and (iii) provide reasonable assurance regarding prevention or timely detection of unauthorized acquisition, use or disposition of the assets of R.G. Barry Corporation and our consolidated subsidiaries that could have a material effect on the financial statements.
Management, with the participation of our principal executive officer and our principal financial officer, evaluated the effectiveness of our internal control over financial reporting as of July 2, 2011, the end of our fiscal year. Management based its assessment on criteria established in Internal Control – Integrated Framework issued by the Committee of Sponsoring Organizations of the Treadway Commission. Management’s assessment included evaluation of such elements as the design and operating effectiveness of key financial reporting controls, process documentation, accounting policies and our overall control environment. This assessment is supported by testing and monitoring performed under the direction of management.
Because of its inherent limitations, internal control over financial reporting may not prevent or detect misstatements. Also, projections of any evaluation of effectiveness to future periods are subject to the risk that controls may become inadequate because of changes in conditions, or that the degree of compliance with the policies or procedures may deteriorate. Accordingly, even an effective system of internal control over financial reporting will provide only reasonable assurance with respect to financial statement preparation.
With the late timing of the acquisition of Baggallini during fiscal 2011, it was not practical to document and test completely the control framework in place in this area for purposes of management assertion and related external audit opinion. Accordingly, as permitted under Securities and Exchange regulations, the Company elected to exclude the internal control over financial reporting of Baggallini from our management assertion and related external audit on internal controls for fiscal 2011. Baggallini constitutes approximately 31.3% of consolidated net assets as of July 2, 2011, including acquired
69
Table of Contents
goodwill, customer relationships and trade names, and 3.9% of consolidated net sales for the fiscal year ended July 2, 2011.
Based on the assessment of our internal control over financial reporting, excluding Baggallini as referenced above, management has concluded that our internal control over financial reporting was effective as of July 2, 2011. The results of management’s assessment were reviewed with the Audit Committee of the Board of Directors of R.G. Barry Corporation.
Additionally, our independent registered public accounting firm, KPMG LLP, independently assessed the effectiveness of our internal control over financial reporting and issued the accompanying Report of Independent Registered Public Accounting Firm.
70
Table of Contents
Report of Independent Registered Public Accounting Firm
The Board of Directors and Shareholders
R.G. Barry Corporation:
We have audited R.G. Barry Corporation’s internal control over financial reporting as of July 2, 2011, based on criteria established in Internal Control – Integrated Framework issued by the Committee of Sponsoring Organizations of the Treadway Commission (COSO). R.G. Barry Corporation’s management is responsible for maintaining effective internal control over financial reporting and for its assessment of the effectiveness of internal control over financial reporting, included in the accompanying Annual Report of Management on Internal Control Over Financial Reporting. Our responsibility is to express an opinion on the Company’s internal control over financial reporting based on our audit.
We conducted our audit in accordance with the standards of the Public Company Accounting Oversight Board (United States). Those standards require that we plan and perform the audit to obtain reasonable assurance about whether effective internal control over financial reporting was maintained in all material respects. Our audit included obtaining an understanding of internal control over financial reporting, assessing the risk that a material weakness exists, and testing and evaluating the design and operating effectiveness of internal control based on the assessed risk. Our audit also included performing such other procedures as we considered necessary in the circumstances. We believe that our audit provides a reasonable basis for our opinion.
A company’s internal control over financial reporting is a process designed to provide reasonable assurance regarding the reliability of financial reporting and the preparation of financial statements for external purposes in accordance with generally accepted accounting principles. A company’s internal control over financial reporting includes those policies and procedures that (1) pertain to the maintenance of records that, in reasonable detail, accurately and fairly reflect the transactions and dispositions of the assets of the company; (2) provide reasonable assurance that transactions are recorded as necessary to permit preparation of financial statements in accordance with generally accepted accounting principles, and that receipts and expenditures of the company are being made only in accordance with authorizations of management and directors of the company; and (3) provide reasonable assurance regarding prevention or timely detection of unauthorized acquisition, use or disposition of the company’s assets that could have a material effect on the financial statements.
Because of its inherent limitations, internal control over financial reporting may not prevent or detect misstatements. Also, projections of any evaluation of effectiveness to future periods are subject to the risk that controls may become inadequate because of changes in conditions, or that the degree of compliance with the policies or procedures may deteriorate.
In our opinion, R.G. Barry Corporation maintained, in all material respects, effective internal control over financial reporting as of July 2, 2011, based on criteria established in Internal Control – Integrated Framework issued by the Committee of Sponsoring Organizations of the Treadway Commission.
R.G. Barry Corporation acquired Baggallini, Inc. during fiscal 2011. Management excluded from its assessment of the effectiveness of R.G. Barry Corporation’s internal control over financial reporting as of July 2, 2011, Baggallini Inc.’s internal control over financial reporting. Baggallini Inc. constitutes approximately 31.3% of consolidated net assets as of July 2, 2011, and 3.9% of consolidated net sales for the fiscal year ended July 2, 2011. Our audit of internal control over financial reporting of R.G. Barry Corporation also excluded an evaluation of the internal control over financial reporting of Baggallini, Inc.
We also have audited, in accordance with the standards of the Public Company Accounting Oversight Board (United States), the consolidated balance sheets of R.G. Barry Corporation and subsidiaries as of July 2, 2011 and July 3, 2010, and the related consolidated statements of income, shareholders’ equity and comprehensive income, and cash flows for the years ended July 2, 2011, July 3, 2010 and June 27, 2009,
71
Table of Contents
and our report dated September 14, 2011 expressed an unqualified opinion on those consolidated financial statements.
| /s/ KPMG LLP |
| Columbus, Ohio September 14, 2011 |
Mr. Gregory Ackard formerly reported to the Company’s Chief Executive Officer. With the new acquisitions and reorganizations that followed during fiscal 2011, effective June 27, 2011, Mr. Ackard began reporting directly into the footwear business segment and therefore is not considered to be an “executive” officer of the Company, as the term is defined under applicable SEC rules.
PART III
Item 10. Directors, Executive Officers and Corporate Governance.
Directors, Executive Officers and Persons Nominated or Chosen to Become Directors or Executive Officers
The information required by Item 401 of SEC Regulation S-K concerning the directors of R.G. Barry Corporation and the Board of Directors’ nominees for election as directors of R.G. Barry Corporation at the 2011 Annual Meeting of Shareholders of R.G. Barry Corporation (the “2011 Annual Meeting”) is incorporated herein by reference from the disclosure to be included under the caption “PROPOSAL NO. 1 - ELECTION OF DIRECTORS (Item 1 on the Proxy)” in the definitive Proxy Statement relating to the 2011 Annual Meeting (the “Definitive 2011 Proxy Statement”), which will be filed pursuant to SEC Regulation 14A no later than 120 days after July 2, 2011.
The information required by Item 401 of SEC Regulation S-K concerning the executive officers of R.G. Barry Corporation is included in the portion of Part I of this 2011 Form 10-K entitled “Supplemental Item. Executive Officers of the Registrant” and incorporated herein by reference.
Compliance with Section 16(a) of the Exchange Act
The information required by Item 405 of SEC Regulation S-K is incorporated herein by reference from the disclosure to be included under the caption “SHARE OWNERSHIP – Section 16(a) Beneficial Ownership Reporting Compliance” in the Definitive 2011 Proxy Statement of R.G. Barry Corporation.
Procedures by which Shareholders may Recommend Nominees to the Board of Directors of R.G. Barry Corporation
Information concerning the procedures by which shareholders of R.G. Barry Corporation may recommend nominees to the Board of Directors of R.G. Barry Corporation is incorporated herein by reference from the disclosure to be included under the captions “PROPOSAL NO. 1 - ELECTION OF DIRECTORS (Item 1 on the Proxy) – Committees of the Board – Nominating and Governance Committee” in the 2011 Definitive Proxy Statement of R.G. Barry Corporation. These procedures have not materially changed from those described in the definitive Proxy Statement of R.G. Barry Corporation for the 2010 Annual Meeting of Shareholders.
Audit Committee Matters
The information required by Items 407(d)(4) and 407(d)(5) of SEC Regulation S-K is incorporated herein by reference from the disclosure to be included under the caption “PROPOSAL NO. 1 - ELECTION OF DIRECTORS (Item 1 on the Proxy) – Committees of the Board – Audit Committee” in the Definitive 2011 Proxy Statement of R.G. Barry Corporation.
72
Table of Contents
Code of Business Conduct and Ethics; Committee Charters; Board Mission & Corporate Governance Guidelines
The Board of Directors of R.G. Barry Corporation has adopted a Code of Business Conduct & Ethics covering the directors, officers and employees of R.G. Barry Corporation and its subsidiaries, including the President and Chief Executive Officer (the principal executive officer) and the Senior Vice President-Finance and Chief Financial Officer (the principal financial officer and principal accounting officer).
R.G. Barry Corporation will disclose the following events, if they occur, in a current report on Form 8-K to be filed with the SEC within the required four business days following their occurrence: (A) the date and nature of any amendment to a provision of the Code of Business Conduct & Ethics of R.G. Barry Corporation that (i) applies to the principal executive officer, principal financial officer, principal accounting officer or controller, or persons performing similar functions, (ii) relates to any element of the “code of ethics” definition enumerated in Item 406(b) of SEC Regulation S-K, and (iii) is not a technical, administrative or other non-substantive amendment; and (B) a description of any waiver (including the nature of the waiver, the name of the person to whom the waiver was granted and the date of the waiver), including an implicit waiver, from a provision of the Code of Business Conduct & Ethics granted to the principal executive officer, principal financial officer, principal accounting officer or controller, or persons performing similar functions that relates to one or more of the items set forth in Item 406(b) of SEC Regulation S-K. In addition, R.G. Barry Corporation will disclose any waivers of the Code of Business Conduct & Ethics granted to a director or an executive officer of R.G. Barry Corporation, if they occur, in a current report on Form 8-K within four business days following their occurrence.
The Board of Directors of R.G. Barry Corporation has adopted charters for each of the Audit Committee, the Compensation Committee, and the Nominating and Governance Committee as well as the Board Charter & Corporate Governance Guidelines.
The text of each of the Code of Business Conduct & Ethics, the Audit Committee charter, the Compensation Committee charter, the Nominating and Governance Committee charter and the Board Charter & Corporate Governance Guidelines is posted on the “Investor Room – Corporate Governance” page of R.G. Barry Corporation’s web site located at www.rgbarry.com. Interested persons may also obtain a copy of the Code of Business Conduct & Ethics, the Audit Committee charter, the Compensation Committee charter, the Nominating and Governance Committee charter and the Board Charter & Corporate Governance Guidelines without charge, by writing to R.G. Barry Corporation at its principal executive offices located at 13405 Yarmouth Road N.W., Pickerington, Ohio 43147, Attention: José G. Ibarra. In addition, a copy of the Code of Business Conduct & Ethics is incorporated by reference into this 2011 Form 10-K as Exhibit 14.1 from R.G. Barry Corporation’s Annual Report on Form 10-K for the fiscal year ended July 2, 2011 (Exhibit 14.1).
Item 11. Executive Compensation.
The information required by Item 402 of SEC Regulation S-K is incorporated herein by reference from the disclosure to be included under the captions “PROPOSAL NO. 1 - ELECTION OF DIRECTORS (Item 1 on the Proxy)—Board Role in Risk Oversight—Risk Assessment in Compensation Programs”, “COMPENSATION OF DIRECTORS,” “COMPENSATION DISCUSSION AND ANALYSIS” and “COMPENSATION OF EXECUTIVE OFFICERS” in the Definitive 2011 Proxy Statement of R.G. Barry Corporation.
The information required by Item 407(e) (4) of SEC Regulation S-K is incorporated herein by reference from the disclosure to be included under the caption “PROPOSAL NO. 1 - ELECTION OF DIRECTORS (Item 1 on the Proxy) – Compensation Committee Interlocks and Insider Participation” in the Definitive 2011 Proxy Statement of R.G. Barry Corporation.
The information required by Item 407(e) (5) of SEC Regulation S-K is incorporated herein by reference from the disclosure to be included under the caption “COMPENSATION COMMITTEE REPORT” in the Definitive 2011 Proxy Statement of R.G. Barry Corporation.
73
Table of Contents
Item 12. Security Ownership of Certain Beneficial Owners and Management and Related Stockholder Matters.
Ownership of Common Shares of R.G. Barry Corporation
The information required by Item 403 of SEC Regulation S-K is incorporated herein by reference from the disclosure to be included in the Definitive 2011 Proxy Statement, of R.G. Barry Corporation, under the caption “SHARE OWNERSHIP.”
Equity Compensation Plan Information
The information required by Item 201(d) of SEC Regulation S-K is incorporated herein by reference from the disclosure to be included in the Definitive 2011 Proxy Statement of R.G. Barry Corporation, under the caption “EQUITY COMPENSATION PLAN INFORMATION.”
Item 13. Certain Relationships and Related Transactions, and Director Independence.
Certain Relationships and Related Person Transactions
The information required by Item 404 of SEC Regulation S-K is incorporated herein by reference from the disclosure to be included under the caption “TRANSACTIONS WITH RELATED PERSONS” in the Definitive 2011 Proxy Statement of R.G. Barry Corporation.
Director Independence
The information required by Item 407(a) of SEC Regulation S-K is incorporated herein by reference from the disclosure to be included under the caption “PROPOSAL NO. 1 - ELECTION OF DIRECTORS (Item 1 on the Proxy)” in the Definitive 2011 Proxy Statement of R.G. Barry Corporation.
Item 14. Principal Accountant Fees and Services.
The information required by this Item 14 is incorporated herein by reference from the disclosure to be included in the Definitive 2011 Proxy Statement of R.G. Barry Corporation, under the captions “AUDIT COMMITTEE MATTERS – Pre-Approval Policies and Procedures” and “AUDIT COMMITTEE MATTERS – Fees of Independent Registered Public Accounting Firm.”
PART IV
Item 15. Exhibits and Financial Statement Schedules.
(a)(1) The consolidated financial statements (and report thereon) listed below are included in “Item 8. Financial Statements and Supplementary Data.” of this 2011 Form 10-K at the page(s) indicated:
| Page | ||
| Report of KPMG LLP, Independent Registered Public Accounting Firm |
34 | |
| Consolidated Balance Sheets at July 2, 2011 and July 3, 2010 |
35 | |
| 36 | ||
| 37 | ||
| 38 | ||
| 39-67 | ||
74
Table of Contents
(a)(2) Financial statement schedules:
All schedules for which provision is made in the applicable accounting regulations of the SEC are omitted because of the absence of the conditions under which they are required or because the required information is presented in the Consolidated Financial Statements or notes thereto included in “Item 8. Financial Statements and Supplement Data.” of this 2011 Form 10-K.
(a)(3) and (b) Exhibits:
The exhibits listed on the “Index to Exhibits” beginning on page E-1 of this 2011 Form 10-K are filed with this 2011 Form 10-K or incorporated herein by reference as noted in the “Index to Exhibits”. The “Index to Exhibits” specifically identifies each management contract or compensatory plan or arrangement required to be filed as an exhibit to this 2011 Form 10-K or incorporated herein by reference.
(c) Financial Statement Schedule:
None.
75
Table of Contents
SIGNATURES
Pursuant to the requirements of Section 13 or 15(d) of the Securities Exchange Act of 1934, the Registrant has duly caused this report to be signed on its behalf by the undersigned, thereunto duly authorized.
| R.G. BARRY CORPORATION | ||||
| Date: September 14, 2011 | By: | /s/ José G. Ibarra | ||
| José G. Ibarra, | ||||
| Senior Vice President-Finance and Chief Financial Officer | ||||
76
Table of Contents
Pursuant to the requirements of the Securities Exchange Act of 1934, this report has been signed below by the following persons on behalf of the Registrant and in the capacities and on the date indicated.
| Name |
Capacity |
Date | ||
| /s/ Greg A. Tunney Greg A. Tunney |
President and Chief Executive Officer (Principal Executive Officer) and Director | September 14, 2011 | ||
| /s/ José G. Ibarra José G. Ibarra |
Senior Vice President – Finance and Chief Financial Officer (Principal Financial Officer and Principal Accounting Officer) | September 14, 2011 | ||
| /s/ Gordon Zacks * Gordon Zacks |
Non-Executive Chairman of the Board and Director | September 14, 2011 | ||
| /s/ Nicholas P. DiPaolo * Nicholas P. DiPaolo |
Director | September 14, 2011 | ||
| /s/ David P. Lauer * David P. Lauer |
Director | September 14, 2011 | ||
| /s/ David L. Nichols * David L. Nichols |
Director | September 14, 2011 | ||
| /s/ Janice E. Page * Janice E. Page |
Director | September 14, 2011 | ||
| /s/ Thomas M. Von Lehman * Thomas M. Von Lehman |
Director | September 14, 2011 | ||
| /s/ Harvey A. Weinberg * Harvey A. Weinberg |
Director | September 14, 2011 | ||
| * | The undersigned, by signing his name hereto, does hereby sign this Annual Report on Form 10-K on behalf of each of the above-identified directors of the Registrant pursuant to Powers of Attorney executed by the above-identified directors of the Registrant, which Powers of Attorney are filed with this Annual Report on Form 10-K as Exhibit 24.1. |
| By: | /s/ José G. Ibarra | Date: September 14, 2011 | ||||||
| José G. Ibarra | ||||||||
| Attorney-in-Fact | ||||||||
77
Table of Contents
R.G. BARRY CORPORATION
ANNUAL REPORT ON FORM 10-K
FOR FISCAL YEAR ENDED JULY 2, 2011
INDEX TO EXHIBITS
| Exhibit No. |
Description |
Location | ||
| 2.1 | Asset Purchase Agreement, entered into January 27, 2011, by and among R.G. Barry International, Inc., Foot Petals, LLC and Tina Aldatz. | Incorporated herein by reference to Exhibit 2.1 to Current Report on Form 8-K, dated and filed January 28, 2011 (SEC File No. 001-08769) | ||
| 2.2 | Asset Purchase Agreement, entered into March 15, 2011, by and among Barry Holding Co., baggallini, Inc., Dixie B. Powers as trustee and individually, and Elizabeth Ann Simmons | Incorporated herein by reference to Exhibit 2.1 to Registrant’s Current Report on Form 8-K, dated and filed March 18, 2011 (SEC File No. 001-08769) | ||
| 3.1 | Articles of Incorporation of R.G. Barry Corporation (“Registrant”) (as filed with Ohio Secretary of State on March 26, 1984) | Incorporated herein by reference to Exhibit 3(a)(i) to Registrant’s Annual Report on Form 10-K for the fiscal year ended December 31, 1988 (SEC File No. 0-12667) (“Registrant’s 1988 Form 10-K”) | ||
| 3.2 | Certificate of Amendment to Articles of Incorporation of R.G. Barry Corporation (as filed with Ohio Secretary of State on June 3, 1987) | Incorporated herein by reference to Exhibit 3(a)(i) to Registrant’s 1988 Form 10-K | ||
| 3.3 | Certificate of Amendment to the Articles of Incorporation of R.G. Barry Corporation Authorizing the Series I Junior Participating Class B Preferred Shares (as filed with the Ohio Secretary of State on March 1, 1988) | Incorporated herein by reference to Exhibit 3(a)(i) to Registrant’s 1988 Form 10-K | ||
| 3.4 | Certificate of Amendment to the Articles of R.G. Barry Corporation (as filed with the Ohio Secretary of State on May 9, 1988) | Incorporated herein by reference to Exhibit 3(a)(i) to Registrant’s 1988 Form 10-K | ||
| 3.5 | Certificate of Amendment to the Articles of Incorporation of R.G. Barry Corporation (as filed with the Ohio Secretary of State on May 22, 1995) | Incorporated herein by reference to Exhibit 3(b) to Registrant’s Annual Report on Form 10-K for the fiscal year ended December 30, 1995 (SEC File No. 001-08769) (“Registrant’s 1995 Form 10-K”) | ||
| 3.6 | Certificate of Amendment to the Articles of Incorporation of R.G. Barry Corporation (as filed with the Ohio Secretary of State on September 1, 1995) | Incorporated herein by reference to Exhibit 3(c) to Registrant’s 1995 Form 10-K | ||
E-1
Table of Contents
| Exhibit No. |
Description |
Location | ||
| 3.7 | Certificate of Amendment by Shareholders to the Articles of Incorporation of R.G. Barry Corporation (as filed with the Ohio Secretary of State on May 30, 1997) | Incorporated herein by reference to Exhibit 4(h)(6) to Registrant’s Registration Statement on Form S-8, filed June 6, 1997 (Registration No. 333-28671) | ||
| 3.8 | Certificate of Amendment by Directors of R.G. Barry Corporation to the Articles of Incorporation of R.G. Barry Corporation Authorizing Series I Junior Participating Class A Preferred Shares (as filed with the Ohio Secretary of State on March 10, 1998) | Incorporated herein by reference to Exhibit 3(a)(7) to Registrant’s Annual Report on Form 10-K for the fiscal year ended January 3, 1998 (SEC File No. 001-08769) (“Registrant’s 1997 Form 10-K”) | ||
| 3.9 | Certificate of Amendment by Directors to the Articles of Incorporation of R.G. Barry Corporation Authorizing the Series II Junior Participating Class A Preferred Shares (as filed with the Ohio Secretary of State on May 1, 2009) | Incorporated herein by reference to Exhibit 3.1 to Registrant’s Current Report on Form 8-K, dated and filed May 4, 2009 (SEC File No. 001-08769) (“Registrant’s May 4, 2009 Form 8-K”) | ||
| 3.10 | Certificate of Amendment by Shareholders to the Articles of Incorporation of R.G. Barry Corporation (as filed with the Ohio Secretary of State on November 5, 2010) | Incorporated herein by reference to Exhibit 3.1 to Registrant’s Current Report on Form 8-K, dated and filed November 8, 2010 (SEC File No. 001-08769) | ||
| 3.11 | Articles of Incorporation of R.G. Barry Corporation (reflecting all amendments filed with the Ohio Secretary of State) [for purposes of SEC reporting compliance only – not filed with the Ohio Secretary of State] | Incorporated herein by reference to Exhibit 3.2 to Registrant’s Quarterly Report on Form 10-Q for the fiscal year ended October 2, 2010 (SEC File No. 001-08769) (“Registrant’s June 2009 Form 10-K”) | ||
| 3.12 | Code of Regulations of R.G. Barry Corporation (reflecting all amendment) | Incorporated herein by reference to Exhibit 3.2 to Registrant’s Quarterly Report on Form 10-Q for the quarterly period ended July 3, 2004 (SEC File No. 001-08769) (“Registrant’s July 3, 2004 Form 10-Q”) | ||
| 4.1 | Rights Agreement, dated as of May 1, 2009, between R.G. Barry Corporation and The Bank of New York Mellon, as Rights Agent, including the Form of Rights Certificate and the Summary of Rights to Purchase Preferred Shares | Incorporated herein by reference to Exhibit 4.1 to Registrant’s May 4, 2009 Form 8-K | ||
| *10.1 | R.G. Barry Corporation Associates’ Retirement Plan (amended and restated effective January 1, 1997) | Incorporated herein by reference to Exhibit 10.1 to Registrant’s Annual Report on Form 10-K for the fiscal year ended December 29, 2001 (SEC File No. 001-08769) (“Registrant’s December 29, 2001 Form 10-K”) | ||
E-2
Table of Contents
| Exhibit No. |
Description |
Location | ||
| *10.2 | Amendment No. 1 to the R.G. Barry Corporation Associates’ Retirement Plan (amended and restated effective January 1, 1997, and executed on December 31, 2001) | Incorporated herein by reference to Exhibit 10.2 to Registrant’s Annual Report on Form 10-K for the fiscal year ended December 28, 2002 (SEC File No. 001-08769) (“Registrant’s 2002 Form 10-K”) | ||
| *10.3 | Amendment No. 2 to the R.G. Barry Corporation Associates’ Retirement Plan (amended and restated effective January 1, 1997, and executed on December 31, 2001) for the Economic Growth and Tax Relief Reconciliation Act of 2001 | Incorporated herein by reference to Exhibit 10.3 to Registrant’s December 28, 2002 Form 10-K | ||
| *10.4 | Amendment No. 3 to the R.G. Barry Corporation Associates’ Retirement Plan (effective as of March 31, 2004 and executed on February 20, 2004) | Incorporated herein by reference to Exhibit 10.4 to Registrant’s Annual Report on Form 10-K for the fiscal year ended January 3, 2004 (SEC File No. 001-08769) (“Registrant’s January 3, 2004 Form 10-K”) | ||
| *10.5 | Amendment No. 4 to the R.G. Barry Corporation Associates’ Retirement Plan (executed on September 16, 2005) | Incorporated herein by reference to Exhibit 10.5 to Registrant’s Annual Report on Form 10-K for the fiscal year ended December 31, 2005 (SEC File No. 001-08769) (“Registrant’s December 31, 2005 Form 10-K”) | ||
| *10.6 | R.G. Barry Corporation Supplemental Retirement Plan (effective as of January 1, 1997) | Incorporated herein by reference to Exhibit 10.2 to Registrant’s Annual Report on Form 10-K for the fiscal year ended January 1, 2000 (SEC File No. 001-08769) (“Registrant’s January 1, 2000 Form 10-K”) | ||
| *10.7 | Amendment No. 1 to the R.G. Barry Corporation Supplemental Retirement Plan Effective January 1, 1997 (effective as of May 12, 1998, executed May 15, 1998) | Incorporated herein by reference to Exhibit 10.3 to Registrant’s January 1, 2000 Form 10-K | ||
| *10.8 | Amendment No. 2 to the R.G. Barry Corporation Supplemental Retirement Plan Effective January 1, 1997 (effective as of January 1, 2000, executed March 28, 2000) | Incorporated herein by reference to Exhibit 10.4 to Registrant’s January 1, 2000 Form 10-K | ||
| *10.9 | Amendment No. 3 to the R.G. Barry Corporation Supplemental Retirement Plan Effective January 1, 1997 (effective as of March 31, 2004, executed February 20, 2004) | Incorporated herein by reference to Exhibit 10.8 to Registrant’s January 3, 2004 Form 10-K | ||
E-3
Table of Contents
| Exhibit No. |
Description |
Location | ||
| *10.10 | R.G. Barry Corporation Supplemental Benefit Plans Trust (effective as of September 1, 1995) | Incorporated herein by reference to Exhibit 10.1 to Registrant’s July 3, 2004 Form 10-Q | ||
| *10.11 | R.G. Barry Corporation Restoration Plan (As Amended and Restated Effective as of January 1, 1997) | Incorporated herein by reference to Exhibit 10.12 to Registrant’s Annual Report on Form 10-K for the fiscal year ended June 28, 2008 (SEC File No. 001-08769) (“Registrant’s June 28, 2008 Form 10-K”) | ||
| *10.12 | Amendment No. 2 to the R.G. Barry Corporation Restoration Plan (executed February 20, 2001, effective as of January 1, 2001) | Incorporated herein by reference to Exhibit 10.13 to Registrant’s June 28, 2008 Form 10-K | ||
| *10.13 | Amendment No. 3 to the R.G. Barry Corporation Restoration Plan (executed February 20, 2004, effective as of March 31, 2004) | Incorporated herein by reference to Exhibit 10.14 to Registrant’s June 28, 2008 Form 10-K | ||
| *10.14 | Employment Agreement, effective July 1, 2001, between R.G. Barry Corporation and Gordon Zacks | Incorporated herein by reference to Exhibit 10.5 to Registrant’s December 29, 2001 Form 10-K | ||
| *10.15 | Confidential Separation Agreement, dated March 10, 2004, between R.G. Barry Corporation and Gordon Zacks | Incorporated herein by reference to Exhibit 10.1 to Registrant’s Current Report on Form 8-K, dated and filed March 11, 2004 (SEC File No. 001-08769) (“Registrant’s March 11, 2004 Form 8-K”) | ||
| *10.16 | Agreement, dated September 27, 1989, between R.G. Barry Corporation and Gordon Zacks | Incorporated herein by reference to Exhibit 28.1 to Registrant’s Current Report on Form 8-K, dated October 11, 1989 and filed October 12, 1989 (SEC File No. 0-12667) | ||
| *10.17 | Amendment No. 1, dated as of October 12, 1994, to the Agreement between Registrant and Gordon Zacks, dated September 27, 1989 | Incorporated herein by reference to Exhibit 5 to Amendment No. 14 to Schedule 13D, dated January 27, 1995, filed by Gordon Zacks on February 13, 1995 | ||
| *10.18 | Amended Split-Dollar Insurance Agreement, dated March 23, 1995, between Registrant and Gordon B. Zacks | Incorporated herein by reference to Exhibit 10(h) to Registrant’s 1995 Form 10-K | ||
| *10.19 | R.G. Barry Corporation Employee Stock Purchase Plan | Incorporated herein by reference to Exhibit 10.1 to Registrant’s Quarterly Report on Form 10-Q for the quarterly period ended June 28, 2003 (SEC File No. 001-08769) | ||
E-4
Table of Contents
| Exhibit No. |
Description |
Location | ||
| *10.20 | R.G. Barry Corporation Deferred Compensation Plan (effective as of September 1, 1995) | Incorporated herein by reference to Exhibit 10(v) to Registrant’s 1995 Form 10-K | ||
| *10.21 | Amendment No. 1 to the R.G. Barry Corporation Deferred Compensation Plan (executed March 1, 1997, effective as of March 1, 1997) | Incorporated herein by reference to Exhibit 10.23 to Registrant’s January 2000 Form 10-K | ||
| *10.22 | Amendment No. 2 to the R.G. Barry Corporation Deferred Compensation Plan (executed March 28, 2000, effective as of December 1, 1999) | Incorporated herein by reference to Exhibit 10.21 to Registrant’s 2001 Form 10-K | ||
| *10.23 | Amendment No. 3 to the R.G. Barry Corporation Deferred Compensation Plan (executed October 31, 2001, effective as of December 1, 1999) | Incorporated herein by reference to Exhibit 10.24 to Registrant’s 2002 Form 10-K | ||
| *10.24 | Amendment No. 4 to the R.G. Barry Corporation Deferred Compensation Plan (executed February 20, 2004, effective as of February 21, 2004) | Incorporated herein by reference to Exhibit 10.29 to Registrant’s January 2004 Form 10-K | ||
| *10.25 | R.G. Barry Corporation 1997 Incentive Stock Plan, as amended | Incorporated herein by reference to Exhibit 10 to Registrant’s Registration Statement on Form S-8, filed June 18, 1999 (Registration No. 333-81105) | ||
| *10.26 | Form of Stock Option Agreement used in connection with the grant of incentive stock options pursuant to the R.G. Barry Corporation 1997 Incentive Stock Plan | Incorporated herein by reference to Exhibit 10.24 to Registrant’s Annual Report on Form 10-K for the fiscal year ended December 30, 2000 (SEC File No. 001-08769) (“Registrant’s December 2000 Form 10-K”) | ||
| *10.27 | Form of Stock Option Agreement used in connection with the grant of non-qualified stock options pursuant to the R.G. Barry Corporation 1997 Incentive Stock Plan | Incorporated herein by reference to Exhibit 10.25 to Registrant’s December 2000 Form 10-K | ||
| *10.28 | R.G. Barry Corporation 2002 Stock Incentive Plan | Incorporated herein by reference to Exhibit 10 to Registrant’s Registration Statement on Form S-8, filed June 14, 2002 (Registration No. 333-90544) | ||
| *10.29 | Form of Stock Option Agreement used in connection with grant of incentive stock options pursuant to the R.G. Barry Corporation 2002 Stock Incentive Plan | Incorporated herein by reference to Exhibit 10.30 of Registrant’s 2002 Form 10-K | ||
| *10.30 | Form of Stock Option Agreement used in connection with grant of non-qualified stock options pursuant to the R. G. Barry Corporation 2002 Stock Incentive Plan | Incorporated herein by reference to Exhibit 10.31 of Registrant’s 2002 Form 10-K | ||
E-5
Table of Contents
| Exhibit No. |
Description |
Location | ||
| *10.31 | Agreement, made to be effective August 11, 2005, between Registrant and Florence Zacks Melton | Incorporated herein by reference to Exhibit 10.2 to Registrant’s Quarterly Report on Form 10-Q for the quarterly period ended July 2, 2005 (SEC File No. 001-08769) (“Registrant’s July 2, 2005 Form 10-Q”) | ||
| *10.32 | Fiscal 2008 R.G. Barry Management Bonus Plan | Incorporated herein by reference to Exhibit 10.1 to Registrant’s Current Report on Form 8-K, dated and filed August 28, 2007 (SEC File No. 001-08769) | ||
| *10.33 | Fiscal 2009 R.G. Barry Management Bonus Plan | Incorporated herein by reference to Exhibit 10.1 to Registrant’s Quarterly Report on Form 10-Q for the quarterly period ended September 27, 2008 (SEC File No. 001-08769) | ||
| *10.34 | Fiscal 2010 R.G. Barry Management Bonus Plan | Incorporated herein by reference to Exhibit 10.1 to Registrant’s Quarterly Report on Form 10-Q for the quarterly period ended January 2, 2010 (SEC File No. 001-08769) (“Registrants January 2, 2010 Form 10-Q”) | ||
| 10.35 | Fiscal 2011 R.G. Barry Management Bonus Plan | Incorporated herein by reference to Exhibit 10.37 to Registrant’s Annual Report on Form 10-K for the annual period ended July 3, 2011 (SEC File No. 001-08769) (“Registrants 2010 Form 10-K”) | ||
| 10.36 | Fiscal 2012 R.G. Barry Management Bonus Plan | Filed herewith | ||
| *10.37 | Form of Change in Control Agreement entered into effective as of January 8, 2008 by Registrant with each of the following officers: Glenn D. Evans – Senior Vice President – Global Operations; José G. Ibarra – Senior Vice President – Finance and Chief Financial Officer; Lee F. Smith – Senior Vice President – Creative Services; Yvonne Kalucis – Senior Vice President - Human Resources; and Thomas JZ Konecki – President of Private Brands | Incorporated herein by reference to Exhibit 10.45 to Registrant’s June 2008 Form 10-K | ||
| *10.38 | Change in Control Agreement entered into effective as of April 13, 2009 by Registrant with Greg Ackard – Senior Vice President-Sales | Incorporated herein by reference to Exhibit 10.41 to Registrant’s June 2009 Form 10-K. | ||
E-6
Table of Contents
| Exhibit No. |
Description |
Location | ||
| 10.39 | R.G. Barry Corporation Board of Directors Compensation Program (adopted by Board of Directors approval at the September 2, 2010 meeting of the Board of Directors, to be in effect with the November 4, 2010 Annual Meeting of Shareholders) | Incorporated herein by reference to Exhibit 10.1 to the Quarterly Report on Form 10-Q of R.G. Barry Corporation for the quarterly period ended October 2, 2010 (SEC File No. 001-08769) | ||
| *10.40 | Change in Control Agreement between R.G. Barry Corporation and Jose Ibarra, made to be effective as of January 7, 2011 | Incorporated herein by reference to Exhibit 10.1 to Registrant’s Current Report on Form 8-K dated and filed January 13, 2011 (SEC File No. 001-08769) (“Registrant’s January 13, 2011 Form 8-K”) | ||
| *10.41 | Change in Control Agreement between R.G. Barry Corporation and Glenn Evans, made to be effective as of January 7, 2011 | Incorporated herein by reference to Exhibit 10.3 in the Registrant’s January 13, 2011 Form 8-K | ||
| *10.42 | Change in Control Agreement between R.G. Barry Corporation and Lee Smith, made to be effective as of January 7, 2011 | Incorporated herein by reference to Exhibit 10.2 in the Registrant’s January 13, 2011 Form 8-K | ||
| *10.43 | Change in Control Agreement between R.G. Barry Corporation and Greg Ackard, made to be effective as of January 7, 2011 | Incorporated herein by reference to Exhibit 10.4 in the Registrant’s January 13, 2011 Form 8-K | ||
| *10.44 | Change in Control Agreement between R.G. Barry Corporation and Yvonne Kalucis, made to be effective as of January 7, 2011 | Filed herewith | ||
| *10.45 | Key Employment Agreement between R.G. Barry Corporation and Tina Aldatz, made to be effective as of January 28, 2011 | Filed herewith | ||
| *10.46 | Key Employment Agreement between R.G. Barry Corporation and Dennis Eckols, made to be effective as of April 1, 2011 | Filed herewith | ||
| *10.47 | R.G. Barry Corporation Amended and Restated 2005 Long-Term Incentive Plan (as amended on October 29, 2009) | Incorporated herein by reference to Exhibit 10.2 to Registrant’s January 2, 2010 Form 10-Q | ||
E-7
Table of Contents
| Exhibit No. |
Description |
Location | ||
| *10.48 | Form of Nonqualified Stock Option Award Agreement, Nonqualified Stock Option Exercise Notice and Beneficiary Designation Form used to evidence grants of nonqualified stock options made to directors of Registrant under the R.G. Barry Corporation 2005 Long-Term Incentive Plan (now known as the R.G. Barry Corporation Amended and Restated 2005 Long-Term Incentive Plan) | Incorporated herein by reference to Exhibit 10.1 to Registrant’s July 2, 2005 Form 10-Q | ||
| *10.49 | Form of Restricted Stock Unit Award Agreement used to evidence grants of restricted stock units made to directors of R.G. Barry Corporation under the R.G. Barry Corporation 2005 Long-Term Incentive Plan (now known as the R.G. Barry Corporation Amended and Restated 2005 Long-Term Incentive Plan) | Incorporated herein by reference to Exhibit 10.1 to Registrant’s Current Report on Form 8-K, dated May 22, 2006 and filed May 23, 2006 (SEC File No. 001-08769) (“Registrant’s May 23, 2006 Form 8-K”) | ||
| *10.50 | Form of Restricted Stock Unit Award Agreement used to evidence grants of restricted stock units made to employees of R.G. Barry Corporation under the R.G. Barry Corporation 2005 Long-Term Incentive Plan (now known as the R.G. Barry Corporation Amended and Restated 2005 Long-Term Incentive Plan) | Incorporated herein by reference to Exhibit 10.2 to Registrant’s May 23, 2006 Form 8-K | ||
| *10.51 | Form of Amendment Notice and Consent Form Regarding Restricted Stock Units Awarded to Employees on May 17, 2006 under the R.G. Barry Corporation 2005 Long-Term Incentive Plan (now known as the R.G. Barry Corporation Amended and Restated 2005 Long-Term Incentive Plan) | Incorporated herein by reference to Exhibit 10.1 to Registrant’s Current Report on Form 8-K, dated August 18, 2006 and filed August 21, 2006 (SEC File No. 001-08769) | ||
| *10.52 | Form of Performance-Based Restricted Stock Unit Award Agreement for Employees used to evidence grants of restricted stock units made on September 11, 2008 under the R.G. Barry Corporation 2005 Long-Term Incentive Plan (now known as the R.G. Barry Corporation Amended and Restated 2005 Long-Term Incentive Plan) | Incorporated herein by reference to Exhibit 10.6 to Registrant’s Quarterly Report on Form 10-Q for the quarterly period ended December 27, 2008 (SEC File No. 001-08769) (“Registrant’s December 27, 2008 Form 10-Q”) | ||
E-8
Table of Contents
| Exhibit No. |
Description |
Location | ||
| *10.53 | Executive Employment Agreement between R.G. Barry Corporation and Greg A. Tunney, entered into on May 6, 2009 and effective as of May 1, 2009 | Incorporated herein by reference to Exhibit 10.1 to Registrant’s Current Report on Form 8-K, dated and filed May 11, 2009 (SEC File No. 001-08769) | ||
| *10.54 | Nonqualified Stock Option Award Agreement for nonqualified stock options granted to Greg A. Tunney on February 7, 2006 under the R.G. Barry Corporation 2005 Long-Term Incentive Plan (now known as the R.G. Barry Corporation Amended and Restated 2005 Long-Term Incentive Plan) | Incorporated herein by reference to Exhibit 10.2 to Registrant’s Current Report on Form 8-K, dated February 9, 2006 and filed February 10, 2006 (SEC File No. 001-08769) | ||
| *10.55 | R.G. Barry Corporation Amended and Restated Deferral Plan (effective as of October 28, 2008) | Incorporated herein by reference to Exhibit 10.5 to Registrant’s December 27, 2008 Form 10-Q | ||
| *10.56 | R.G. Barry Corporation Deferral Plan (now known as R.G. Barry Corporation Amended and Restated Deferral Plan)--Directors’ Notice of Eligibility and Enrollment Form | Incorporated herein by reference to Exhibit 10.4 to Registrant’s May 23, 2006 Form 8-K | ||
| *10.57 | R.G. Barry Corporation Deferral Plan (now known as R.G. Barry Corporation Amended and Restated Deferral Plan)--Gordon Zacks’ Notice of Eligibility and Enrollment Form | Incorporated herein by reference to Exhibit 10.5 to Registrant’s May 23, 2006 Form 8-K | ||
| *10.58 | R.G. Barry Corporation Deferral Plan (now known as R.G. Barry Corporation Amended and Restated Deferral Plan)--Employees’ Notice of Eligibility and Enrollment Form | Incorporated herein by reference to Exhibit 10.6 to Registrant’s May 23, 2006 Form 8-K | ||
| *10.59 | Employees’ Notice of Eligibility related to Deferral of Restricted Stock Units for Calendar Year 2009 under the R.G. Barry Corporation Amended and Restated Deferral Plan | Incorporated herein by reference to Exhibit 10.55 to Registrants Annual Report on Form 10-K for the fiscal year ended June 27, 2009 (File No. 001-8769) (“Registrant’s June 27, 2009 Form 10-K”) | ||
| *10.60 | R.G. Barry Corporation Amended and Restated Deferral Plan Participation Agreement Relating to Restricted Stock Units Granted in Calendar Year 2009 | Incorporated herein by reference to Exhibit 10.56 to Registrants June 27, 2009 Form 10-K | ||
| 10.61 | Revolving Credit Agreement, entered into to be effective on March 29, 2007, between R.G. Barry Corporation and The Huntington National Bank. As filed includes all exhibits to the Revolving Credit Agreement in their entirety. | Incorporated herein by reference to Exhibit 10.2 to Registrant’s Quarterly Report on Form 10-Q for the quarterly period ended April 2, 2011 (SEC File No. 001-08769) (“Registrant’s April 2, 2011 Form 10-Q”) | ||
E-9
Table of Contents
| Exhibit No. |
Description |
Location | ||
| 10.62 | Revolving Credit Note dated March 29, 2007 given by R.G. Barry Corporation to The Huntington National Bank | Incorporated herein by reference to Exhibit 10.2 to Registrant’s Current Report on Form 8-K, dated April 3, 2007 and filed April 4, 2007 (SEC File No. 001-08769) | ||
| 10.63 | First Modification of Revolving Credit Agreement, entered into effective April 16, 2007, between R.G. Barry Corporation and The Huntington National Bank | Incorporated herein by reference to Exhibit 10.1 to Registrant’s Current Report on Form 8-K, dated April 17, 2007 and filed April 18, 2007 (SEC File No. 001-08769) | ||
| 10.64 | Second Modification of Revolving Credit Agreement, entered into effective as of June 26, 2009, between R.G. Barry Corporation and The Huntington National Bank | Incorporated herein by reference to Exhibit 10.1 to Registrant’s Current Report on Form 8-K, dated and filed July 22, 2009 (SEC File No. 001-08769) | ||
| 10.65 | Revolving Credit Note dated as of March 29, 2007 given by R.G. Barry Corporation to The Huntington National Bank | Incorporated herein by reference to Exhibit 10.2 to Registrant’s Quarterly Report on Form 10-Q filed May 11, 2011 as refilled with all exhibits | ||
| 10.66 | Credit Agreement, dated March 1, 2011, between R.G. Barry Corporation and The Huntington National Bank. As filed, includes all exhibits to the Credit Agreement, in their entirety. | Incorporated herein by reference to Exhibit 10.1 to Registrant’s April 2, 2011 Form 10-Q | ||
| 14.1 | R.G. Barry Corporation Code of Business Conduct &Ethics | Incorporated herein by reference to Exhibit 14.1 to Registrant’s June 27, 2009 Form 10-K | ||
| 21.1 | Subsidiaries of R.G. Barry Corporation | Filed herewith | ||
| 23.1 | Consent of KPMG LLP, Independent Registered Public Accounting Firm | Filed herewith | ||
| 24.1 | Powers of Attorney Executed by Directors and Certain Executive Officers of R.G. Barry Corporation | Filed herewith | ||
| 31.1 | Rule 13a - 14(a)/15d-14(a) Certifications (Principal Executive Officer) | Filed herewith | ||
| 31.2 | Rule 13a - 14(a)/15d-14(a) Certifications (Principal Financial Officer) | Filed herewith | ||
| 32.1 | Section 1350 Certifications (Principal Executive Officer and Principal Financial Officer) | Furnished herewith | ||
| * | Management contract or compensatory plan or arrangement. |
E-10