Attached files
| file | filename |
|---|---|
| 8-K - FORM 8-K - WESBANCO INC | d231205d8k.htm |
 Exhibit 99.1 |
 Forward-looking
statements
in
this
presentation
relating
to
WesBanco’s
plans,
strategies,
objectives,
expectations,
intentions
and
adequacy
of
resources,
are
made
pursuant
to
the
safe
harbor
provisions
of
the
Private
Securities
Litigation
Reform
Act
of
1995.
The
information
contained
herein
should
be
read
in
conjunction
with
WesBanco’s
2010
Annual
Report
on
Form
10-K
filed
with
the
Securities
and
Exchange
Commission
(“SEC”),
including
WesBanco’s
Form
10-Q
as
of
March
31,
2011
and
June
30,
2011,
which
are
available
on
the
SEC’s
website
www.sec.gov
or
at
WesBanco’s
website
www.wesbanco.com.
Investors
are
cautioned
that
forward-looking
statements,
which
are
not
historical
fact,
involve
risks
and
uncertainties,
including
those
detailed
in
WesBanco’s
2010
Annual
Report
on
Form
10-K
filed
with
the
SEC
under
the
section,
“Risk
Factors”
in
Part
1,
Item
1A.
Such
statements
are
subject
to
important
factors
that
could
cause
actual
results
to
differ
materially
from
those
contemplated
by
such
statements.
WesBanco
does
not
assume
any
duty
to
update
any
forward-looking
statements. |
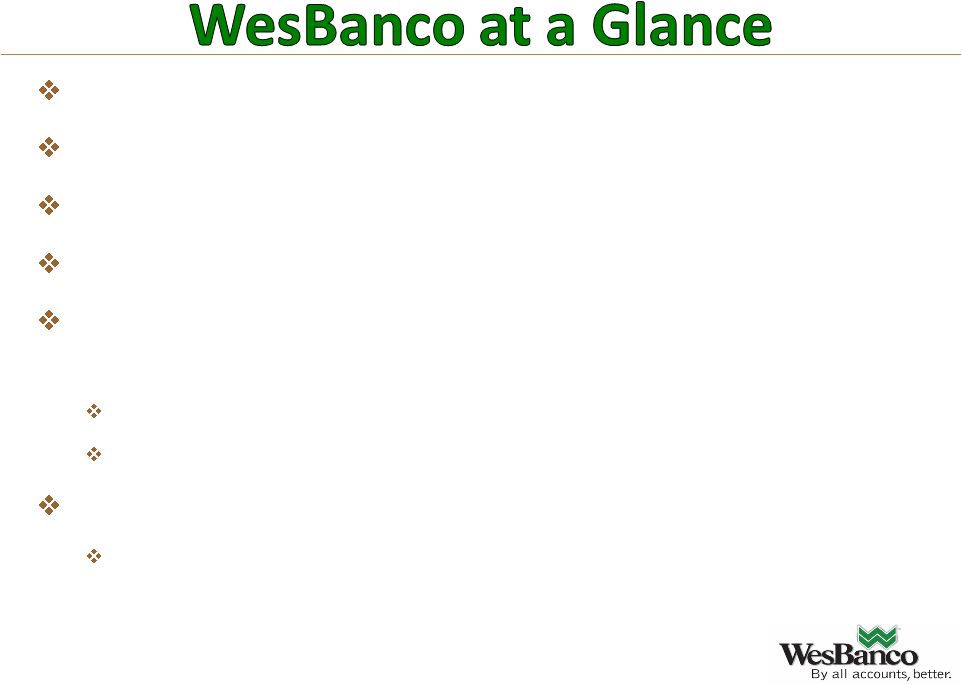 Headquarters in Wheeling, West Virginia
Assets: $5.4 billion
Founded in 1870
32 banks/23 companies acquired in 25 years
Banking operations in West Virginia, Ohio and
Western Pennsylvania
112 banking offices + Pittsburgh Business Loan Office
124 ATM’s
Non-bank
activities
include:
Wealth management, securities brokerage, insurance and
proprietary family of mutual funds |
 Columbus
Springfield
Dayton
Huntington
Wheeling
* SNL 12/31/10 Deposit Market Share Data
Ranked #1-3 in
deposit market
share in 15
counties out of 37*
Expanding along
major highways to
population centers
(Columbus,
Dayton,
Cincinnati)
Organized into
seven markets |
 ($ in
thousands, except diluted earnings per share)00’s except per
share data)
Jun 2011
Mar 2011
Dec 2010
Sep 2010
Jun 2010
Net Income
$11,918
$10,240
$10,310
$9,153
$8,238
Diluted Earnings Per Share
$ 0.45
$ 0.39
$ 0.39
$ 0.34
$ 0.31
Provision for Credit Losses
$6,802
$8,041
$9,625
$11,778
$11,675
Return on Average Assets
0.88%
0.77%
0.76%
0.67%
0.61%
Return on Average Tangible
Equity
14.73%
13.29%
13.09%
11.80%
10.98%
Net Interest Margin (FTE)
3.73%
3.67%
3.66%
3.61%
3.56%
Efficiency Ratio
59.79%
61.63%
60.36%
61.05%
60.36% |
 |
 •
Net Operating Revenue = Net Interest Income plus Non-interest Income,
excluding net securities gains and gains/losses on REO. See non-GAAP
measures for additional information relating to the calculation of this item.
|
 Summary
– Capital Ratios %
*See non-GAAP measures for additional
information relating to the calculation of this item.
|
 Recent
Accomplishments Increased dividends to shareholders in 1Q’11 and in
3Q’11 by 14.3% in total.
Growth in tangible capital and regulatory capital ratios
through growth in retained earnings.
Remained profitable each quarter throughout recession.
Continued growth in earnings per share in each of the past
7 quarters.
Purchased five branches with $600 million in deposits
using existing capital resources.
Paid back $75 million in TARP without common raise.
Maintained strong capital position, considered “well
capitalized”. |
 (MM)
Growth by Acquisition:
A WSBC Core Competency
Focused on higher growth
metro markets and
enhancing market share.
Five acquisitions in nine
years –
assets more than
doubled since the
beginning of 2002.
A history of successful
consolidations.
Acquired 5 branches in
Columbus, Ohio market in
2009, resulting in #9
market share.
Acquired Assets: 2002 to 2011 = $3.6B
($ in billions)
$0.0
$1.0
$2.0
$3.0
$4.0
$5.0
$6.0
2002
2003
2004
2005
2006
2007
2008
2009
2010
2011
YTD |
 WesBanco is focused on targeted M & A opportunities in its
market areas.
Limited FDIC-assisted transactions expected, but plenty of
moderately distressed banks and “tired”
management
teams.
Management, technology/back office and capital/liquidity
strength to compete for deals of interest.
Current stock valuation provides for upside potential for
acquired bank’s shareholders. |
 $3.0B of assets under management/custody.
Over 5,000 trust relationships.
4 locations in WV & OH
Improving performance as
asset values have grown.
Product capabilities:
Trust
Investment management
WesMark Funds
Estate planning
Financial planning
Brokerage sales
Retirement planning |
 Economic Benefits of WV
WV reported a surplus of revenue over expense
for the latest fiscal year.
State of WV has implemented legislation to
reduce Business Franchise and Corporate Net
Income Taxes.
WV generated 8% higher revenues in 2011 and
GDP rose by 4% vs. the 2.6% national average.
WV reports stable home prices over the past
five years.
WV reports lower than national average
unemployment. |
 Map Source: Oil & Gas Financial Journal through Sterne Agee; data from
Pennsylvania State University College of Earth and Mineral Sciences
Research Study of 5/24/10.
Area five time as large as
Barnett Shale –
primarily in
WV & PA, parts of NY & OH.
WVU study suggests 43k-
83k
jobs created by Marcellus
drilling activity by 2015.
Total estimated economic
activity by 2020 -
$3B.
WSBC in 10 out of 32 counties
in WV with activity.
Top 5 in deposit share in five
of those counties.
Over 1,000 Marcellus wells
drilled to date in WV.
4,145 drilling permits applied
for between 1/1/09 –
7/31/11 in
WV. |
 2011 Business Initiatives
Actively remix the balance sheet –
loans & deposits -
to
improve revenue, interest rate sensitivity, regulatory capital
and profitability.
Continuing efforts to address credit quality and impaired
loan levels as economy improves.
Focus on organic loan growth, with an emphasis on
business banking and C&I lending.
Pursue opportunities for activities related to Marcellus
Shale.
Continue to focus on wealth management and other fee-
related opportunities.
Monitor opportunities for selective acquisitions in footprint.
|
 Price
/
2012
Estimated
Earnings
(x)
(1)
Price
/
2012
Estimated
Earnings
(x)
(1)
Source: FactSet Research Systems and SNL Financial; Market data as of
8/26/2011 (1) 2012E earnings estimates per First Call; SRCE earnings estimate
not available (2)
Includes
nationwide
banks
and
thrifts
between
$2
billion
and
$10
billion
in
total
assets |
 Market Performance –
Cycle-to-Date
Market Performance –
Cycle-to-Date
6/30/07
7/11/08
7/28/09
8/11/10
8/26/11
0.00%
25.00%
50.00%
75.00%
100.00%
125.00%
WesBanco, Inc. (-38.41%)
KBW Regional Banking Index (-54.92%)
KBW Bank Index (-66.65%)
S&P 500 Index (-21.72%) |
 Market Performance –
Since January 1, 2010
Market Performance –
Since January 1, 2010
1/1/10
5/31/10
10/29/10
3/28/11
8/26/11
60.00%
80.00%
100.00%
120.00%
140.00%
160.00%
180.00%
WesBanco, Inc. (47.24%)
KBW Regional Banking Index (-7.62%)
KBW Bank Index (-11.85%)
S&P 500 Index (5.53%) |
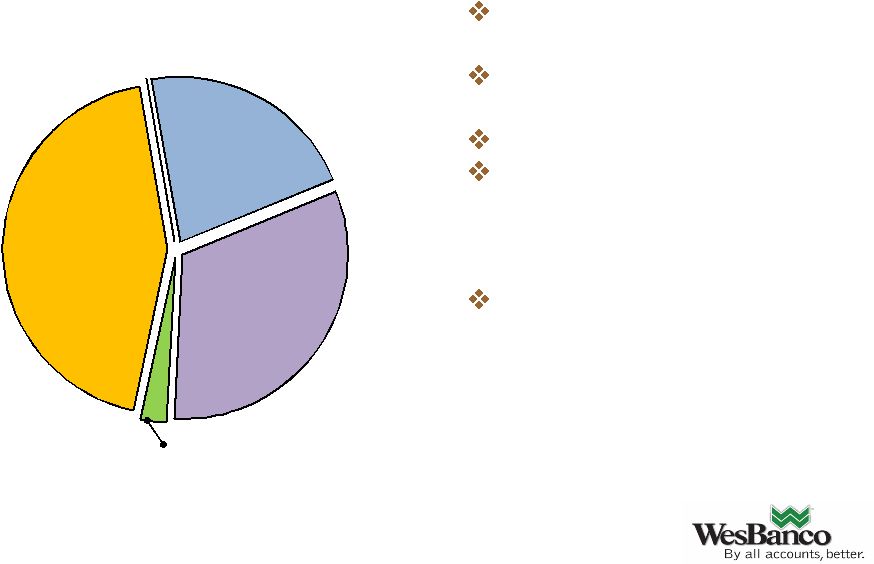 Securities Portfolio –
Quality & Liquidity
Agency
Agency
Mortgage-
Mortgage-
Backed &
Backed &
CMOs, 43.9%
CMOs, 43.9%
US Govt.
US Govt.
Agencies
Agencies
21.6%
21.6%
Securities = $1.52 B
~28.1% of total assets
Municipals,
32.0%
Equities &
Others, 2.5%
Average portfolio yield
of 3.72% at 6/30/11.
WAL approx. 4.8 years,
modified duration 3.6%.
Over 55% unpledged.
No significant private
label RMBS, equities
and corporate/ABS
securities.
Net unrealized AFS
securities gains of $11.0
million at 6/30/11: total
portfolio gain of $20.3
million. |
 Portfolio comprised of $494 million of tax exempts and
taxable Build America Bonds.
Approximately 90% are local issuers.
G.O.’s are 74% of total; 26% revenue bonds.
96% rated, with 78% rated AA (or its equivalent) or higher.
Only 6.0% below A –
all are investment grade.
About 59% in held to maturity –
longer dated maturities.
Average tax-equivalent yield –
5.8%; average life 6.8 years.
Average size of each issue is $644 thousand. Average
holdings per issuer are $914 thousand. |
 Diversified
Loan Portfolio Diversified Loan Portfolio
Comm. Real Estate =
$1.73 B
Const & Dev.
10%
Total Portfolio Loans = $3.26 B
Investor-
owned
57%
Owner-
occupied
33%
Comm.
Real
Estate,
53%
Comm. &
Ind., 13%
Consumer,
8%
HELOC, 8%
Res. Real
Estate, 18% |
 Non-Accrual
& Restructured Loans Non-Accrual & Restructured Loans
|
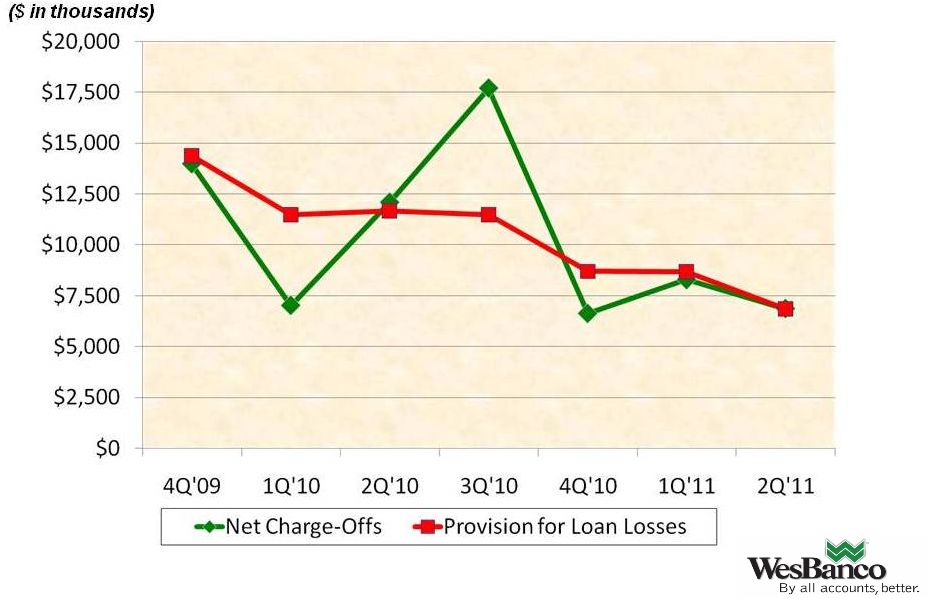 Net
Charge-Offs vs. Provision for Loan Losses Net Charge-Offs vs. Provision for Loan
Losses |
 •
National
Peer
Group
=
Average
of
94
banks
nationwide
with
assets
between
$2-$10
B.
•
Source:
SNL
Financial
Annualized Net Loan Charge-offs /
Average Loans |
 •
National
Peer
Group
=
Average
of
94
banks
nationwide
with
assets
between
$2-$10
B.
•
Source:
SNL
Financial
NPA +
90 PD Loans /
Total Loans + OREO |
 Conservative
Exposure to Potential Problem Loan Areas
Conservative Exposure to Potential Problem
Loan Areas
Exposure¹
($ Millions)
% of RBC²
Regulatory
Guideline
Land, Construction & Development
$257
53%
100%
Investor-Owned Commercial
$668
137%
N/A
Investor-Owned Multi-Family
$214
43%
N/A
Total Land, C&D, and Investor-Owned
$ 1,139
233%
300%
1
Total Loans Outstanding and Unfunded Commitments.
2
Total Risk-Based Capital = $488.3 million at 6/30/11
WSBC is Below Regulatory CRE Guidelines |
 Net Interest
Margin & Efficiency Ratio Net Interest Margin & Efficiency Ratio
|
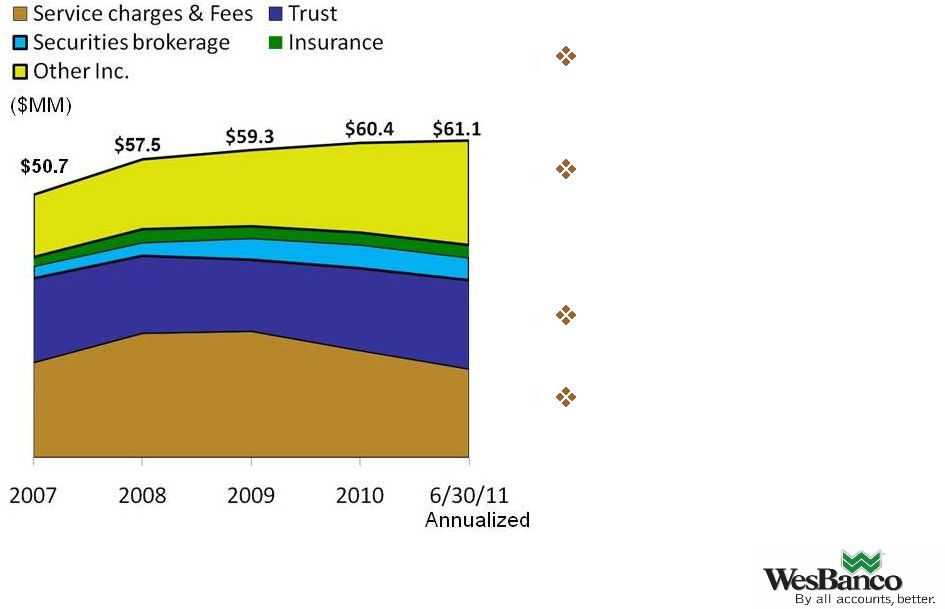 Diversified
Operating Non-interest Income* Diversified Operating Non-interest Income*
Noninterest income
contributed 26% of 2011
YTD revenue.
Non-bank offerings (trust,
insurance, securities)
contributed $12.4 million in
YTD 2011 revenue.
Trust fees are up 17.4%
year over year.
Approximate 17% decline in
service fee income for YTD
2011, as a result of mid-
2010 implemented
regulatory requirements.
* Operating non-interest income excludes G/L on securities and G/L on
sale of OREO property, see non-GAAP measures for additional
information relating to the calculation of this. |
 Interest Rate
Sensitivity Interest Rate Sensitivity
Immediate Change in
Interest Rates
% Change in Net Interest Income from
Base Over One Year
June 30, 2011
Dec. 31, 2010
Up 1% Rate Shock
+1.2%
+2.4%
Up 2% Rate Shock
Up 2% Rate Shock
+0.6%
+0.6%
+1.7%
+1.7%
Up 2% Rate Ramp
+1.5%
+2.3%
Down 1% Rate Shock
-3.7%
-2.9% |
 Investor
Remarks Investor Remarks
•
Solid
2Q:11
results
on
strengthening
PTPP
and
lower
credit
costs:
WesBanco
reported
2Q:11
GAAP
EPS
of
$0.45,
a
45%
increase
from
the
$0.31
reported
for
2Q:10
…which
was
$0.10
above
our
estimate
and
$0.07
ahead
of
the
Street.
Douglas
Rainwater,
Rodman
&
Renshaw,
July
28,
2011.
•
"Solid
upside
surprise
in
2Q11;
raising
estimates;
shares
likely
have
moderate
near-term
upside.
2Q11
earnings
entailed
the
third
consecutive
upside
surprise
and
likely
a
round
of
upward
estimate
revisions."
Kenneth
James,
Sterne
Agee,
July
27,
2011.
•
"Reported
Better-Than-Expected
2Q11
Results;
Raising
Rating
to
Outperform
and
Initiating
$23.00
Target
Price.
Matthew
Schultheis,
Boenning
&
Scattergood,
July
27,
2011.
•
"WSBC
reported
another
quarter
of
earnings
improvement,
beating
both
the
Street
and
our
estimate.
Catherine
Mealor,
Keefe,
Bruyette
&
Woods,
July
26,
2011. |
 Stability, Diversity and Capital Strength
Financial performance indicates well managed
bank.
Strong regulatory capital.
Proven acquisition-oriented growth strategy.
Excellent liquidity.
Asset quality compares favorably with peers.
Diverse earnings stream.
Potential for improved stock price. |
 Commercial
Retail
Total Loans
Upper Ohio Valley
$ 465
$ 381
$ 846
North Central WV
236
175
411
Parkersburg
204
84
288
Kanawha Valley
59
35
94
Western PA
199
14
213
Total East Markets
$ 1,163
$ 689
$ 1,852
Central Ohio
520
138
658
Southwest Ohio
329
148
477
Southeast Ohio
154
123
277
Total West Markets
$ 1,003
$ 409
$ 1,412
Total Bank
$ 2,166
$ 1,098
$ 3,264
($ in thousands) |
 90
Day PD & Accruing
Non-
Accrual
TDR
Other RE
Owned
Upper Ohio Valley
$ 1,494
$ 7,691
$ 4,200
$ 472
North Central WV
702
519
859
147
Parkersburg
956
6,099
235
188
Kanawha Valley
88
2,722
N/A
295
Western PA
105
2,538
249
275
Total East Markets
$ 3,345
$ 19,569
$ 5,543
$ 1,377
Central Ohio
1,678
17,899
18,737
2,003
Southwest Ohio
1,176
21,059
11,923
1,239
Southeast Ohio
536
3,517
232
162
Total West Markets
$ 3,390
$ 42,475
$ 30,892
$ 3,404
Total Bank
$ 6,735
$ 62,044
$ 36,435
$ 4,781
* -
Includes $0.9 Million for bank-owned hospitality property.
($ in thousands)
Appendix: Credit Quality By Market ($ thousands) |
 2Q’10
3Q’10
4Q’10
1Q’11
2Q’11
Total shareholder’s equity
$ 604,714
$ 608,287
$ 606,863
$ 611,978
$ 623,037
Less: goodwill & other
intangible assets
(286,908)
(286,228)
(285,559)
(284,941)
(284,336)
Tangible equity
317,806
322,059
321,304
327,037
338,701
Total assets
5,356,261
5,362,623
5,361,458
5,368,852
5,425,907
Less: goodwill & other
intangible assets
(286,908)
(286,228)
(285,559)
(284,941)
(284,336)
Tangible assets
$5,069,353
$5,076,395
$5,075,899
$5,083,911
$5,141,571
Tangible equity to tangible
assets
6.27%
6.34%
6.33%
6.43%
6.59%
Non-GAAP Financial Measures
Tangible equity to tangible assets
($ in thousands) |
 2Q’10
3Q’10
4Q’10
1Q’11
2Q’11
Net Interest income
$ 41,148
$ 41,986
$ 42,326
$ 41,476
$ 43,053
Plus: Non-interest income
14,585
14,976
14,997
14,504
15,019
Less: Net securities gains and
net gains/losses on other real
estate owned and other assets
(417)
327
(551)
(528)
(257)
Net revenue
$ 56,150
$ 56,635
$ 57,874
$ 56,508
$ 58,329
Non-GAAP Financial Measures
Net Revenue
($ in thousands) |
 2007
2008
2009
2010
2011
(annualized)
Non-interest Income
$ 52,939
$ 57,346
$ 64,589
$ 59,599
$ 59,531
Less: Net Securities gains
943
1,556
6,046
3,362
60
Less: losses on other real estate
owned and other assets
1,306
(1,715)
(747)
(4,128)
(1,646)
Net operating non-interest
income
$ 50,690
$ 57,505
$ 59,290
$ 60,365
$ 61,117
Non-GAAP Financial Measures
Operating non-interest income
($ in thousands) |
 2Q’10
3Q’10
4Q’10
1Q’11
2Q’11
Net income (annualized)
$ 33,043
$ 36,313
$ 40,903
$ 41,531
$ 47,805
Plus: amortization of
intangibles (annualized)
1,787
1,743
1,724
1,629
1,577
Net income before
amortization of intangibles
(annualized)
34,830
38,056
42,627
43,159
49,382
Average total shareholders’
equity
$ 604,334
$ 608,932
$ 611,497
$ 610,077
$ 619,954
Less: average goodwill & other
intangibles
(287,221)
(286,537)
(285,860)
(285,219)
(284,611)
Average tangible equity
$ 317,113
$ 322,395
$ 325,637
$ 324,858
$ 335,343
Return on average tangible
equity
10.98%
11.80%
13.09%
13.29%
14.73%
Non-GAAP Financial Measures
Return on Average Tangible Equity
($ in thousands) |
 1Q’10
2Q’10
3Q’10
4Q’10
1Q’11
2Q’11
Income before provision
for income taxes
$ 8,780
$ 9,491
$ 9,503
$12,187
$12,448
$15,564
Provision for credit losses
11,500
11,675
11,778
9,625
8,041
6,802
Taxable equivalent
adjustment
1,612
1,535
1,488
1,507
1,608
1,640
21,892
22,701
22,769
23,319
22,097
24,006
Annualized
$ 88,784
$ 91,053
$ 90,334
$ 92,516
$ 89,616
$ 96,288
Average assets
$ 5,414,341
$ 5,437,010
$ 5,422,181
$ 5,394,837
$ 5,363,365
$ 5,428,747
ROAA
1.64%
1.67%
1.67%
1.71%
1.67%
1.77%
Non-GAAP Financial Measures
ROAA: Pre-tax, Pre-provision
($ in thousands) |
 *
*
*
*
*
*
*********
*
*
*
**
*
*
* |