Attached files
| file | filename |
|---|---|
| EX-99.2 - EXHIBIT 99.2 - PROASSURANCE CORP | ex99_2.htm |
| 8-K - PROASSURANCE CORP 8-K 9-8-2011 - PROASSURANCE CORP | form8k.htm |
Exhibit 99.1

This presentation contains Forward Looking Statements and other information designed to convey
our projections and expectations regarding future results. There are a number of factors which
could cause our actual results to vary materially from those projected in this presentation. The
principal risk factors that may cause these differences are described in various documents we file
with the Securities and Exchange Commission, such as our Current Reports on Form 8-K, and our
regular reports on Forms 10-Q and 10-K, particularly in “Item 1A, Risk Factors.” Please review
this presentation in conjunction with a thorough reading and understanding of these risk factors.
We especially identify statements concerning our recently-completed acquisition of American
Physicians Service Group (NASDAQ: AMPH) as Forward Looking Statements and direct
your attention to recent filings on Forms 10K and 10Q for a discussion of risk factors
pertaining to this transaction and subsequent integration into ProAssurance.
Physicians Service Group (NASDAQ: AMPH) as Forward Looking Statements and direct
your attention to recent filings on Forms 10K and 10Q for a discussion of risk factors
pertaining to this transaction and subsequent integration into ProAssurance.
This presentation contains Non-GAAP measures, and we may reference Non-GAAP measures in
our remarks. A reconciliation of these measures to GAAP measures is available in our latest
quarterly news release, which is available in the Investor Relations section of our website,
www.ProAssurance.com, and in the related Current Reports on Form 8K disclosing that release.
our remarks. A reconciliation of these measures to GAAP measures is available in our latest
quarterly news release, which is available in the Investor Relations section of our website,
www.ProAssurance.com, and in the related Current Reports on Form 8K disclosing that release.
FORWARD LOOKING STATEMENTS
1
NON-GAAP MEASURES

Specialty writer of professional liability insurance, primarily Medical Professional Liability (MPL)
Market Cap : ~$2.1 billion
Total Assets: $4.9 billion
Shareholders’ Equity: $2.0 billion
Annualized dividend yield is 1.4%-first dividend to be paid October 13, 2011
Founded in 1975 / Demutualized to a public company in 1991
ProAssurance: Corporate Profile
Historical Book Value Per Share
Inception to 6/30/11
CAGR: 16%
CAGR: 16%
Cumulative:1653%
10 Year Summary (2001 -2010)
CAGR: 15%
CAGR: 15%
Cumulative: 297%
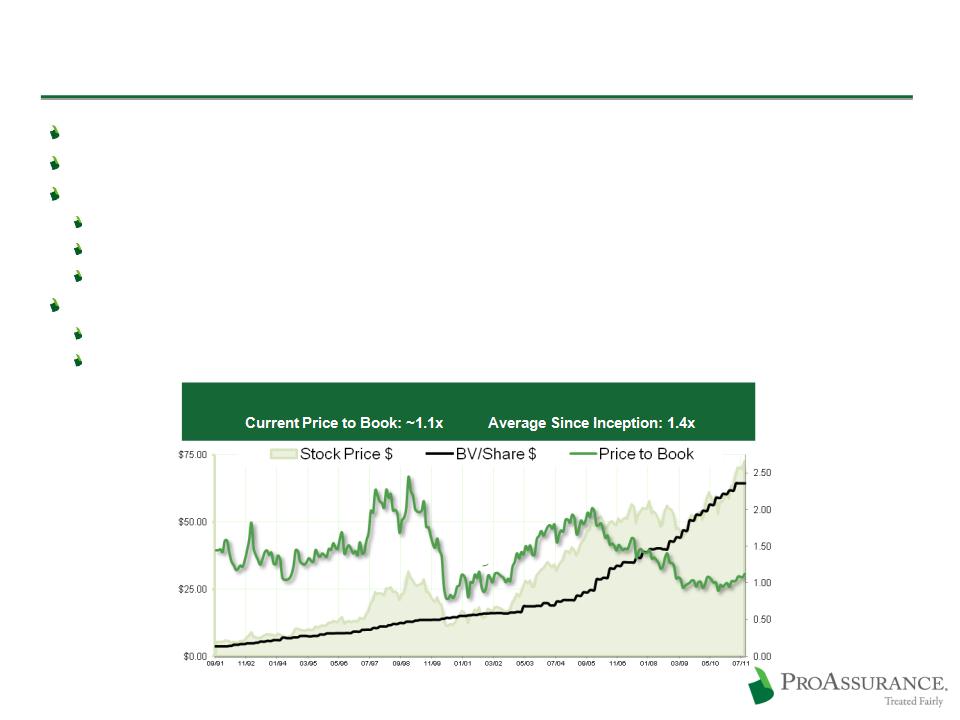
Historical Stock Price (to 8/31/11)
Inception to 8/31/11
CAGR: 14%
CAGR: 14%
Cumulative:1287%
10 Year Summary (2001 -2010)
CAGR: 14%
CAGR: 14%
Cumulative: 263%
Consistently Successful Throughout the Insurance Cycle

ProAssurance: Business Profile
Largest independent publicly traded writer of MPL insurance
Fourth largest overall writer
Top 20 writers have just 65% of the market
More than 100 writers with some share of the market
Majority of companies are mutual or similar
Few operate in more than two or three states
3
DPW: SNL & Highline Data 2010

ProAssurance: Geographic Profile
Writing across the United States, ProAssurance has broad geographic diversification
Each state presents unique medical and legal challenges
Regional structure provides the local knowledge that differentiates ProAssurance
4
Corporate Headquarters
Corporate Headquarters
Claims / Underwriting Offices
Claims / Underwriting Offices
(Birmingham)
Market Share: Six-Ten1
Market Share: Six-Ten1
ProAssurance Footprint
June 30, 2011
1 DPW: SNL & Highline Data 2010
ProForma ProAssurance and American Physicians

ProAssurance: Risk and Distribution Profile
We insure a broad range of healthcare risks, from home health providers to large hospitals
Focus on individual physicians and physician groups
Rated “A” by A.M. Best and Fitch
5
Premium & Policyholder Data is YTD, June 30, 2010
Subject to Rounding
YTD 2011 Policyholders: ~71,000
2011 YTD Premium: $276 million

M & A Update: ProAssurance & American Physicians
Financial Highlights
Expected to be modestly accretive to earnings in 2011, after one-time charges and restructuring
costs
costs
Insurance Highlights
We are now the second leading writer in Texas
Adds high quality premium and
~6,700 well-underwritten policyholders
in a challenging market
~6,700 well-underwritten policyholders
in a challenging market
Texas Highlights
Stable, constitutional Tort Reform
Generally attractive legal environment
One of the fastest growing medical populations
Strong, resilient economy
APS headquarters becomes our Texas regional office
6
We are skilled at finding M & A opportunities, conducting in-depth due diligence and integrating
resulting acquisitions
resulting acquisitions
2009: Consolidation of:
Mid-Continent General Agency
Mid-Continent General Agency
2009: Consolidation of:
Mid-Continent General Agency
Mid-Continent General Agency
Georgia Lawyers Insurance Co.
Georgia Lawyers Insurance Co.
2004: Purchased Selected Renewal Rights from:
OHIC Insurance Company
OHIC Insurance Company
2004: Purchased Selected Renewal Rights from:
OHIC Insurance Company
OHIC Insurance Company
We Expect to Continue Growing Through M & A
7
1994: Consolidation of:
West Virginia Hosp. Ins Co.
West Virginia Hosp. Ins Co.
1994: Consolidation of:
West Virginia Hosp. Ins Co.
West Virginia Hosp. Ins Co.
1995: Consolidation of;
1995: Consolidation of;
Physicians Ins Co of Indiana
Physicians Ins Co of Indiana
Assumed business of:
Physicians Ins Co of Ohio
Physicians Ins Co of Ohio
Assumed business of:
Physicians Ins Co of Ohio
Physicians Ins Co of Ohio
1996: Consolidation of:
1996: Consolidation of:
Missouri Medical Ins Co
Missouri Medical Ins Co
1995: Assumed business of:
Associated Physicians Ins Co. (IL)
Associated Physicians Ins Co. (IL)
1995: Assumed business of:
Associated Physicians Ins Co. (IL)
Associated Physicians Ins Co. (IL)
1998: Consolidation of:
Physicians Protective Trust Fund (FL)
Physicians Protective Trust Fund (FL)
1998: Consolidation of:
Physicians Protective Trust Fund (FL)
Physicians Protective Trust Fund (FL)
1996: Assumed business of:
American Medical Ins Exchange (IN)
American Medical Ins Exchange (IN)
1996: Assumed business of:
American Medical Ins Exchange (IN)
American Medical Ins Exchange (IN)
Founding in the 1970s
Founding in the 1970s
1999: Assumed business of:
Medical Defense Associates (MO)
Medical Defense Associates (MO)
1999: Assumed business of:
Medical Defense Associates (MO)
Medical Defense Associates (MO)
Mutual Assurance
Physicians Ins. Co. of Michigan
Professionals Group
Creation of:
Creation of:
2005: Consolidation of:
NCRIC Group
NCRIC Group
2005: Consolidation of:
NCRIC Group
NCRIC Group
2006: Consolidation of:
PIC Wisconsin Group
PIC Wisconsin Group
2006: Consolidation of:
PIC Wisconsin Group
PIC Wisconsin Group
2007: PRI renewal rights deal
2002: SERTA renewal rights deal
2001: OUM renewal rights deal
2000: DPM Merger
1999: PACO Acquisition
Completed
11/30/10
11/30/10

The Case for Growing Through M & A
Legal and regulatory environment must be favorable
Not all M & A opportunities should be pursued
The key is understanding why companies are available
We don’t “bet the farm” and can acquire without “breaking the bank”
We prefer “healthcare centric” but look for closely related liability lines to leverage expertise
(attorneys E & O for example)
(attorneys E & O for example)
Our strategy adapts to the available opportunities for profitable growth
De Novo vs. Acquisition
Soft Market
Hard Market
M & A
de novo
Expansion
Expansion
Internal
Growth
Growth
All avenues
open
because of
pricing
power
open
because of
pricing
power
M & A is
preferable
because of
pricing
pressure
preferable
because of
pricing
pressure
M & A and the Insurance Cycle

Strategy & Operations: Differentiation is the Key

Medical Professional Liability Stands Apart
Long-tail vs short tail
Prolonged period of “benign profitability”
Premiums remain well above levels of year 2000
No large commercial competitors have entered
the market in a meaningful manner
the market in a meaningful manner
Significant barriers to entry in underwriting and
claims handling
claims handling
No “cat” exposure
Significant policyholder retention
10
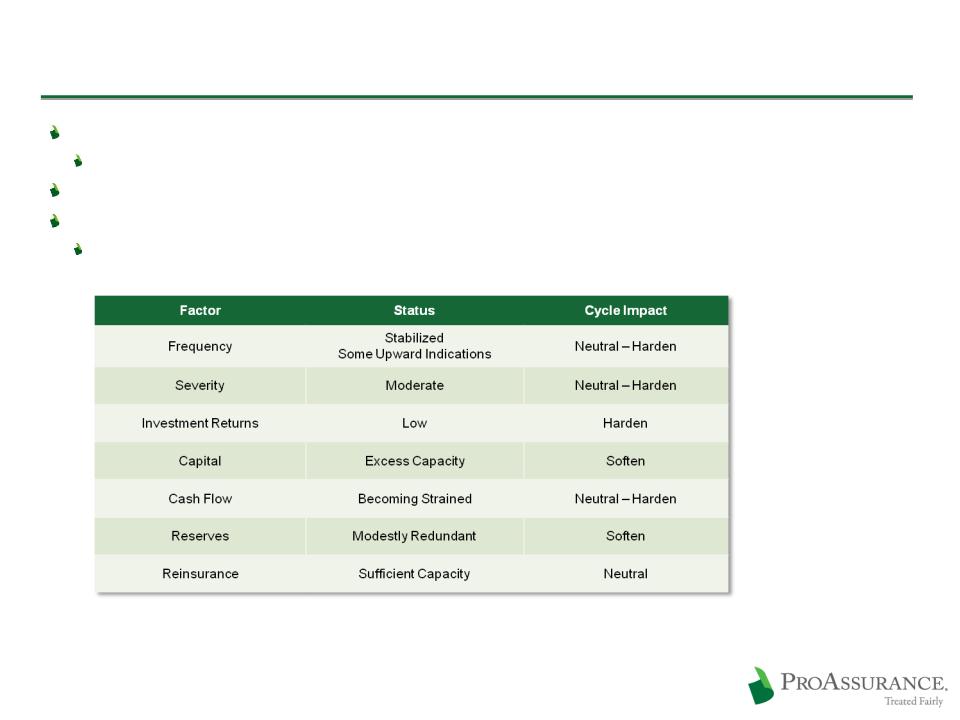
Current Industry Status
We are in a period of “benign profitability”
Prices have been falling yet profitability remains at attractive levels
We have seen no new large scale market entry from larger commercial competitors
Some consolidation among “mid-decade” start-ups
Start-up pricing advantage has vanished in current market conditions
11

Differentiate Through Claims Defense
Our deep expertise in claims defense has always set us apart
Our financial strength gives our insureds the opportunity for an uncompromising defense of their
claim
claim
Our successful approach to claims establishes a unique competitive advantage
Differentiates our product
Provides long-term financial and marketing advantages
A significant factor in our high retention rate
Helps deter future lawsuits
Our insureds increasingly value reputational defense as claims data becomes public
12
ProAssurance: 82% Favorable Outcomes
Industry: 73% Favorable Outcomes
Source: The PIAA
Five Year Average
2005-2009
2005-2009

The Ohio Example: 2005 - 2009 Data
Comprehensive, reliable data provided by the Ohio Department of Insurance
Broad range of competitors and business approaches
13
www.insurance.ohio.gov/Legal/Reports/Documents/2009ClosedClaimReport.pdf
Fewer Claims Closed With Indemnity
More Claims Defended in Court
2.5x Lower Average Indemnity Payment per Closed Claim

Malpractice Made Public
Malpractice judgments/settlements now
disclosed in 26 states
disclosed in 26 states
Disciplinary actions
now disclosed in
all states
now disclosed in
all states
Board / Discipline / Med-Mal
Med-Mal disclosure
legislation proposed
legislation proposed
P
Source: Federation of State Medical Boards National Clearinghouse and
ProAssurance research
ProAssurance research

ProAssurance Claims Tried to a Verdict
New Claims Opened Each Year
Claims Trends Remain Favorable
With frequency down compared to mid-decade the result is fewer cases to try
Severity trends steady and manageable
Trends are much the same in states with or without Tort Reform
15

Loss Trends and Rate Actions
Rates on renewing physician business down less than 14% from peak pricing in 2006
Improved frequency trends are reflected in recent rate declines
Improvement in frequency has outweighed a steady, manageable rise in severity of ~4% per year
Loss trends have improved in states with and without tort reforms
Rate changes (up or down) in 2011 will likely be low-to-mid single digits
Despite competitors’ concessions on pricing and terms, we are retaining existing business and
writing some new business that meets our long-term profitability goals
writing some new business that meets our long-term profitability goals
16
Physician Rate Change History1
Premium Retention History
1Excludes PICA for clarity of historical comparison

We enforce stringent underwriting standards to maintain rate structure and enhance profitability
Underwriting process driven by individual risk selection and assessment of loss history, areas of practice,
and location
and location
Rate filings consider the results of the past five to seven years to ensure a single year does not
unduly influence results
unduly influence results
Demonstrated Underwriting Performance
ProAssurance Average: 93.8% Industry Average: 107.4%
Source: A.M. Best Aggregates and Averages, Medical Malpractice Lines of Business
17
Conservative Approach to Reserves
No change in the historic reserving practices that have produced favorable net reserve
development in each of the last eight years
development in each of the last eight years
Conservative reserve strategy provides protection against a loss trend reversal
Reviewed at least quarterly by internal actuarial staff
Regular outside reviews
Independent consulting actuaries (Towers Watson) conduct full review twice per year
Actuaries associated with independent auditor (E&Y) review once per year
Net Favorable Reserve Development
Net Reserve per Open MPL Claim1
1 Statutory basis; Loss & LAE
Acquired company data included at end of acquiring year

Tort Reform Resurfaces
Federal Tort Reform has reappeared in Washington
Lots of smoke, so far no fire in Washington
Resurfaced during President Obama’s State of the Union Speech
Multiple bills being pushed by Republicans in the House, at least on bill introduced in the Senate
Democrats have offered to consider scaled-back reforms
Meaningful Tort Reform was not enacted when Republicans controlled Congress and the White
House
State Tort Reforms—where the real battles are fought
2011 legislative update
Reforms Passed in North Carolina, Oklahoma and Tennessee, rejected in New York
2011 courtroom update
State Supreme courts reviewing mid-2000’s reforms in Kansas, Mississippi, Nevada and WV
Long-standing reforms in California, Indiana and Louisiana also under review by State Supreme Courts
2010 courtroom results
Overturned in Georgia and Illinois
Upheld in Maryland
Split decision in Missouri
Whether federal or state, we never give advance credit for untested reforms unless required by
law or regulation
law or regulation
We are prepared, operationally and financially, if Tort Reforms are struck down in our states
Prices are set, and reserves established, as if there is no tort reform, until results reflect otherwise
19
The Potential Effects of Healthcare Reform
No meaningful Tort Reform in the bill
No immediate effect on the medical/legal climate
Demonstration projects do not provide meaningful reform or immediate data
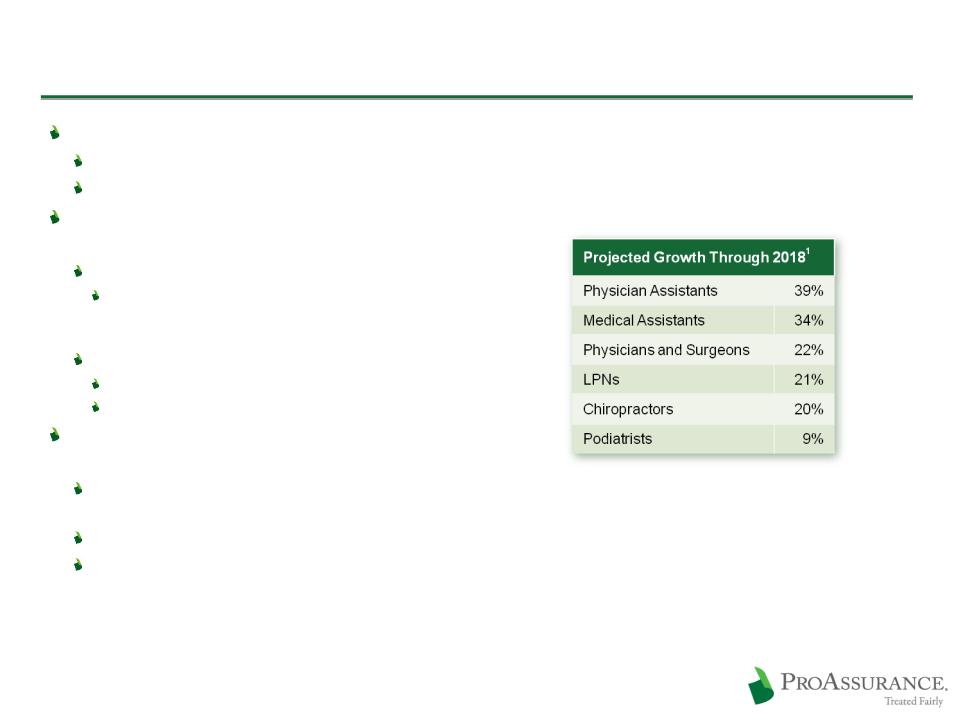
More patients will ultimately require more physicians and
ancillary providers
ancillary providers
Known: More customers for us
We have enhanced our ability to write new classes of business
through the acquisition of PICA and
ProAssurance Mid-Continent General Underwriters
through the acquisition of PICA and
ProAssurance Mid-Continent General Underwriters
Unknown: Effect on the medical/legal environment
Increased patient frustration with the system
Possibility of more unexpected outcomes
May accelerate the growing movement of insureds into
hospital-owned practices and larger groups
hospital-owned practices and larger groups
Provides an opportunity for us due to our geographic reach,
long-term experience in hospitals and our financial strength
long-term experience in hospitals and our financial strength
We are introducing new approaches and new products to take advantage
Likely to hasten M&A amongst smaller insurers that lack the capacity
or capability to insure hospitals or facilities
or capability to insure hospitals or facilities
20
1 Bureau of Labor Statistics 2008 to 2018 Projections
http://data.bls.gov/oep/nioem
http://data.bls.gov/oep/nioem

New Products for a Changing Market
Certitudetm program in conjunction with Ascension Health
Largest Catholic healthcare system in the US
38 ministry locations in 18 states
Initial offering to ~1,000 physicians insured by an Ascension affiliate
Now expanding to Ascension-affiliated physicians insured in the open market
Insurance operations performed by ProAssurance
PRA policies jointly marketed
Coordinated claims and risk management efforts
Financial involvement of both entities creates incentive to reduce risk
Program enjoying widespread acceptance among targeted physicians
Joint physician/hospital insurance product: ProControl
Addresses the unique risk tolerance and claims-handling expectation of each insured
Physicians largely seek claims defense to protect their reputation
Hospitals/facilities seek to protect their reputation in different ways
Broad interest in the market
Alternative risk and self-insurance mechanisms
Captive insurance and sophisticated risk sharing programs
Risk Retention Groups for specific specialties or regions
21

Financial Performance and Investments

Steady Return in an Unfavorable Environment
Meeting our long-term ROE target of 12% -14%
Components of Return on Equity (in millions)

Long-Term Financial Strength Sets Us Apart
Ensuring the strength of our balance sheet is our top financial priority
Financial strength differentiates us in the market
The claims defense philosophy that differentiates us in the market leverages our financial strength
24
Shareholders’ Equity
Up Over 70% Since 12/31/06
Total Assets
25
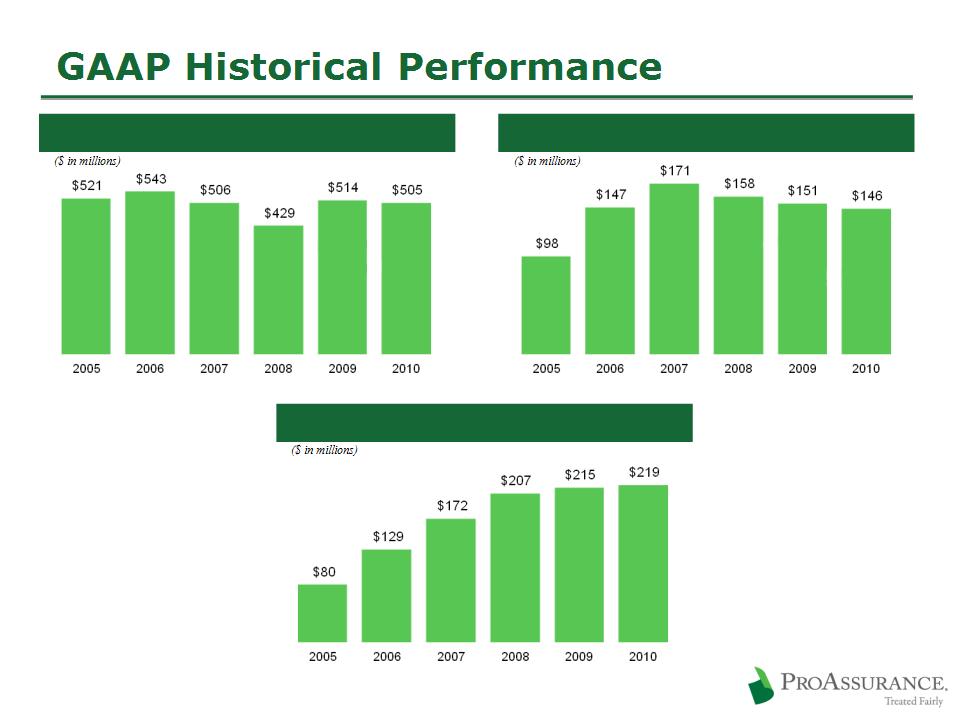
Consolidated Operating Net Income1
Net Investment Income
Net Premiums Written
1 Excludes the after-tax effects of net realized gains or losses and guaranty fund assessments or recoupments

Capital Growth: 2006-2010
in $000’s except total equity (000,000’s)
26

Capital Management
Initial Dividend Announced September 7, 2011
$0.25/share, annualized yield 1.4%
Record date: September 29, 2011
Payment date: October 13, 2011
27
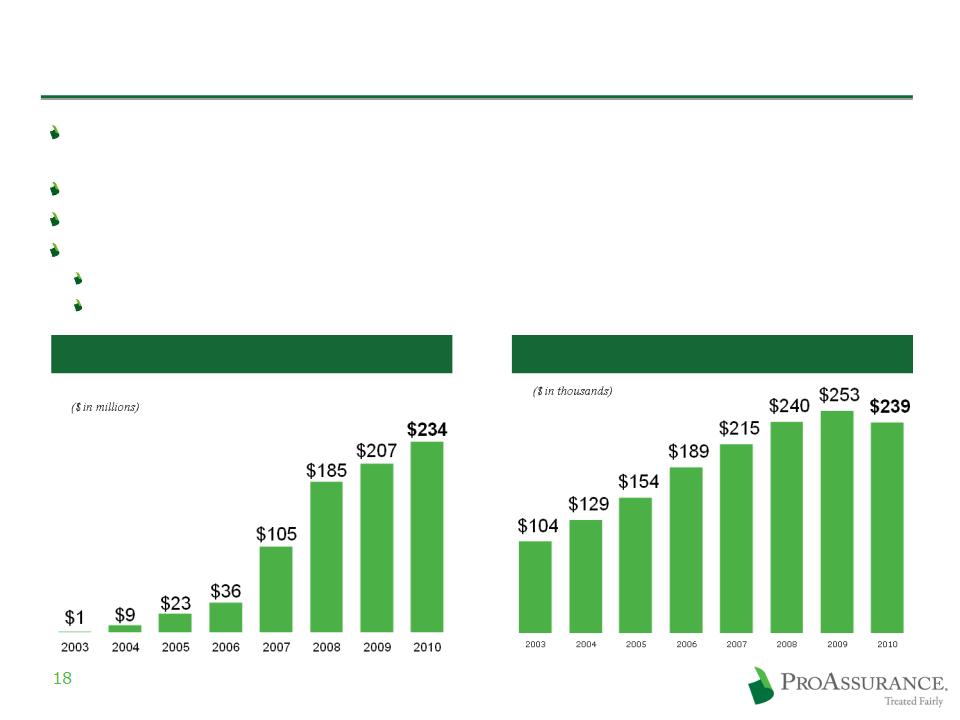
Share Repurchase
$106 million spent in 2010 to buy
1.9 million shares
1.9 million shares
$315 million spent to repurchase 6.0 million shares
since 2005
since 2005
Proven discipline in prudently deploying
capital
capital
Building the company and enhancing return
through M&A
through M&A
Enhancing shareholder value by repurchasing
shares at prices that build Book Value
shares at prices that build Book Value
Share Repurchase History
Conceptual Model of Projected A. M. Best BCAR Scores if
Premiums Increase
Surplus is Reduced
Excess Capital vs. Excess Capacity

Conservative Use of Debt and Low Leverage
Low Debt to Cap Ratio
No strain on cash flow
28
Debt to Equity
No Debt Prior to 2001
Strong Capital Position
Prepared for an improving market

Investments Balance Risk vs. Return
29
$4 Billion Overall Portfolio
$3.6 Billion Fixed Income Portfolio
Average duration: 4.1 years
Average tax-equivalent yield: 4.7%
Investment grade: 97%
Weighted average: AA-
6/30/11
Key actions in Q2
Added short ABS
Added Governments to mitigate concerns
over spread widening
over spread widening
CUSIP-level portfolio disclosure on our website:
www.proassurance.com/investorrelations/supplemental.aspx
www.proassurance.com/investorrelations/supplemental.aspx

Pricing discipline becomes even more
critical in a low interest rate environment
critical in a low interest rate environment
Lack of investment yield may be a hard
market catalyst
market catalyst
Return on Equity and Investment Returns
30
Assumes a 1:1 premium to surplus ratio for physicians professional liability claims-made coverages
Combined Ratio Required to
Generate a 13% Return on Equity
Generate a 13% Return on Equity
Long-Term ROE Target is 13%
The choice: chase yield or extend duration
We are maintaining duration, looking for
opportunities
opportunities
The Yield Trap

Investing in ProAssurance

Effective, Experienced & Invested Management
32
All subject to share ownership requirements
Driven to Excel / Focused on Shareholder Value
Maintaining our profitability and book value growth
Outstanding performance in a challenging financial market and a demanding line of insurance
Producing sustainable shareholder value
Finding the right M & A opportunities
Growing Book Value per Share
Significant share ownership at all levels
Focusing on long-term
Preparing for a changing market while maintaining our leading position in the current market
Protecting the balance sheet and preparing for the market turn
33
Current Prices Present a Compelling Buying Opportunity

Supplemental Discussion Materials

Performance Recognition
Leading industry operating performance
in 2009, ranked by Moody’s top 100
property & casualty insurers
in 2009, ranked by Moody’s top 100
property & casualty insurers
ProAssurance ranks 79th by premium, but
outperforms in key financial measures
outperforms in key financial measures
Fifth straight year in the Ward’s 50
Recognition as one of the 50 top
performing Property & Casualty
insurance companies
performing Property & Casualty
insurance companies
35
Source: Moody’s - Statistical Handbook, Ward Group’s - 2010 Ward’s 50
Lower is better
Operating Ratio
PRA 2008 Rank: #1
Combined Ratio
PRA 2008 Rank: #2
Loss & LAE Ratio
PRA 2008 Rank: #5
Return on Surplus
PRA 2008 Rank: #1
PRA 2008 Rank: #5

2011 Year-to-Date Financial Highlights
36
|
|
Six Months Ended June 30,
|
|
|
|
2011
|
2010
|
|
Gross Premiums Written
|
$ 276,115
|
$ 255,699
|
|
Net Premiums Earned
|
269,140
|
248,825
|
|
Net Investment Income
|
72,457
|
74,709
|
|
Net Income (Includes Investment Losses)
|
102,790
|
78,493
|
|
Operating Income
|
98,642
|
81,844
|
|
Net Income per Diluted Share
|
$ 3.33
|
$ 2.40
|
|
Operating Income per Diluted Share
|
$ 3.20
|
$ 2.50
|
|
|
|
|
|
|
June 30, 2011
|
December 31, 2010
|
|
Total Assets
|
$ 4,926,607
|
$ 4,875,056
|
|
Shareholders’ Equity
|
1,966,364
|
1,855,863
|
2010 Financial Highlights
37
|
|
December 31
|
|
|
|
2010
|
2009
|
|
Gross Premiums Written
|
$ 533,205
|
$ 553,922
|
|
Net Premiums Earned
|
519,107
|
497,543
|
|
Net Investment Income
|
146,380
|
150,945
|
|
Net Income (Includes Investment Losses)
|
231,598
|
222,026
|
|
Operating Income
|
219,457
|
215,210
|
|
Net Income per Diluted Share
|
$ 7.20
|
$ 6.70
|
|
Operating Income per Diluted Share
|
$ 6.82
|
$ 6.49
|
|
|
December 31
|
|
|
|
2010
|
2009
|
|
Total Assets
|
$ 4,875,056
|
$ 4,647,414
|
|
Shareholders’ Equity
|
1,855,863
|
1,704,595
|

ProAssurance Portfolio Detail: Asset Backed
38
6/30/11
Asset Backed: $743 Million
Weighted Average Rating: “AA+”
Breakdown of Agency MBS Holdings
CMBS Details Provided on Page 36
Sub-Prime: $9.1 mln Market Value (AFS)
$1.0 mln net unrealized loss
$1.0 mln net unrealized loss
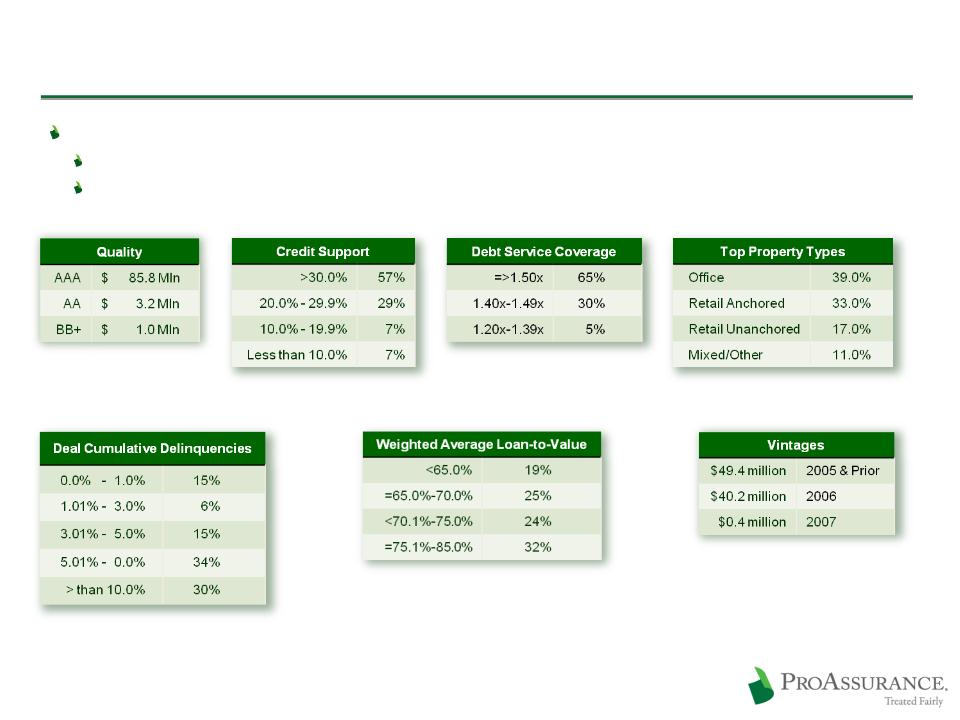
ProAssurance Portfolio Detail: CMBS
$90.0 million Fair Value in non-agency CMBS
Book Value: $86 million (2% of fixed income portfolio)
We have experienced no losses on our CMBS positions.
39
6/30/11
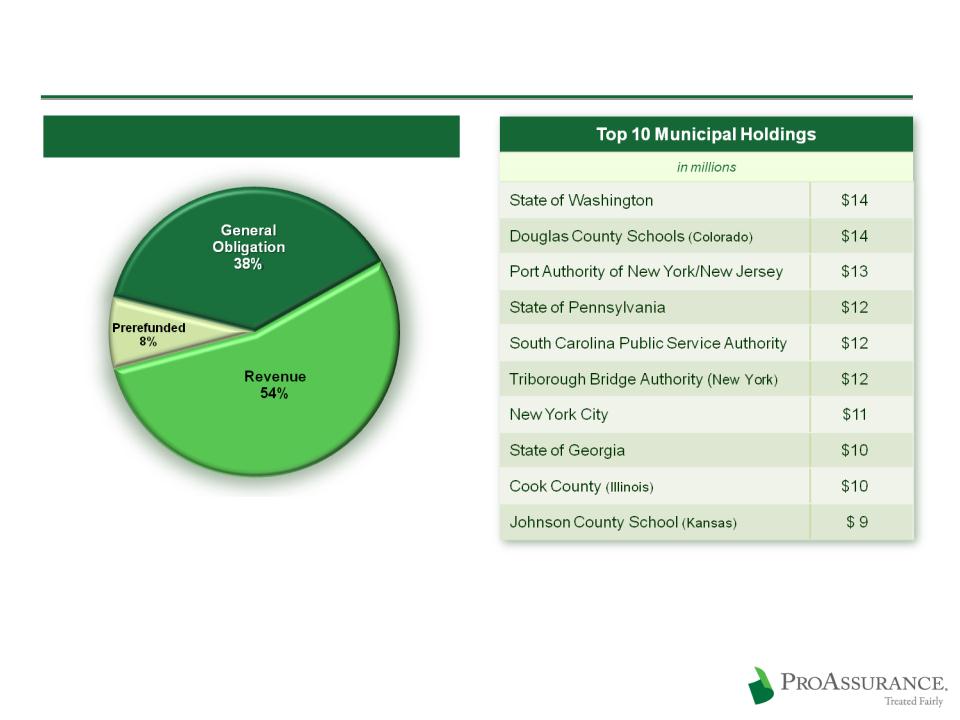
ProAssurance Portfolio Detail: Municipals
40
Municipals: $1.2 Billion / Average Rating is AA
Investment policy has always required
investment grade rating prior to applying the
effect of insurance
investment grade rating prior to applying the
effect of insurance
Weighted Average Rating: AA
6/30/11

ProAssurance Portfolio Detail: Equities & Other
41
Equities & Other: $189 Million
6/30/11

ProAssurance Portfolio Detail: Corporate
42
Corporates: $1.4 Billion
Weighted Average Rating: A
6/30/11

ProAssurance Portfolio Detail: Various
Rated A1/P1 or better
Money Markets:
Moody’s: Aaa
S&P: AAA
Weighted average rating
Moody’s: AA3
S&P: AA-
A. M. Best: A+
Treasury / GSE: $368 Million
Short Term: $129 Million
BOLI: $51 Million
6/30/11