Attached files
| file | filename |
|---|---|
| 8-K - FORM 8-K - DYNEX CAPITAL INC | d8k.htm |
 Dynex
Capital, Inc. Midwest IDEAS Conference
August 31, 2011
Exhibit 99.1 |
 2
Safe Harbor Statement
NOTE:
This
presentation
contains
“forward-looking
statements”
within
the
meaning
of
the
Private
Securities
Litigation
Reform
Act
of
1995,
including
statements
about
projected
future
investment
strategies
and
leverage
ratios,
financial
performance,
the
projected
impact
of
NOL
carryforwards,
future
dividends
paid
to
shareholders,
and
future
investment
opportunities
and
capital
raising
activities.
The
words
“will,”
“believe,”
“expect,”
“forecast,”
“anticipate,”
“intend,”
“estimate,”
“assume,”
“project,”
“plan,”
“continue,”
and
similar
expressions
also
identify
forward-looking
statements
that
are
inherently
subject
to
risks
and
uncertainties,
some
of
which
cannot
be
predicted
or
quantified.
Although
these
forward-
looking
statements
reflect
our
current
beliefs,
assumptions
and
expectations
based
on
information
currently
available
to
us,
the
Company’s
actual
results
and
timing
of
certain
events
could
differ
materially
from
those
projected
in
or
contemplated
by
these
statements.
Our
forward-looking
statements
are
subject
to
the
following
principal
risks
and
uncertainties:
our
ability
to
find
suitable
reinvestment
opportunities;
changes
in
economic
conditions;
changes
in
interest
rates
and
interest
rate
spreads,
including
the
repricing
of
interest-earnings
assets
and
interest-bearing
liabilities;
our
investment
portfolio
performance
particularly
as
it
relates
to
cash
flow,
prepayment
rates
and
credit
performance;
adverse
reactions
in
financial
markets
related
to
the
budget
deficit
or
national
debt
of
the
United
States
government;
potential
or
actual
default
by
the
United
States
government
on
Treasury
securities;
and
potential
or
actual
downgrades
to
the
sovereign
credit
rating
of
the
United
States
or
the
credit
ratings
of
GSEs;
the
cost
and
availability
of
financing;
the
cost
and
availability
of
new
equity
capital;
changes
in
our
use
of
leverage;
the
quality
of
performance
of
third-party
service
providers
of
our
loans
and
loans
underlying
our
securities;
the
level
of
defaults
by
borrowers
on
loans
we
have
securitized;
changes
in
our
industry;
increased
competition;
changes
in
government
regulations
affecting
our
business;
government
initiatives
to
support
the
U.S
financial
system
and
U.S.
housing
and
real
estate
markets;
GSE
reform
or
other
government
policies
and
actions;
and
an
ownership
shift
under
Section
382
of
the
Internal
Revenue
Code
that
impacts
the
use
of
our
tax
NOL
carryforward.
For
additional
information,
see
the
Company’s
Annual
Report
on
Form
10-K
for
the
year
ended
December
31,
2010,
the
Company’s
Quarterly
Reports
on
Form
10-Q
for
the
quarters
ended
March
31,
2011
and
June
30,
2011,
and
other
reports
filed
with
and
furnished
to
the
Securities
and
Exchange
Commission. |
 3
Our Guiding Principles
Our Core Values
Generate dividends for our shareholders
Manage leverage conservatively
Remain owner-operators
Maintain a culture of integrity and employ the highest ethical standards
Provide a strong risk-management culture
Focus on long-term shareholder value while preserving capital
Our Mission
Manage a successful public mortgage REIT with a focus on capital
preservation and providing risk-adjusted returns reflective of a diversified,
leveraged fixed income portfolio. |
 4
DX Snapshot
Company Highlights
Internally managed REIT commenced operations in 1988
Significant insider ownership and experienced management team
Diversified investment strategy in residential and commercial mortgage assets
Large NOL carryfoward for unique total return opportunity
Market Highlights (all as of 8/24/11)
NYSE Stock Ticker
DX
Shares Outstanding
40,344,434
Quarterly Dividend/Dividend Yield
$0.27/12%
Share Price
$9.03
Price to Book
0.94
Market Capitalization
$364.3 million |
 5
Important Macro Themes
Multiple factors combining to depress economic activity –
recession risk has increased
Global risk remains high particularly in the Eurozone
Fed maintaining its very accommodative posture
Government policy/regulations continue to influence investment
returns
Financing environment is still strong but anxious over global
events
Increasing volatility and prepayment concerns have impacted
asset valuations
GSE reform will ultimately eliminate a substantial buyer of
mortgage credit risk
Securitization markets are healing slowly but unevenly |
 6
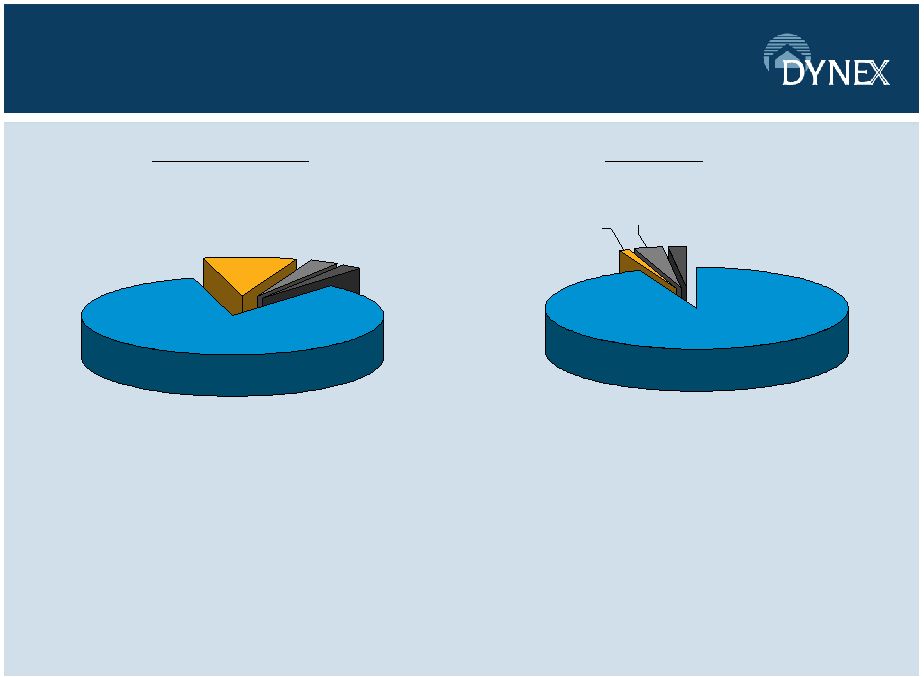
Investment Portfolio as of June 30, 2011
A
3%
AA
1%
Below A
2%
AAA
94%
Seasoned
DX
RMBS/loans
2.14%
Agency MBS
84.21%
Other
CMBS/
RMBS
3.10%
Seasoned
DX
CMBS/loans
9.87%
•
High quality portfolio of primarily short-duration Agency MBS
•
94% AAA/Agency securities, 98% rated A or higher
•
Relative to most other diversified REITs, Dynex maintains a higher credit quality
portfolio (1)
Percentages based on asset carrying basis.
Composition
(1)
Ratings
(1) |
 7
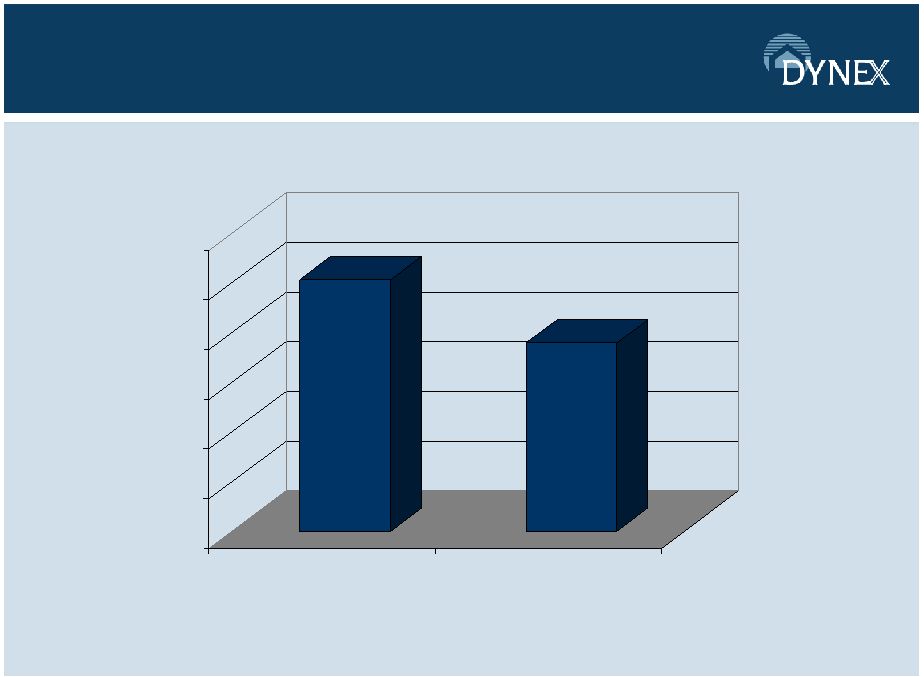
Credit Portfolio Comparisons
$101.30
$75.83
$-
$20
$40
$60
$80
$100
$120
DX
Wgt Average of Other
Hybrid REITs
Average June 30, 2011 Portfolio Non-Agency Price
(1)
Figures exclude non-Agency interest-only securities.
(2)
Consists of the weighted average of dollar prices for non-Agency investments as of June
30, 2011 for MFA, IVR, and TWO as disclosed in each company’s 10-Q for
quarter ended June 30, 2011. (1)
(2) |
 8
Interest Rate Risk
Change in Value from Change in Rates
Portfolio Value
(2)
Equity Value
(3)
Ticker
+50
+75
+100
+75
+100
AGENCY MBS
NLY
5.7x
-.96%
-1.58%
-9.01%
ANH
7.0x
-2.40%
-16.80%
HTS
7.4x
-0.56%
-1.76%
-13.02%
AGNC
7.5x
-0.50%
-1.20%
-9.00%
CYS
8.1x
-2.03%
-3.09%
-25.03%
ARR
8.7x
-1.61%
-2.70%
-23.54%
DIVERSIFIED MBS
DX
5.9x
-0.40%
-0.90%
-5.31%
IVR
5.7x
-0.58%
-1.34%
-7.64%
MFA
3.3x
-0.36%
-0.84%
-2.77%
TWO
4.5x
-0.30%
-0.70%
-4.60%
CIM
1.9x
-3.35%
-5.08%
-9.65%
(1) As disclosed in each company’s 10-Q for quarter ended June 30,
2011. Ratios are dependent on each company’s method of calculation.
(2)
As
of
June
30,
2011,
as
disclosed
in
each
company’s
10-Q
for
quarter
ended
June
30,
2011.
Percentages
are
dependent
on
each
company’s
assumptions,
as
disclosed in their 10-Qs.
(3) Figure shown for TWO is disclosed in 10-Q for quarter ended June 30,
2011. All others equal estimated % decrease for the +75/+100 scenarios multiplied by
estimated company leverage, and is meant to show the potential change in equity
value for the corresponding change in rates. Estimated
Company
Leverage
(1) |
 9
Potential Return Profile for Prospective
Investments as of August 24, 2011
The
above
portfolio
is
for
illustrative
purposes
only,
does
not
represent
actual
or
expected
performance
and
should
not
be
relied
upon
for
any
investment
decision.
The
range
of
returns
on
equity
is
based
on
certain
assumptions,
including
assumptions
relating
to
asset
allocation
percentages
and
spreads
where
new
mortgage
assets
can
be
acquired
versus
a
current
cost
of
funds
to
finance
acquisitions
of
those
assets.
Rates
used
represent
a
range
of
asset
yields
and
financing
costs
based
on
data
available
as
of
the
date
referenced
above.
Any
change
in
the
assumed
yields,
financing
costs
or
assumed
leverage
could
materially
alter
the
company’s
returns.
The
performance
results
above
do
not
include
assumption
for
the
deduction
of
investment
advisory
fees,
expenses,
or
commissions.
The
performance
results
assume
that
no
cash
was
added
to
or
assets
withdrawn
from
the
portfolio
and
that
all
dividends,
gains
and
other
earnings
in
the
portfolio
were
reinvested.
There
can
be
no
assurance
that
asset
yields
or
financing
costs
will
remain
at
current
levels.
For
a
discussion
of
risks
that
may
affect
our
ability
to
implement
strategy
and
other
factors
which
may
affect
our
potential
returns,
please
see
the
section
entitled
“Risk
Factors”
in
our
Annual
Report
on
Form
10-K
for
the
year
ended
December
31,
2010
and
our
Quarterly
Report
on
Form
10-Q
for
the
quarter
ended
June
30,
2011.
Investment
Range of
Prices
Range of
yields
Range of net
spread to
funding
Range of
ROEs
Agency
RMBS
103-109
2.3%-
3.2%
1.3%-2.8%
13%-28%
CMBS
103-111
3.0%-3.6%
1.3%-1.9%
13%-19%
Non–Agency
‘AAA’
RMBS
90-102
3.6%-6.0%
2.6%-4.0%
14%-21%
‘AAA’
CMBS
95-105
3.9%-6.9%
2.0%-4.0%
14%-20% |
 10
Balance Sheet Overview
as of June 30, 2011
(1) Associated financing for investments includes repurchase agreements, securitization
financing issued to third parties and TALF financing (the latter two of which are
presented on the Company’s balance sheet as “non-recourse collateralized financing”).
(2) Includes hedging instruments, cash and cash equivalents, and other assets/other
liabilities. |
 11
Earnings –
Paid and Retained
We Pay a Dividend AND Generate and Retain Earnings
(Utilizing our NOL) to Grow Book Value
($0.10)
$0.00
$0.10
$0.20
$0.30
$0.40
$0.50
1Q09
2Q09
3Q09
4Q09
1Q10
2Q10
3Q10
4Q10
1Q11
2Q11
Dividends Declared
Excess Earnings Retained |
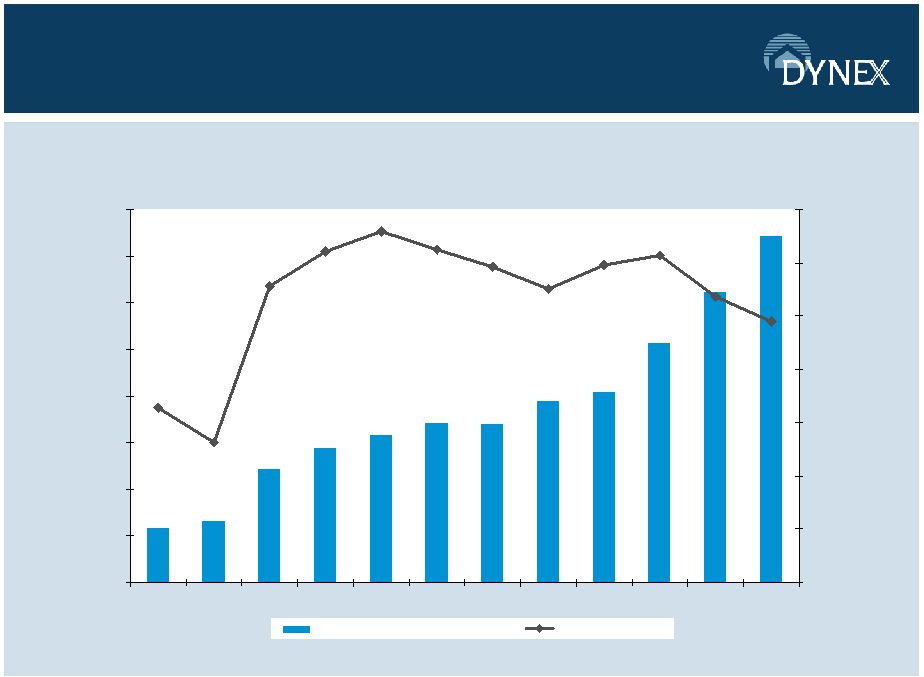 12
Investment Portfolio Income and Spread
$0
$2,000
$4,000
$6,000
$8,000
$10,000
$12,000
$14,000
$16,000
3Q08
4Q08
1Q09
2Q09
3Q09
4Q09
1Q10
2Q10
3Q10
4Q10
1Q11
2Q11
0.00%
0.50%
1.00%
1.50%
2.00%
2.50%
3.00%
3.50%
Net interest income after provision
Net interest spread
$ in thousands |
 13
Portfolio Leverage
3.3x
3.3x
4.1x
4.3x
4.3x
4.7x
4.4x
4.2x
3.8x
4.6x
5.2x
5.9x
0.0x
2.0x
4.0x
6.0x
3Q08
4Q08
1Q09
2Q09
3Q09
4Q09
1Q10
2Q10
3Q10
4Q10
1Q11
2Q11 |
 14
Why Dynex
Excellent long term performance record
Strong and defensive balance sheet positioned to weather market
volatility
Experienced management with a track record of disciplined capital
deployment through multiple economic cycles
Alignment of interests with shareholders due to owner-operator
structure
Complementary investment opportunities exist with attractive
return profiles consistent with our investment philosophy
Opportunistic capital raises have increased shareholder value
without significant book value dilution |
 Appendix |
 16
Long Term Performance
Five Year Total Return
Source: SNL Financial.
(1)
Based on beginning share price of $6.99 on 8/24/06 and ending share price of $9.00 on 8/23/11.
Assumes reinvestment of dividends. (2)
SNL U.S. Finance REIT: Includes all publicly traded (NYSE, NASDAQ, OTC BB, Pink Sheets)
Investment Companies with the following primary focuses: MBS REIT, Mortgage REIT, and
Specialty Finance REITs in SNL’s coverage universe. DX(+85.25%)
(1)
SNL U.S. Finance REIT
(2)
S&P 500 (-0.02%) |
  17
Management Team
Experienced team of professionals with a combined 80 years of experience
managing mortgage REITs and mortgage portfolios
•
Thomas
B.
Akin
–
Chairman
and
Chief
Executive
Officer
–
32 years of experience in the industry and 7 years at Dynex
–
Chairman since 2003 and CEO since 2008
–
Managing Member of Talkot Capital, LLC
–
16 years at Merrill Lynch and Salomon Brothers
•
Byron
L.
Boston
–
Chief
Investment
Officer
–
27 years of experience in the industry with 3 years as CIO at Dynex
–
13 years managing levered multi-product portfolios at Freddie Mac and Sunset Financial
Resources –
11 years trading MBS on Wall Street
–
3 years Senior Corporate Lending Officer at Chemical Bank
•
Stephen
J.
Benedetti
–
Chief
Financial
Officer
and
Chief
Operating
Officer
–
21 years of experience in the industry
–
Employed at Dynex for 16 years in various treasury, risk management and financial reporting
roles –
Managed Dynex from 2002 –
2007
–
Began career at Deloitte & Touche
•
Portfolio
Management
Team
–
5
member team with a collective 65 years of industry experience with broad and deep skill sets
in both agency and non-agency investment strategies |