Attached files
| file | filename |
|---|---|
| EXCEL - IDEA: XBRL DOCUMENT - SUNRISE REAL ESTATE GROUP INC | Financial_Report.xls |
| EX-31.2 - EXHIBIT 31.2 - SUNRISE REAL ESTATE GROUP INC | v228424_ex31-2.htm |
| EX-32.1 - EXHIBIT 32.1 - SUNRISE REAL ESTATE GROUP INC | v228424_ex32-1.htm |
| EX-31.1 - EXHIBIT 31.1 - SUNRISE REAL ESTATE GROUP INC | v228424_ex31-1.htm |
UNITED STATES
SECURITIES AND EXCHANGE COMMISSION
Washington, D. C. 20549
FORM 10-Q
x QUARTERLY REPORT PURSUANT TO SECTION 13 OR 15(d) OF THE SECURITIES
EXCHANGE ACT OF 1934
For the quarterly period ended June 30, 2011
¨ TRANSITION REPORT PURSUANT TO SECTION 13 OR 15(d) OF THE SECURITIES
EXCHANGE ACT OF 1934
For the transition period from __________ to __________
Commission File Number 000-32585
SUNRISE REAL ESTATE GROUP, INC.
(Exact name of registrant as specified in its charter)
|
Texas
|
75-2713701
|
|
|
(State or other jurisdiction of
incorporation or organization) |
(I.R.S. Employer Identification No.)
|
Suite 701, No. 333, Zhaojiabang Road
Shanghai, PRC 200032
(Address of principal executive offices Zip Code)
Registrant’s telephone number: + 86-21-6422-0505
Indicate by check mark whether the registrant (1) has filed all reports required to be filed by Section 13 or 15(d) of the Securities Exchange Act of 1934 during the preceding 12 months (or for such shorter period that the registrant was required to file such reports), and (2) has been subject to such filing requirements for the past 90 days.
Yes x No ¨
Indicate by check mark whether the registrant has submitted electronically and posted on its corporate Web site, if any, every Interactive Data File required to be submitted and posted pursuant to Rule 405 of Regulation S-T (§232.405 of this chapter) during the preceding 12 months (or for such shorter period that the registrant was required to submit and post such files.) Yes x No ¨
Indicate by check mark whether the registrant is a large accelerated filer, an accelerated filer, a non-accelerated filer, or a smaller reporting company. See the definitions of “large accelerated filer,” “accelerated filer” and “smaller reporting company” in Rule 12b-2 of the Exchange Act. (Check one):
|
Large accelerated filer ¨
|
Accelerated filer ¨
|
|
Non-accelerated filer ¨
|
Smaller reporting company x
|
Indicate by checkmark whether the registrant is a shell company (as defined in Rule 12b-2 of the Exchange Act): Yes ¨ No x
Indicate the number of shares outstanding of each of the issuer's classes of common stock, as of the latest practicable date: August 10, 2011 - 26,191,925 shares of Common Stock
FORM 10-Q
For the Quarter Ended June 30, 2011
INDEX
|
|
Page
|
||
|
PART I. FINANCIAL INFORMATION
|
3
|
||
|
Item 1.
|
Financial Statements
|
3
|
|
|
Consolidated Balance Sheets
|
3
|
||
|
Consolidated Statements of Operations
|
4
|
||
|
Consolidated Statements of Cash Flows
|
5
|
||
|
Item 2.
|
Management’s Discussion and Analysis of Financial Condition and Results of Operations
|
14
|
|
|
Item 3.
|
Quantitative and Qualitative Disclosures About Market Risk
|
21
|
|
|
Item 4.
|
Controls and Procedures
|
22
|
|
|
PART II. OTHER INFORMATION
|
22
|
||
|
Item 1.
|
Legal Proceedings
|
22
|
|
|
Item 2.
|
Unregistered Sales of Equity Securities and Use of Proceeds
|
22
|
|
|
Item 3.
|
Defaults Upon Senior Securities
|
22
|
|
|
Item 4.
|
(Removed and Reserved)
|
22
|
|
|
Item 5.
|
Other Information
|
22
|
|
|
Item 6.
|
Exhibits
|
22
|
|
|
SIGNATURES
|
23
|
||
2
PART I - FINANCIAL INFORMATION
ITEM 1. FINANCIAL STATEMENTS
Sunrise Real Estate Group, Inc.
Unaudited Condensed Consolidated Balance Sheets
(Expressed in US Dollars)
|
June 30,
|
December 31,
|
|||||||
|
2011
|
2010
|
|||||||
|
(Unaudited)
|
(Audited)
|
|||||||
|
ASSETS
|
||||||||
|
Current assets
|
||||||||
|
Cash and cash equivalents
|
$ | 1,430,075 | $ | 2,973,997 | ||||
|
Restricted cash
|
1,313,431 | 1,283,464 | ||||||
|
Accounts receivable
|
781,791 | 258,338 | ||||||
|
Promissory deposits (Note 3)
|
653,625 | 1,136,999 | ||||||
|
Other receivables and deposits (Note 4)
|
4,442,598 | 378,751 | ||||||
|
Total current assets
|
$ | 8,621,520 | $ | 6,031,548 | ||||
|
Property, plant and equipment – net (Note 5)
|
2,482,658 | 2,571,516 | ||||||
|
Investment properties (Note 6)
|
7,057,416 | 7,208,534 | ||||||
|
Long-term investment
|
1,545,213 | 1,509,958 | ||||||
|
Total assets
|
$ | 19,706,807 | $ | 17,321,557 | ||||
|
LIABILITIES AND SHAREHOLDERS’ DEFICIT
|
||||||||
|
Current liabilities
|
||||||||
|
Bank loans (Note 7)
|
$ | 10,816,490 | $ | 8,304,770 | ||||
|
Promissory notes payable (Note 8)
|
469,521 | 903,983 | ||||||
|
Accounts payable
|
78,239 | 86,928 | ||||||
|
Amount due to directors (Note 9)
|
146,985 | 189,837 | ||||||
|
Amount due to related party (Note 9)
|
2,871,870 | 98,123 | ||||||
|
Other payables and accrued expenses (Note 10)
|
3,826,540 | 3,092,565 | ||||||
|
Other tax payable (Note 11)
|
286,274 | 266,714 | ||||||
|
Income tax payable
|
1,220,606 | 1,318,366 | ||||||
|
Total current liabilities
|
$ | 19,716,525 | $ | 14,261,286 | ||||
|
Long-term bank loans (Note 7)
|
2,264,937 | |||||||
|
Deposits received from underwriting sales (Note 13)
|
3,332,864 | 3,454,879 | ||||||
|
Total liabilities
|
$ | 23,049,389 | $ | 19,981,102 | ||||
|
Noncontrolling interests of consolidated subsidiaries
|
$ | 1,412,001 | 1,188,110 | |||||
|
Commitments and contingencies (Note 12)
|
||||||||
|
Shareholders’ deficit
|
||||||||
|
Common stock, par value $0.01 per share; 200,000,000 shares authorized; 26,191,925 shares issued and outstanding as of June 30, 2011 and 23,691,925 as of December 31, 2010
|
261,919 | 236,919 | ||||||
|
Additional paid-in capital
|
4,095,008 | 3,620,008 | ||||||
|
Statutory reserve (Note 14)
|
787,461 | 787,461 | ||||||
|
Accumulated losses
|
(10,563,169 | ) | (9,225,986 | ) | ||||
|
Accumulated other comprehensive income (Note 15)
|
664,198 | 733,944 | ||||||
|
Total shareholders’ deficit
|
(4,754,583 | ) | (3,847,655 | ) | ||||
|
Total liabilities and shareholders’ equity deficit
|
$ | 19,706,807 | $ | 17,321,557 | ||||
See accompanying notes to consolidated financial statements.
3
Sunrise Real Estate Group, Inc.
Unaudited Condensed Consolidated Statements of Operations
(Expressed in US Dollars)
|
Three Months Ending June 30,
|
Six Months Ending June 30,
|
|||||||||||||||
|
2011
|
2010
|
2011
|
2010
|
|||||||||||||
|
(Unaudited)
|
(Unaudited)
|
(Unaudited) |
(Unaudited)
|
|||||||||||||
|
Net Revenues
|
$ | 2,120,724 | $ | 2,942,915 | $ | 4,725,348 | $ | 7,642,434 | ||||||||
|
Cost of Revenues
|
$ | (1,545,481 | ) | (2,106,356 | ) | (3,284,822 | ) | (4,123,068 | ) | |||||||
|
Gross Profit
|
575,243 | 836,559 | 1,440,526 | 3,519,366 | ||||||||||||
|
Operating Expenses
|
(322,402 | ) | (293,090 | ) | (661,306 | ) | (661,607 | ) | ||||||||
|
General and Administrative Expenses
|
(438,869 | ) | (532,981 | ) | (1,131,059 | ) | (1,115,343 | ) | ||||||||
|
Operating Profit/(Loss)
|
$ | (186,028 | ) | $ | 10,488 | $ | (351,839 | ) | $ | 1,742,416 | ||||||
|
Interest Income
|
$ | 3,668 | 2,132 | 7,425 | 5,115 | |||||||||||
|
Other Income, Net
|
$ | 114 | (22,531 | ) | (5,318 | ) | (5,597 | ) | ||||||||
|
Interest Expenses
|
(467,822 | ) | (157,604 | ) | (660,797 | ) | (306,107 | ) | ||||||||
|
Profit/(Loss) Before Income Tax and Minority Interest
|
(650,068 | ) | (167,515 | ) | (1,010,529 | ) | 1,435,827 | |||||||||
|
Income Tax
|
(124,302 | ) | (527,169 | ) | (132,630 | ) | (550,298 | ) | ||||||||
|
Profit/(Loss) Before Minority Interest
|
(774,370 | ) | (694,684 | ) | (1,143,159 | ) | 885,529 | |||||||||
|
Minority Interest
|
(70,511 | ) | 187,764 | (194,025 | ) | (368,332 | ) | |||||||||
|
Net Profit/(Loss)
|
$ | (844,881 | ) | $ | (506,920 | ) | $ | (1,337,184 | ) | $ | 517,197 | |||||
|
Profit/(Loss) Per Share – Basic and Fully Diluted
|
$ | ($0.03 | ) | $ | (0.02 | ) | $ | (0.05 | ) | $ | 0.02 | |||||
|
Weighted average common shares outstanding
– Basic and Fully Diluted
|
26,191,925 | 23,691,925 | 26,191,925 | 23,691,925 | ||||||||||||
See accompanying notes to unaudited condensed consolidated financial statements.
4
Sunrise Real Estate Group, Inc.
Consolidated Statements of Cash Flows
Increase/(Decrease) in Cash and Cash Equivalents
(Expressed in US Dollars)
|
Six Months Ending June 30,
|
||||||||
|
2011
|
2010
|
|||||||
|
(Unaudited)
|
(Unaudited)
|
|||||||
|
Cash flows from operating activities
|
||||||||
|
Net Profit/(Loss)
|
$ | (1,337,184 | ) | $ | 517,197 | |||
|
Adjustments to reconcile net income to net cash used in operating activities
|
||||||||
|
Depreciation of property, plant and equipment
|
457,545 | 422,518 | ||||||
|
Loss/ (Gain) on disposal of property, plant and equipment
|
8,752 | 741 | ||||||
|
Minority interest
|
194,025 | 368,332 | ||||||
|
Change in:
|
||||||||
|
Accounts receivable
|
(511,806 | ) | (863,855 | ) | ||||
|
Promissory deposits
|
504,386 | (439,760 | ) | |||||
|
Other receivables and deposits
|
(17,043 | ) | (488,852 | ) | ||||
|
Accounts payable
|
(10,602 | ) | (32,262 | ) | ||||
|
Other payables and accrued expenses
|
654,588 | 463,979 | ||||||
|
Deposit from underwriting sales
|
(200,481 | ) | (549,065 | ) | ||||
|
Interest payable on promissory notes
|
7,500 | (24,897 | ) | |||||
|
Interest payable on amount due to director
|
0 | 1,220 | ||||||
|
Interest payable on amount due to director
|
277,086 | |||||||
|
Deferred tax liabilities
|
0 | 328,575 | ||||||
|
Other tax payable
|
13,188 | (210,396 | ) | |||||
|
Income tax payable
|
(127,147 | ) | 119,522 | |||||
|
Net cash provided by/(used in) operating activities
|
(87,193 | ) | (387,003 | ) | ||||
|
Cash flows from investing activities
|
||||||||
|
Acquisition of property, plant and equipment
|
(7,203 | ) | (435,308 | ) | ||||
|
Proceeds from disposal of plant and equipment
|
4,078 | 4,529 | ||||||
|
Provide funds for investee
|
(3,993,956 | ) | 0 | |||||
|
Net cash provided by/(used in) investing activities
|
(3,997,081 | ) | (430,779 | ) | ||||
|
Cash flows from financing activities
|
||||||||
|
Funds received from capital increase
|
500,000 | 0 | ||||||
|
Bank loans repayment
|
0 | (205,221 | ) | |||||
|
Repayment of promissory note
|
(143,345 | ) | ||||||
|
Repayment to director
|
(43,849 | ) | (125,514 | ) | ||||
|
Proceeds from promissory note
|
2,000,730 | - | ||||||
|
Net cash provided by/ (used in) financing activities
|
2,456,881 | (474,080 | ) | |||||
|
Effect of exchange rate changes on cash and cash equivalents
|
83,471 | 142,363 | ||||||
|
Net decrease in cash and cash equivalents
|
(1,543,922 | ) | (1,149,499 | ) | ||||
|
Cash and cash equivalents at beginning of period
|
2,973,997 | 3,444,600 | ||||||
|
Cash and cash equivalents at end of period
|
$ | 1,430,075 | $ | 2,295,101 | ||||
|
Supplemental disclosure of cash flow information
|
||||||||
|
Cash paid during the period:
|
||||||||
|
Income tax paid
|
230,390 | 96,233 | ||||||
|
Interest paid
|
427,986 | 329,785 | ||||||
See accompanying notes to unaudited condensed consolidated financial statements.
5
(Expressed in US Dollars)
NOTE 1 – ORGANIZATION AND DESCRIPTION OF BUSINESS
Sunrise Real Estate Development Group, Inc. (“CY-SRRE”) was established in the Cayman Islands on April 30, 2004 as a limited liability company. CY-SRRE was wholly owned by Ace Develop Properties Limited, a corporation, (“Ace Develop”), of which Lin Chi-Jung, an individual, is the principal and controlling shareholder. Shanghai Xin Ji Yang Real Estate Consultation Company Limited (“SHXJY”) was established in the People’s Republic of China (the “PRC”) on August 14, 2001 as a limited liability company. SHXJY was originally owned by a Taiwanese company, of which the principal and controlling shareholder was Lin Chi-Jung. On June 8, 2004, all the fully paid up capital of SHXJY was transferred to CY-SRRE. On June 25, 2004 SHXJY and two individuals established a subsidiary, namely, Suzhou Xin Ji Yang Real Estate Consultation Company Limited (“SZXJY”) in the PRC, at which point in time, SHXJY held a 90% equity interest in SZXJY. On December 24, 2004, SHXJY acquired 85% of equity interest in Beijing Xin Ji Yang Real Estate Consultation Company Limited (“BJXJY”), a PRC company incorporated on April 16, 2003 with limited liability. On August 9, 2005, SHXJY sold a 10% equity interest in SZXJY to a company owned by a director of SZXJY, and transferred a 5% equity interest in SZXJY to CY-SRRE. Following the disposal and the transfer, CY-SRRE effectively held an 80% equity interest in SZXJY. On November 24, 2006, CY-SRRE, SHXJY, a director of SZXJY and a third party established a subsidiary, namely, Suzhou Shang Yang Real Estate Consultation Company Limited (“SZSY”) in the PRC, with CY-SRRE holding a 12.5% equity interest, SHXJY holding a 26% equity interest and the director of SZXJY holding a 12.5% equity interest in SZSY. At the date of incorporation, SRRE and the director of SZXJY entered into a voting agreement that SRRE is entitled to exercise the voting right in respect of his 12.5% equity interest in SZSY. Following that, SRRE effectively holds 51% equity interest in SZSY. On September 24, 2007, CY-SRRE sold a 5% equity interest in SZXJY to a company owned by a director of SZXJY. Following the disposal, CY-SRRE effectively holds 75% equity interest in SZXJY. On November 1, 2007, SZXJY established a wholly owned subsidiary, Suzhou Xin Ji Yang Real Estate Brokerage Company Limited (“SZXJYB”) in the PRC as a limited liability company. On May 8, 2008, SHXJY established a wholly owned subsidiary, Kunshan Shang Yang Real Estate Brokerage Company Limited (“KSSY”) in the PRC as a limited liability company.
LIN RAY YANG Enterprise Ltd. (“LRY”) was established in the British Virgin Islands on November 13, 2003 as a limited liability company. LRY was owned by Ace Develop, Planet Technology Corporation (“Planet Tech”) and Systems & Technology Corporation (“Systems Tech”). On February 5, 2004, LRY established a wholly owned subsidiary, Shanghai Shang Yang Real Estate Consultation Company Limited (“SHSY”) in the PRC as a limited liability company. On January 10, 2005, LRY and a PRC third party established a subsidiary, Suzhou Gao Feng Hui Property Management Company Limited (“SZGFH”), in the PRC, with LRY holding 80% of the equity interest in SZGFH. On May 8, 2006, LRY acquired 20% of the equity interest in SZGFH from the third party. Following the acquisition, LRY effectively holds 100% of the equity interest in SZGFH. On September 11, 2007 SHSY and other third parties established a subsidiary, namely, Suzhou Bin Fen Nian Dai Administration Consultancy Company Limited (“SZBFND”) in the PRC, with SHSY holding a 19% equity interest in SZBFND. On September 18, 2008, SHSY established a wholly owned subsidiary, San Ya Shang Yang Real Estate Consultation Company Limited (“SYSY”) in the PRC as a limited liability company.
SHXJY, SZXJY, BJXJY, SHSY, SZGFH, SZSY, SZXJYB, KSSY and SYSY commenced operations in November 2001, June 2004, January 2004, February 2004, January 2005, November 2006, November 2007, May 2008 and September 2008 respectively. Each of SHXJY, SZXJY, BJXJY, SHSY, SZGFH, SZSY, SZXJYB and KSSY has been granted a twenty-year operation period and SYSY has been granted a thirty-year operation period from the PRC, which can be extended with approvals from relevant PRC authorities.
On August 31, 2004, Sunrise Real Estate Group, Inc. (“SRRE”), CY-SRRE and Lin Chi-Jung, an individual and agent for the beneficial shareholder of CY-SRRE, i.e., Ace Develop, entered into an exchange agreement under which SRRE issued 5,000,000 shares of common stock to the beneficial shareholder or its designees, in exchange for all outstanding capital stock of CY-SRRE. The transaction closed on October 5, 2004. Lin Chi-Jung is Chairman of the Board of Directors of SRRE, the President of CY-SRRE and the principal and controlling shareholder of Ace Develop.
Also on August 31, 2004, SRRE, LRY and Lin Chi-Jung, an individual and agent for beneficial shareholders of LRY, i.e., Ace Develop, Planet Tech and Systems Tech, entered into an exchange agreement under which SRRE issued 10,000,000 shares of common stock to the beneficial shareholders, or their designees, in exchange for all outstanding capital stock of LRY. The transaction was closed on October 5, 2004. Lin Chi-Jung is Chairman of the Board of Directors of SRRE, the President of LRY and the principal and controlling shareholder of Ace Develop. Regarding the 10,000,000 shares of common stock of SRRE issued in this transaction, SRRE issued 8,500,000 shares to Ace Develop, 750,000 shares to Planet Tech and 750,000 shares to Systems Tech.
6
As a result of the acquisition, the former owners of CY-SRRE and LRY hold a majority interest in the combined entity. Generally accepted accounting principles require in certain circumstances that a company whose shareholders retain the majority voting interest in the combined business be treated as the acquirer for financial reporting purposes. Accordingly, the acquisition has been accounted for as a “reverse acquisition” arrangement whereby CY-SRRE and LRY are deemed to have purchased SRRE. However, SRRE remains the legal entity and the Registrant for Securities and Exchange Commission reporting purposes. All shares and per share data prior to the acquisition have been restated to reflect the stock issuance as a recapitalization of CY-SRRE and LRY.
SRRE was initially incorporated in Texas on October 10, 1996, under the name of Parallax Entertainment, Inc. (“Parallax”). On December 12, 2003, Parallax changed its name to Sunrise Real Estate Development Group, Inc. On April 25, 2006, Sunrise Estate Development Group, Inc. filed Articles of Amendment with the Texas Secretary of State, changing the name of Sunrise Real Estate Development Group, Inc. to Sunrise Real Estate Group, Inc., effective from May 23, 2006.
On April 22, 2010, ACE Develop Properties Limited, whose sole beneficiary owner is Lin Chi Jung, Chairman of the Board, CEO and director of the Company, transferred 4,511,400 shares of common stock of the Company to Robert Lin Investment, Inc. whose sole beneficiary owner is Lin Chao Chin, President, COO and director of the Company.
Figure 1: Company Organization Chart
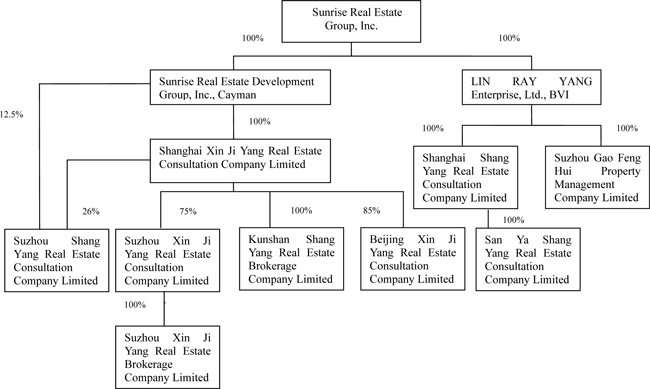
SRRE and its subsidiaries, namely, CY-SRRE, LRY, SHXJY, SZXJY, SZXJYB, SZSY, KSSY, BJXJY, SHSY, SZGFH and SYSY are sometimes hereinafter collectively referred to as “the Company.”
The principal activities of the Company are property brokerage services, real estate marketing services, property leasing services and property management services in the PRC.
7
NOTE 2 –SUMMARY OF SIGNIFICANT ACCOUNTING POLICIES
Basis of Accounting and Principles of Consolidation
The consolidated financial statements are prepared in accordance with generally accepted accounting principles in the United States of America that include the financial statements of SRRE and its subsidiaries, CY-SRRE, LRY, SHXJY, SZXJY, SZXJYB, SZSY, KSSY, BJXJY, SHSY, SZGFH and SYSY. All inter-company transactions and balances have been eliminated.
Going Concern
The Company’s financial statements are prepared according to the accounting principles generally accepted in the United States of America applicable to a going concern, which contemplates the realization of assets and liquidation of liabilities in the normal course of business. The Company has accumulated losses of $10,330,358 for the year ended June 30, 2011. The Company’s net working capital deficiency and significant accumulated losses raise substantial doubt about its ability to continue as a going concern.
However, management believes that the Company is able to generate sufficient cash flow to meet its obligations on a timely basis and ultimately to attain successful operations in respect of the agency sales and property management operations. Accordingly, the accompanying financial statements do not include any adjustments that may be necessary if the Company is unable to continue as a going concern.
Use of Estimates
The preparation of financial statements in accordance with generally accepted accounting principles requires management to make estimates and assumptions that affect reported amounts of assets and liabilities and disclosure of contingent assets and liabilities at the date of the financial statements and the reported amounts of revenues and expenses during the reporting period. Actual results could differ from those estimates.
Cash and Cash Equivalents
Cash and cash equivalents include cash in hand and all highly liquid investments with an original maturity of three months or less.
Foreign Currency Translation and Transactions
The functional currency of SRRE, CY-SRRE and LRY is United States Dollars (“US$”) and the financial records are maintained and the financial statements prepared in US $. The functional currency of SHXJY, SZXJY, SZXJYB, SZSY, KSSY, BJXJY, SHSY, SZGFH and SYSY is Renminbi (“RMB”) and the financial records are maintained and the financial statements prepared in RMB.
Foreign currency transactions during the period are translated into each company’s denominated currency at the exchange rates ruling at the transaction dates. Gain and loss resulting from foreign currency transactions are included in the consolidated statement of operations. Assets and liabilities denominated in foreign currencies at the balance sheet date are translated into each company’s denominated currency at period end exchange rates. All exchange differences are dealt with in the consolidated statements of operations.
The financial statements of the Company’s operations based outside of the United States have been translated into US$ in accordance with ASC 830. Management has determined that the functional currency for each of the Company’s foreign operations is its applicable local currency. When translating functional currency financial statements into US$, period-end exchange rates are applied to the consolidated balance sheets, while average period rates are applied to consolidated statements of operations. Translation gains and losses are recorded in translation reserve as a component of shareholders’ equity.
The exchange rate between US$ and RMB had some fluctuation during the periods presented. The rates as of June 30, 2011 and December 31, 2010 are US$1: RMB6.4716 and US$1: RMB6.7909, respectively.
8
Property, Plant, Equipment and Depreciation
Property, plant and equipment are stated at cost. Depreciation is computed using the straight-line method to allocate the cost of depreciable assets over the estimated useful lives of the assets as follows:
|
Estimated Useful Life (in years)
|
|
|
Furniture and fixtures
|
5-10
|
|
Computer and office equipment
|
5
|
|
Motor vehicles
|
5
|
|
Properties
|
20
|
Maintenance, repairs and minor renewals are charged directly to the statement of operations as incurred. Additions and improvements are capitalized. When assets are disposed of, the related cost and accumulated depreciation thereon are removed from the accounts and any resulting gain or loss is included in the statement of operations.
Investment property
Investment properties are stated at cost. Depreciation is computed using the straight-line method to allocate the cost of depreciable assets over the estimated useful lives of 20 years.
Significant additions that extend property lives are capitalized and are depreciated over their respective estimated useful lives. Routine maintenance and repair costs are expensed as incurred. The Company reviews its investment property for impairment whenever events or changes in circumstances indicate that the carrying amount of an investment property may not be recoverable.
Revenue Recognition
Agency commission revenue from property brokerage is recognized when the property developer and the buyer complete a property sales transaction, and the property developer grants confirmation to us to be able to invoice them accordingly. The time when we receive the commission is normally at the time when the property developer receives from the buyer a portion of the sales proceeds in accordance with the terms of the relevant property sales agreement, or the balance of the bank loan to the buyer has been funded, or recognized under the sales schedule or other specific items of agency sales agreement with developer. At no point does the Company handle any monetary transactions nor act as an escrow intermediary between the developer and the buyer.
Revenue from marketing consultancy services is recognized when services are provided to clients, fees associated to services are fixed or determinable, and collection of the fees is assured.
Rental revenue from property management and rental business is recognized on a straight-line basis according to the time pattern of the leasing agreements.
The Company accounts for underwriting sales in accordance with ASC 976-605 “Accounting for Sales of Real Estate” (SFAS 66). The commission revenue on underwriting sales is recognized when the criteria in SFAS No. 66 have been met, generally when title is transferred and the Company no longer has substantial continuing involvement with the real estate asset sold. If the Company provides certain rent guarantees or other forms of support where the maximum exposure to loss exceeds the gain, it defers the related commission income and expenses by applying the deposit method. In future periods, the commission income and related expenses are recognized when the remaining maximum exposure to loss is reduced below the amount of income deferred.
All revenues represent gross revenues less sales and business tax.
Net Earnings per Common Share
The Company computes net earnings per share in accordance with ASC 260, “Earnings per Share.” Under the provisions of ASC 260, basic net earnings per share is computed by dividing the net earnings available to common shareholders for the period by the weighted average number of shares of common stock outstanding during the period. The calculation of diluted net earnings per share recognizes common stock equivalents, however; potential common stock in the diluted EPS computation is excluded in net loss periods, as their effect is anti-dilutive.
Income Taxes
The Company accounts for income taxes in accordance with ASC 740 “Accounting for Income Taxes.” Under SFAS No. 109, deferred tax liabilities or assets at the end of each period are determined using the tax rate expected to be in effect when taxes are actually paid or recovered. Valuation allowances are established when necessary to reduce deferred tax assets to the amount expected to be realized.
9
We continue to account for income tax contingencies using a benefit recognition model. Beginning January 1, 2007, if we considered that a tax position is 'more likely than not' of being sustained upon audit, based solely on the technical merits of the position, we recognize the benefit. We measure the benefit by determining the amount that is greater than 50% likely of being realized upon settlement, presuming that the tax position is examined by the appropriate taxing authority that has full knowledge of all relevant information. These assessments can be complex and we often obtain assistance from external advisors.
Under the benefit recognition model, if our initial assessment fails to result in the recognition of a tax benefit, we regularly monitor our position and subsequently recognize the tax benefit if there are changes in tax law or analogous case law that sufficiently raise the likelihood of prevailing on the technical merits of the position to more likely than not; if the statute of limitations expires; or if there is a completion of an audit resulting in a settlement of that tax year with the appropriate agency.
Uncertain tax positions, represented by liabilities on our balance sheet, are now classified as current only when we expect to pay cash within the next 12 months. Interest and penalties, if any, continue to be recorded in Provision for taxes on income and are classified on the balance sheet with the related tax liability.
Historically, our policy had been to account for income tax contingencies based on whether we determined our tax position to be 'probable' under current tax law of being sustained, as well as an analysis of potential outcomes under a given set of facts and circumstances. In addition, we previously considered all tax liabilities as current once the associated tax year was under audit.
Segment information
The Company believes that it operates in one business segment. Management views the business as consisting of several revenue streams; however it is not possible to attribute assets or indirect costs to the individual streams other than direct expenses.
Recent Accounting Pronouncements
On August 17, 2010, the FASB and IASB issued an ED on lease accounting. The ED, released by the FASB as a proposed ASU, creates a new accounting model for both lessees and lessors and eliminates the concept of operating leases. The proposed ASU, if finalized, would converge the FASB’s and IASB’s accounting for lease contracts in most significant areas.
In January 2010, the FASB issued guidance to amend the disclosure requirements related to recurring and nonrecurring fair value measurements. The guidance requires new disclosures on the transfers of assets and liabilities between Level 1 (quoted prices in active market for identical assets or liabilities) and Level 2 (significant other observable inputs) of the fair value measurement hierarchy, including the reasons and the timing of the transfers. Additionally, the guidance requires a roll forward of activities on purchases, sales, issuance, and settlements of the assets and liabilities measured using significant unobservable inputs (Level 3 fair value measurements). The guidance became effective for us with the reporting period beginning January 1, 2010, except for the disclosure on the roll forward activities for Level 3 fair value measurements, which will become effective for us with the reporting period beginning July 1, 2011. Other than requiring additional disclosures, adoption of this new guidance did not have a material impact on our financial statements.
In October 2009, the FASB issued guidance on revenue recognition that will become effective for us beginning July 1, 2010, with earlier adoption permitted. Under the new guidance on arrangements that include software elements, tangible products that have software components that are essential to the functionality of the tangible product will no longer be within the scope of the software revenue recognition guidance, and software-enabled products will now be subject to other relevant revenue recognition guidance. Additionally, the FASB issued guidance on revenue arrangements with multiple deliverables that are outside the scope of the software revenue recognition guidance. Under the new guidance, when vendor specific objective evidence or third party evidence for deliverables in an arrangement cannot be determined, a best estimate of the selling price is required to separate deliverables and allocate arrangement consideration using the relative selling price method. The new guidance includes new disclosure requirements on how the application of the relative selling price method affects the timing and amount of revenue recognition.
10
On July 1, 2009, we adopted guidance issued by the FASB that changes the accounting and reporting for non-controlling interests. Non-controlling interests are to be reported as a component of equity separate from the parent’s equity, and purchases or sales of equity interests that do not result in a change in control are to be accounted for as equity transactions. In addition, net income attributable to a non-controlling interest is to be included in net income and, upon a loss of control, the interest sold, as well as any interest retained, is to be recorded at fair value with any gain or loss recognized in net income. Adoption of the new guidance did not have a material impact on our financial statements.
In June 2009, the FASB issued guidance on the consolidation of variable interest entities, which is effective for us beginning July 1, 2010. The new guidance requires revised evaluations of whether entities represent variable interest entities, ongoing assessments of control over such entities, and additional disclosures for variable interests. We believe adoption of this new guidance will not have a material impact on our financial statements.
The Company does not anticipate that the adoption of the above statements will have a material effect on the Company's financial condition and results of operations.
NOTE 3 - PROMISSORY DEPOSITS
The balance of $653,625 represents the deposits placed with several property developers in respect of a number of real estate projects where the Company is appointed as sales agent.
NOTE 4 - OTHER RECEIVABLES AND DEPOSITS
|
June 30,
|
December 31,
|
|||||||
|
2011
|
2010
|
|||||||
|
Advances to staff
|
$ | 13,845 | $ | 17,120 | ||||
|
Rental deposits
|
83,722 | 87,368 | ||||||
|
Property Management
|
45,600 | 11,377 | ||||||
|
Deposits
|
4,037,773 | |||||||
|
Other receivables
|
261,658 | 262,885 | ||||||
| $ | 4,442,598 | $ | 378,751 | |||||
The total amount of the deposits provided for Wuhan Yuan Yu Long is $4,037,773.
.
NOTE 5 – PROPERTY, PLANT AND EQUIPMENT – NET
|
June 30,
|
December 31,
|
|||||||
|
2011
|
2010
|
|||||||
|
Furniture and fixtures
|
$ | 85,398 | $ | 83,449 | ||||
|
Computer and office equipment
|
286,918 | 318,601 | ||||||
|
Motor vehicles
|
798,258 | 827,557 | ||||||
|
Properties
|
2,336,565 | 2,283,225 | ||||||
|
Sub-Total
|
3,507,139 | 3,512,862 | ||||||
|
Less: Accumulated depreciation
|
(1,024,481 | ) |
(941,346
|
) | ||||
|
Total
|
$ | 2,482,658 | $ | 2,571,516 | ||||
NOTE 6 – INVESTMENT PROPERTIES
|
June 30,
|
December 31,
|
|||||||
|
2011
|
2010
|
|||||||
|
Investment property
|
$ | 9,568,086 | $ | 9,349,785 | ||||
|
Less: Accumulated depreciation
|
(2,510,670 | ) | (2,141,251 | ) | ||||
| $ | 7,057,416 | $ | 7,208,534 | |||||
11
The investment properties include one floor and four units of a commercial building in Suzhou, the PRC. The investment properties were acquired by the Company for long-term investment purposes and were pledged to secure a bank loan in note 7. The carrying amount of one floor as $2,439,094 was pledged to a promissory note payable in Note 8.
As of June 30, 2011, the four units of the investment properties were leased to SZBFND, a related party of the Company, and 100% of the total area of the one remaining floor was leased out.
NOTE 7 - BANK LOANS
Bank loans included two bank loans, as listed below:
First, the balance includes a bank loan of $8,498,671 which bears interest at 110% of one year prime rate as announced by the People’s Bank of China (the rate for 2010 was 5.84%) and is secured by the properties as mentioned in Note 6 above. This loan is due on November 30, 2011. This loan ceiling is 55,000,000 RMB for a three-year revolving use, and each loan period is one year and be extended upon the request.
Second, the remaining bank loan of $2,317,819 bears interest at prime rate as announced by the People’s Bank of China (The rate for 2010 was 5.84%). This loan is due on August 22, 2011. This loan is secured by the properties as mentioned in Note 6 above. This loan ceiling is 15,000,000 RMB for a three-year revolving use, and each loan period is three months and can be extended upon the request.
NOTE 8 – PROMISSORY NOTES PAYABLE
There are two promissory notes, as listed below:
First, the balance includes a promissory note of $315,000 and accrued interest of $3,750 thereon. This promissory note of $300,000 bearing an interest rate of 15% per annum. This promissory note is unsecured and the term of repayment is not specifically defined.
Second, the balance includes a promissory note of $154,521. This promissory note of $154,521 bears interest at a rate of 15% per annum. This promissory note is unsecured and the term of repayment is not specifically defined.
NOTE 9 – AMOUNTS WITH RELATED PARTIES AND DIRECTORS
Amount due to related parties
The balance includes amounts due to Chang Chu Ching, a previous director, of $2,408,306 and accrued interest of $235,366 thereon. This promissory note of $2,172,940 bearing an interest rate of 15% per annum. This promissory note is unsecured and the term of repayment is not specifically defined. This loan is used for the purpose of securing a property in our Yuan Yu Long project in Wuhan and is subject to be paid back once the property is secured.
Second, the balance includes amounts due to Chang Chu Ching, a previous director, of $463,563. This promissory note of $463,563 bears interest at a rate of 18% per annum. This promissory note is secured by the promissory deposit of $309,042 as mentioned in Note 3 above and one floor of the investment properties as mentioned in Note 6 above and the term of repayment is not specifically defined.
Amount due to directors
As of June 30, 2011, the balance includes one loan and advances obtained from Lin Chin-Jung.
The loan includes principal of $112,218. The principal is unsecured, bears interest at a rate of 9.6% per annum and the term of repayment is not specifically defined.
The advances and reimbursements of $34,767 represented the salary payable and rental reimbursement to Lin Chin-Jung outstanding as of June 30, 2011.
12
NOTE 10 - OTHER PAYABLES AND ACCRUED EXPENSES
|
June 30,
|
December 31,
|
|||||||
|
2011
|
2010
|
|||||||
|
Accrued legal fee
|
$ | 105,217 | $ | 109,233 | ||||
|
Accrued staff commission & bonus
|
534,402 | 607,929 | ||||||
|
Rental deposits received
|
1,395,281 | 699,786 | ||||||
|
Accrual for onerous contracts
|
36,919 | 5,613 | ||||||
|
Other payables
|
1,625,970 | 1,544,191 | ||||||
|
Property management
|
128,751 | 125,813 | ||||||
|
Total other payables and accrued expense
|
$ | 3,651,241 | $ | 3,092,565 | ||||
Other payable includes a balance of $772,606 from our project in San Ya.
NOTE 11 – OTHER TAX PAYABLE
Other tax payable mainly represents the outstanding payables of business tax, urban real estate tax and land appreciation tax in the PRC.
NOTE 12- COMMITMENTS AND CONTINGENCIES
Operating Lease Commitments
During the six months ended June 30, 2011 and 2010, the Company incurred lease expenses amounting to $141,036 and $164,833, respectively. As of June 30, 2011, the Company had commitments under operating leases, requiring annual minimum rentals as follows:
|
June 30,
|
December 31,
|
|||||||
|
2011
|
2010
|
|||||||
|
Within one year
|
$ | 163,497 | $ | 233,145 | ||||
|
Two to five years
|
8,483 | - | ||||||
|
Operating lease commitments
|
$ | 171,980 | $ | 233,145 | ||||
During the year of 2005 and 2006, SZGFH entered into leasing agreements with certain buyers of the Sovereign Building underwriting project to lease the properties for them. These leasing agreements on these properties are for 62% of the floor space that was sold to third party buyers. In accordance with the leasing agreements, the owners of the properties can have a rental return of 8.5% and 8.8% per annum for a period of 5 years and 8 years, respectively. In regards to the leasing agreements, we have negotiated with the buyers and have lowered the annual rental return rate for the remaining leasing period from 8.5% for 5 years to 5.8%, and from 8.8% for 8 years to 6%. As of June 30, 2011, 67% of the buyers agreed upon the lowered rate, 22% of the buyers agreed to cancel the leasing agreements and 11% did not agree to the lowered rate. The leasing period started in the second quarter, 2006, and the Company has the right to sublease the leased properties to cover these lease commitments in the leasing period. As of June 30, 2011, 100 sub-leasing agreements have been signed, the area of these sub-leasing agreements represented 94% of total area with these lease commitments.
As of June 30, 2011, the lease commitments are as follows:
|
June 30,
|
December 31,
|
|||||||
|
2011
|
2010
|
|||||||
|
Within one year
|
$ | 1,211,128 | $ | 2,141,087 | ||||
|
Two to five years
|
2,686,091 | 4,478,477 | ||||||
|
Operating lease commitments arising from the promotional package
|
$ | 3,897,219 | $ | 6,619,564 | ||||
13
An accrual for onerous contracts was recognized which is equal to the difference between the present value of the sublease income and the present value of the associated lease expense at the appropriate discount rate. The accrual for onerous contracts was $186,193 as of June 30, 2011 and $30,712 as of December 31, 2010.
According to the leasing agreements, the Company has an option to terminate any agreement by paying a predetermined compensation. As of June 30, 2011, the compensation to terminate all leasing agreements is $1,518,941. According to the sub-leasing agreements that have been signed through June 30, 2011, the rental income from these sub-leasing agreements will be $ 861,016 within one year and $591,554 within two to five years. However, no assurance can be given that we can collect all of the rental income.
NOTE 13 –DEPOSITS RECEIVED FROM UNDERWRTING SALES
The Company accounts for its underwriting sales revenue with underwriting rent guarantees in accordance with the FASB ASC Topic 360. Under ASC 360, the deposit method should be used for the revenue from the sales of floor space with underwriting rent guarantees until the revenues generated by sub-leasing properties exceed the guaranteed rental amount due to the purchasers.
NOTE 14 – STATUTORY RESERVE
According to the relevant corporation laws in the PRC, a PRC company is required to transfer at least 10% of its profit after taxes, as determined under accounting principles generally accepted in the PRC, to the statutory reserve until the balance reaches 50% of its registered capital. The statutory reserve can be used to make good on losses or to increase the capital of the relevant company.
NOTE 15 – ACCUMULATED OTHER COMPREHENSIVE INCOME
As of June 30, 2011 and December 31, 2010, the only component of accumulated other comprehensive income was translation reserve.
NOTE 16 – CONCENTRATION OF CUSTOMERS
During the three months and six months ended June 30, 2011 and 2010, the following customers accounted for more than 10% of total net revenue:
|
Percentage of
Net Sales
Three Months
Ended June 30,
|
Percentage of
Net Sales
Six Months
Ended June 30,
|
Percentage of
Accounts Receivable
as of June 30,
|
|||||||||
|
2011
|
2010
|
2011
|
2010
|
2011
|
2010
|
||||||
|
Customer A
|
19%
|
*
|
18%
|
*
|
15%
|
*
|
|||||
|
Customer B
|
14%
|
*
|
17%
|
*
|
38%
|
*
|
|||||
|
Customer C
|
10%
|
*
|
*
|
*
|
*
|
*
|
|||||
* less than 10%
ITEM 2 MANAGEMENT’S DISCUSSION AND ANALYSIS OF FINANICAL CONDITION AND RESULTS OF OPERATIONS
CAUTIONARY STATEMENT
The following Management’s Discussion and Analysis (“MD&A”) is intended to help the reader understand Sunrise Real Estate Group, Inc. (“SRRE”). The MD&A is provided as a supplement to, and should be read in conjunction with, our financial statements and the accompanying notes. The information contained in this quarterly report on Form 10-Q is not a complete description of our business or the risks associated with an investment in our common stock. We urge you to carefully review and consider the various disclosures made by us in this report and in our other reports filed with the Securities and Exchange Commission, or SEC, including but not limited to our annual report on Form 10-K for the year ended December 31, 2010, which discusses our business in greater detail.
14
In this report we make, and from time to time we otherwise make, written and oral statements regarding our business and prospects, such as projections of future performance, statements of management’s plans and objectives, forecasts of market trends, and other matters that are forward-looking statements within the meaning of Section 27A of the Securities Act of 1933 and Section 21E of the Securities Exchange Act of 1934. Statements containing the words or phrases “will likely result,” “are expected to,” “will continue,” “is anticipated,” “estimates,” “projects,” “seeks”, “believes,” “expects,” “anticipates,” “intends,” “target,” “goal,” “plans,” “objective,” “should” or similar expressions identify forward-looking statements, which may appear in documents, reports, filings with the Securities and Exchange Commission, news releases, written or oral presentations made by officers or other representatives made by us to analysts, stockholders, current or potential investors, news organizations and others, and discussions with management and other of our representatives, customer and suppliers. For such statements, we claim the protection of the safe harbor for forward-looking statements contained in the Private Securities Litigation Reform Act of 1995.
Our future results, including results related to forward-looking statements, involve a number of risks and uncertainties. No assurance can be given that the results reflected in any forward-looking statements will be achieved. Any forward-looking statement speaks only as of the date on which such statement is made. Our forward-looking statements are based upon assumptions that are sometimes based upon estimates, data, communications and other information from suppliers, government agencies and other sources that may be subject to revision. Except as required by law, we do not undertake any obligation to update or keep current either (i) any forward-looking statement to reflect events or circumstances arising after the date of such statement, or (ii) the important factors that could cause our future results to differ materially from historical results or trends, results anticipated or planned by us, or which are reflected from time to time in any forward-looking statement.
In addition to other matters identified or described by us from time to time in filings with the SEC, there are several important factors that could cause our future results to differ materially from historical results or trends, results anticipated or planned by us, or results that are reflected from time to time in any forward-looking statement. Some of these important factors, but not necessarily all important factors, include those relating to our ability to raise money and grow our business, and potential difficulties in integrating new acquisitions with our current operations, especially as they pertain to foreign markets and market conditions. Please also refer to the section entitled “Risk Factors” in our Annual Report on Form 10-K for the year ended December 31, 2010.
OVERVIEW
In October 2004, the former shareholders of Sunrise Real Estate Development Group, Inc. (Cayman Islands) (“CY-SRRE”) and LIN RAY YANG Enterprise Ltd. (“LRY”) acquired a majority of our voting interests in a share exchange. Before the completion of the share exchange, SRRE had no continuing operations, and its historical results would not be meaningful if combined with the historical results of CY-SRRE, LRY and their subsidiaries.
As a result of the acquisition, the former owners of CY-SRRE and LRY hold a majority interest in the combined entity. Generally accepted accounting principles require in certain circumstances that a company whose shareholders retain the majority voting interest in the combined business be treated as the acquirer for financial reporting purposes. Accordingly, the acquisition has been accounted for as a “reverse acquisition” arrangement whereby CY-SRRE and LRY are deemed to have purchased SRRE. However, SRRE remains the legal entity and the Registrant for Securities and Exchange Commission reporting purposes. The historical financial statements prior to October 5, 2004 are those of CY-SRRE and LRY and their subsidiaries. All equity information and per share data prior to the acquisition have been restated to reflect the stock issuance as a recapitalization of CY-SRRE and LRY.
SRRE and its subsidiaries, namely, CY-SRRE, LRY, Shanghai Xin Ji Yang Real Estate Consultation Company Limited (“SHXJY”), Suzhou Xin Ji Yang Real Estate Consultation Company Limited (“SZXJY”), Beijing Xin Ji Yang Real Estate Consultation Company Limited (“BJXJY”), Shanghai Shangyang Real Estate Consultation Company Limited (“SHSY”), Suzhou Gao Feng Hui Property Management Company Limited (“SZGFH”), Suzhou Shang Yang Real Estate Consultation Company Limited (“SZSY”), Suzhou Xin Ji Yang Real Estate Brokerage Company Limited(“SZXJYB”), Kunshan Shang Yang Real Estate Brokerage Company Limited (“KSSY”) and San Ya Shang Yang Real Estate Consultation Company Limited (“SYSY”) are sometimes hereinafter collectively referred to as “the Company,” “our,” or “us”.
The principal activities of the Company are real estate agency sales, real estate marketing services, real estate investments, property leasing services and property management services in the PRC.
15
On January 21, 2011, and January 22, 2011, we entered into a Share Purchase Agreement with Good Speed Services Limited (“Good Speed”) and Better Time International Limited (“Better Time”) respectively, to issue 2.5 million shares to each company for US $500 thousand. On June 24, 2011, we issued 2.5 million shares of common stock to Good Speed and received $500,000. On July 1, 2011, Sunrise and Better Time extended the closing date to on or before September 30, 2011.
RECENT DEVELOPMENTS
Our major business was agency sales, whereby our Chinese subsidiaries contracted with property developers to market and sell their newly developed property units. For these services we earned a commission fee calculated as a percentage of the sales prices. We have focused our sales on the whole China market, especially in secondary cities. To expand our agency business, we have established subsidiaries in Shanghai, Suzhou, Beijing, Kunshan and Hainan, and branches in NanChang, YangZhou, NanJing, ChongQing and ShangQiu
During the year of 2005 and 2006, SZGFH entered into leasing agreements with certain buyers of the Sovereign Building underwriting project to lease the properties for them. These leasing agreements on these properties are for 62% of the floor space that was sold to third party buyers. In accordance with the leasing agreements, the owners of the properties can have a rental return of 8.5% and 8.8% per annum for a period of 5 years and 8 years, respectively. In regards to the leasing agreements, we have negotiated with the buyers and have lowered the annual rental return rate for the remaining leasing period from 8.5% for 5 years to 5.8%, and from 8.8% for 8 years to 6%.As of June 30, 2011 67% of the buyers agreed upon the lowered rate and 22% of the buyers agreed to cancel the leasing agreements. The leasing period started in the second quarter of 2006, and the Company has the right to sublease the leased properties to cover these lease commitments in the leasing period. As of June 30, 2011, 100 sub-leasing agreements have been signed and the area of these sub-leasing agreements represented 94% of the total area with these lease commitments.
RECENTLY ISSUED ACCOUNTING STANDARDS
On August 17, 2010, the FASB and IASB issued an ED on lease accounting. The ED, released by the FASB as a proposed ASU, creates a new accounting model for both lessees and lessors and eliminates the concept of operating leases. The proposed ASU, if finalized, would converge the FASB’s and IASB’s accounting for lease contracts in most significant areas.
In January 2010, the FASB issued guidance to amend the disclosure requirements related to recurring and nonrecurring fair value measurements. The guidance requires new disclosures on the transfers of assets and liabilities between Level 1 (quoted prices in active market for identical assets or liabilities) and Level 2 (significant other observable inputs) of the fair value measurement hierarchy, including the reasons and the timing of the transfers. Additionally, the guidance requires a roll forward of activities on purchases, sales, issuance, and settlements of the assets and liabilities measured using significant unobservable inputs (Level 3 fair value measurements). The guidance became effective for us with the reporting period beginning January 1, 2010, except for the disclosure on the roll forward activities for Level 3 fair value measurements, which will become effective for us with the reporting period beginning July 1, 2011. Other than requiring additional disclosures, adoption of this new guidance did not have a material impact on our financial statements.
In October 2009, the FASB issued guidance on revenue recognition that will become effective for us beginning July 1, 2010, with earlier adoption permitted. Under the new guidance on arrangements that include software elements, tangible products that have software components that are essential to the functionality of the tangible product will no longer be within the scope of the software revenue recognition guidance, and software-enabled products will now be subject to other relevant revenue recognition guidance. Additionally, the FASB issued guidance on revenue arrangements with multiple deliverables that are outside the scope of the software revenue recognition guidance. Under the new guidance, when vendor specific objective evidence or third party evidence for deliverables in an arrangement cannot be determined, a best estimate of the selling price is required to separate deliverables and allocate arrangement consideration using the relative selling price method. The new guidance includes new disclosure requirements on how the application of the relative selling price method affects the timing and amount of revenue recognition.
On July 1, 2009, we adopted guidance issued by the FASB that changes the accounting and reporting for non-controlling interests. Non-controlling interests are to be reported as a component of equity separate from the parent’s equity, and purchases or sales of equity interests that do not result in a change in control are to be accounted for as equity transactions. In addition, net income attributable to a non-controlling interest is to be included in net income and, upon a loss of control, the interest sold, as well as any interest retained, is to be recorded at fair value with any gain or loss recognized in net income. Adoption of the new guidance did not have a material impact on our financial statements.
16
In June 2009, the FASB issued guidance on the consolidation of variable interest entities, which is effective for us beginning July 1, 2010. The new guidance requires revised evaluations of whether entities represent variable interest entities, ongoing assessments of control over such entities, and additional disclosures for variable interests. We believe adoption of this new guidance will not have a material impact on our financial statements.
The Company does not anticipate that the adoption of the above statements will have a material effect on the Company's financial condition and results of operations.
APPLICATION OF CRITICAL ACCOUNTING POLICIES
The preparation of financial statements in conformity with accounting principles generally accepted in the United States requires management to make estimates and assumptions that affect the reported amounts of assets and liabilities and disclosure of contingent assets and liabilities at the date of the financial statements and the reported amounts of revenues and expenses during the reporting period. Critical accounting policies for us include revenue recognition, net earnings per common share, income taxes and segment information.
Revenue Recognition
Agency commission revenue from property brokerage is recognized when the property developer and the buyer complete a property sales transaction, and the property developer grants confirmation to us to be able to invoice them accordingly. The time when we receive the commission is normally at the time when the property developer receives from the buyer a portion of the sales proceeds in accordance with the terms of the relevant property sales agreement, or the balance of the bank loan to the buyer has been funded, or recognized under the sales schedule or other specific items of agency sales agreement with developer. At no point does the Company handle any monetary transactions nor act as an escrow intermediary between the developer and the buyer.
Revenue from marketing consultancy services is recognized when services are provided to clients, fees associated to services are fixed or determinable, and collection of the fees is assured.
Rental revenue from property management and rental business is recognized on a straight-line basis according to the time pattern of the leasing agreements.
The Company accounts for underwriting sales in accordance with the FASB guidance of ASC Topic 360, “Property, Plant and Equipment”. The commission revenue on underwriting sales is recognized when the criteria in ASC 360 have been met, generally when title is transferred and the Company no longer has substantial continuing involvement with the real estate asset sold. If the Company provides certain rent guarantees or other forms of support where the maximum exposure to loss exceeds the gain, it defers the related commission income and expenses by applying the deposit method. In future periods, the commission income and related expenses are recognized when the remaining maximum exposure to loss is reduced below the amount of income deferred.
All revenues represent gross revenues less sales and business tax.
Net Earnings per Common Share
The Company computes net earnings per share in accordance with SFAS No. 128, “Earnings per Share.” Under the provisions of SFAS No. 128, basic net earnings per share is computed by dividing the net earnings available to common shareholders for the period by the weighted average number of shares of common stock outstanding during the period. The calculation of diluted net earnings per share recognizes common stock equivalents, however; potential common stock in the diluted EPS computation is excluded in net loss periods, as their effect is anti-dilutive.
Income Taxes
The Company accounts for income taxes in accordance with SFAS No. 109 “Accounting for Income Taxes.” Under SFAS No. 109, deferred tax liabilities or assets at the end of each period are determined using the tax rate expected to be in effect when taxes are actually paid or recovered. Valuation allowances are established when necessary to reduce deferred tax assets to the amount expected to be realized.
17
Segment information
The Company believes that it operates in one business segment. Management views the business as consisting of several revenue streams; however it is not possible to attribute assets or indirect costs to the individual streams other than direct expenses.
RESULTS OF OPERATIONS
We provide the discussion and analysis of our changes in financial condition and results of operations for the three and six months ended June 30, 2011, with comparisons to the historical three and six months ended June 30, 2010.
Revenue
The following table shows the net revenue detail by line of business:
|
Three Months Ended June 30,
|
Six Months Ended June 30,
|
||||||||||||||||||||||||||||||||||||||||||||
|
2011
|
% to
total
|
2010
|
% to
total
|
%
change
|
2011
|
% to
total
|
2010
|
% to
total
|
%
change
|
||||||||||||||||||||||||||||||||||||
|
Agency Sales
|
1,334,564 | 63 | % | 1,882,031 | 64 | (29 | )% | 3,189,918 | 68 | % | 5,653,952 | 74 | (44 | )% | |||||||||||||||||||||||||||||||
|
Underwriting Sales
|
101,990 | 5 | % | 405,862 | 14 | (75 | )% | 261,656 | 6 | % | 716,607 | 9 | (63 | )% | |||||||||||||||||||||||||||||||
|
Property Management
|
684,170 | 32 | % | 655,022 | 22 | 4 | % |
|
1,273,774 |
|
27 | % |
|
1,271,875 |
|
17 |
|
0 | % | ||||||||||||||||||||||||||
|
Net revenue
|
2,120,724 | 100 | 2,942,915 | 100 | (28 | )% |
|
4,725,348 |
|
100 |
|
7,642,434 |
|
100 |
|
(38 | )% | ||||||||||||||||||||||||||||
The net revenue in the second quarter of 2011 was $2,120,723, which decreased 28% from $2,942,915 in the second quarter of 2010. The total net revenue of the first two quarters of 2011 was $4,725,348, which decreased 38% from $7,642,434 of the first two quarters of 2010. In the second quarter of 2011, agency sales represented 63% of the total net revenue, underwriting sales represented 5% and property management represented 32%. In the first two quarters of 2011, agency sales represented 74% of the total net revenue, underwriting sales represented 9% and property management represented 17%. The decrease in net revenue in the second quarter and first two quarters of 2011 was due to the decrease in our agency sales and underwriting sales.
Agency sales
In the second quarter and first two quarters of 2011, 63% and 74%, respectively, of our net revenue was due to agency sales. As compared with same period in 2010, net revenue of agency sales in the second quarter and first two quarters of 2011 decreased 29% and 44% respectively. The primary reason was there were fewer projects that contributed to our agency sales revenue.
Because of our diverse market locations, the risk of market fluctuations has been minimized on our business operations in agency sales in 2011, and we are seeking stable growth in our agency sales business in 2011. However, there can be no assurance that we will be able to do so.
Underwriting Sales
In February 2004, SHSY entered into an agreement to underwrite an office building in Suzhou, known as Suzhou Sovereign Building. Being the sole distribution agent for this office building, SHSY committed to a sales target of $56.53 million. Property underwriting sales are comparatively a higher risk business model compared to our pure commission based agency business. Under this higher risk business model, the Underwriting Model, our commission is not calculated as a percentage of the selling price; instead, our commission revenue is equivalent to the price difference between the final selling price and underwriting price. We negotiate with a developer for an underwriting price that is as low as possible, with the guarantee that all or a majority of the units will be sold by a specific date. In return, we are given the flexibility to establish the final selling price and earn the price difference between the final selling price and the underwriting price. The risk of this kind of arrangement is that if there are any unsold units on the expiration date of the agreement, then we may have to purchase the unsold property units from the developer at the underwriting price and hold them in our inventory or as investments.
18
We started selling units in the Sovereign Building in January, 2005. As of December 31, 2006, we have reached our sales target by selling 46,779 square meters with a total sales price of $70.45 million. However, there are still unsold properties with aggregate floor area of 314 square meters, which represents 1% of total floor area underwritten, as of December 31, 2006. As of the end of February, 2007, we had sold or acquired all of the units in the building, and we have achieved the sales target by selling 47,093 square meters with a total sales price of $75.96 million.
The Company accounts for underwriting sales in accordance with the FASB guidance of ASC Topic 360, “Property, Plant and Equipment”. The commission revenue on underwriting sales is recognized when the criteria in ASC 360 have been met, generally when title is transferred and the Company no longer has substantial continuing involvement with the real estate asset sold. If the Company provides certain rent guarantees or other forms of support where the maximum exposure to loss exceeds the gain, it defers the related commission income and expenses by applying the deposit method. In future periods, the commission income and related expenses are recognized when the remaining maximum exposure to loss is reduced below the amount of income deferred. In early 2009, the Company renegotiated the rental payments with buyers. Based on the renegotiated agreements, $261,656 of the deferred revenue on underwriting sales was recognized in the first two quarters of 2011.
Property Management
During the year of 2005 and 2006, SZGFH entered into leasing agreements with certain buyers of the Sovereign Building underwriting project to lease the properties for them. These leasing agreements on these properties are for 62% of the floor space that was sold to third party buyers. In accordance with the leasing agreements, the owners of the properties can have a rental return of 8.5% and 8.8% per annum for a period of 5 years and 8 years, respectively. In regards to the leasing agreements, we have negotiated with the buyers and have lowered the annual rental return rate for the remaining leasing period from 8.5% for 5 years to 5.8%, and from 8.8% for 8 years to 6%. As of June 30, 2011, 67% of the buyers agreed upon the lowered rate, 22% of the buyers agreed to cancel the leasing agreements and 11% did not agree to the lowered rate. The leasing period started in the second quarter, 2006, and the Company has the right to sublease the leased properties to cover these lease commitments in the leasing period. As of June 31, 2011, 100 sub-leasing agreements have been signed, the area of these sub-leasing agreements represented 94% of total area with these lease commitments.
We expect that the income from the sub-leasing business will be on a stable growth trend in 2011 and that it can cover the lease commitments in the leasing period as a whole. However there can be no assurance that we will achieve these objectives.
Cost of Revenue
The following table shows the cost of revenue detail by line of business:
|
Three Months Ended June 30,
|
Six Months Ended June 30,
|
|||||||||||||||||||||||||||||||||||||||
|
2011
|
% to
total
|
2010
|
% to
total
|
%
change
|
2011
|
% to
total
|
2010
|
% to
total
|
%
change
|
|||||||||||||||||||||||||||||||
|
Agency Sales
|
681,047 | 44 | % | 1,316,654 | 74 | % | (48 | )% | 1,867,711 | 57 | % | 2,575,896 | 63 | (27 | )% | |||||||||||||||||||||||||
|
Underwriting Sales
|
37,644 | 2 | % | 94,891 | 5 | % | (60 | )% | 61,176 | 2 | % | 167,554 | 4 | (63 | )% | |||||||||||||||||||||||||
|
Property Management
|
826,790 | 54 | % | 694,811 | 21 | % | 19 | % | 1,355,935 | 41 | % | 1,379,628 | 33 | (2 | )% | |||||||||||||||||||||||||
|
Cost of revenue
|
1,545,481 | 100 | 2,106,356 | 100 | (27 | )% | 3,284,822 | 100 | 4,123,068 | 100 | (20 | )% | ||||||||||||||||||||||||||||
The cost of revenue of the second quarter of 2011 was $1,545,481, which decreased 27% from $2,106,356 during the second quarter of 2010. The total cost of revenue of the first two quarters of 2011 was $3,284,822, which decreased 20% from $4,123,068 during the first two quarters of 2010. In the second quarter of 2011, agency sales represented 44% of the total cost of revenue, underwriting sales represented 2%, and property management represented 54%. In the first two quarters of 2011, agency sales represented 63% of the total cost of revenue, underwriting sales represented 4%, and property management represented 33%. The decrease in cost of revenue in the second quarter and first two quarters of 2011 was mainly due to the decrease in the cost of revenue for our agency sales and property management.
Agency sales
As compared with same period in 2011, net revenue of agency sales in the second quarter and first two quarters of 2011 decreased 29% and 44% respectively, and the cost of revenue in the same period decreased by 48% and 27% accordingly. This decreased in cost was mainly due to the decreased in our commissions and consulting costs in the first two quarters of 2011, compared to the same period in 2010, the decrease of such expenses was $110,403.51 and $251,449.53, respectively.
19
Underwriting Sales
The cost of underwriting sales represents selling costs, such as staff costs and advertising expenses, associated with underwriting sales.
Property management
During the year of 2005 and 2006, SZGFH entered into leasing agreements with certain buyers of the Sovereign Building underwriting project to lease the properties for them. These leasing agreements on these properties are for 62% of the floor space that was sold to third party buyers. In accordance with the leasing agreements, the owners of the properties can have a rental return of 8.5% and 8.8% per annum for a period of 5 years and 8 years, respectively. In regards to the leasing agreements, we have negotiated with the buyers and have lowered the annual rental return rate for the remaining leasing period from 8.5% for 5 years to 5.8%, and from 8.8% for 8 years to 6%. As of June 30, 2011, 67% of the buyers agreed upon the lowered rate and 22% of the buyers agreed to cancel the leasing agreements. The leasing period started in the second quarter, 2006, and the Company has the right to sublease the leased properties to cover these lease commitments in the leasing period. As of June 30, 2011, 100 sub-leasing agreements have been signed, the area of these sub-leasing agreements represented 94% of total area with these lease commitments. We anticipate that these properties will be leased out in 2011 and that the gross margin will be improved. However, no assurance can be given that this will be the case.
In connection with our leasing guarantees to third party buyers in the Sovereign Building, an accrual for onerous contracts was recognized equal to the difference between the present value of the sublease income and the present value of the associated lease expense at the appropriate discount rate. The accrual for onerous contracts was $186,193.35 as of June 30, 2011 and $30,712 as of December 31, 2010.
Operating Expenses
The following table shows operating expenses detail by line of business:
|
Three Months Ended June 30,
|
Six Months Ended June 30,
|
|||||||||||||||||||||||||||||||||||||||
|
2011
|
% to
total
|
2010
|
% to
total
|
%
change
|
2011
|
% to
total
|
2010
|
% to
total
|
%
change
|
|||||||||||||||||||||||||||||||
|
Agency sales
|
300,662 | 93 | % | 255,894 | 87 | 17 | % | 592,119 | 90 | 593,529 | 90 | 0 | ||||||||||||||||||||||||||||
|
Property Management
|
21,740 | 7 | % | 37,196 | 13 | (42 | )% | 69,187 | 10 | 68,078 | 10 | 2 | ||||||||||||||||||||||||||||
|
Operating expenses
|
322,402 | 100 | 293,090 | 100 | 10 | % | 661,306 | 100 | 661,607 | 100 | 0 | |||||||||||||||||||||||||||||
The operating expenses of the second quarter of 2011 were $322,402, which increased 17% from $293,090 of the second quarter of 2010. The total operating expenses of the first two quarters of 2011 were $661,306, which remained relatively unchanged from $661,607 in the first two quarters of 2010. In the second quarter of 2011, agency sales represented 93% of the total operating expenses and property management represented 7%. In the first two quarters of 2011, agency sales represented 93% of the total operating expenses and property management represented 7%.
Agency sales
When compared to 2010, the operating expenses for agency sales in the second quarter of 2011 increased 17% and remained relatively unchanged for the first two quarter of 2011. The primary reason for the change was that in the second quarter of 2011, our staff costs and increased $27,374 compared to the same period in 2010.
Property management
When compared to 2010, the operating expenses for property management in the second quarter of 2011 decreased 42%. The primary reason for the change was that in the second quarter of 2011, our marketing/planning expense decreased $11,197, compared to the same period in 2010.
20
General and Administrative Expenses
General Administrative Expense increased for the second quarter and the first two quarters in 2011 as compared to the same periods in 2010 by 23% and 27% respectively. The main reason for the increase in the second quarter and the first two quarters in 2011 was the increase in depreciation cost, which increased $335,591 and $154,848 respectively as compared to the same periods in 2010
Interest Expenses
When compared to 2010, the interest expenses in the second quarter and first two quarters of 2011 increased 197% and 116% respectively. The interest expenses relate to bank loans and promissory notes payable.
LIQUIDITY AND CAPITAL RESOURCES
In 2011, our principal sources of cash were revenues from our agency sales and property management business. Most of our cash resources were used to fund our revenue related expenses, such as salaries and commissions paid to the sales force, daily administrative expenses and the maintenance of regional offices, and the repayments of our bank loans and promissory notes.
As of June 30, 2011, we had a cash position of $1,430,075.
The Company's operating activities during the six months ended June 30, 2011 used cash in the amount of $87,193, which was primarily attributable to our amount due to related party.
The Company's investing activities during the six months ended June 30, 2011 used cash resources of $3,997,081, which was primarily attributable to the acquisition of property, plant and equipment.
The Company's financing activities during the six months ended June 30, 2011 provided cash resources of $2,456,881, which was primarily attributable to proceeds from promissory notes.
The potential cash needs for 2011 are expected to be for the repayments of our bank loans and promissory notes, the rental guarantee payments and promissory deposits for various property projects.
We have accumulated losses of $10,563,169 for the year ended June 30, 2011. Our net working capital deficiency and significant accumulated losses raise substantial doubt about our ability to continue as a going concern. However, management believes that we are able to generate sufficient cash flow to meet our obligations on a timely basis and ultimately to attain successful operations in respect of the agency sales and property management operations.
If our business otherwise grows more rapidly than we currently predict, we plan to raise funds through the issuance of additional shares of our equity securities in one or more public or private offerings. We will also consider raising funds through credit facilities obtained with lending institutions. There can be no guarantee that we will be able to obtain such funds through the issuance of debt or equity that are with terms satisfactory to management and our board of directors.
OFF BALANCE SHEET ARRANGEMENTS
The Company has no off-balance sheet arrangements.
ITEM 3. QUANTITATIVE AND QUALITATIVE DISCLOSURES ABOUT MARKET RISK
A smaller reporting company is not required to provide the information required by this item.
ITEM 4. CONTROLS AND PROCEDURES
Our Chief Executive Officer and our Chief Financial Officer have evaluated the effectiveness of our disclosure controls and procedures as of June 30, 2011. Based on this evaluation, the Chief Executive Officer and Chief Financial Officer have concluded that the Company's disclosure controls and procedures were effective at June 30, 2011, to ensure that information required to be disclosed in reports that we file or submit under the Securities Exchange Act of 1934 is recorded, processed, summarized, and reported within the time periods specified in Securities and Exchange Commission rules and forms. There were no changes in our internal controls over financial reporting during the quarter ending June 30, 2011, that have materially affected, or are reasonably likely to materially affect, our internal controls over financial reporting.
21
PART II - OTHER INFORMATION
ITEM 1. LEGAL PROCEEDINGS
The Company is not a party to any legal proceedings of a material nature.
ITEM 1A. RISK FACTORS
A smaller reporting company is not required to provide the information required by this Item.
ITEM 2. UNREGISTERED SALES OF EQUITY SECURITIES AND USE OF PROCEEDS
On June 24, 2011, we issued 2,500,000 shares of common stock to Good Speed for a consideration of $500,000. The transaction was exempt under Regulation S of the Securities Act of 1933. The proceeds of the sale of the common stock are being used for general working capital
ITEM 3. DEFAULTS UPON SENIOR SECURITIES
None.
ITEM 4. (REMOVED AND RESERVED)
ITEM 5. OTHER INFORMATION
None.
ITEM 6. EXHIBITS
|
Exhibit
|
Description
|
|
|
Number
|
||
|
31.1
|
Section 302 Certification by the Corporation's Chief Executive Officer.
|
|
|
31.2
|
Section 302 Certification by the Corporation's Chief Financial Officer.
|
|
|
32.1and 32,2
|
Section 1350 Certification by the Corporation's Chief Executive Officer and Corporation's Chief Financial Officer.
|
XBRL Exhibit
101.INS† XBRL Instance Document.
101.SCH† XBRL Taxonomy Extension Schema Document.
101.CAL† XBRL Taxonomy Extension Calculation Linkbase Document.
101.DEF† XBRL Taxonomy Extension Definition Linkbase Document.
101.LAB† XBRL Taxonomy Extension Label Linkbase Document.
101.PRE† XBRL Taxonomy Extension Presentation Linkbase Document.
22
SIGNATURES
In accordance with the requirements of the Exchange Act, the Company caused this report to be signed on its behalf by the undersigned, thereunto duly authorized.
SUNRISE REAL ESTATE GROUP, INC.
|
Date: August 18, 2011
|
By: /s/ Lin, Chi-Jung
|
|
Lin, Chi-Jung, Chief Executive Officer
|
|
|
Date: August 18, 2011
|
By: /s/ Liu Zhen Yu
|
|
Liu Zhen Yu, Chief Financial Officer
|
23