Attached files
 Xerium Technologies, Inc.
June 2011
Selected Data –
Earnings Call
EXHIBIT 99.2 |
 Forward Looking Statements
•
This presentation contains forward-looking statements involving risks and
uncertainties, both known and unknown, that may cause the actual
results to differ materially from those indicated.
•
Actual results may differ materially due to a number of factors,
including
those factors discussed in our earnings press release dated August 8, 2011,
and other factors discussed in our filings with the SEC. Copies of these
filings are available from the SEC and in the investor relations
section of our
website at www.xerium.com.
•
These slides, the associated remarks and comments made during our
second quarter 2011 financial results conference call, our earnings release
dated August 8, 2011 and the reconciliation of certain non-GAAP financial
information posted in the investor relations section of our website are
integrally related and are intended to be presented and understood
together.
2 |
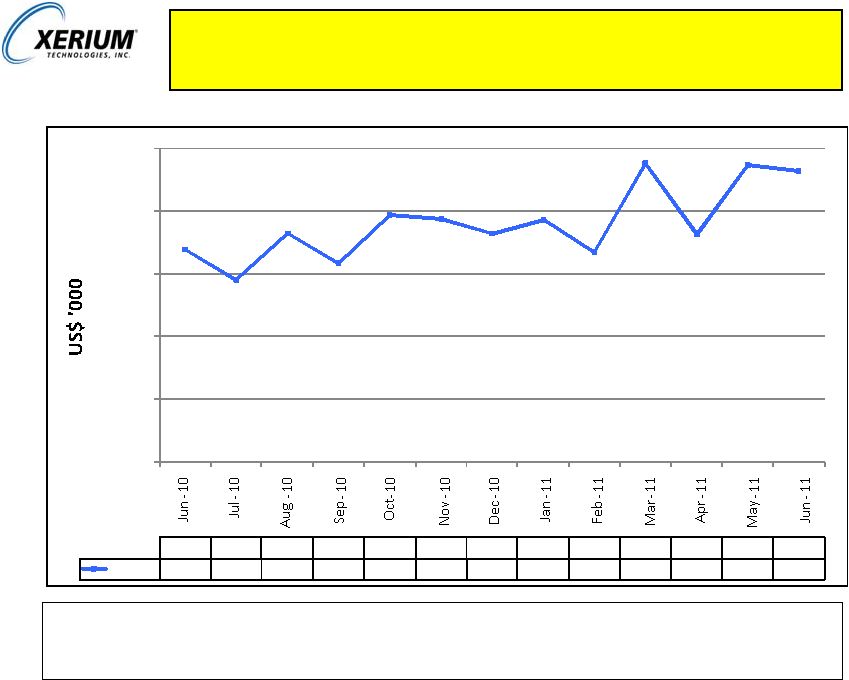
 Bookings Analysis –
Total Xerium
New order bookings for Q2 2011 are $142.9M compared to Q2 2010 of $143.7M, a $0.8M
decrease. Bookings in 2011 have been positively influenced as compared
to 2010 by the USD/Euro exchange rate.
3
35,000
40,000
45,000
50,000
55,000
60,000
Jun-10
Jul-10
Aug-10
Sep-10
Oct-10
Nov-10
Dec-10
Jan-11
Feb-11
Mar-11
Apr-11
May-11
Jun-11
Bookings
49,462
47,518
43,925
51,232
48,259
48,137
46,369
53,238
50,082
52,033
42,836
51,661
48,435 |
 Bookings
Analysis
–
Roll
Coverings
Rolls new order bookings of $56.0M in Q2 2011 are 17.4% higher than Q2 2010 levels
of $47.7M. Bookings in 2011 have been positively influenced as compared to
2010 by the USD/Euro exchange rate.
4
10,000
12,000
14,000
16,000
18,000
20,000
Jun-10
Jul-10
Aug-10
Sep-10
Oct-10
Nov-10
Dec-10
Jan-11
Feb-11
Mar-11
Apr-11
May-11
Jun-11
Bookings
16,789
15,809
17,279
16,341
17,890
17,758
17,276
17,739
16,713
19,549
17,263
19,475
19,304 |
 Bookings
Analysis
–
Paper
Machine
Clothing
New order bookings of $86.9M are lower than Q2 2010 levels of $96.0M. PMC
bookings are being constrained to prevent lead time extension.
Bookings in 2011 have been positively
influenced as compared to 2010 by the USD/Euro exchange rate.
5
15,000
20,000
25,000
30,000
35,000
40,000
Jun-10
Jul-10
Aug-10
Sep-10
Oct-10
Nov-10
Dec-10
Jan-11
Feb-11
Mar-11
Apr-11
May-11
Jun-11
Bookings
32,673
31,709
26,646
34,891
30,370
30,395
29,095
35,502
33,370
32,484
25,572
32,187
29,132 |
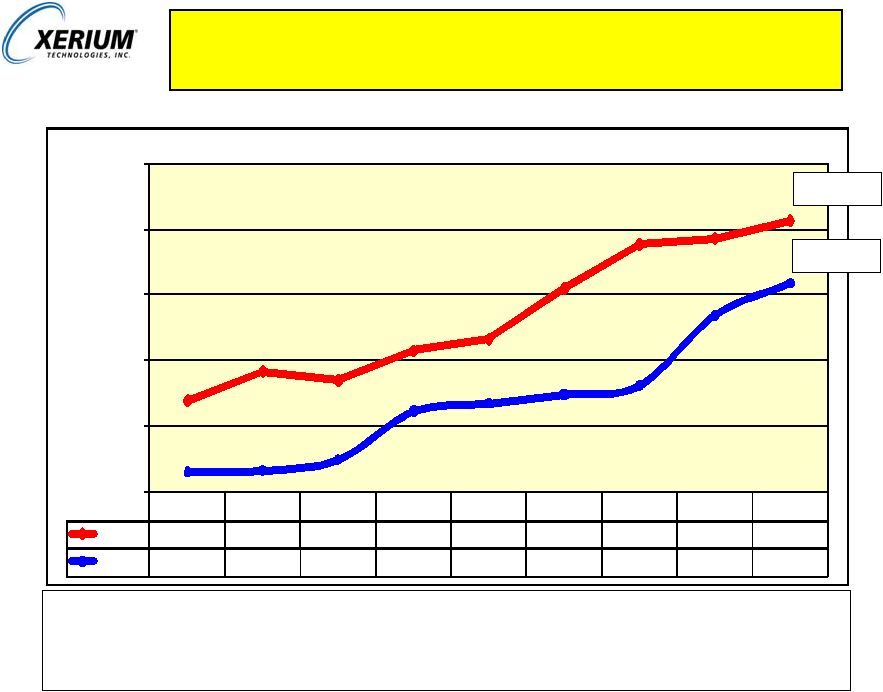 New
Product Sales as a Percent of Revenue Meaningful progress
continues on Xerium’s goal to increase its technological leadership. Our
goal is to derive 60% of XRM’s sales revenue from new products (those
developed within the prior
five
years)
that
make
a
measurable
improvement
in
customer
performance
while
simultaneously reducing our operating costs.
6
09 Q2
09 Q3
09 Q4
10 Q1
10 Q2
10 Q3
10 Q4
11 Q1
11 Q2
Clothing
23.9%
28.4%
27.0%
31.5%
33.3%
41.0%
47.7%
48.6%
51.3%
Rolls
13.1%
13.3%
14.9%
22.3%
23.5%
24.8%
26.2%
36.9%
41.8%
10%
20%
30%
40%
50%
60%
$ 51.1M
$ 21.2M |
 Xerium’s New Product Categorization
7
New products are categorized by their level of innovation and strategic purpose
|
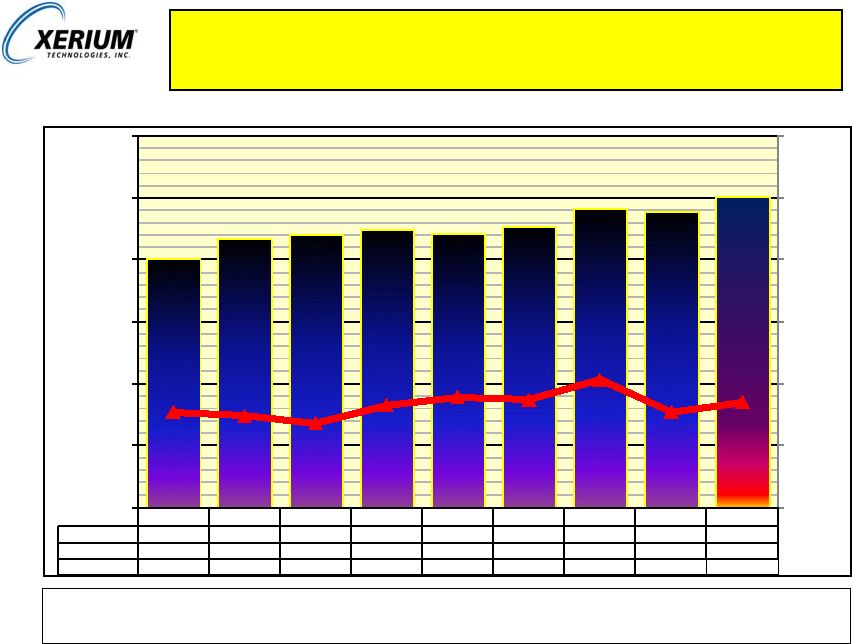 Total
Xerium Quarterly Sales and Gross Margin 000’s
Q2
2011
sales
increased
13.3%
over
Q2
2010
and
5.0%
over
Q1
2011
primarily
due
to
higher
product demand. Gross margin dollars increased 7.3% over Q1 2011.
8
'09 Q2
'09 Q3
'09 Q4
'10 Q1
'10 Q2
'10 Q3
'10 Q4
'11 Q1
'11 Q2
Qtr Sales $
120.8
130.3
132.4
135.0
132.8
135.9
144.6
143.2
150.4
Year
-
over-Year
(29.1%)
(18.2%)
(11.4%)
15.9%
9.9%
4.3%
9.2%
6.1%
13.3%
Gross Margin
37.7%
37.4%
36.8%
38.3%
38.9%
38.7%
40.3%
37.7%
38.5%
30.0%
35.0%
40.0%
45.0%
50.0%
55.0%
60.0%
$0
$30
$60
$90
$120
$150
$180 |
 S G
& A as a Percent of Revenue, excluding Operational & Financial
Restructuring Expenses (A)
Excludes operational restructuring expenses
(B)
Excludes operational restructuring expenses and financial restructuring
expenses. Note –
a reconciliation of SG&A as a percentage of revenue excluding (A) operational
restructuring expenses and (B) operational and financial restructuring
expenses is available in the investor relations section of the Company’s website at www.xerium.com.
In 2011, SG&A as a percent of sales is 26.3% as compared to Q1 2011 of
27.9%. The improvement is driven primarily by a favorable Value Added
Tax (“VAT”) ruling in South America, decreased legal, insurance,
and consulting fees, and decreased incentive compensation. 9
'09 Q2
'09 Q3
'09 Q4
'10 Q1
'10 Q2
'10 Q3
'10 Q4
'11 Q1
'11 Q2
SG&A % (A)
20.9%
27.0%
31.3%
35.4%
28.9%
26.9%
25.1%
27.9%
26.3%
SG&A% (B)
20.7%
25.5%
26.4%
28.4%
28.6%
26.9%
25.1%
27.9%
26.3%
15%
20%
25%
30%
35%
40%
‘09 Q2
Sales = $120.8
‘10 Q2
Sales = $132.8
‘11 Q2
Sales = $150.4
‘09 Q2
Sales = $120.8
‘10 Q2
Sales = $132.8
‘11 Q2
Sales = $150.4 |
 Trailing Twelve Month (“TTM”) Adjusted EBITDA
10
Q2-09
Q3
Q4
Q1-10
Q2
Q3
Q4
Q1-11
Q2-11
Adjusted EBITDA by Qtr
32,325
27,916
24,753
24,476
25,230
29,093
35,251
26,145
30,195
Adjusted EBITDA LTM
107,535
107,455
105,561
109,470
102,375
103,552
114,050
115,719
120,684
$100,000
$105,000
$110,000
$115,000
$120,000
$125,000
$130,000
$135,000
$140,000
$0
$5,000
$10,000
$15,000
$20,000
$25,000
$30,000
$35,000
$40,000
Note: Adjusted EBITDA at each quarter was the amount as calculated per the definition in the New
Credit Facility with the exception that we have added back financial restructuring costs
incurred in Q1 ($9.6M) and Q2 ($15.3M) of 2010 as part of the reorganization. A reconciliation of Trailing Twelve Month Adjusted
EBITDA to Net Income (Loss) is available in the investor relations section of the Company’s
website at www.xerium.com. |
 Trade Working Capital (“TWC”) as a Percent of
Revenue
'09 Q2
'09 Q3
'09 Q4
'10 Q1
'10 Q2
'10 Q3
'10 Q4
'11 Q1
'11 Q2
Revenue 000's
120.8
130.3
132.4
135.0
132.8
135.9
144.6
143.2
150.4
TWC% Qx4
29.4%
27.8%
25.3%
25.6%
24.3%
26.5%
24.6%
27.7%
27.9%
$100
$110
$120
$130
$140
$150
$160
15%
20%
25%
30%
35%
Year-to-date
TWC
%
has
increased
primarily
due
to
currency,
higher
sales
demand,
prebuild
to
support annual sales targets and accelerated raw material purchases in advance of
anticipated oil driven price increases.
11
(Note: a reconciliation of Trade Working Capital to Revenue is available in the investor relations
section of the Company’s website at www.xerium.com. |
 Total Xerium Annual Capital Expenditures
2008
2009
2010
2011
CAPEX
39.0
19.5
27.9
12.0
2011 Budget
32.4
$0
$15
$30
$45
000's
2011 investments focus on new products and existing equipment capacity and
performance upgrades.
12 |