Attached files
| file | filename |
|---|---|
| 8-K - FORM 8-K - Clearwater Paper Corp | d8k.htm |
 Clearwater Paper Corporation
Jefferies 2011 Global Industrial and A&D Conference
August 9, 2011
Exhibit 99.1 |
 1
Forward-Looking Statements
This presentation contains, in addition to historical information, certain forward-looking
statements within the meaning of the Private Securities Litigation Reform Act of 1995,
including statements regarding our strategies to grow our business, the benefits of, and synergies
from, our Cellu Tissue acquisition, internal and external pulp purchases and transfers,
internal pulp production and requirements, customer purchases of Private Label tissue, production capacity of operating divisions, completion of additional converting and
paper making capacity and the expected financial returns from these investments, efficiency projects
and reductions to our cost structure, our share repurchase program and stock split and the
expected benefit thereof, our capital allocation objectives, our financial priorities, such as growing free cash flow and maintaining modest leverage, estimated annual
EBITA sensitivities, the cost and timing to complete new facilities, future growth and market
opportunities, sales volumes, input costs, and our financial condition and results of
operations. Words such as “anticipate,” “expect,” “intend,”
“will,” “plan,” “target,” “project,” “believe,” “schedule,” “estimate,” “may,” and similar expressions are intended to identify
such forward-looking statements. These forward-looking statements are based on
management’s current expectations, estimates, assumptions and projections that are subject to
change. Our actual results of operations may differ materially from those expressed or implied by the
forward-looking statements contained in this presentation. Important factors that could
cause or contribute to such differences include the risk factors described in Item 1A of Part I of our Form 10-K for the year ended December 31, 2010, as well as the
following:
•
an inability to successfully implement our expansion and operating strategies; •
difficulties with the integration process or the realization of the benefits expected from the
acquisition of Cellu Tissue;
•
difficulties with the completion of our new tissue making and converting facilities; •
the Cellu Tissue acquisition may expose our operations to unidentified liabilities; •
changes in the cost and availability of wood fiber used in the production of our products; •
changes in freight costs and disruptions in transportation services; •
changes in raw material costs and energy availability and costs; •
changes in customer product preferences and competitors’ product offerings; •
changes in the United States and international economies and in general economic conditions in the
regions and industries in which we operate;
•
cyclical industry conditions;
•
the loss of business from any of our three largest Consumer Products segment customers or a large
Pulp and Paperboard segment customer;
•
competitive pricing pressures for our products; •
reliance on a limited number of third party suppliers for raw materials; •
our qualification to retain, or ability to utilize, tax credits associated with alternative fuels or
cellulosic biofuels and the tax treatment associated with such credits; •
unforeseen environmental liabilities or expenditures; •
unanticipated manufacturing or operating disruptions, including equipment malfunction and damage to
our manufacturing facilitates caused by fire or weather-related events and IT system
failures; •
changes in the relationship between supply and demand in the forest products industry,
including the amount of available manufacturing capacity and wood fiber used in manufacturing
our products;
•
changes in expenses and required contributions associated with our pension plans; •
labor disruptions;
•
an inability to fund our debt obligations; •
restrictions on our business from debt covenants and terms; •
changes in laws, regulations or industry standards affecting our business; and •
changes in exchange rates between the U.S. dollar and other currencies. Forward-looking statements contained in this presentation present management’s views
only as of the date of this presentation. We undertake no obligation to publicly update
forward-looking statements, whether as a result of new information, future events or otherwise. |
 2
•
We are a company formed two years ago with
more than 60 years of operating history
•
A leader in Private Label consumer tissue and
bleached paperboard
•
Focused on producing high quality products
that help our customers build their brands
•
Operate
in
two
segments
of
similar
size
1
–
Pulp
and
Paperboard
–
51%
–
Consumer
Products
–
49%
•
Financial overview
–
LTM 6/30/11 Net Sales: $1.7 billion
–
LTM 6/30/11 Adjusted EBITDA: $189.4
million
–
5 year average annual Free Cash Flow
(FCF) generation (2006-2010): $76.9 million
1
Last twelve months (LTM) net sales as of 6/30/11
Introduction to Clearwater Paper |
 3
•
Lead Private Label quality
•
Expand geographically
•
Expand retail channel
penetration
Our Strategy
Grow our Tissue
Business
New Shelby
Facility and
CLU
Acquisition
•
Improve sales mix
•
Reduce costs
•
Continue to improve quality
LEAN
Manufacturing
and Capital
Improvements
=
=
Build a High
Performance
Culture
•
Develop common culture
•
Drive for results
•
Attract and retain high
performers
Core Values
and Talent
Management
=
Optimize
Profitability of
Paperboard
Business |
 4
New Shelby Facility |
 Shelby
•
ON BUDGET with original estimate of $260-
$280 million
•
ON TIME with original construction
projections
•
ON QUALITY with selection of Metso
technology
•
ON TASK with dedicated project team to
ensure results
5
•
First two converting lines operational
•
Consolidate third-party warehouse to
Shelby
•
Paper machine and remaining
converting lines operational
•
Commence product trials |
 Shelby
6 |
 Shelby
7 |
 Shelby
8 |
 9
Cellu Tissue Acquisition |
 of the
total category 10
Expansion Opportunities
Clearwater Paper has been a strong influence in the development of private label
tissue in the Western U.S. An opportunity exists to grow private label
category development and company share in the Eastern U.S.
Source: SymphonyIRI InfoScan. 52 Weeks Ending May 29,
2011 Data excludes Cellu Tissue
WESTERN
GROCERY
23%
of the U.S. Population
Corporate Brand
39%
of the total category
Clearwater Paper
91%
of total corporate brand
MID-WESTERN
GROCERY
33%
of the U.S. Population
Corporate Brand
27%
of the total category
Clearwater Paper
66%
of total corporate brand
EASTERN
GROCERY
44%
of the U.S. Population
Corporate Brand
24%
of the total category
Clearwater Paper
28%
of total corporate brand
TOTAL U.S.
GROCERY
100%
of the U.S. Population
Corporate Brand
28%
Clearwater Paper
57%
of total corporate brand |
 11
The acquisition of Cellu Tissue provides us with . . .
•
A national manufacturing footprint that allows greater
efficiencies
•
New retail channel opportunities
•
Estimated annual run rate synergies of $35-$40 million by the end
of 2012
Strategic Benefits of Acquisition |
 Estimated Breakdown of Acquisition Synergies*
12
Manufacturing –
Moving parent rolls to converted
cases
Transportation –
Product spec changes and lower
miles
Warehousing –
Closing duplicate facilities
Procurement –
Purchasing power and economies
of scale
Fiber
–
Increased use of internal pulp
Wages
–
Streamlining processes and overhead
Dedicated team focused on delivering synergies!
* Estimated annual run rate synergies of $35-$40 million by the end of
2012 |
 13
Consumer Tissue |
 14
Attractive Industry Characteristics
Within
the
tissue
market,
Private
Label
penetration
has
also
grown
substantially
since
2002
2
The
tissue
market
has
grown
an
average
of
2%
annually
since
1996
1
Source: RISI and IRI
1 Based on converted short tons
2 Represents market share as a % of sales in U.S. grocery channel
|
 15
Therefore they require:
•
National brand-like quality to support high quality store
brands
•
High quality packaging and branding support
•
Complete mix of product offerings to support retailer
assortment objectives
•
Category management support and expertise
•
Experience and execution to deliver a comprehensive
Private Label tissue program
Private Label is a Strategic Focus for Retailers |
 Private Label Packaging Quality is More Important Than
Ever Before
16
Mid 60’s to 70’s
2011
•
Private Label tissue packaging has become
more brand-like in quality since the early
days of generic store brand tissue
•
Clearwater Paper manages over 1,300 retail
package sku’s for its customers |
 Tissue is an Important Category for Retailers
SOURCE: 52 Week Sales Food, Drug, Mass without Wal-Mart, May 29, 2011,
Symphony IRI 17
Segment
% Category (cases)
Annual Sales
Bath Tissue
55%
$4.2B
Paper Towels
32%
$2.5B
Facial Tissue
7%
$795MM
Paper Napkins
6%
$360MM
Est.
Total Category
$7.86B |
 The
Tissue Category – Lots of Options For Consumers . . . .
•
Single Ply
•
Double Ply
•
Triple Ply
•
Ultra Quality
•
Premium Quality
•
Value Quality
•
Economy Quality
•
Virgin Fiber
•
Recycled Fiber
18 |
 The
Tissue Category – even more options…
19 |
 20
Complex Category Segmentation Requires Expertise
•
Clearwater Paper is well represented in all segments of the tissue category,
including a leading presence in the value and economy product tier
•
Clearwater Paper is the category leader in providing a full-range of product
tier offerings nationwide
Quality
Tier
Bathroom Tissue
Household
Towels
Facial Tissue
Napkins
3 National
Brands
Private
Label 4,
6, 9, 12, 18, 24, 30 roll packs
Private Label
1,2,6,8,12,15 roll packs
Private Label
Multiple standard count
cartons
2 National Brands
Private Label
40,60,100,200 count
packs
30% of Bath
Segment
53% of Towel
Segment
24% of Facial
Segment
30% of Napkin
Segment
Private Label
4, 6, 9, 12, 18, 24, 30
roll packs
Private Label
1,2,3,6,8,12 roll packs
Private Label
Multiple standard
count cartons
Private Label
160,200 count packs
45% of Bath
Segment
24% of Towel
Segment
71% of Facial
Segment
10% of Napkin
Segment
No Leading National
Brand
Private Label
1, 4, 6, 9, 12, 24 roll packs
No Leading National
Brand
Private Label
1,3,6,8,12,15 roll packs
No Leading National
Brand
Private Label
No standard counts
No Leading National
Brand
Private Label
Multiple standard counts
23% of Bath
Segment
20% of Towel
Segment
4% of Facial
Segment
56% of Napkin
Segment
Small Niche
Brands
Private
Label 4, 6, 12
roll packs Private Label
1,3,6 roll packs
Small Niche Brands
Private Label
No standard counts
Small Niche Brands
Private Label
No standard counts
2% of Bath
Segment
3% of Towel
Segment
1% of Facial
Segment
4% of Napkin
Segment
ULTRA
highest
quality
attributes
PREMIUM
higher
quality
attributes
VALUE /
ECONOMY
lower
quality,
price driven
value
GREEN
RECYCLED
Niche
segment
for green
consumers
2 National Brands
2 National Brands
2 National Brands
2 National Brands
2 National Brands
Small Niche Brands
2 National Brands |
 Clearwater Paper Adds Unique Value Through FSC and
Rainforest Alliance Certification
21 |
 22
Paperboard |
 23
Attractive Industry Characteristics
100
99
105
103
108
102
100
100
101
106
108
108
109
108
97
101
$880
$760
$810
$740
$713
$773
$728
$700
$727
$713
$772
$718
$861
$961
$1,031
$1,082
600
800
1,000
1,200
60
80
100
120
1995
1996
1997
1998
1999
2000
2001
2002
2003
2004
2005
2006
2007
2008
2009
2010
U.S. Bleached Paperboard Demand (Indexed)²
U.S. Bleached Paperboard Price ($/short ton)³
Source: RISI.
1 Top 5 manufacturers in 1998 were International Paper, Westvaco,
Temple-Inland, Georgia-Pacific and Potlatch. Top 5 manufacturers in 2010 were International Paper, MeadWestvaco,
Georgia-Pacific, Evergreen Packaging and Clearwater Paper
2 Based on tons produced
3 Average price per short ton of 16 pt. SBS folding carton C1S
2010 North American Bleached
Paperboard (SBS) Production
Pulp
and
Paperboard
1
Capacity
Top 5 Manufacturers
Stable demand for U.S. paperboard products
Demand
Price |
 Estimated Industry Mix
24
SOURCE: RISI / Company Websites / Internal Estimates
Cup
Liquid Packaging
Folding/CIS |
 25
Efficiency and Optimization
•
Lean initiatives focusing on non-capital solutions for driving out
waste and improving quality
•
Cost reduction projects:
•
Lower Columbia reload facility for sawdust to increase fiber
supply
•
Chip screening at Lewiston to improve quality
•
Refocusing pulp mill operations as cost centers to
concentrate resources on improving efficiency
•
Strong pulp integration –
we produce 68% of our pulp
requirements |
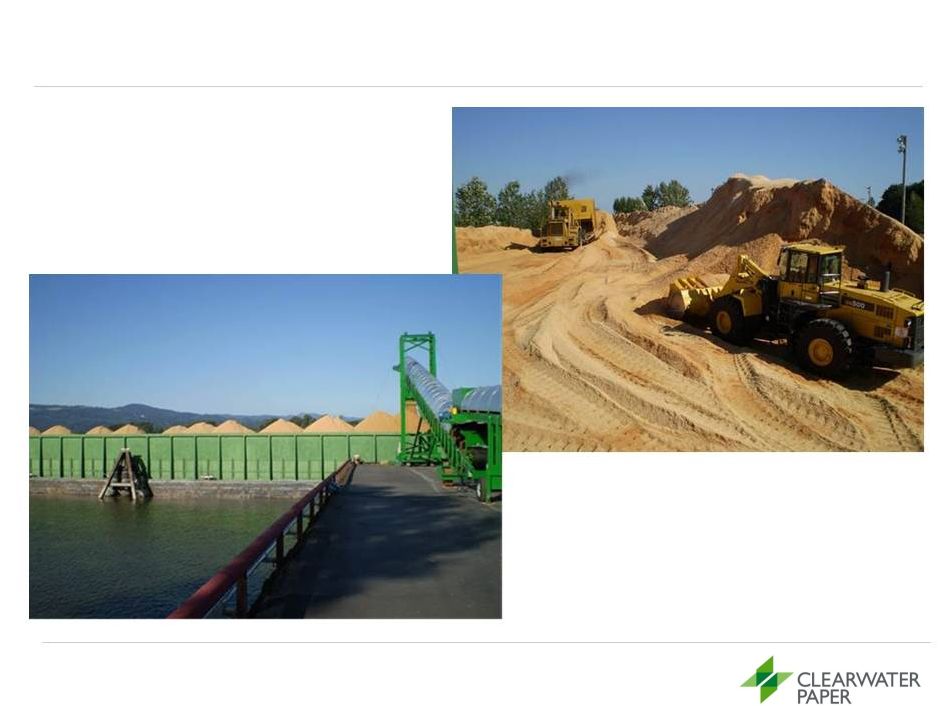 Lower Columbia Reload Facility
26 |
 27
Financial Overview |
 Financial Priorities
•
Grow free cash flow through strong operating performance
•
Maintain
modest
leverage
in
the
range
of
Net
Debt/EBITDA
of
1x –
4x
•
Focus on appropriate liquidity levels for growth and business
cycles
•
Deploy capital effectively and perform post audits
28 |
 Stock Repurchase
Debt Pay Down
Pension Payments
Dividend
Shorter
Longer
Illustrative of Projects Meeting Return Hurdle Rates
Greenfield
M&A
29
Our objective is to allocate capital using a dynamic framework to
create strong returns to shareholders
while providing appropriate
liquidity to meet growth objectives and compete effectively
Capital Allocation
Return Timeframe
Capital allocation CLW has deployed
Capital |
 Recent Financial Announcements
Share Repurchase
•
Repurchase of up to $30 million of common stock
•
Expect to fund repurchase with cash on hand
•
May repurchase shares in the open market or as otherwise may be determined by
management, subject to market conditions, business opportunities, and other
factors •
Purchases
would
help
offset
share
dilution
from
equity
incentive
plans
2-for-1
Stock
Split
•
Stock dividend payable on August 26, 2011 to shareholders of record on August 12,
2011 •
11,519,260 shares outstanding at June 30, 2011. Immediately following the
distribution of the stock dividend, approximately 23 million shares
outstanding •
Split intended to improve share liquidity
•
Significant share price appreciation since spin also a factor
30 |
 CPD
PPD
Adj. EBITDA Margin %
Financial Track Record
Adjusted EBITDA and Segment Adjusted EBITDA
5 Yr. Average (excluding LTM): $124
$41
$34
$53
$138
$87
$78
$70
$80
$35
$51
$111
$139
9.0%
8.8%
6.0%
13.9%
12.2%
11.4%
2006
2007
2008
2009
2010
LTM
$445
$452
$504
$554
$570
$825
$672
$731
$751
$696
$803
$876
2006
2007
2008
2009
2010
LTM
31
($ in millions)
Net Sales and Segment Net Sales
$1,117
$1,183
$1,255
$1,250
$101
$104
$75
$174
$1,373
$167
$1,701
$189
3
1
2
1
Excludes
intersegment
net
sales
and
transfers.
Net
sales
for
2010
for
CPD
includes
four
days
of
Cellu
Tissue
results.
Prior
periods
have
no
Cellu
Tissue
amounts
2 See
Appendix:
“Detailed
Financials”
for
the
definition
of
Adjusted
EBITDA
and
Segment
Adjusted
EBITDA
as
well
as
the
reconciliation
to
the
most
comparable
GAAP
measures
3 Adjusted EBITDA margin percentage calculated by dividing Adjusted EBITDA by
Net Sales 5 Yr. Average (excluding LTM): $1,236 |
 Historical Cost Drivers -
Wood Fiber
32
Total Cost
:
% of Total
Cost of Sales
2009
2010
2008
$325.4 M
28%
$269.7 M
26%
$314.3 M
27%
1 Excludes intersegment amounts and CLU amounts prior to acquisition
•
Wood fiber includes pulp, wood chips, sawdust and saw logs
•
Historically, we were a net buyer of approximately 85,000 tons of pulp
annually. Going forward, we expect to be a net buyer of
approximately 400,000 tons of pulp annually •
Historically and prior to the Cellu Tissue acquisition, we produced approximately
800,000 tons of pulp representing about 92% of our total annual pulp
needs. We expect to continue to produce the same amount of pulp going
forward, which would represent approximately 68% of our total anticipated
annual pulp needs •
Generally we use a mix of pulp including northern softwood, southern softwood,
northern hardwood, eucalyptus and recycled
•
Commencing on January 1, 2011, we began accounting for the transfer of pulp from
the Pulp and Paperboard division to the Consumer Products division at cost
instead of market price because, over time, we intend to use all of our pulp
internally. Accordingly, there will be no intersegment
sales for this item going forward
$124.9 M
29%
Q2’11
LTM
6/30/11
$394.5 M
28%
Wood
Fiber
1 |
 Historical Cost Drivers –
All Other
33
Total Cost:
% of Total
Cost of Sales
2009
2010
Energy
2008
Total Cost:
% of Total
Cost of Sales
Total Cost
:
% of Total
Cost of Sales
$143.0 M
12%
$114.7
10%
$97.3
9%
$92.0
8%
$123.2
10%
$100.3
9%
$117.3
10%
$ 61.9
5%
$70.0
7%
$82.4
7%
$123.2 M
12%
$132.3 M
11%
Maintenance
& Repair
Total Cost:
% of Total
Cost of Sales
Chemicals
1 Excludes related labor costs
Transportation
Q2’11
$31.8
7%
$36.6
8%
$22.3
5%
$44.3 M
10%
$111.5
8%
$131.1
9%
$87.4
6%
$151.8 M
11%
LTM
6/30/11
1 |
 34
Cost Sensitivities
Change
EBITDA
Variable
Metric
$/Unit
($ Millions)
Purchased Pulp
$/Ton
$50.00
+/-
$20
Chips/Sawdust
$/Ton
$5.00
+/-
$9
Transportation
$/Gallon
$1.00
+/-
$9
Chemicals
$/Prod Ton
$5.00
+/-
$7
Natural Gas
$/mmbtu
$0.50
+/-
$5
Estimated Annual EBITDA Sensitivities
$0
$5
$10
$15
$20
$25
+/-
+/-
+/-
+/-
+/- |
 35
($ in millions)
1
See
Appendix
“Detailed
Financials”
for
the
definition
of
EBITDA,
Adjusted
EBITDA
and
Free
Cash
Flow
as
well
as
a
reconciliation
to
the
most
comparable
GAAP
measures.
2009,
2010
and LTM
amounts are Adjusted EBITDA and all other periods represent EBITDA
2
See
Appendix
“Detailed
Financials”
or
supporting
schedules
3
We
converted
gallons
previously
claimed
un
the
Alternative
Fuel
Mixture
Tax
Credit,
or
AFMTC,
to
Cellulosic
Biofuel
Producer
Credit,
or
CBPC
Free Cash Flow
Free
cash
flow
on
an
LTM
basis
was
impacted
by
Shelby
capital,
taxes
paid
in
connection
with
our
transition
to
CBPC
and
pension
funding
2006
2007
2008
2009
2010
LTM through
6/30/11
EBITDA/Adjusted EBITDA
1
$100.6
$103.7
$75.4
$174.3
$166.8
$189.4
Capital Expenditures
(27.5)
(20.5)
(21.3)
(19.3)
(46.1)
(94.9)
Cash Taxes Paid
2
(12.4)
(14.1)
(5.6)
(41.3)
(28.6)
(55.3)
Cash Net Interest Expense
(13.0)
(13.0)
(13.1)
(15.1)
(15.9)
(30.1)
Working Capital Dec (Inc)
2
13.9
37.6
(21.2)
(99.6)
88.5
(57.6)
Other Cash Flow Items
2
6.9
(5.7)
6.6
88.2
(44.7)
(31.2)
Free Cash Flow
1
$68.5
$88.0
$20.8
$87.2
$120.0
(79.7)
3 |
 36
($ in millions)
Balance Sheet
2009
2010
Q2 2011
Current Assets
Cash & Short-Term Investments
$190.8
$148.7
$128.1
Receivables, net
94.5
153.3
182.0
Taxes Receivable
101.3
10.4
12.2
Inventories
169.8
228.3
223.6
Prepaid Expenses and Other
15.9
48.8
50.2
$572.3
$589.5
$596.1
Long-Term Assets
Property, Plant & Equipment
364.0
654.5
696.8
Goodwill & Intangibles
-
285.9
282.5
Other
11.2
15.4
13.5
375.2
955.8
992.8
Total Assets
$947.5
$1,545.3
$1,588.9
Current Liabilities
Accounts Payable & Accrued Liabilities
109.8
184.6
183.2
Other
9.9
10.5
25.0
Long Term Liabilities
Long Term Debt
148.3
538.3
523.6
Deferred Taxes
-
61.1
75.5
Other Long Term Obligations
242.3
210.5
215.5
Accrued Taxes
73.5
72.0
73.4
Total Liabilities
$583.8
$1,077.0
$1,096.2
Total Stockholders' Equity
$363.7
$468.3
$492.7
Total Liabilities & Stockholders' Equity
$947.5
$1,545.3
$1,588.9
Cash and Short-Term Investments
$190.8
$148.7
$128.1
Available Revolver Amount
106.8
121.0
116.6
Total Liquidity
$297.6
$269.7
$244.7
Adjusted
EBITDA
to
Interest
Expense,
net
1
11.2X
7.4X
4.8X
Total
Debt/Adjusted
EBITDA
0.9
3.2
NA
1
See Appendix “Detailed Financials” for the definition of EBITDA, Adjusted EBITDA and Free
Cash Flow as well as a reconciliation to the most comparable GAAP measures. 2009, 2010 and
LTM amounts are Adjusted EBITDA and all other periods represent EBITDA Assets
Liabilities
1 |
 37
Appendix:
Detailed Financials |
 38
Income Statement
($ in millions)
1
See
Appendix
for
definition
of
EBITDA
and
a
reconciliation
to
most
comparable
GAAP
measure
2006
2007
2008
2009
FY 2010
Q2 2011
LTM Through
6/30/11
Net Sales
$1,116.9
$1,183.0
$1,255.3
$1,250.1
$1,373.0
$494.6
$1,658.9
Costs & Expenses
Materials, Labor, & Other Operating Expenses
1,033.6
1,083.8
1,179.4
1,052.2
1,173.8
433.3
1,433.6
Selling, General, & Administrative
45.5
46.8
47.4
71.1
100.4
27.5
117.0
Income from Canadian Lumber Settlement
8.5
-
-
-
-
-
-
Alternative fuel mixture tax credit
-
-
-
170.6
-
-
-
Earnings (Loss) Before Interest, Other,
Debt Retirement Costs and Income Taxes
$46.3
$52.4
$28.5
$297.4
$98.8
$33.8
$108.3
Margin (%)
4.1%
4.4%
2.3
%
23.8
%
7.2%
6.8%
6.5%
Depreciation and Amortization
54.3
51.3
47.0
47.4
47.7
18.9
61.5
EBITDA
1
$100.6
$103.7
$75.4
$338.7
$146.5
$52.4
$169.1
Margin (%)
9.0%
8.8%
6.0
%
27.1
%
10.7%
10.6%
10.2%
Interest Expense
13.0
13.0
13.1
15.5
22.6
11.0
36.5
Debt Retirement Cost
-
-
-
6.2
-
-
-
Other
-
-
-
-
-
0.2
0.7
Earnings Before Income Taxes
$33.3
$39.4
$15.3
$275.7
$76.2
$22.6
$71.1
Income Tax provision
12.4
14.1
5.6
93.2
2.4
8.6
(1.2)
Net Earnings
$20.9
$25.3
$9.7
$182.5
$73.8
$13.9
$72.3 |
 39
Reconciliation of GAAP to Non-GAAP:
Net Cash from Operating Activities to Free Cash Flow
($ in millions)
1
2009
amount
excludes
$170.6
million
of
alternative
fuel
mixture
tax
credits
for
the
period
late
January
through
December
31,
2009
2006
2007
2008
2009
2010
LTM through
6/30/11
Net Cash Provided by Operating
Activities
1
$96.0
$108.5
$42.1
$54.2
$185.6
$65.4
Capital Expenditures
(27.5)
(20.5)
(21.3)
(19.3)
(46.1)
(94.9)
Non-cash Net Interest Expense
-
-
-
0.4
6.7
6.4
Non-cash Tax Expense
-
-
-
51.9
(26.2)
(56.6)
Free Cash Flow
1
$68.5
$88.0
$20.8
$87.2
$120.0
(79.7) |
  40
Free Cash Flow –
Working Capital
($ in millions)
2006
2007
2008
2009
2010
LTM through
6/30/11
Dec (Inc) in Receivables
$(21.2)
$18.8
$(8.8)
$9.5
$(9.9)
$(23.0)
Dec (Inc) in Tax Receivables
-
-
-
(101.3)
$93.8
$(9.4)
Dec (Inc) in Inventories
32.1
(8.5)
(14.0)
(16.8)
(3.9)
(25.4)
Dec (Inc) in Prepaid Expenses
(0.7)
0.4
(0.5)
0.1
(5.0)
(0.9)
Inc (Dec) in Taxes Payable
4.6
18.1
0.8
(0.8)
-
(2.7)
Inc (Dec) in Accounts Payable
and Accrued Liabilities
(0.8)
8.9
1.3
9.7
13.5
3.8
Working Capital Dec (Inc)
$13.9
$37.6
$(21.2)
$(99.6)
$88.5
$(57.6) |
 41
Free Cash Flow –
Other
($ in millions)
2006
2007
2008
2009
2010
LTM through
6/30/11
Equity-Based Compensation
Expense
$1.4
$3.3
$2.3
$5.6
$8.5
$8.4
Employee Benefit Plans
3.0
(1.0)
1.1
14.1
15.0
13.9
(Gain) Loss on Disposal of
Plant and Equipment
0.3
0.1
(0.2)
0.2
0.5
1.1
Change in Other Assets
-
-
(1.6)
(0.5)
0.1
6.0
Funding of Qualified Pension
Plans
(6.1)
-
-
-
(25.1)
(24.6)
Excess Tax Benefit from Share-
based Payment Arrangements
-
-
-
(0.1)
(0.9)
1.7
Change in Non-current Accrued
Taxes
-
-
-
73.5
(4.3)
(3.7)
Change in Deferred Taxes
8.3
(8.1)
4.9
(4.6)
(15.0)
(7.1)
Other
-
0.1
0.1
-
(23.5)
(26.9)
Other Cash Flow Items
$6.9
$(5.7)
$6.6
$88.2
$(44.7)
$(31.2) |
 42
Reconciliation of GAAP to Non-GAAP:
Clearwater Paper EBITDA and Adjusted EBITDA
1 See last page of this Appendix for definitions of EBITDA and Adjusted
EBITDA ($ in millions)
2006
2007
2008
2009
2010
Q2 2011
LTM through
6/30/11
Net Earnings
$20.9
$25.3
$9.7
$182.5
$73.8
$13.9
$72.3
Income Tax Provision (Benefit)
12.4
14.1
5.6
93.2
2.4
8.6
(1.2)
Interest Expense
13.0
13.0
13.1
15.5
22.6
11.0
36.5
Earnings Before Interest and
Income Taxes
46.3
52.4
28.5
291.2
98.8
33.5
107.6
Depreciation & Amortization
54.3
51.3
47.0
47.4
47.7
18.9
61.5
EBITDA
1
$100.6
$103.7
$75.4
$338.7
$146.5
$52.4
$169.1
Alternative Fuel Mixture Tax
Credit
-
-
-
(170.6)
-
-
-
Debt Retirement Costs
-
-
-
6.2
-
-
-
Cellu Tissue Acquisition
Related Expenses
-
-
-
-
20.3
-
20.3
Adjusted EBITDA¹
$100.6
$103.7
$75.4
$174.3
$166.8
$52.4
$189.4 |
 43
Reconciliation of GAAP to Non-GAAP:
Clearwater Paper Segment EBITDA and Segment Adjusted EBITDA
($ in millions)
1 See last page of this Appendix for definitions of Segment EBITDA and Segment
Adjusted EBITDA 2006
2007
2008
2009
2010
Q2 2011
LTM Through
6/30/11
Consumer Products
Operating Income
$25.7
$17.6
$37.3
$122.1
$63.7
$6.9
$38.8
Depreciation
15.8
16.3
15.7
16.0
17.0
12.2
33.0
Other, net
-
-
-
-
-
0.3
(0.2)
Segment EBITDA
1
$41.5
$33.9
$53.0
$138.1
$80.7
$19.4
$71.6
Cellu Tissue Acquisition
Related Expenses
-
-
-
-
6.4
-
6.4
Segment Adjusted EBITDA
1
$41.5
$33.9
$53.0
$138.1
$87.2
$19.4
$78.0
Pulp & Paperboard
Operating Income
$32.2
$45.0
$4.4
$191.9
$81.9
$34.5
$111.4
Depreciation
38.1
34.6
30.9
29.9
28.7
6.5
27.2
Segment EBITDA
1
$70.2
$79.6
$35.3
$221.8
$110.6
$41.0
$138.6
Alternative Fuel Mixture Tax
Credits
-
-
-
(170.6)
-
-
-
Segment Adjusted EBITDA
1
$70.2
$79.6
$35.3
$51.1
$110.6
$41.0
$138.6 |
 44
Definitions of Non-GAAP Measures
Clearwater Paper Definitions of Non-GAAP Measures
EBITDA
is a non-GAAP measure that Clearwater Paper management uses to evaluate the
cash generating capacity of Clearwater Paper. The most directly comparable
GAAP measure is net earnings. EBITDA, as defined by Clearwater Paper management, is net earnings adjusted for net
interest
expense,
income
taxes,
and
depreciation
and
amortization.
It
should
not
be
considered
as
an
alternative
to
net
earnings
computed
under
GAAP.
Adjusted EBITDA
is a non-GAAP measure that Clearwater Paper management defines as EBITDA
adjusted for items that we do not believe are indicative of our core
operating performance, including acquisition related expenses and alternative fuel mixture tax credits. The most directly
comparable GAAP measure is net earnings. It should not be considered as an
alternative to net earnings computed under GAAP. Segment EBITDA
is a non-GAAP measure used by Clearwater Paper management. The most directly
comparable GAAP measure is segment operating
income.
Segment
EBITDA,
as
defined
by
Clearwater
Paper
management,
is
segment
operating
income
adjusted
for
segment
depreciation
and
amortization.
It
should
not
be
considered
as
an
alternative
to
segment
operating
income
computed
under
GAAP.
Segment
Adjusted
EBITDA
is
a
non-GAAP
measure
that
Clearwater
Paper
management
defines
as
Segment
EBITDA
adjusted
for
nonrecurring
expenses or income, including alternative fuel mixture tax credits. The most
directly comparable GAAP measure is segment operating income. It
should not be considered as an alternative to segment operating income computed
under GAAP. Free Cash Flow
is a non-GAAP measure that Clearwater Paper management uses to evaluate the
financial performance of Clearwater Paper. The most
directly
comparable
GAAP
measure
is
net
cash
from
operating
activities.
Free
Cash
Flow,
as
defined
by
Clearwater
Paper
management,
is
net cash from operating cash flows adjusted for capital expenditures, non-cash
interest expense and non-cash tax expense. It should not be considered
as an alternative to net cash from operating activities computed under GAAP. |
 45
Appendix:
Estimated Pulp Flow and
Synergy Example |
 46
Pulp Flows
1
Note:
Assumes 60,000 tons in external pulp sales
32%
68%
Pulp Sources
Internal
External
1
460,000 MT
87%
13%
By Division
Consumer
Products
30%
70%
Recycled/Virgin
40%
60%
Virgin
Idaho Pulp + Paperboard
NBSK
NBHK
Hardwood
BEK
NBHK
SBHK
Recycled
SOP, DIP,
Other
Softwood
NBSK
SBSK |
 Synergy Opportunity Example
large
converting
winder
in
Neenah,
WI
(formerly
Cellu
Tissue)
can
more
efficiently produce Away-from-Home products and 1000 count bathroom
tissue Actions:
1.
Relocate a wrapper machine from Elwood, IL (formerly CLW) to Neenah, WI
2.
Reposition an underutilized case packer in Neenah, WI
3.
Redirect the existing 1000 count product from Lewiston, ID (formerly CLW) and
Thomaston, GA (formerly CLU) to Neenah, WI
4.
Increase the production schedule of the existing underutilized large converting
winder in Neenah, WI from 5 to 7 days
Expected Results:
1.
Creates
new
case
capacity
in
the
systems
at
Neenah,
Lewiston
and
Thomaston
2.
Reduces freight
3.
Improves paper machine trim
47
Underutilized |
 48
Appendix:
Other Information |
 30%
17%
16%
7%
6%
5%
4%
2%
2%
2%
1%
1%
1%
1%
1%
1%
0%
0%
0%
4%
0.0%
5.0%
10.0%
15.0%
20.0%
25.0%
30.0%
35.0%
49
2010 North American Tissue Market by Producer
Remaining Manufacturing Base Highly Fragmented
Large Brand Manufacturers
Source: Equity research.
1 Represents Clearwater Paper tissue parent roll capacity combined on a
pro forma basis with Cellu Tissue tissue parent roll production. 1
The Combined Company was the Sixth-Largest Manufacturer in
the
North American Tissue Market in 2010 |
 1 Clearwater Paper capacities exclude tissue facility under construction in
Shelby, NC expected to have 70,000 tons of annual capacity and converting
facility expected to be operational in FY 2012. 2 Excludes foam
capacity. 3 MG stands for machine-glazed paper.
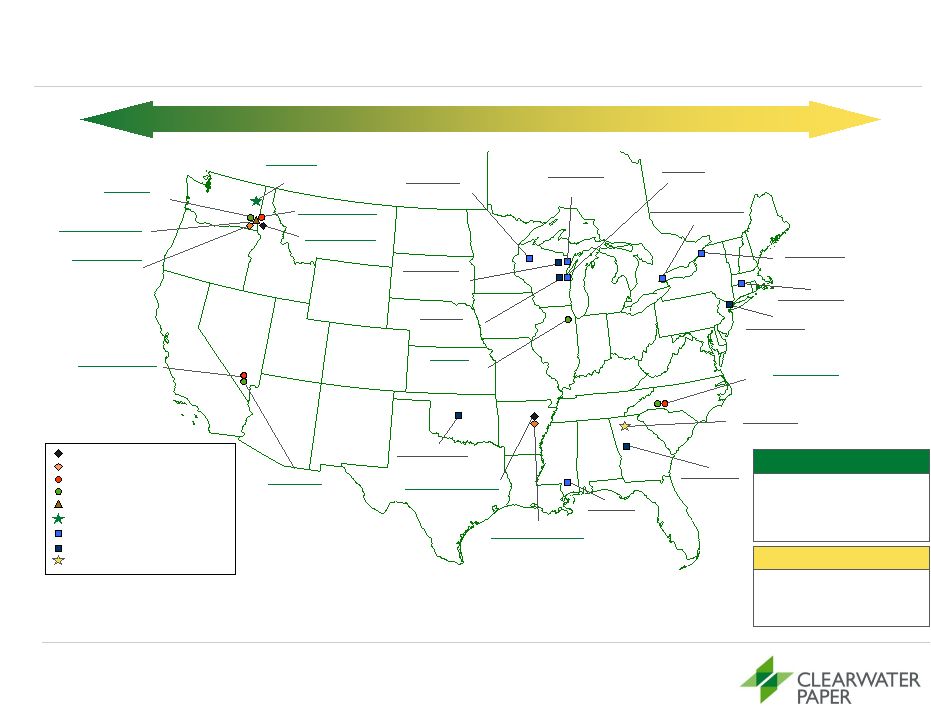
50
National Manufacturing Footprint
Clearwater Paper
Cellu Tissue
Complementary Geographic Asset Bases
Bleached Paperboard
765,000 tons
Tissue Parent Roll
227,000 tons
Tissue Converting
221,000 tons
Pulp
845,000 tons
Sawmill
215,000 mbf
Clearwater Paper Capacities¹
Clearwater Paper Pulp
Clearwater Paper Sawmill
Clearwater Paper SBS
Cellu Tissue Tissue/MG Parent Roll3
Clearwater Paper Tissue Converting
Clearwater Paper Tissue Parent Roll
Cellu Tissue Headquarters
Cellu Tissue Tissue/MG Converting3
Clearwater Paper Headquarters
Spokane, WA
Corporate Headquarters
Lewiston, ID
Converting Capacity:
102,000 tons
Lewiston, ID (Sawmill)
Capacity: 215,000 mbf
Lewiston, ID (Pulp)
Capacity: 540,000 tons
Lewiston, ID (SBS)
Capacity:
435,000 tons
Lewiston, ID (Tissue)
Capacity: 189,000 tons
Las Vegas, NV (TAD)
Capacity: 38,000 tons
Las Vegas, NV
Converting Capacity:
51,000 tons
Cypress Bend, AR (Pulp)
Capacity: 305,000 tons
Cypress Bend, AR (SBS)
Capacity: 330,000 tons
Elwood, IL
Converting Capacity:
68,000 tons
Wiggins, MS
Capacity: 57,000 tons
Neenah, WI
Capacity: 85,000 tons
Ladysmith, WI
Capacity: 55,000 tons
Oklahoma City, OK
Converting Capacity:
19,000 tons
East Hartford, CT
Capacity: 29,000 tons
Gouverneur, NY
Capacity: 33,000 tons
Alpharetta, GA
Corporate Headquarters
Thomaston, GA
Converting Capacity:
58,000 tons
Long Island, NY
Converting Capacity:
38,000 tons
Shelby, NC (TAD)
Announced Capacity: 70,000 tons
Neenah, WI
Converting
Capacity:
99,000 tons
Menominee, MI
Capacity: 32,000 tons
St. Catharines, ON (TAD)
Capacity: 46,000 tons
Cellu Tissue Capacities ²
Tissue Parent Roll
250,000 tons
Tissue Converting
214,000 tons
MG Parent Roll
4
87,000 tons
MG Converting
4
27,000 tons
Menominee, MI
Converting
Capacity:
27,000 tons |
 North American Tissue Capacity Change
51
Company
Date
Capacity
Furnish
Notes
Announced:
First Quality –
Anderson SC
Q3 2011
70,000
V
TAD
GP -
Crossett
Q2 2012
25,000*
V
TAD
First Quality –
Anderson SC
Q3 2012
70,000
V
TAD
CLW –
Shelby NC
Q4 2012
70,000
V
TAD
GP -
Pt. Hudson
Q4 2012
35,000*
V
TAD
Wausau
Q1 2013
75,000
R
AFH
P&G –
Box Elder, UT
Q3 2013
80,000
V
TAD
425,000
Potentials:
Kruger
70,000*
V
TAD
South Carolina Tissue
33,000*
V or R
South Georgia Tissue
33,000*
V or R
ST Paper –
Franklin, VA
70,000*
R
Empire
70,000*
R
* Estimated
Source: RISI and Other Industry |