Attached files
Table of Contents
UNITED STATES
SECURITIES AND EXCHANGE COMMISSION
Washington, D.C. 20549
FORM 10-K
(Mark One)
| x | ANNUAL REPORT PURSUANT TO SECTION 13 OR 15(d) OF THE SECURITIES EXCHANGE ACT OF 1934 FOR THE FISCAL YEAR ENDED MAY 31, 2011 |
or
| ¨ | TRANSITION REPORT PURSUANT TO SECTION 13 OR 15(d) OF THE SECURITIES EXCHANGE ACT OF 1934 |
For the Transition Period from to .
Commission file number: 001-34372
SABA SOFTWARE, INC.
(Exact Name of Registrant as Specified in its Charter)
| Delaware | 94-3267638 | |
| (State or Other Jurisdiction of Incorporation or Organization) |
(I.R.S. Employer Identification Number) | |
| 2400 Bridge Parkway Redwood Shores, California |
94065-1166 | |
| (Address of Principal Executive Offices) | (Zip Code) | |
(650) 581-2500
(Registrant’s Telephone Number, including area code)
Securities Registered Pursuant to Section 12(b) of the Act:
| (Title of Each Class) |
(Name of Each Exchange on Which Registered) | |
| Common Stock, par value $0.001 per share | The Nasdaq Stock Market LLC (Nasdaq Global Select Market) | |
| Preferred Stock Purchase Rights | The Nasdaq Stock Market LLC (Nasdaq Global Select Market) |
Securities Registered Pursuant to Section 12(g) of the Act:
None
Indicate by check mark if the registrant is a well-known seasoned issuer, as defined in Rule 405 of the Securities Act. Yes ¨ No x
Indicate by check mark if the registrant is not required to file reports pursuant to Section 13 or Section 15(d) of the Act. Yes ¨ No x
Indicate by check mark whether the registrant (1) has filed all reports required to be filed by Section 13 or Section 15(d) of the Securities Exchange Act of 1934 during the preceding 12 months (or for such shorter period that the registrant was required to file such reports), and (2) has been subject to such filing requirements for the past 90 days. Yes x No ¨
Indicate by check mark whether the registrant has submitted electronically and posted on its corporate Web site, if any, every Interactive Data File required to be submitted and posted pursuant to Rule 405 of Regulation S-T during the preceding 12 months (or for such shorter period that the registrant was required to submit and post such files). Yes ¨ No ¨
Indicate by check mark if disclosure of delinquent filers pursuant to Item 405 of Regulation S-K is not contained herein, and will not be contained, to the best of registrant’s knowledge, in definitive proxy or information statements incorporated by reference in Part III of this Form 10-K or any amendment to this Form 10-K. x
Indicate by check mark whether the registrant is a large accelerated filer, an accelerated filer, a non-accelerated filer, or a smaller reporting company. See the definitions of “large accelerated filer,” “accelerated filer” and “smaller reporting company” in Rule 12b-2 of the Exchange Act. (Check one):
| Large accelerated filer ¨ | Accelerated filer x | Non-Accelerated filer ¨ | Smaller reporting company ¨ |
Indicate by check mark whether the registrant is a shell company (as defined in Rule 12b-2 of the Exchange Act). Yes ¨ No x
The aggregate market value of voting and non-voting common equity held by non-affiliates of the registrant as of November 30, 2010, the last business day of the registrant’s most recently completed second fiscal quarter, was approximately $154,116,085 (based on a closing sale price of $6.03 per share as reported for the Nasdaq Global Market). Shares of common stock beneficially held by each executive officer and director and by each person who beneficially owns 5% or more of the outstanding common stock have been excluded since such persons may be deemed affiliates. This determination of affiliate status is not necessarily a conclusive determination for other purposes.
The number of shares of the registrant’s common stock, $0.001 par value per share, outstanding as of July 31, 2011 was 29,341,458.
Documents Incorporated by Reference
Portions of the registrant’s definitive Proxy Statement for the 2011 Annual Meeting of Stockholders are incorporated by reference in Part III of this Form 10-K to the extent stated herein. Except as expressly incorporated by reference, the registrant’s Proxy Statement shall not be deemed to be a part of this Form 10-K.
Table of Contents
SABA SOFTWARE, INC.
FISCAL YEAR 2011
FORM 10-K
ANNUAL REPORT
| Page | ||||||
| 1 | ||||||
| Item 1 |
2 | |||||
| Item 1A |
14 | |||||
| Item 1B |
29 | |||||
| Item 2 |
29 | |||||
| Item 3 |
29 | |||||
| Item 4 |
32 | |||||
| Item 5 |
33 | |||||
| Item 6 |
36 | |||||
| Item 7 |
Management’s Discussion and Analysis of Financial Condition and Results of Operations |
37 | ||||
| Item 7A |
57 | |||||
| Item 8 |
58 | |||||
| Item 9 |
Changes in and Disagreements with Accountants on Accounting and Financial Disclosure |
94 | ||||
| Item 9A |
94 | |||||
| Item 9B |
95 | |||||
| Item 10 |
96 | |||||
| Item 11 |
96 | |||||
| Item 12 |
Security Ownership of Certain Beneficial Owners and Management and Related Stockholder Matters |
96 | ||||
| Item 13 |
Certain Relationships and Related Transactions, and Director Independence |
96 | ||||
| Item 14 |
97 | |||||
| Item 15 |
98 | |||||
| 99 | ||||||
| 101 | ||||||
Table of Contents
CAUTIONARY NOTE ON FORWARD-LOOKING STATEMENTS
For purposes of this Annual Report on Form 10-K, the terms “Saba”, “the Company”, “we”, “us” and “our” refer to Saba Software, Inc. and its consolidated subsidiaries (unless the context indicates otherwise). This Annual Report on Form 10-K and certain information incorporated herein by reference contain “forward-looking statements” within the “safe harbor” provisions of the Private Securities Litigation Reform Act of 1995. All statements contained in this Annual Report on Form 10-K other than statements of historical fact are “forward-looking statements” for purposes of these provisions, including any statements of plans and objectives for future operations and any statement of assumptions underlying any of the foregoing. Statements that include the use of terminology such as “may,” “will,” “expects,” “believes,” “plans,” “estimates,” “potential,” or “continue,” or the negative thereof or other comparable terminology are forward-looking statements. Forward-looking statements include, without limitation:
(i) in Item 1: “Business”, statements regarding our belief that we are uniquely positioned to provide a solution that supports and enables the people networks; our belief that there are four distinct people technology markets that are converging to help organizations seize the opportunities in the networked economy ; competition; our belief that we offer the most comprehensive and flexible people systems platform; our belief regarding the principal competitive features affecting our market; our belief that we are the leader in our market space; registration of trademarks; and our belief and intention regarding litigation to which we are subject;
(ii) in Item 1A: “Risk Factors”, statements regarding the possibility of future losses; our expectation that we will continue to incur non-cash expenses relating to the amortization of purchased intangible assets; our belief that quarter-to-quarter comparisons of our revenues and operating results are not necessarily meaningful and should not be relied upon as indicators of future performance; maintaining and strengthening relationships with strategic partners; our anticipation that revenues from the Saba People Suite, as well as related services will constitute substantially all of our revenue for the foreseeable future; the likelihood significant fluctuations in our operating results; our plan to expand sales coverage and marketing support; our plan to continue to expand and ramp our direct sales force; our intention to continue to expand our international presence; the expectation that the intensity of competition and the pace of change will increase in the future which is likely to result in price reductions, reduced gross margins and loss of market share; our belief and intention regarding litigation to which we are subject; periodically acquiring complementary businesses or technologies; regularly releasing new products and new versions of existing products; and issuance of a reexamination certificate canceling certain patent claims;
(iii) in Item 2: “Properties”, statements regarding the adequacy of our existing facilities to meet anticipated needs for the foreseeable future;
(iv) in Item 3: “Legal Proceedings”, statements regarding the financial impact of any proposed settlements; our intention to dispute claims against us; and the merits of claims against us;
(v) in Item 5: “Market for Registrant’s Common Equity, Related Stockholder Matters and Issuer Purchases of Equity Securities”, statements regarding our intention to retain our future earnings; and share repurchases pursuant to our share repurchase program, as well as our intention to finance any such share repurchases with funds from operations;
(vi) in Item 7: “Management’s Discussion and Analysis of Financial Condition and Results of Operations:, statements regarding our belief that subscription revenue will grow steadily for the foreseeable future; our anticipation that a majority of our customers will renew their annual contracts; our anticipation that we will continue to add new subscription customers; our belief that new customers will primarily purchase our products on a software as a service basis; our estimate of future forfeiture rates in stock-based compensation and our anticipation to not pay dividends in the foreseeable future; the adequacy of tax provisions related to the examination of certain of our tax returns, the table summarizing our contractual obligations as of May 31, 2011; the sufficiency of our available cash resources and cash flows generated from our operating activities to meet our presently anticipated working capital, capital expense and business expansion requirements for at least the next twelve months; our anticipation that revenue growth in fiscal year 2012 will continue to be
1
Table of Contents
unfavorably impacted by a reduction in license revenue; our anticipation that in fiscal year 2012 we will continue to experience a shift in our business to delivery of our products in the cloud from traditional perpetual licenses; our anticipation that gross margins will decline in fiscal year 2012 and that operating expense growth for fiscal year 2012 will be greater than fiscal year 2011; our expectation that sales and marketing expenses will continue to increase in fiscal year 2012; our anticipation that net losses will be higher in the early part of fiscal year 2012 as we accelerate toward a subscription-based model, and that as subscription revenues grow we expect a substantial reduction in net losses during the second half of fiscal year 2012.
(vii) in Item 7A: “Quantitative and Qualitative Disclosures About Market Risk”, statements regarding our exposure to interest rate risk and foreign currency risk; and the effects of future changes in interest rates and foreign currency rates;
(viii) in Item 8: “Financial Statements and Supplementary Data”, statements regarding our management’s belief that financial risks associated with cash, cash equivalents and accounts receivable are minimal; the financial impact of a proposed settlement; the merits of our litigation; statements regarding total expected future amortization related to intangible assets; our estimate of future forfeiture rates in our stock-based compensation plans; the anticipated adjustments to total unrecognized stock-based compensation, and the adequacy of tax provisions related to the examination of certain of our tax returns.
These forward-looking statements involve known and unknown risks and uncertainties. Our actual results may differ materially from those projected or assumed in such forward-looking statements. Among the factors that could cause actual results to differ materially are incorrect estimates or assumptions, unanticipated adverse results for pending litigation, contraction of the economy and world markets, lack of demand for information technologies from our customers, unanticipated need for capital for operations, lack of demand for our products, inability to introduce new products, unanticipated difficulties relating to the Saba products, unanticipated decrease in demand for our products and services, unanticipated changes in domestic and foreign tax regulations and the factors detailed under the heading “Risk Factors” in Item 1A of this Annual Report on Form 10-K. All forward-looking statements and risk factors included in this document are made as of the date hereof, based on information available to us as of the date hereof, and we assume no obligation to update any forward-looking statement or risk factor.
Overview
Saba is the premier provider of a new class of learning and talent management solutions providing a unified set of People Cloud Applications that include: enterprise learning, talent management, testing and assessment and collaboration solutions delivered through the Saba People Cloud. Today’s people-driven enterprises are using our solutions to mobilize and engage people around new strategies and initiatives, align and connect people to accelerate the flow of business, and cultivate, capture, and share individual and collective knowhow to effectively compete and succeed. We enable organizations to build a transformative workplace where they can leverage their people networks to become more competitive through innovation, speed, agility, and trust.
The Saba People Cloud consists of a full suite of integrated People Cloud Applications, an open, flexible, service-oriented architecture, a world-class multi-tenant people cloud infrastructure, and a vast people cloud community of human capital experts, partners, practitioners and thought leaders. The Saba People Cloud enables organizations to transform the way they develop, engage and inspire their people network of employees, partners and customers, to achieve sustainable competitive advantage and high impact performance. The Saba People Cloud does this by specifically providing solutions that help clients to:
MOBILIZE THEIR PEOPLE NETWORK—to seize new opportunities through complete talent visibility, mobility and connection. The Saba People Cloud provides organizations with visibility into all of the skills, experience, competencies and connections of the people in their people network, the ability to quickly align them to new business initiatives and inspire them to greatness.
2
Table of Contents
CULTIVATE A DEVELOPMENT CULTURE—inside and outside their organization to arm their people network with the knowledge they need, when they need it to excel at their jobs, advance in their careers and drive higher performance.
ACCELERATE INNOVATION AND CREATIVITY—by tapping into social and mobile capabilities to find and connect people and ideas throughout people networks to drive new ideas and faster time to market.
LEVERAGE A UNIFIED, FLEXIBLE, MULTI-TENANT CLOUD—architecture and infrastructure that reduces costs, shortens time to benefit and provides the flexibility to scale globally and adapt locally to fit any organization’s unique operational and financial needs.
We were incorporated in Delaware in April 1997. We are a global company headquartered in Redwood Shores, California.
On the Investor Relations page of our web site http://investors.saba.com, we post the following filings as soon as reasonably practicable after they are electronically filed with or furnished to the Securities and Exchange Commission: our Annual Report on Form 10-K; our Quarterly Reports on Form 10-Q; our Current Reports on Form 8-K and any amendments to those reports filed or furnished pursuant to Section 13(a) or 15(d) of the Securities Exchange Act of 1934, as amended (the “Exchange Act”). The filings on our Investor Relations web page are available to be viewed free of charge. Information contained on our web site is not part of this Annual Report on Form 10-K or our other filings with the Securities and Exchange Commission. We assume no obligation to update or revise any forward-looking statements in this Annual Report on Form 10-K, whether as a result of new information, future events or otherwise, unless we are required to do so by law. A copy of this Annual Report on Form 10-K is available without charge upon written request to: Investor Relations, Saba Software, Inc., 2400 Bridge Parkway, Redwood Shores, California 94065.
Evolution of Our Market
Most of today’s human capital management systems were built to support knowledge age learning and talent management processes and strategies, top down management, and a culture focused on operational efficiency and automation rather than the collaboration, innovation and creativity of the networked economy. Sequential steps that were consistent and repeatable, such as formal training and rigid performance reviews were the keys to successful execution. Many systems were built to support these processes on highly rigid, linear, transactional frameworks, making them poorly suited for dynamic people-focused strategies and a “networked” work style. Even newer software as a service (“SaaS”) based talent management systems are typically assembled through multiple acquisitions to support individual processes such as recruiting, performance management or learning, and because they are not organically built and unified they cannot provide the type of complete talent visibility and process unification required of today’s human capital management systems.
While business fundamentals have not changed, the environment in which organizations operate has changed dramatically and will continue to change at an accelerating pace. Business success now depends less on talented and knowledgeable individuals than on the power of the collective intelligence and influence of their personal and professional people networks. Much of this change is driven by technology such as the internet, mobile computing and the emergence of social networking technologies for business and commercial use. This continuous and dynamic change will continue to be highly disruptive to organizations that have not built a transformative workplace that is much more networked and agile. Organizations that have built this type of transformative workplace will be able to compete more effectively in the new networked economy, characterized by:
| • | Globalization—new opportunities and challenges are arising from developing countries in a world that is more interconnected—where employees, suppliers, customers or partners cross borders. |
| • | Hyper-Competition—the ubiquity of the internet means every competitor has global reach and can be a fast follower or has the ideas and means to invent new business models. |
3
Table of Contents
| • | More Demanding Consumers—are now the rule in the networked economy. Consumers can use the internet to learn anything and everything about a company, a product or a service and they can instantly compare products in the store on their smart phone or read public consumer ratings and reviews or get advice instantly from their personal network. |
| • | Closer Government Oversight—in a highly networked and global environment, disasters and mistake are no longer limited to local areas. In many cases, environmental issues like oil spills or the latest financial crisis have global implications. This has driven tighter government oversight and regulation in most industries. |
| • | Shorter Product Lifecycles—the networked economy means that new ideas for products and services are “crowd sourced” every minute of every day and produced and adopted at blinding speed. |
While these trends are changing organizations from the outside, the workforce is simultaneously evolving to change organizations from the inside. Organizations are adopting a modern and networked way of working, where the norms are transparency, concurrent projects with real-time updates, and continuously connected people, including customers, contractors and partners, who can operate successfully in a fluid and fast changing environment.
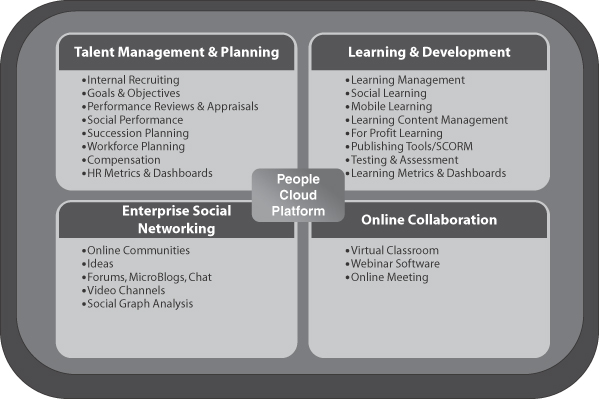
The Saba People Cloud
Leveraging a rich history of innovation, domain expertise and experience serving clients of all sizes, in all industries around the world, the Saba People Cloud is a unique combination of industry leading learning and development capabilities, unified talent management and embedded enterprise social networking and online collaboration capabilities
The Saba People Cloud consists of Saba People Cloud Applications and Saba People Cloud Platform.
Key components of Saba People Cloud Applications are illustrated in the following chart:
4
Table of Contents
Saba People Cloud Applications
Saba People Cloud Applications are all unified on a single platform architecture with a shared people profile.
The Saba People Cloud Applications capabilities for Learning and Development include:
| • | Learning Management—Enables organizations to deliver and manage critical knowledge and skills to improve productivity and achieve business results; supports certifications with multiple learning pathways; provides flexible audit trails; and supports e-signatures to meet a wide variety of stringent regulatory requirements, |
| • | Social Learning—Empowers a unique combination of formal course instruction with automatic social networking between learners and the ability for them to share ideas and content before, during and long after the formal class is complete, |
| • | Mobile Learning—Provides a mobile platform that lets people take their learning on the go by downloading, viewing, and interacting with standards-based courseware and knowledge content anywhere, anytime, regardless of network connectivity, |
| • | Learning Content Management—Helps organizations capture, consolidate, organize, manage, share and reuse all types of learning content through a learning object repository and automated content and project-management processes, |
| • | For Profit Learning—Provides support for optimized pricing, discounting schemes, marketing campaigns, branded certification programs, bundled training units and a variety of convenient payment methods for education businesses, |
| • | Publishing Tools—Allows users to create new courses, or repurpose courses, and publish them in HTML or standard learning formats, such as AICC or SCORM, quickly and efficiently, |
| • | Testing & Assessment—Provides an extensive array of content and capabilities to test and assess the skills, competencies, and abilities of people in the people network and provide more tailored and effective training to fill identified gaps, |
| • | Learning Metrics and Dashboards—Provides key metrics and insights into the efficiency and effectiveness of the organization’s learning programs and processes. |
The Saba People Cloud Applications capabilities for Talent Management and Planning include:
| • | Performance Reviews and Appraisals—Establishes a strategic, relevant performance review process that allows multiple raters to provide feedback on individualized goals and competencies to measure individual and team performance and identify areas for learning and development. |
| • | Goals & Objectives—Provides real-time ability to align goals and objectives at all levels of the organization, measure progress on critical organizational initiatives and make adjustments to changing market conditions. |
| • | Internal Recruiting—Enables critical insights into the skills, competencies, and experience inside your people network by leveraging the unified people profile to help identify critical talent for new initiatives. |
| • | Social Performance—Changes the way organizations look at delivering employee performance feedback from a stale, once a year compliance exercise to a vital opportunity for ongoing employee engagement, development and coaching. |
| • | Succession Planning—Identifies high performing and high potential individuals, evaluates their readiness gaps and helps organizations build bench strength for key leadership positions and pivotal roles. |
| • | Workforce Planning—Provides organizations with the strategic visibility to proactively match people plans to business plans to define their future workforce, increase overall agility and reduce risk. |
5
Table of Contents
| • | Compensation—Empowers managers with measures of employee success from both formal and informal talent processes, and the ability to reward and inspire high performing teams and individuals. |
| • | HR Metrics & Dashboards—Provide critical talent insights and metrics to measure the effectiveness of people process. |
The Saba People Applications capabilities for Enterprise Social Networking and Online Collaboration include:
| • | Enterprise Social Networking—provides a secure, enterprise class social networking platform to connect the organization’s entire people network of employees, partners and customers to drive innovation and speed. |
| • | Online Communities—Enable people to connect with other people to share ideas, learn, provide mentoring, and develop their business network. |
| • | Ideas—Fosters crowd sourcing of new ideas and innovation. |
| • | Groups, Forums, MicroBlogs, Chat—Provides tools that connect people and enables efficient sharing and communication. |
| • | Video Channels—Makes everyone a content creator with easy ways to organize and share both formal and informal video content on important topics. |
| • | Social Graph Analysis—Gives insight into the “wirearchy” of the organization by showing who is connected to who throughout the people network. |
| • | Online Collaboration |
| • | Virtual Classroom—Enables live, interactive education sessions across many locations. |
| • | Webinar Software—Equips the organization with an efficient and cost-effective way to reach and engage large audiences quickly. |
| • | Online Meeting—Helps eliminate the difficulties of complex meeting coordination and the time and expense of business travel. |
Saba People Cloud Platform
Underlying all Saba People Cloud Applications is one of the most modern and unified cloud architectures in the industry. Key highlights of the Saba People Cloud Platform are:
| • | People Profile—A common People Profile is shared and dynamically updated across all People Cloud Applications, providing vital insights into individual talent, development and performance. The more People Cloud Applications that are “turned on” and used, the deeper and more valuable the People Profiles become as information is added on performance reviews, training, goals and attainment, social feedback, people connections, content, subject matter expertise, social connections and so on. |
| • | User Experience—People Cloud Applications present a uniform user experience, characterized by minimal need for training and a highly individualized user interface that, while designed for enterprise use, leverages the latest user interface innovations from consumer applications. With built in user adoption metrics, customers can easily see which configurations and processes are being used and how which enables continuous optimization for maximum user adoption. |
| • | Search—All people cloud applications are unified and share a common people profile, so all people information, content and resources in the Saba People Cloud can be instantly searched and sorted by type. |
| • | Embedded Social & Mobile Capabilities—through a combination of the Saba People Cloud Platform and our organically built enterprise social networking and online collaboration capabilities, all Saba learning and development and talent management and planning applications are infused with social, mobile and online collaboration capabilities. |
6
Table of Contents
| • | Analytics—People Cloud Applications share robust reporting and analytic capabilities to measure progress and predict outcomes across key people processes, as well as to measure application usage. |
| • | Localizations—30 pre-packaged localizations with process configurations and language capabilities are available in the Saba People Cloud to ensure that Saba’s global customers can operate in their local markets. |
| • | Domain Architecture—The unique domain architecture of the Saba People Cloud is the key to our ability to manage any level of complexity and provide capabilities for our clients to manage their people network effectively by brand, location, business unit, division or any combination. |
| • | Configuration Wizards—provide implementation speed and post go-live flexibility for customers to configure the Saba People Cloud to meet their needs without costly customizations. |
| • | Adoption Metrics—leverage the power of the cloud to provide a detailed level of reporting on who is using the Saba People Cloud and how, so customers can make processes more effective and drive higher levels of customer adoption and value. |
Customers
Our customers include a wide spectrum of large, global enterprises and mid-size organizations for both private and public organizations. For each of the years ended May 31, 2011, 2010 and 2009, no single customer accounted for more than 10 percent of our total revenues. Based on total revenues, our customers are also leaders in their industries and their regions and represent many of the largest companies in the world.
Sales and Marketing
We sell our products to organizations through a worldwide direct sales force, combined with a global network of alliance and channel partners. Our direct sales efforts target large enterprises, including Global 2000 businesses, mid-size organizations, and government entities. Our channel sales efforts involve value-added resellers around the globe, as well as systems-integrator relationships. As of May 31, 2011, we had 166 sales and marketing employees in the United States, Australia, Canada, France, Germany, India, Japan, and UK. We incurred $43.7 million, $33.5 million and $26.6 million in sales and marketing expenses for the years ended May 31, 2011, 2010 and 2009, respectively.
We focus our marketing efforts on extending our market leadership, establishing market positioning, generating sales leads, supporting sales efforts, creating awareness of our solutions in the market and establishing strong brand awareness. Our marketing activities also include lead generation and field marketing, public relations, analyst relations, industry trade shows, online marketing, seminar programs, and customer and partner marketing, as well as strategic relationships with third party content and community providers.
Partners
In addition to our strong customer community, Saba has a global network of over 108 partners in 43 countries. Our partners cover a wide range of services and content that spans strategic talent management consulting, HRO, technology point solutions, implementation services, value added resellers and content providers. Saba’s partnering strategy is to extend value to its customer base and the market by teaming up with the best-in-class global alliances and channel partners keenly focused on delivering superior results and customer satisfaction.
We have strategic alliance agreements with key global and regional value-added software resellers representing our solutions around the world, including IBM, HP, WIPRO, Aon Hewitt and CAE. We also partner with global and regional consulting firms who act as advisors, systems integrators, and implementation partners for our solutions. These alliances and the associated training of qualified personnel in these organizations greatly increase the number of sales representatives and consulting professionals trained to implement our solutions.
7
Table of Contents
We also have relationships with packaged content providers, custom content developers, and content authoring and learning delivery tool providers in order to increase the range of content offerings available to our customers. The Saba Content Alliance Program helps our content partners create and deliver learning content for use in conjunction with Saba solutions through the support of industry standards applicable to a broad variety of media formats, including Web-based training, computer-based training, video and asynchronous and synchronous delivery, as well as through the support of traditional forms of learning such as instructor-led classes, seminars, and workshops. In support of this program, we also operate a content developers’ resource center and testing lab that provides our content partners with direct access to our systems for standards compliance testing.
Saba Experts
We offer a comprehensive set of services delivered by experienced experts to assist in the successful implementation and optimization of our products. Saba has a highly trained and experienced services staff to support our customers around the world, with over 50% of our consultants based outside of North America. Our global services organization supports multiple offerings, including the following services:
Implementation and Consulting Services
Saba’s Unified People Management Deployment Framework covers the entire customer lifecycle from initial business case assessment through ongoing application success measurement and provides a flexible, yet repeatable model for supporting successful design, deployment and support of Saba solutions. Our implementation and consulting services include the following specific services:
| • | Strategic Services. Saba Strategic Services are designed to enable organizations to effectively link people-driven strategies to business strategies. Offerings include developing new people-driven strategies, change management and governance, developing and deploying competency models, measurement and evaluation strategies, as well as content integration and deployment. |
| • | Consulting Services. Our consulting services include definition of business objectives, design of phased plans for achieving these objectives, technical solution specifications, establishment of implementation timelines and resource requirements, installation of Saba solutions, systems configuration, data loading, custom report and notification design, website development, enterprise system integration and post-implementation assessment. |
| • | Implementation Services—Our implementation services include modular ‘QuickStart’ packages, configured integration frameworks, upgrade assistance and footprint expansion. |
| • | Application Management Services—Our application management services include system administration, functional help desk offerings, system optimization, and health checks and success criteria measurement. |
| • | Education Services. We provide a broad range of education services in a variety of formats, including instructor-led training and web and technology-based training. Course curricula, designed to enable customers to fully exploit the value of Saba solutions, include product training, project team training and technology training. |
Customer Support
Our support services are designed to ensure that our customers have the latest available technology and access to the assistance necessary for their on-going success with our products. Our commitment to customer care extends far beyond basic issue resolution. We offer a full range of customer support options including dedicated account managers, 24x7 phone support, online support and access to customer communities for knowledge and best practice sharing.
8
Table of Contents
Through our online support portal, customers have access to documentation and a detailed knowledgebase to get to answers quickly and easily. As part of their relationship with us, customers also have access to an extensive array of resources that include our account management team, customer communities, and more. For our larger global customers, we also offer premium support offerings featuring tailored, flexible support solutions built to meet the customers’ specific business requirements. These services range from extending support access hours, upgrading SLAs, and dedicating resources that operate as a customer’s Saba team to proactively ensure success and business continuity.
Technology
Product Architecture
Our proven cloud based architecture coupled with our AGILE development processes facilitates the rapid development, deployment and configuration of large scale solutions for people management. Our platform uses the latest industry standards and technologies including J2EE, J2ME, HTML 5, Java Script, web services, virtualization, and learning industry standards to deliver innovative, configurable features for our customers.
Key features of the Saba People Cloud Platform are described below:
| • | Open and Standards Based. The core Saba People Cloud Platform is based on the J2EE standard and uses third-party, industry-leading and standards-based platforms wherever possible. This helps accelerate application development by leveraging the transaction management, persistence management and resource pooling capabilities of standard J2EE application servers so that application developers can focus on building business logic and user interfaces. |
| • | Security. The Saba People Cloud Platform offers a highly secure environment through which organizations manage their people management processes. A granular security model supports the highly complex business structures and processes used by our customers and can be easily configured to meet their needs. Our security implementation has been subject to rigorous validation by a number of customers and third parties. In conjunction with our partners we maintain SAS-70 certification for our cloud infrastructure. |
| • | Scalability. We offer highly scalable solutions able to meet the needs of millions of end users. Scalability is accomplished through a variety of techniques including clustering, distributed caching, virtualization, session failover management and off-line processing for asynchronous processes. We maintain a dedicated performance lab which works with our internal development teams and with our customers to ensure that our solutions meet the complex and varying usage demands that are placed on them. |
| • | Configurability and Extensibility. The Saba People Cloud Platform offers a highly configurable application environment. Business processes, system features and user experiences can be easily configured to meet the needs of our diverse customer base. Where more complex requirements exist, the Saba People Cloud provides a complete set of development tools and Application Programming Interface (“API”) which can be used to extend system functionality. |
| • | Integration Ready. Our solutions are deployed in complex IT ecosystems where integrations with other systems are commonly required. We provide for such integrations by delivering open and standards based solutions, based on common technologies such as J2EE, SAML, XML, SOAP and JAAS. In addition, we provide a series of documented Web Services and APIs to facilitate tight data and application integration. |
| • | Compelling User Experiences. Saba People Cloud Applications provides a variety of user experiences through web browsers; mobile devices; embedded portlets; online and offline clients and through integrations with other business applications such as Microsoft Outlook, Lotus Notes and Portals. This allows users to use Saba wherever they work. We make extensive use of rich internet application technologies (such as AJAX, CSS, Javascript, HTML 5, Flash, HD Video, and high quality VOIP) to deliver more engaging and intuitive user experiences. Our user experiences are compliant with the most prevalent accessibility standards including Section 508, WCAG 2, WAI Priority 1 and UK DDA |
9
Table of Contents
| • | Learning Standards. We continue to be active participants in the main learning standards bodies including ADL, IMS, HR-XML and AICC. We also continue to ensure our solutions are compliant with the most current versions of the standards delivered by these organizations. |
| • | Multiple language support. The Saba People Cloud Platform is fully internationalized and is, therefore, independent of any particular language, script, culture, and coded character set. We currently provide a number of localized versions of our solutions and support over 26 languages. |
Research and Development
Our research and development operations are organized around software platform and applications development initiatives. These two development activities share resources and collaborate on design and development. Core teams are responsible for platform and infrastructure development, application development, user interface and application design, enterprise connectivity, internet applications and design, quality assurance, documentation and release management. As of May 31, 2011, we had 207 research and development employees in the United States and India. We incurred $18.5 million, $17.8 million, and $17.4 million in research and development expenses for the years ended May 31, 2011, 2010 and 2009, respectively.
We adhere to a well-defined and managed software development lifecycle model. This model, which makes increasing use of agile development practices, defines how we envision, plan, develop and test our products. It further defines the detailed phases of the project, the specific milestones to be achieved and the policies to be followed and documented. We continue to make extensive investments in the development tools and processes to support our development model.
We conduct our development efforts at multiple sites in the United States and India, which enables continuous development 24 hours per day.
Competition
The market for our products and services is intensely competitive, dynamic and subject to rapid change. The intensity of competition and the pace of change are expected to increase in the future. Competitors vary in size and in the scope and breadth of the products and services they offer. Although we believe that we offer the most comprehensive and flexible people systems we encounter competition with respect to different aspects of our solutions from a variety of sources including:
| • | companies that offer solutions that provide one or more applications within the market, such as learning management, performance management, talent management, compensation and recruiting, including SumTotal, Taleo, Cornerstone OnDemand and Success Factors; |
| • | companies that offer collaboration solutions, such as Microsoft, Adobe, Cisco and Citrix; |
| • | enterprise software vendors that offer human resources information systems and employee relationship management systems with training and performance modules, such as SAP and Oracle; and |
| • | potential customers’ internal development efforts. |
We expect additional competition from other established and emerging companies as the market for people systems solutions continues to evolve. Increased competition is likely to result in price reductions, reduced gross margins and loss of market share, any one of which could seriously harm our business.
We believe the principal competitive features affecting our market include:
| • | single, unified platform; |
| • | breadth and depth of the solution; |
10
Table of Contents
| • | a significant installed base of Global 2000 and government customers; |
| • | the ability to support all forms of content offerings; |
| • | the ability to meet the requirements of the world’s largest organizations, including support for global deployments; |
| • | the ability to support a broad range of extended-enterprise users, including employees, partners, customers and suppliers; |
| • | product quality and performance; |
| • | ease of use; |
| • | product features and functions; |
| • | customer service and support; and |
| • | partner ecosystem. |
Proprietary Rights
Proprietary rights are important to our success and our competitive position. To protect our proprietary rights, we rely on copyright, trademark, patent and trade secret laws, confidentiality procedures and contractual provisions.
We license our products and provide subscription services (which include license updates and product support, and cloud-based services) rather than sell our software license products and require our customers to enter into written agreements, which impose restrictions on the use, access, copying and disclosure of our software. In addition, we seek to avoid disclosure of our trade secrets through a number of means, including but not limited to, requiring those persons with access to our proprietary information to execute confidentiality agreements with us. These contractual provisions, however, may be unenforceable under the laws of some jurisdictions and foreign countries.
We seek to protect our software, documentation and other written materials under trade secret and copyright laws, which afford only limited protection. In addition, we have seven patents issued in the United States and multiple patent applications pending in the United States. We cannot be assured that any patents will be issued for any of the pending patent applications. Even for the issued patents, or any patent issued to us in the future, there can be no assurance that such patents (i) will protect our intellectual property, or (ii) will not be challenged by third parties. Furthermore, other parties may independently develop similar or competing technologies or design around any patents that may be issued to us. It is possible that any patent issued to us may not provide any competitive advantages, that we may not develop future proprietary products or technologies that are patentable, and that the patents of others may seriously limit our ability to do business. In this regard, we have not performed any comprehensive analysis of patents of others that may limit our ability to conduct our business.
We have obtained registration of various trademarks, including Saba and the Saba S-design logo, in the United States and in certain other countries. In addition, we have registration applications pending in various countries. We will continue to register additional trademarks as appropriate. There can be no assurance that we will be successful in obtaining registration of the trademarks for which we have applied. Even for any registered trademarks that we have obtained, or may obtain in the future, the trademarks may be successfully challenged by others or invalidated. If the applications are not approved because third parties own the trademarks, or if our registered trademarks are successfully challenged or invalidated, the use of the trademarks will be restricted unless we enter into arrangements with third parties that may be unavailable on commercially reasonable terms.
We cannot assure you that any of our proprietary rights with respect to our products or services will be viable or of value in the future since the validity, enforceability and type of protection of proprietary rights in Internet-related industries are uncertain and still evolving.
11
Table of Contents
Despite our efforts to protect our proprietary rights, unauthorized parties may attempt to copy aspects of our products or to obtain and use information that we regard as proprietary. Policing unauthorized use of our products is difficult, and while we are unable to determine the extent to which piracy of our software products exists, software piracy can be expected to be a persistent problem. In addition, the laws of some foreign countries do not protect proprietary rights to as great an extent as do the laws of the United States, and effective copyright, trademark and trade secret protection may not be available in those jurisdictions. Our means of protecting our proprietary rights may not be adequate to protect us from the infringement or misappropriation of such rights by others.
In recent years, there has been significant litigation in the United States involving patents and other intellectual property rights, particularly in the software and Internet-related industries.
On August 19, 2003, a complaint was filed against Centra and two other defendants by EdiSync Systems, LLC, in the United States District Court for the District of Colorado (No. 03-D-1587 (OES)) (the “Colorado District Court”). The complaint alleges infringement of two patents for a remote multiple user editing system and method and seeks permanent injunctive relief against continuing infringement, compensatory damages in an unspecified amount, and interest, costs and expenses associated with the litigation. Centra filed an answer to the complaint denying all of the allegations. Centra filed a request for reexamination of the patents at issue with the U.S. Patent and Trademark Office (the “Patent Office”). The re-examination request was accepted by the Patent Office and the Colorado District Court approved the parties’ motion to stay the court proceedings during the re-examination proceedings. A reexamination certificate has been issued for one of the patents that canceled all of the patent’s claims, thus rendering that patent of no further force or effect. The Patent Office issued a reexamination certificate for the other patent canceling all of the patent’s original claims and allowing certain newly-added claims. We have since filed a second reexamination request asking the Patent Office to reconsider the patentability of the newly-added claims in view of newly-discovered prior art and the Patent Office has granted that request. The Colorado District Court has again stayed the litigation pending the outcome of the second reexamination proceeding. On March 21, 2011, the Patent Office issued a final office action indicating that all but two of the twenty eight claims in the reexamination certificate are unpatentable and that one claim added during this reexamination proceeding is patentable. On March 25, 2011, plaintiff filed a motion to lift the stay on the court proceedings. We believe that we have meritorious defenses with respect to any future claims and intend to vigorously defend this action. However, due to the inherent uncertainties of litigation, we cannot accurately predict the ultimate outcome of the litigation. An unfavorable outcome of the litigation could materially and adversely affect our business, financial condition and results of operations.
On November 19, 2007, a complaint was filed against us and ten other defendants by Gemini IP, LLC, in the United States District Court for the Eastern District of Texas (No. 07-CV-521) (the “Texas District Court”). The complaint alleges infringement of a patent directed to a method for processing client help requests using a computer network and seeks permanent injunctive relief against continuing infringement, compensatory damages in an unspecified amount, and interest, costs and expenses associated with the litigation. We filed an answer to the complaint denying all of the allegations. At our request, the United States Patent and Trademark Office (the “Patent Office”) has instituted reexamination proceedings against the asserted patent and the Texas District Court has stayed the action pending the outcome of those proceedings. On September 14, 2010, the Patent Office issued a Reexamination Certificate cancelling all of the patent’s original claims that were asserted against us in the litigation. The Reexamination Certificate also includes several new claims that were added during the reexamination proceeding. On November 3, 2010, Gemini filed an amended complaint asserting that we have infringed the patent as amended by the Reexamination Certificate, and also adding a number of additional defendants in the suit. We believe that we have meritorious defenses with respect to the asserted patent and intend to vigorously defend this action. However, due to the inherent uncertainties of litigation, we cannot accurately predict the ultimate outcome of the litigation. An unfavorable outcome of the litigation could materially and adversely affect our business, financial condition and results of operations.
We could also become subject to additional intellectual property infringement claims as the number of our competitors grows and our products and services overlap with competitive offerings. Any of these claims, even if
12
Table of Contents
not meritorious, could be expensive to defend and could divert management’s attention from operating our company. If we become liable to third parties for infringing their intellectual property rights, we could be required to pay a substantial award of damages and to develop non-infringing technology, obtain a license or cease selling the products that contain the infringing intellectual property. We may be unable to develop non-infringing technology or obtain a license on commercially reasonable terms, if at all.
Employees
As of May 31, 2011, we had a total of 735 employees, including 207 in research and development, 166 in sales and marketing, 178 in services-related activities, 104 in operations and 80 in administration and finance. Of these employees, 378 were located in North America and 357 were located outside of North America. None of our employees is represented by a collective bargaining agreement, and we have not experienced any work stoppages. We consider our relations with our employees to be good. Our future success depends on our continuing ability to attract and retain highly qualified technical, sales and senior management personnel.
Seasonality
We experience quarterly seasonality in the demand for our products and services. For example, revenue has historically been lower in our first fiscal quarter while expenses have been higher than in the immediately preceding fourth fiscal quarter. Contributing to this seasonality is the timing of our first fiscal quarter that occurs during the summer months when general business activities slow down in a number of territories where we conduct our operations, particularly Europe. Our commission structure and other sales incentives also tend to result in fewer sales in the first fiscal quarter than in the fourth fiscal quarter. These seasonal variations in our revenue are likely to lead to fluctuations in our quarterly operating results.
Our Executive Officers
Our current executive officers are listed below:
| Name | Office(s) | |
| Bobby Yazdani | Chairman and Chief Executive Officer | |
| Shawn Farshchi | Executive Vice President and Chief Operating Officer | |
| William Slater | Chief Financial Officer | |
| Jeffrey T. Carr | President, Global Field Operations | |
| Peter E. Williams III | Executive Vice President, Corporate Development and Secretary |
Bobby Yazdani, 48, founded Saba, has been a Director of Saba since our inception in April 1997 and has served as Saba’s Chairman of the Board and Chief Executive Officer since September 2003. From February 2003 through September 2003, Mr. Yazdani served as Saba’s President and Chief Operating Officer. From April 1997 until February 2003, Mr. Yazdani served as Saba’s Chairman of the Board and from April 1997 until March 2002, Mr. Yazdani served as Chief Executive Officer. From 1988 until founding Saba, Mr. Yazdani served in various positions at Oracle, most recently as Senior Director. Mr. Yazdani holds a B.A. from the University of California, Berkeley.
Shawn Farshchi, 53, has served as our Executive Vice President and Chief Operating Officer since June 2011. From December 2006 to May 2011, Mr. Farshchi served as Chief Operating Officer at Coremetrics, an IBM company and a market leader in digital marketing and web analytics delivered through a SaaS model. From January 2003 to December 2006, Mr. Farshchi served as Vice President of Platform Engineering and Operations as well as GM of Voice Applications for WebEx Communications, Inc. Mr. Farshchi holds a MBA from Golden Gate University.
William Slater, 59, has served as our Chief Financial Officer since December 2008. From August 2000 to September 2008, Mr. Slater served as Executive Vice President and Chief Financial Officer at Symmetricom, a
13
Table of Contents
provider of precise time and frequency technology. From August 1991 to November 1999, Mr. Slater served as Executive Vice President and Chief Financial Officer at Computer Curriculum Corporation, an educational publisher and division of Viacom. Mr. Slater has also served as Vice President, Financial Planning, at Simon & Schuster and Vice President and Controller, Professional Products Group, for Revlon. Mr. Slater holds a BA from Queens College, City University of New York. Mr. Slater announced his retirement effective March 31, 2012.
Jeffrey T. Carr, 52, has served as our President, Global Field Operations since April 2009. From 2004 to 2008, Mr. Carr served as a Corporate Officer and Executive Vice President with responsibility for sales, alliances and other areas at Taleo Corporation, a provider of on-demand talent management solutions. From 2001 to 2003, Mr. Carr served as Chief Executive Officer of Motiva Inc., a leader in the enterprise incentive management and compensation software industry. From 2000 to 2001, Mr. Carr served as President and COO of RightWorks Corporation, a leading provider of eProcurement and B2B enterprise business applications. From 1991 to 2000, Mr. Carr worked at PeopleSoft, Inc., a global enterprise software company, in a number of sales, general management and executive team roles, including Division President and Executive Vice President. From 1984 to 1990, Mr. Carr worked at Integral Systems, a leading provider of Human Resource Management and Financial enterprise application software, in sales and account management positions. Mr. Carr holds a BA from Miami University (Ohio) and studied in the MBA program at Xavier University (Ohio).
Peter E. Williams III, 49, has served as our Executive Vice President, Corporate Development since July 2007 and has served as our Secretary since our inception in April 1997. Mr. Williams served as our Chief Financial Officer from March 2004 to July 2007, and our Vice President, Corporate Development and General Counsel from October 1999 through March 2004. Mr. Williams was a partner at Morrison & Forester LLP, an international law firm, from January 1995 until March 2000. Mr. Williams holds B.A. degrees from the University of California, Los Angeles and a J.D. from Santa Clara University.
Set forth below and elsewhere in this Annual Report on Form 10-K and in other documents we file with the SEC, are risks and uncertainties that could cause actual results to differ materially from the results expressed or implied by the forward-looking statements contained in this Annual Report. The fact that some of the risk factors may be the same or similar to our past filings means only that the risks are present in multiple periods. We believe that many of the risks detailed here and in our other SEC filings are part of doing business in our industry and will likely be present in all periods reported. The fact that certain risks are endemic to our industry does not lessen the significance of the risk.
We may incur future losses and cannot assure you that we will sustain profitability on a consistent basis in the future, if at all.
We incurred losses during fiscal 2011 and we cannot be certain as to when we will have sufficient revenues to regain profitability on a quarterly or annual basis, especially as we continue to shift our business away from license sales toward recurring SaaS subscription transactions. In addition, we expect to continue to incur non-cash expenses in the future relating to the amortization of purchased intangible assets and stock-based compensation, which will impact our operating results. Also, any impairment of our goodwill would result in additional non-cash charges that would further negatively impact our operating results. As of May 31, 2011, we had $8.7 million of purchased intangible assets to be amortized as a result of our May 2011 acquisitions of Pedagogue Solutions (“Pedagogue”) and Comartis Group Ltd. (“Comartis”), January 2006 acquisition of Centra Software, Inc. (“Centra”) and May 2005 acquisition of THINQ Learning Solutions, Inc. (“THINQ”) and our goodwill balance was $41.5 million. These non-cash expenses have made it and will continue to make it significantly more difficult for us to achieve profitability. We may not be able to regain profitability on a consistent basis, if at all.
14
Table of Contents
The recent recession and global economic crisis may impact our business, operating results or financial condition, including our revenue growth and profitability, which in turn could adversely affect our stock price.
The recent recession and global economic crisis caused a general tightening in the credit markets, lower levels of liquidity, increases in the rates of default and bankruptcy, public sector deficits and extreme volatility in credit, equity and fixed income markets, which have contributed to diminished expectations for the global economy. These macroeconomic developments have negatively affected, and continued or further weakness in the global economy in the future could negatively affect, our business, operating results or financial condition which, in turn, could adversely affect our stock price. A general weakening of, and related declining corporate confidence in, the global economy or the curtailment in government or corporate spending could cause current or potential customers to reduce their IT budgets or be unable to fund software or services purchases, which could cause customers to delay, decrease or cancel purchases of our products and services or cause customers not to pay us or to delay paying us for previously-purchased products and services.
Fluctuations in our quarterly results could cause our stock price to experience significant fluctuations or declines.
Our operating results have varied significantly in the past and will likely fluctuate significantly in the future. If revenues fall below our expectations in a particular quarter, we will likely not be able to reduce our spending rapidly in response to the shortfall and our quarterly operating results are likely to be adversely affected.
In addition, we anticipate that we will continue to experience long sales cycles. Further, we are not always able to predict the form that a particular customer transaction previously identified in the sales pipeline will ultimately take. For example, in recent quarters we have experienced a shift of some customer transactions away from software licenses to software as service subscription agreement transactions. This shift significantly affects the amount of revenue we recognize in the quarter in which the transaction occurs. Therefore, the timing of future customer contracts as well as the ultimate form of those contracts could be difficult to predict, making it difficult to predict revenues between quarters.
We also have limited visibility into our future revenue, especially license revenue, which often has been heavily concentrated in the third month of each quarter. As a result, if we were to fail to close a sufficient number of transactions by the end of our quarter, particularly large license transactions, we would miss our revenue projections. If our plan to expand sales coverage and marketing support to align with key growth initiatives is not successful, we could miss our revenue and profit projections. In addition, our operating expenses are based in part on future revenue projections and are relatively fixed in the short-term. If we cannot meet our revenue projections, our business will be seriously harmed.
Other factors that could affect our quarterly operating results include:
| • | The demand for our products and professional services and our efficiency in rendering our professional services; |
| • | The variability in the mix of the type of services delivered in any quarter and the extent to which third party contractors are used to provide such services; |
| • | The size and complexity of our license transactions and potential delays in recognizing revenue from license transactions; |
| • | The amount and timing of our operating expenses and capital expenditures; |
| • | The performance of our international business, which accounts for a substantial part of our condensed consolidated revenues; and |
| • | Fluctuations in foreign currency exchange rates. |
15
Table of Contents
Due to these and other factors, we believe that quarter-to-quarter comparisons of our revenues and operating results are not necessarily meaningful and should not be relied upon as indicators of future performance. It is possible that in some future quarter our operating results may be below the expectations of public market analysts or investors, which could cause the market price of our common stock to fall.
Our cloud strategy carries a number of risks which may be harmful to our business.
We derive a substantial portion of our revenues from subscriptions to our cloud-based offerings. To accelerate a transition of our business, in July 2011, we announced a strategy to offer new customers solely cloud-based subscriptions to our products. Our transition to a subscription model entails both a change to how we charge for our products as well as how we deliver them. These changes reflect a shift from perpetual license sales and delivery of our software in favor of purchasing the right to access the software for a specified subscription period. As customers increasingly move away from purchasing a perpetual license toward purchasing a subscription, we will experience a deferral of revenues and cash payments from customers. In addition to a change in license and delivery model, our transition to a subscription model requires significant investment in product development and cloud operations.
Additional risks associated with our transition to the subscription model include the following:
| • | we may experience a delay in recognizing revenue due to the combination of multiple element arrangements and longer subscription terms; |
| • | we may not successfully achieve market penetration in newly targeted markets, including target customers we characterize as middle-market companies; |
| • | our relationships with existing partners that require or prefer the ability to resell perpetual licenses may be negatively impacted; |
| • | we may not be successful in selling subscriptions to new customers that desire perpetual licenses; |
| • | although we intend to support existing perpetual license customers, our transition to a subscription model may raise concerns among our installed base of customers; |
| • | we may fail to achieve our target pricing; |
| • | we may have a short-term and/or long-term adverse impact on total revenues as a result of the transition; and |
| • | we may incur costs at a higher than forecasted rate as we expand our cloud operations. |
We expect competition from a variety of companies.
Many of our competitors have longer operating histories, substantially greater financial, technical, marketing or other resources, or greater name recognition than we do, enabling them to respond more quickly than we can to new or emerging technologies and changes in customer requirements. Such resources also enable our competitors to make substantial investments in the marketing and promotion of their products and services, and to withstand prolonged periods of negative cash flows and unfavorable economic, political and market conditions. Competition could seriously impede our ability to sell additional products and services on terms favorable to us. Our current and potential competitors may develop and market new technologies that render our existing or future products and services obsolete, unmarketable or less competitive. Our current and potential competitors may make strategic acquisitions or establish cooperative relationships among themselves or with other partners, thereby increasing the availability of their services to address the needs of our current and prospective customers. We may not be able to compete successfully against our current and future competitors, and competitive pressures that we encounter may seriously harm our business.
16
Table of Contents
The success of our recently announced Saba People Cloud could be adversely impacted by deployment problems, security breaches, or system or telecommunication disruptions.
The Saba People Cloud could encounter unexpected problems. These problems could be attributable to our products, third party software, telecommunications failures, security breaches, or the cloud technology from web services provider or other hosting providers. Industry acceptance of cloud computing is still forming. Since cloud technology is new and requires that customer data reside outside of a customer’s “firewall” of protection, many prospective customers could reject or delay adoption, thereby limiting the potential for this new offering. If the Saba People Cloud fails to keep pace with sales, customers may experience delays as we seek to obtain additional capacity, which could harm our reputation and adversely affect our revenue growth. Any disruption of service from the Saba People Cloud, or loss or compromise of customer data, would adversely affect our adoption and renewal rates for Saba People Cloud Applications and adversely impact our ability to achieve our business plan and forecasted financial results.
If we are unable to accurately forecast revenues, we may fail to meet stock analysts’ and investors’ expectations of our quarterly operating results, which could cause our stock price to decline.
We use a “pipeline” system, a common industry practice, to forecast sales and trends in our business. Our sales personnel monitor the status of all proposals, including the date when they estimate that a customer will make a purchase decision and the potential dollar amount of the sale. We aggregate these estimates periodically in order to generate a sales pipeline. We assess the pipeline at various points in time to look for trends in our business. While this pipeline analysis may provide us with some guidance in business planning and budgeting, these pipeline estimates are necessarily speculative and may not consistently correlate to revenues in a particular quarter or over a longer period of time, particularly during the recent weakness in the global macroeconomic environment. Further, we are not always able to predict the form that a particular customer transaction previously identified in the sales pipeline will ultimately take, particularly as we shift customer transactions away from software licenses to software as a service subscription transactions. This shift significantly affects the amount of revenue we recognize in the quarter in which the transaction occurs. Therefore, the timing of future customer contracts as well as the ultimate form of those contracts could be difficult to predict, making it difficult to forecast quarterly revenues.
Additionally, because we have historically recognized a substantial portion of our license revenues in the last month of each quarter and sometimes in the last few weeks of each quarter, we may not be able to adjust our cost structure in a timely manner in response to variations in the conversion of the sales pipeline into license revenues. Any change in the conversion rate of the pipeline into customer sales or in the pipeline itself could cause us to improperly budget for future expenses that are in line with our expected future revenues, which would adversely affect our operating margins and results of operations and could cause the price of our common stock to decline.
Intense competition in our target market could impair our ability to grow and achieve profitability on a consistent basis.
The market for our products and services is intensely competitive, dynamic and subject to rapid technological change. The intensity of the competition and the pace of change are expected to increase in the future. Increased competition is likely to result in price reductions, reduced gross margins and loss of market share, any one of which could seriously harm our business. Competitors vary in size and in the scope and breadth of the products and services offered. We encounter competition with respect to different aspects of our solution from a variety of sources including:
| • | companies that offer human capital management solutions that provide one or more applications within the HCM market, such as leaning management, performance management, talent management, compensation and recruiting, including SumTotal, Cornerstone OnDemand, Success Factors and Taleo; |
17
Table of Contents
| • | companies that offer collaboration solutions, such as Microsoft, Adobe, Citrix and Cisco; |
| • | enterprise software vendors that offer human resources information systems and employee relationship management systems with training and performance modules, such as SAP and Oracle; and |
| • | potential customers’ internal development efforts. |
Our growth depends on our ability to adequately expand and ramp our direct sales force.
We need to continue to increase and develop our sales and marketing infrastructure in order to grow our customer base and our business. We plan to continue to expand and ramp our direct sales force both domestically and internationally. Identifying and recruiting these people and training them in the use of our products require significant time, expense and attention. This expansion will require us to invest significant financial and other resources. Our business will be seriously harmed if our efforts to expand and ramp our direct sales force do not generate a corresponding significant increase in revenue. In particular, if we are unable to hire, develop and retain talented sales personnel or if new direct sales personnel are unable to achieve desired productivity levels in a reasonable period of time, whether due to the global economic slowdown or for other reasons, we may not be able to significantly increase our revenue and grow our business.
Our subscription business depends substantially on customers renewing their agreements with us. Any decline in our customer renewals would harm our future operating results.
In order for us to improve our operating results, it is important that our customers renew their agreements with us when the contract term expires. Our subscription customers have no obligation to renew their contracts, and we cannot assure you that customers will renew subscriptions at the same or higher level of service, if at all. During fiscal year 2011, 89% of our subscription services on a total annual contract dollar basis were renewed. Our customers’ renewal rates may decline or fluctuate as a result of a number of factors, including their satisfaction or dissatisfaction with our product offerings, pricing, the prices of competing products or services, completion of customer initiatives, mergers and acquisitions affecting our customer base, or reductions in our customers’ spending levels. If our subscription customers do not renew their contracts or renew on less favorable terms, our revenue may decline.
A significant amount of our revenue is revenue from the sale of subscription solutions, including SaaS transactions, which may affect our results in a number of different ways.
We generally recognize subscription revenue over the terms of our customer agreements, which typically range from one to three years. As a result, most of our quarterly subscription revenue results from agreements entered into during previous quarters. A decline in new or renewed subscriptions in any one quarter may not impact our financial performance in that quarter, but will negatively affect our revenue in future quarters. If a number of contracts expire and are not renewed in the same quarter, our revenue could decline significantly in that quarter and in subsequent quarters. Accordingly, the effect of significant declines in sales and market acceptance of our solutions may not be reflected in our short-term results of operations, making our results less indicative of our future prospects. It is also difficult for us to rapidly increase our subscription revenue through additional sales in any period, as revenue from new customers must be recognized over the applicable subscription term.
If our efforts to attract new customers or to sell additional solutions to our existing customers are not successful, our revenue growth will be adversely affected.
To increase our revenue, we must continually add new customers and sell additional solutions to existing customers. If our existing and prospective customers do not perceive our solutions to be of sufficiently high value and quality, we may not be able to attract new customers or to increase sales to existing customers. Our ability to attract new customers and to sell new solutions to existing customers will depend in large part on the success of
18
Table of Contents
our sales and marketing efforts. However, our existing and prospective customers may not be familiar with some of our solutions, or may have traditionally used other products and services for some of their people management requirements. Our existing and prospective customers may develop their own solutions to address their people management requirements, purchase competitive product offerings or engage third-party providers of outsourced people management services.
A decline in the price of, or demand for, our products or our related services offerings, would seriously harm our revenues and operating margins.
We anticipate that revenues from the Saba People Could Applications as well as related services will constitute substantially all of our revenue for the foreseeable future. Consequently, a decline in the price of, or demand for, the Saba People Cloud Applications or failure to achieve broad market acceptance would seriously harm our business.
Our products have a long sales cycle, which increases the cost of completing sales and renders completion of sales less predictable.
Due to the expense, broad functionality, and company-wide deployment of our products, the period between our initial contact with a potential customer and the purchase of our products and services is often long. To successfully sell our products and services, we generally must educate our potential customers regarding the use and benefits of our products and services. We may commit a substantial amount of time and resources to potential customers without assurance that any sales will be completed or revenues generated. Many of our potential customers are large enterprises that generally take longer to make significant business decisions. Our public sector customers, in particular, are subject to extensive procurement procedures that require many reviews and approvals. Our typical sales cycle has been approximately nine to 12 months, making it difficult to predict the quarter in which we may recognize revenue. The delay or failure to complete sales in a particular quarter could reduce our revenues in that quarter. If our sales cycle were to unexpectedly lengthen in general or for one or more large orders, it would adversely affect the timing of our revenues. If we were to experience a delay on a large license order, it could harm our ability to meet our forecasts for a given quarter.
We experience seasonality in our sales and expense, which could cause our operating results to fluctuate from quarter to quarter.
We experience quarterly seasonality in the demand for our products and services. For example, revenue has historically been lower in our first fiscal quarter while expenses have been higher than in the immediately preceding fourth fiscal quarter. Contributing to this seasonality is the timing of our first fiscal quarter that occurs during the summer months when general business activities slow down in a number of territories where we conduct our operations, particularly Europe. Our commission structure and other sales incentives also tend to result in fewer sales in the first fiscal quarter than in the fourth fiscal quarter. These seasonal variations in our revenue are likely to lead to fluctuations in our quarterly operating results.
Reductions in information technology spending could limit our ability to grow our business.
Our operating results may vary based on changes in the information technology spending of our clients. The revenue growth and profitability of our business depend on the overall demand for enterprise applications and services. We sell our solutions primarily to large organizations whose businesses fluctuate with general economic and business conditions. As a result, decreased demand for enterprise applications and services, and in particular people systems, caused by factors affecting the global economy may cause a decline in our revenue. Historically, economic downturns have resulted in overall reductions in corporate information technology spending. In particular, people software may be viewed by some of our existing and potential clients as a lower priority and may be among the first expenditures reduced as a result of unfavorable economic conditions. In the future, potential clients may decide to reduce their information technology budgets by deferring or reconsidering product purchases, which would negatively impact our operating results.
19
Table of Contents
We rely on our relationships with our strategic partners. If we do not maintain and strengthen these relationships, our ability to generate revenue and control expenses could be adversely affected, which could cause a decline in the price of our common stock.
We believe that our ability to increase the sales of our products depends in part upon maintaining and strengthening relationships with our current strategic partners and any future strategic partners. In addition to our direct sales force, we rely on established relationships with a variety of strategic partners, such as systems integrators, resellers, business process outsourcing partners (BPOs), human resource outsourcing partners (HROs) and distributors, for marketing, selling, implementing, and supporting our products in the United States and internationally.
Our strategic partners offer products from several different companies, including, in some cases, products that compete with our products. We have limited control, if any, as to whether these strategic partners devote adequate resources to promoting, selling, and implementing our products as compared to our competitors’ products. We cannot guarantee that we will be able to strengthen our relationships with our strategic partners or that such relationships will be successful in generating additional revenue.
We may not be able to maintain our strategic partnerships or attract sufficient additional strategic partners, who have the ability to market our products effectively, are qualified to provide timely and cost-effective customer support and service, or have the technical expertise and personnel resources necessary to implement our products for our customers. In particular, if our strategic partners do not devote sufficient resources to implement our products, we may incur substantial additional costs associated with hiring and training additional qualified technical personnel to implement solutions for our customers in a timely manner. Furthermore, our relationships with our strategic partners may not generate enough revenue to offset the significant resources used to develop these relationships. If we are unable to leverage the strength of our strategic partnerships to generate additional revenues, our revenues and the price of our common stock could decline.
Implementation of accounting regulations and related interpretations and policies, particularly those related to revenue recognition, could cause us to defer recognition of revenue or recognize lower revenue or to report lower earnings per share.
While we believe that we are in compliance with ASC 985-605 Software Revenue Recognition, additional implementation guidelines, and changes in interpretations of such guidelines, could lead to unanticipated changes in our current revenue accounting practices that could cause us to defer the recognition of revenue to future periods or to recognize lower revenue. In addition, policies, guidelines and interpretations related to accounting for acquisitions, income taxes, facilities consolidation charges, allowance for doubtful accounts and other financial reporting matters require different judgments on complex matters that are often subject to multiple sources of authoritative guidance. To the extent that management’s judgment is incorrect, it could result in an adverse impact on our financial statements. Further, the factual complexities of applying these policies, guidelines and interpretations to specific transactions can lead to unanticipated changes in revenue recognition with respect to such transactions, which may affect our revenue and results of operations.
If we fail to retain key employees and recruit qualified technical and sales personnel, our business could be harmed.
We believe that our success depends on the continued employment of our senior management and other key employees, the loss of any of which could materially harm our business. In addition, because our future success is dependent on our ability to continue to enhance and introduce new software and services, we are heavily dependent on our ability to attract and retain qualified engineers with the requisite education, background and industry experience. As we expand our business, our continued success will also depend, in part, on our ability to attract and retain qualified sales, marketing and operational personnel capable of supporting a larger and more diverse client base. The loss of the services of a significant number of our engineers or sales people could be disruptive to our development efforts or business relationships.
20
Table of Contents
The consolidation or acquisition of our competitors or other similar strategic alliances could weaken our competitive position or reduce our revenue.
There has been consolidation among companies offering software products and services in the market in which we operate. Additional consolidation within our industry may change the competitive landscape in ways that adversely affect our ability to compete effectively. Our competitors may also establish or strengthen cooperative relationships with our current or future BPO partners, HRO partners, systems integrators, third-party consulting firms or other parties with whom we have relationships, thereby limiting our ability to promote our products and limiting the number of consultants available to implement our solutions. Disruptions in our business caused by these events could reduce our revenue.
If we are unable to manage the complexity of conducting business globally, our international revenues may suffer.
International revenues accounted for 36% and 32% of our revenues for fiscal 2011 and 2010, respectively. Although we intend to continue to expand our international presence, in the future we may not be able to successfully market, sell or distribute our products and services in foreign markets. Factors that could materially adversely affect our international operations, and our business and future growth include:
| • | exposure to geopolitical instability, natural disasters and acts of war or terrorism; |
| • | difficulties in staffing and managing foreign operations, including language barriers; |
| • | seasonal fluctuations in purchasing patterns in other countries, particularly depressed sales during July and August in European markets; |
| • | difficulties in collecting accounts receivable in foreign countries, particularly European countries in which collections take considerably more time than the United States and collections are more difficult to effect; |
| • | currency exchange rate fluctuations, particularly in countries where we sell our products in denominations other than U.S. dollars, such as in the United Kingdom, the Euro zone, Australia and Japan, or have exposures in intercompany accounts denominated in foreign currencies; |
| • | exposure to tax regimes of multiple countries and potential increased tax exposure relating to in-country profits as well as audits and assessments relating to transfer pricing matters and other tax matters; |
| • | costs attributable to development of internationalized versions of our products and marketing and sales materials; |
| • | increases in our cost of doing business in foreign jurisdictions in order to comply with international and U.S. laws and regulations that apply to our international operations (including the Foreign Corrupt Practices Act in the U.S. and local laws in foreign jurisdictions which prohibit corrupt payments to governmental officials, data privacy requirements, labor relations laws, tax laws, anti-competition regulations, import and trader restrictions, and export requirements); |
| • | the reduced protection for intellectual property rights in some countries; |
| • | greater difficulties in maintaining and enforcing U.S. accounting and public reporting standards, including in staffing and managing foreign operations with personnel sufficiently experienced in U.S. accounting and public reporting standards; and |
| • | tariffs, export controls and other trade barriers and unexpected changes thereto. |
In addition, the reallocation of certain design, development and testing functions from the United States to our lower-cost development centers in India intensifies our exposure to international uncertainties. In recent years, increased growth and development of the technology market in general, and in India specifically, has made it more difficult for us to hire and retain qualified technical employees and other personnel. In addition to the risks inherent in conducting international operations as described above, certain risks are particularly acute in India, such as employee turnover, increasing salaries and less reliable infrastructure.
21
Table of Contents
A portion of our revenue is generated by sales to government entities, which are subject to a number of challenges and risks.
We derive a portion of our revenues from sales to U.S. and foreign federal, state and local governments and their respective agencies. Sales into government entities are subject to a number of risks. Selling to government entities can be highly competitive, expensive and time consuming, often requiring significant upfront time and expense without any assurance that we will successfully sell our products and services to such governmental entity. Government entities may not embrace our transition to cloud offerings and may require contract terms that differ from our standard arrangements. In addition, government demand and payment for our products may be affected by public sector budgetary cycles and funding authorizations, with funding reductions or delays adversely affecting public sector demand for our products. Most of our sales to government entities have been made indirectly through third-party prime contractors that resell our solutions. Government entities may have contractual or other legal rights to terminate contracts with our resellers for convenience or due to a default, and any such termination may adversely impact our future results of operations. Additionally, government contracts are generally subject to audits and investigations which could result in various civil and criminal penalties and administrative sanctions, including termination of contracts, refund of a portion of fees received, forfeiture of profits, suspension of payments, fines and suspensions or debarment from future government business.
Because a number of our products collect, store and report personal information of employees, privacy concerns could result in liability to us or inhibit sales of our products.
Many federal, state and foreign government bodies and agencies have adopted or are considering adopting laws and regulations regarding the collection, use and disclosure of personal information. Because many of our products collect, store and report on personal information, any inability to adequately address privacy concerns, even if unfounded, or comply with applicable privacy laws, regulations and policies, could result in liability to us, damage our reputation, inhibit sales and harm our business.
Furthermore, the costs of compliance with, and other burdens imposed by, such laws, regulations and policies that are applicable to the businesses of our customers may limit the use and adoption of our products and reduce overall demand for them. Privacy concerns, whether or not valid, may inhibit market adoption of our products in certain industries.
The enactment of legislation implementing changes in U.S. taxation of international business activities or the adoption of other tax reform policies could materially impact our financial position and results of operations.
Recently several tax bills have been introduced to reform U.S. taxation of international business activities. The current Administration has made public statements indicating that it has made the issue a priority and key members of the U.S. Congress have conducted hearings and proposed legislation. Accordingly, depending on the final form of legislation enacted, if any, these consequences may be significant for us due to the large scale of our international business activities. If any of these proposals are enacted into legislation, they could have material adverse consequences on the amount of tax we pay and thereby on our financial position and results of operations.
Currency exchange rate fluctuations could lower our revenue and net income.
During the fiscal year 2011, we recognized approximately 36% of our revenue in markets outside the United States. Sales are primarily denominated in U.S. dollars, and to an increasing extent, British pounds and Euros. As we continue to expand our operations, more of our contracts may be denominated in foreign currencies. In preparing our financial statements, we translate revenues and expenses in foreign countries from their local currencies into U.S. dollars using average exchange rates (during their respective fiscal periods average monthly exchange rate). Because an increasing portion of our sales is in foreign countries, exchange rate fluctuations may have a significant effect on our sales and earnings. Our reported net earnings may be significantly affected by fluctuations in currency exchange rates, with earnings generally increasing with a weaker U.S. dollar and
22
Table of Contents
decreasing with a strengthening U.S. dollar. As sales expand in countries where foreign currency transactions may be made, our operating results will increasingly be subject to the risks of exchange rate fluctuations and we may not be able to accurately estimate the impact that these changes may have on our future results of operations or financial condition. We may from time to time enter into foreign currency hedging contracts, which may create foreign currency losses. In fiscal 2011, we started a program that primarily utilized foreign currency forward contracts to offset some of these risks so that increases or decreases in our foreign currency exposures were offset by gains or losses on the foreign currency forward contracts in order to mitigate the risks and volatility associated with our foreign currency transactions. Our currency exposures typically arise from intercompany loans and other intercompany transactions that are expected to be cash settled in the near term. Our ultimate realized gain or loss with respect to foreign currency fluctuations will generally depend on the size and type of cross-currency transactions that are entered into, the currency exchange rates associated with these exposures and changes in those rates, whether we have entered into foreign currency forward contracts to offset these exposures, the effectiveness of these forward contracts or other hedging activities and other factors.
Future acquisitions and growth initiatives may be difficult to integrate, disrupt our business, dilute stockholder value or divert management’s attention.
As part of our overall business strategy, we have acquired and may continue to acquire complementary businesses or technologies and we expect to pursue other growth initiatives that will provide additional products or services offerings, additional industry expertise or an expanded geographic presence.
The pursuit of acquisitions involves a number of uncertainties, including selecting the appropriate products, technologies or companies to acquire, negotiating successful acquisition terms at appropriate prices, and successfully completing the targeted transaction. An element of our growth strategy depends on the availability of suitable acquisition candidates at reasonable prices. We may face competition for acquisition opportunities from other companies, including larger companies with greater financial resources. We also may incur substantial expenses in identifying and negotiating acquisition opportunities, whether or not completed.
In addition, no assurance can be given that the benefits or synergies we may expect from the acquisition of companies or businesses will be realized to the extent or in the time frame we anticipate, if at all. Any acquisitions that we complete could expose us to numerous risks, including:
| • | difficulties in the assimilation of the operations, technologies, products and personnel of the acquired company; |
| • | the diversion of management’s attention from other business concerns; |
| • | risks of entering markets in which we have no or limited prior experience; |
| • | the potential loss of key employees, significant customers and strategic partners of the acquired company; and |
| • | exposure to claims by terminated employees, stockholders of the acquired company or other third parties arising out of an acquisition (and the indemnification and other contractual protections we have may be inadequate to protect against these claims). |
These challenges can be magnified as the size of the acquisition increases. Any delays or unexpected costs incurred in connection with the integration of acquired companies or otherwise related to the acquisitions could have a material adverse effect on our business, financial condition and results of operations.
An acquisition or other growth initiative also could absorb substantial cash resources, require us to incur or assume debt obligations, or involve our issuance of additional equity securities. If we issue equity securities in connection with an acquisition or growth initiative, we may dilute our existing common stockholders with securities that have an equal or a senior interest in our company. If we incur additional debt to pay for or fund an
23
Table of Contents
acquisition or growth initiative, it may significantly increase our interest expense. Acquired entities also may be highly leveraged or dilutive to our earnings per share, or may have unknown liabilities. In addition, the combined entity may have lower revenues or higher expenses and therefore may not achieve the anticipated results. If additional financing is required but not available, we may be unable to take advantage of growth opportunities such as acquisitions or we may have to implement measures to conserve cash and reduce costs. Any of these factors could have a material adverse impact on our business, financial condition and results of operations.
Our business is subject to changing regulations regarding corporate governance and public disclosure that will increase both our costs and the risk of noncompliance.
As a public company, we incur significant legal, accounting and other expenses associated with compliance with applicable laws, rules, regulations and listing requirements. In addition, the Sarbanes-Oxley Act, the Dodd-Frank Act, and rules subsequently implemented by the SEC and The NASDAQ Stock Market, have imposed a variety of compliance requirements on public companies, including requiring changes in corporate governance practices. In addition, the SEC and the U.S. Congress may continue to increase the scope of applicable disclosure and corporate governance-related rules. Our management and other personnel will need to devote a substantial amount of time to the compliance requirements associated with being a public company. Moreover, these laws, rules and regulations have increased and will continue to increase the scope, complexity and cost of our corporate governance, reporting and disclosure practices.
We may incur impairments to goodwill or long-lived assets.
We are required to test goodwill for impairment annually or if a triggering event occurs in accordance with the provisions of ASC 350-20 Goodwill and Other Intangible Assets. We are also required to test long-lived assets for impairment if a triggering event occurs with the provisions of ASC 350-30 General Intangibles other than Goodwill and ASC 360-10 Property, Plant and Equipment. Such impairment could be caused by internal factors as well as external factors beyond our control.
Significant negative industry or economic trends, reduced estimates of future cash flows, disruptions to our business, slower growth rates or lack of growth in the areas in which we generate revenues could lead to an impairment charge for any of our intangible assets or goodwill. If, in any period, our stock price decreases to the point where the fair value of the Company, as determined by our market capitalization, is less than our book value, this could indicate a potential impairment and we may be required to record an impairment charge in our statement of operations in that period which would cause our profits to decline.
We operate in highly competitive environments and projections of future operating results and cash flows may vary significantly from actual results. Additionally, if a significant decline in our stock price and/or market capitalization result in impairment to our goodwill, we may be required to record a charge to earnings in our financial statements during a period in which such impairment is determined to exist, which may negatively impact our results of operations. Our valuation methodology for assessing impairment requires management to make judgments and assumptions based on historical experience and to rely, heavily, on projections of future operating performance.
Delays in releasing new products or enhanced versions of our existing products could adversely affect our competitive position.
As part of our strategy, we expect to regularly release new products and new versions of our existing products. Even if our new products or new versions of our existing products contain the features and functionality our customers want; in the event we are unable to timely introduce these new products or product releases, our competitive position may be harmed. We cannot assure you that we will be able to successfully complete the development of currently planned or future products or product releases in a timely and efficient manner. Due to the complexity of our products, internal quality assurance testing and customer testing of
24
Table of Contents
pre-commercial releases may reveal product performance issues or desirable feature enhancements that could lead us to postpone the release of these products. In addition, the reallocation of resources associated with any postponement would likely cause delays in the development and release of other future products or enhancements to our currently available products. The reallocation of certain design, development and testing functions to our lower-cost development center heightens risks relating to product design, development, testing and introduction. Any delay in releasing future products or enhancements of our products could harm our business.
If we release products containing defects, we may need to halt further shipments, service levels may be reduced and our business and reputation would be harmed.
Products as complex as ours, often contain unknown and undetected errors or performance problems. Serious defects are frequently found during the period immediately following introduction and initial shipment of new products or enhancements to existing products, even though our products are subject to rigorous testing and quality control processes. Although we attempt to resolve all errors that we believe would be considered serious by our customers before shipment to them, our products are not error-free. These errors or performance problems could result in lost revenues, reduced service levels, delays in customer acceptance on professional services products and would be detrimental to our business and reputation. As is typical in the software industry, with each release we have discovered errors in our products after introduction. We will not be able to detect and correct all errors before releasing our products commercially and these undetected errors could be significant. We cannot assure you that undetected errors or performance problems in our existing or future products will not be discovered in the future or that known errors considered minor by us will not be considered serious by our customers, resulting in cancellation of orders, loss of customers, difficulties in achieving our sales goals, increased demands on our support services, a decrease in our revenues and service credits or refunds. To correct such errors, we may expend considerable time and resources to develop and release modifications to our software.
As a result of such errors, we may be subject to warranty and product liability claims that are costly or difficult to settle. Our products and services enable customers to manage critical business information. If product errors are alleged to cause or contribute to security and privacy breaches or misappropriation of confidential information, we may also be subject to significant liability. Although our license agreements contain provisions intended to limit our exposure to liability, we cannot assure you that these limits will be adequate, that they will be enforceable or, if enforceable, that they will be interpreted favorably by a court.
We face risks related to claims by third parties that we infringe their intellectual property rights and other litigation.
In recent years, there has been significant litigation in the United States involving patents and other intellectual property rights, particularly in the software and Internet-related industries. We have, in the past, been and are presently subject to intellectual property actions. For example, on August 19, 2003, EdiSync Systems, LLC filed a complaint against Centra in federal court in Denver, Colorado, alleging infringement of two patents for a remote multiple user editing system and method and seeking to enjoin us from continuing to sell our products, as well as unspecified compensatory damages. Centra filed an answer to the complaint denying all of the allegations, and instituted reexamination proceedings for the patents at issue with the Patent Office. Centra filed a request for reexamination of the patents at issue with the Patent Office. Our patent counsel is of the opinion that claims of the patents involved in the suit are invalid. The re-examination request was accepted by the Patent Office and the Colorado District Court approved the parties’ motion to stay the court proceedings during the re-examination proceedings. A reexamination certificate has been issued for one of the patents that canceled all of the patent’s claims, thus rendering that patent of no further force or effect. The Patent Office issued a reexamination certificate for the other patent canceling all of the patent’s original claims and allowing certain newly-added claims. We believe we are free from liability for past actions, as we believe the newly-added claims would be enforceable only prospectively as of the issue date of the reexamination certificate. Centra has since filed a second reexamination request asking the Patent Office to reconsider the patentability of the newly-added claims in view of newly-discovered prior art and the Patent Office has granted that request. The Colorado
25
Table of Contents
District Court again stayed the litigation pending the outcome of the second reexamination proceeding. On March 21, 2011, the Patent Office issued a final office action indicating that all but two of the twenty eight claims in the reexamination certificate are unpatentable and that one claim added during this reexamination proceeding is patentable. On March 25, 2011, the plaintiff filed a motion to lift the stay on the court proceedings. Although we believe that we have meritorious defenses and intend to vigorously defend this action, we can give no assurance that we will be able to achieve a satisfactory outcome. We could become subject to additional intellectual property infringement claims as the number of our competitors grows and our products and services overlap with competitive offerings. Any of these claims, even if not meritorious, could be expensive to defend and could divert management’s attention from operating our company. If we become liable to third parties for infringing their intellectual property rights, we could be required to pay a substantial award of damages and to develop non-infringing technology, obtain a license or cease selling the products that contain the infringing intellectual property. We may be unable to develop non-infringing technology or obtain a license on commercially reasonable terms, if at all. We also may face other forms of litigation or claims as part of our business, which may expose us to additional costs and risks.
Our products include third party technology, the loss of which could materially harm our business.
We use licensed third party technology components in our products. Future licenses to this technology may not be available to us on commercially reasonable terms, or at all. The loss of or inability to obtain or maintain any of these technology licenses could result in delays in the introduction of new products or could force us to discontinue offering portions of our solutions until equivalent technology, if available, is identified, licensed and integrated.
Our use of open source technology could impose limitations on our ability to commercialize our products.
We use open source software in our application suite. Although we monitor our use of open source software closely, the terms of many open source licenses have not been interpreted by United States courts, and there is risk that such licenses could be construed in a manner that imposes unanticipated conditions or restrictions on our ability to commercialize our products. In such event, we could be required to re-engineer our technology or to discontinue offering all or a portion of our products in the event re-engineering cannot be accomplished on a timely basis, any of which could adversely affect our business, operating results and financial condition.
We may not be able to adequately protect our proprietary technology, and our competitors may be able to offer similar products and services that would harm our competitive position.
Our success depends upon our proprietary technology. We rely primarily on copyright, trademark and trade secret laws, confidentiality procedures and contractual provisions to establish and protect our proprietary rights. As part of our confidentiality procedures, we enter into non-disclosure agreements with our employees. Despite these precautions, third parties could copy or otherwise obtain and use our technology without authorization, which may represent potential sales and revenue losses that are difficult to quantify. Policing unauthorized use of our technology is difficult, time-consuming and costly. Were we to discover instances of unauthorized use, there can be no assurance that we would be able to enforce our proprietary rights or obtain adequate recovery for our losses. In addition, we have seven patents issued in the United States and seven patent applications pending in the United States. We cannot assure you that any patents will be issued for any of the pending patent applications. Even for the issued patents, or any patent issued to us in the future, there can be no assurance that such patent will protect our intellectual property, or will not be challenged by third parties. Furthermore, effective protection of intellectual property rights is unavailable or limited in certain foreign countries. We cannot assure you that the protection of our proprietary rights will be adequate or that our competitors will not independently develop similar technology, duplicate our products and services or design around any patents or other intellectual property rights we hold.
26
Table of Contents
Our disaster recovery plan does not include fully redundant systems, and a disaster could severely damage our operations.
Our disaster recovery plan does not include fully redundant systems for our services at an alternate site. A disaster could severely harm our business because our services could be interrupted for an indeterminate length of time. Our operations depend upon our ability to maintain and protect the computer systems needed for the day-to-day operation of the subscription business. A number of these computer systems are located on or near known earthquake fault zones. Although these systems are designed to be fault-tolerant, the systems are vulnerable to damage from fire, floods, earthquakes, power loss, telecommunications failures and other events. Additionally, we do not carry sufficient business insurance to compensate us for all potential losses that could occur.
We outsource the management and maintenance of a portion of our subscription business to third parties and will depend upon them to provide adequate management and maintenance services.
We rely on third parties to provide key components of our networks and systems. For instance, we rely on third-party Internet service providers to host our products for our subscription customers. We also rely on third-party communications service providers for the high-speed connections that link our networks and our Internet service providers’ Web servers and office systems to the Internet. Our reliance on third party providers limits our ability to control critical customer service functions and communications systems. Any Internet or communications systems failure or interruption could result in disruption of our service or loss or compromise of customer orders and data. These failures, especially if they are prolonged or repeated, would make our services less attractive to customers and tarnish our reputation.
If our security measures are breached and unauthorized access is obtained to client data, clients may curtail or stop their use of our subscription solutions, which would harm our business, operating results and financial condition.
A portion of our subscription business involves the storage and transmission of confidential information of clients and their existing and potential employees, and security breaches could expose us to a risk of loss of, or unauthorized access to, this information, resulting in possible litigation and possible liability. If our security measures are ever breached as a result of third party action, employee error, malfeasance or otherwise, and, as a result, an unauthorized party obtained access to this confidential data, our reputation could be damaged, our business may suffer and we could incur significant liability. Techniques used to obtain unauthorized access or to sabotage systems change frequently and generally are not discovered until launched against a target. As a result, we may be unable to anticipate these techniques or to implement adequate preventative measures. If an actual or perceived breach of our security occurs, the market perception of our security measures could be harmed and we could lose sales and clients.
Our stock price may fluctuate substantially.
From the beginning of fiscal year 2010 through May 31, 2011, the market price for our common stock has fluctuated between $3.05 per share and $10.62 per share. The market price for our common stock may be affected by a number of factors, including those described above and the following:
| • | the announcement of new products and services or product and service enhancements by us or our competitors; |
| • | actual or anticipated quarterly variations in our results of operations or those of our competitors; |
| • | changes in earnings estimates or recommendations by securities analysts that may follow our stock; |
| • | developments in our industry, including announcements of significant acquisitions or strategic partnerships; and |
| • | general market conditions and other factors, including factors unrelated to our operating performance or the operating performance of our competitors. |
27
Table of Contents
In addition, the stock market in general, and The NASDAQ Stock Market technology companies in particular, have experienced extreme price and volume fluctuations that have often been unrelated or disproportionate to the operating performance of particular companies. Broad market and industry trends may also materially and adversely affect the market price of our common stock, regardless of our actual operating performance. Volatility in the market price and trading volume of our common stock may prevent our stockholders from selling their shares at a favorable price. In the past, following periods of volatility in the market price of a company’s securities, securities class-action litigation has often been initiated against that company. Class-action litigation could result in substantial costs and a diversion of management’s attention and resources.
The anti-takeover provisions in our charter and bylaws and our rights plan could delay or prevent a change in control.
Our Amended and Restated Certificate of Incorporation and Amended and Restated Bylaws contain provisions that could make it more difficult for a third party to acquire us without the consent of our Board of Directors.
For example, if a potential acquirer were to make a hostile bid for us, the acquirer would not be able to call a special meeting of stockholders to remove our Board of Directors or act by written consent without a meeting. In addition, our Board of Directors has staggered terms that make it difficult to remove all directors at once. The acquirer would also be required to provide advance notice of its proposal to remove directors at an annual meeting. The acquirer will not be able to cumulate votes at a meeting, which will require the acquirer to hold more shares to gain representation on the Board of Directors than if cumulative voting were permitted.
Our Board of Directors also has the ability to issue preferred stock that would significantly dilute the ownership of a hostile acquirer. In addition, Section 203 of the Delaware General Corporation Law limits business combination transactions with 15% stockholders that have not been approved by the Board of Directors. These provisions and other similar provisions make it more difficult for a third party to acquire us without negotiation. These provisions may apply even if the offer may be considered beneficial by some stockholders. In addition, on June 2, 2009, our Board of Directors authorized and declared a dividend of one right for each outstanding share of our common stock to stockholders of record at the close of business on June 15, 2009. Each right entitles the registered holder, subject to the terms of the rights agreement between us and the rights agent, to purchase from us one one-thousandth of a share (a “Unit”) of Series A Preferred Stock, par value $0.001 per share, at a purchase price of $12.50 per Unit, under circumstances described in the rights agreement. The purchase price, the number of units of preferred stock and the type of securities issuable upon exercise of the rights are subject to adjustment. The rights will expire at the close of business June 2, 2012 unless earlier redeemed or exchanged. Until a right is exercised, the holder thereof, as such, will have no rights as one of our stockholders, including the right to vote or to receive dividends. The rights are not immediately exercisable. Subject to the terms and conditions of the rights agreement, they will become exercisable ten business days after a person or group acquires, or commences a tender or exchange offer which would lead to the acquisition of, beneficial ownership of 15% or more of our outstanding common stock. Once a person or group acquires beneficial ownership of 15% or more of our outstanding common stock, subject to the terms of the rights agreement, each right not owned by that person or group or certain related parties will entitle its holder to purchase, at the right’s then-current purchase price, Units of Series A Preferred Stock or, at our option, shares of common stock or cash, property or other securities of our Company having a market value equal to twice the then-current purchase price.
The anti-takeover provisions in our charter and bylaws and under Delaware law, as well as our rights agreement could have the effect of discouraging a third party from making a tender offer or otherwise attempting to gain control of us, even though the transactions could be profitable for our stockholders. If the acquirer was discouraged from offering to acquire us or prevented from successfully completing a hostile acquisition by our anti-takeover measures, our stockholders could lose the opportunity to sell their shares at a favorable price.
28
Table of Contents
ITEM 1B: UNRESOLVED STAFF COMMENTS
None.
Facilities
Our principal executive offices occupy approximately 36,000 square feet in Redwood Shores, California. On September 7, 2010, we entered into a Third Amendment which was effective as of August 31, 2010, extending the lease termination date from May 31, 2014 to May 31, 2019. Our research and development offices occupy approximately 12,500 square feet in Pune, India under a lease that expires in August 2012. We have additional leased facilities in Baltimore, Maryland, Lexington, Massachusetts, Duluth, Georgia and Princeton, New Jersey, in Australia, Canada, France, Germany, India, Japan, Switzerland, Morocco and the United Kingdom. We believe that our facilities are adequate to meet our needs for the foreseeable future.
Litigation Relating to Initial Public Offering of Saba
In November 2001, a complaint was filed in the United States District Court for the Southern District of New York (the “District Court”) against us, certain of its officers and directors, and certain underwriters of our initial public offering. The complaint was purportedly filed on behalf of a class of certain persons who purchased our common stock between April 6, 2000 and December 6, 2000. The complaint alleges violations by us and our officers and directors of Section 11 of the Securities Act of 1933, as amended (the “Securities Act”), Section 10(b) of the Securities Exchange Act of 1934, as amended (the “Exchange Act”), and other related provisions in connection with certain alleged compensation arrangements entered into by the underwriters in connection with the initial public offering. An amended complaint was filed in April 2002. Similar complaints have been filed against hundreds of other issuers that have had initial public offerings since 1998. The complaints allege that the prospectus and the registration statement for the initial public offering failed to disclose that the underwriters allegedly solicited and received “excessive” commissions from investors and that some investors in the initial public offering agreed with the underwriters to buy additional shares in the aftermarket in order to inflate the price of our stock. The complaints were later consolidated into a single action. The complaint seeks unspecified damages, attorney and expert fees, and other unspecified litigation costs.
On July 1, 2002, the underwriter defendants in the consolidated actions moved to dismiss all of the actions, including the action involving us. On July 15, 2002, we, along with other non-underwriter defendants in the coordinated cases, moved to dismiss the litigation. On February 19, 2003, the District Court ruled on the motions. The District Court granted our motion to dismiss the claims against us under Rule 10b-5, due to the insufficiency of the allegations against us. The District Court also granted the motion of the individual defendants, Bobby Yazdani and Terry Carlitz, our Chief Executive Officer and Chairman of the Board and former Chief Financial Officer and a member of our Board of Directors, to dismiss the claims against them under Rule 10b-5 and Section 20 of the Exchange Act. The motions to dismiss the claims under Section 11 of the Securities Act were denied as to virtually all of the defendants in the consolidated cases, including us.
In June 2003, a proposed collective partial settlement of this litigation was structured between the plaintiffs, the issuer defendants in the consolidated actions, the issuer officers and directors named as defendants, and the issuers’ insurance companies. In June 2004, an agreement of partial settlement was submitted to the District Court for preliminary approval. The District Court granted the preliminary approval motion on February 15, 2005, subject to certain modifications. On August 31, 2005 the District Court issued a preliminary order further approving the modifications to the settlement and certifying the settlement classes. The District Court also
29
Table of Contents
appointed the notice administrator for the settlement and ordered that notice of the settlement be distributed to all settlement class members by January 15, 2006. The settlement fairness hearing occurred on April 24, 2006, and the court reserved decision at that time.
While the partial settlement was pending approval, the plaintiffs continued to litigate against the underwriter defendants. The District Court directed that the litigation proceed within a number of “focus cases” rather than in all of the 310 cases that have been consolidated. Our case is not one of these focus cases. On October 13, 2004, the District Court certified the focus cases as class actions. The underwriter defendants appealed that ruling, and on December 5, 2006, the Court of Appeals for the Second Circuit reversed the District Court’s class certification decision. On April 6, 2007, the Second Circuit denied plaintiffs’ petition for rehearing. In light of the Second Circuit opinion, counsel for the issuer defendants informed the District Court that this settlement could not be approved because the defined settlement class, like the litigation class, could not be certified. On June 25, 2007, the District Court entered an order terminating the settlement agreement. On August 14, 2007, the plaintiffs filed their second consolidated amended class action complaints against the focus cases and on September 27, 2007, again moved for class certification. On November 12, 2007, certain of the defendants in the focus cases moved to dismiss the second consolidated amended class action complaints. On March 26, 2008, the District Court denied the motions to dismiss except as to Section 11 claims raised by those plaintiffs who sold their securities for a price in excess of the initial offering price and those who purchased outside the previously certified class period. Briefing on the class certification motion was completed in May 2008. That motion was withdrawn without prejudice on October 10, 2008.
On April 2, 2009, a stipulation and agreement of settlement among the plaintiffs, issuer defendants and underwriter defendants was submitted to the Court for preliminary approval. The Court granted the plaintiffs’ motion for preliminary approval and preliminarily certified the settlement classes on June 10, 2009. The settlement fairness hearing was held on September 10, 2009. On October 5, 2009, the Court entered an opinion granting final approval to the settlement and directing that the Clerk of the Court close these actions. Appeals of the opinion granting final approval were filed, and the appeals filed by one objector have been remanded to the district court to determine standing to appeal.
We intend to dispute these claims and defend the lawsuit vigorously. However, due to the inherent uncertainties of litigation and because the settlement remains subject to appeal,, the ultimate outcome of the litigation is uncertain. An unfavorable outcome in litigation could materially and adversely affect our business, financial condition and results of operations.
Litigation Relating to Centra’s Initial Public Offering
Centra, certain of its former officers and directors and the managing underwriters of Centra’s initial public offering were named as defendants in an action filed in the District Court. The plaintiffs filed an initial complaint on December 6, 2001 and purported to serve the Centra defendants on or about March 18, 2002. The original complaint has been superseded by an amended complaint filed in April 2002. The action, captioned in re Centra Software, Inc. Initial Public Offering Securities Litigation, No. 01 CV 10988, is purportedly brought on behalf of the class of persons who purchased Centra’s common stock between February 3, 2000 and December 6, 2000. The complaint asserts claims under Sections 11 and 15 of the Securities Act and Sections 10(b) and 20(a) of the Exchange Act. The complaint alleges that, in connection with Centra’s initial public offering in February 2000, the underwriters received undisclosed commissions from certain investors in exchange for allocating shares to them and also agreed to allocate shares to certain customers in exchange for the agreement of those customers to purchase additional shares in the aftermarket at pre-determined prices. The complaint asserts that Centra’s registration statement and prospectus for the offering were materially false and misleading due to their failure to disclose these alleged arrangements. The complaint seeks damages in an unspecified amount against Centra and the named individuals. Similar complaints have been filed against hundreds of other issuers that have had initial public offerings since 1998; the complaints have been consolidated into an action captioned in re Initial Public Offering Securities Litigation, No. 21 MC 92.
30
Table of Contents
On July 1, 2002, the underwriter defendants in the consolidated actions moved to dismiss all the actions, including the action involving Centra. On July 15, 2002, Centra, along with other non-underwriter defendants in the coordinated cases, moved to dismiss the litigation. On October 9, 2002, pursuant to agreements tolling the statute of limitations for claims related to the litigation, the plaintiffs dismissed, without prejudice, the claims against the named Centra officers and directors in the above-referenced action. Subsequent addenda to the agreements extended the tolling period through August 27, 2010. On February 19, 2003, the District Court issued an order denying the motion to dismiss the claims against Centra under Rule 10b-5. The motions to dismiss the claims under Section 11 of the Securities Act were denied as to virtually all of the defendants in the consolidated cases, including Centra.
In June 2003, a proposed collective partial settlement of this litigation was structured between the plaintiffs, the issuer defendants in the consolidated actions, the issuer officers and directors named as defendants, and the issuers’ insurance companies. In June 2004, an agreement of settlement was submitted to the District Court for preliminary approval. The District Court granted the preliminary approval motion on February 15, 2005, subject to certain modifications. On August 31, 2005 the District Court issued a preliminary order further approving the modifications to the settlement and certifying the settlement classes. The District Court also appointed the notice administrator for the settlement and ordered that notice of the settlement be distributed to all settlement class members by January 15, 2006. The settlement fairness hearing occurred on April 24, 2006, and the court reserved decision at that time.
While the partial settlement was pending approval, the plaintiffs continued to litigate against the underwriter defendants. The District Court directed that the litigation proceed within a number of “focus cases” rather than in all of the 310 cases that have been consolidated. Our case is not one of these focus cases. On October 13, 2004, the District Court certified the focus cases as class actions. The underwriter defendants appealed that ruling, and on December 5, 2006, the Court of Appeals for the Second Circuit reversed the District Court’s class certification decision. On April 6, 2007, the Second Circuit denied plaintiffs’ petition for rehearing. In light of the Second Circuit opinion, counsel for the issuer defendants informed the District Court that this settlement could not be approved because the defined settlement class, like the litigation class, could not be certified. On June 25, 2007, the District Court entered an order terminating the settlement agreement. On August 14, 2007, the plaintiffs filed their second consolidated amended class action complaints against the focus cases and on September 27, 2007, again moved for class certification. On November 12, 2007, certain of the defendants in the focus cases moved to dismiss the second consolidated amended class action complaints. On March 26, 2008, the District Court denied the motions to dismiss except as to Section 11 claims raised by those plaintiffs who sold their securities for a price in excess of the initial offering price and those who purchased outside the previously certified class period. Briefing on the class certification motion was completed in May 2008. That motion was withdrawn without prejudice on October 10, 2008.
On April 2, 2009, a stipulation and agreement of settlement among the plaintiffs, issuer defendants and underwriter defendants was submitted to the Court for preliminary approval. The Court granted the plaintiffs’ motion for preliminary approval and preliminarily certified the settlement classes on June 10, 2009. The settlement fairness hearing was held on September 10, 2009. On October 5, 2009, the Court entered an opinion granting final approval to the settlement and directing that the Clerk of the Court close these actions. On August 26, 2010, based on the expiration of the tolling period stated in the agreements between the plaintiffs and the named Centra officers and directors, the plaintiffs filed a notice to terminate the tolling agreement and recommence litigation against the named Centra officers and directors. The plaintiffs stated to the Court that they do not intend to take any further action against the named Centra officers and directors at this time. Appeals of the opinion granting final approval were filed, and the appeals filed by one objector were remanded to the district court to determine standing to appeal.
We, on behalf of Centra, intend to dispute these claims and defend the lawsuit vigorously. However, due to the inherent uncertainties of litigation and because the settlement remains subject to appeal, the ultimate outcome of the litigation is uncertain. An unfavorable outcome in litigation could materially and adversely affect our business, financial condition and results of operations.
31
Table of Contents
Litigation Relating to Claim of Patent Infringement by Centra
On August 19, 2003, a complaint was filed against Centra and two other defendants by EdiSync Systems, LLC, in the United States District Court for the District of Colorado (No. 03-D-1587 (OES)) (the “Colorado District Court”). The complaint alleges infringement of two patents for a remote multiple user editing system and method and seeks permanent injunctive relief against continuing infringement, compensatory damages in an unspecified amount, and interest, costs and expenses associated with the litigation. Centra filed an answer to the complaint denying all of the allegations. No amount has been accrued related to this matter and legal costs incurred in the defense of the matter are being expensed as incurred. Centra filed a request for reexamination of the patents at issue with the U.S. Patent and Trademark Office (the “Patent Office”). Our patent counsel is of the opinion that claims of the patents involved in the suit are invalid. The re-examination request was accepted by the Patent Office and the Colorado District Court approved the parties’ motion to stay the court proceedings during the re-examination proceedings. A reexamination certificate has been issued for one of the patents that canceled all of the patent’s claims, thereby rendering that patent of no further force or effect. The Patent Office issued a reexamination certificate for the other patent canceling all of the patent’s original claims and allowing certain newly-added claims. We believe that it is free from liability for actions prior to April 18, 2009, as we believe the newly-added claims would be enforceable only prospectively as of the issue date of the reexamination certificate. Centra has since filed a second reexamination request asking the Patent Office to reconsider the patentability of the newly-added claims in view of newly-discovered prior art and the Patent Office has granted that request. The Colorado District Court again stayed the litigation pending the outcome of the second reexamination proceeding. On July 15, 2011, EdiSync made a filing with the Patent Office requesting the entry of various amendments to the pending claims and indicating that the Patent Office had agreed that such claims would be found patentable in view of those amendments. We believe that it has meritorious defenses with respect to any future claims and intends to vigorously defend this action. However, due to the inherent uncertainties of litigation, we cannot accurately predict the ultimate outcome of the litigation. An unfavorable outcome of the litigation could materially and adversely affect our business, financial condition and results of operations.
Litigation Relating to Claim of Patent Infringement by Saba
On November 19, 2007, a complaint was filed against the Company and ten other defendants by Gemini IP, LLC (“Gemini”), in the United States District Court for the Eastern District of Texas (No. 07-CV-521) (the “Texas District Court”). The complaint alleges infringement of a patent directed to a method for processing client help requests using a computer network and seeks permanent injunctive relief against continuing infringement, compensatory damages in an unspecified amount, and interest, costs and expenses associated with the litigation. We filed an answer to the complaint denying all of the allegations. At our request, the Patent Office instituted reexamination proceedings against the asserted patent and the Texas District Court stayed the action pending the outcome of those proceedings. On September 14, 2010, the Patent Office issued a Reexamination Certificate cancelling all of the patent’s original claims that were asserted against us in the litigation. The Reexamination Certificate also includes several new claims that were added during the reexamination proceeding. We settled the litigation with an immaterial amount, and the case was dismissed with prejudice on May 31, 2011.
ITEM 4: (REMOVED AND RESERVED)
32
Table of Contents
ITEM 5: MARKET FOR REGISTRANT’S COMMON EQUITY, RELATED STOCKHOLDER MATTERS AND ISSUER PURCHASES OF EQUITY SECURITIES
Price Range of Common Stock
Since our initial public offering on April 7, 2000, our common stock has traded on the Nasdaq Global Market under the symbol “SABA.” The following table sets forth the range of the quarterly high and low sales prices per share of our common stock for the periods indicated.
| Year ended May 31, 2011 |
High | Low | ||||||
| First Quarter |
$ | 5.29 | $ | 4.67 | ||||
| Second Quarter |
$ | 6.22 | $ | 5.05 | ||||
| Third Quarter |
$ | 7.43 | $ | 5.69 | ||||
| Fourth Quarter |
$ | 10.62 | $ | 6.75 | ||||
| Year ended May 31, 2010 |
High | Low | ||||||
| First Quarter |
$ | 4.48 | $ | 3.05 | ||||
| Second Quarter |
$ | 4.46 | $ | 3.32 | ||||
| Third Quarter |
$ | 5.14 | $ | 4.02 | ||||
| Fourth Quarter |
$ | 5.81 | $ | 4.58 | ||||
We had 191 stockholders of record as of July 31, 2011. A substantially greater number of holders of common stock are “street name” or beneficial holders, whose shares are held of record by banks, brokers, and other financial institutions.
Dividends
We have not declared or paid any cash dividends on our common stock, and presently we intend to retain our future earnings, if any, to fund the development and growth of our business. Our line of credit restricts our ability to pay cash dividends. For a description of this line of credit and these restrictions, see Item 7: “Management’s Discussion and Analysis of Financial Condition and Results of Operations,—Liquidity and Capital Resources—Contractual Obligations and Commitments.”
Sales of Unregistered Equity Securities
None.
Issuer Purchases of Equity Securities
On March 25, 2010, our Board of Directors authorized the use of up to $5 million for the repurchase of shares of our common stock. On January 6, 2011 the Board of Directors authorized the use of up to an additional $5 million for the repurchase of shares of our common stock. As of May 31, 2011, approximately $4.5 million remained available for share repurchases pursuant to our share repurchase program.
Depending on market conditions, shares may be repurchased from time to time at prevailing market prices through open market or privately negotiated transactions. No date has been established for the completion of the share repurchase program. We are not obligated to repurchase any shares. Subject to applicable corporate securities laws, repurchases may be made at such times and in such amounts as our management deems appropriate. Repurchases under the program can be discontinued at any time management feels additional repurchases are not warranted. We intend on financing any repurchases with funds from operations.
33
Table of Contents
The following table summarizes our share repurchase activity by month for the three months ended May 31, 2011 and the approximate dollar value of shares that may yet be repurchased pursuant to our share repurchase program:
| Period |
Total Number of Shares Purchased |
Average Price Paid per Share |
Total Cost for Number of Shares Purchased as Part of Publicly Announced Plans or Programs |
Maximum Approximate Dollar Value of Shares That May Yet Be Purchased Under the Plans or Programs |
||||||||||||
| (in thousands, except per share amounts) | ||||||||||||||||
| March 1 – 31, 2011 |
87,584 | (1) | $ | 9.31 | $ | 826 | $ | 6,026 | ||||||||
| April 1 – 30, 2011 |
156,448 | 9.63 | 1,523 | 4,503 | ||||||||||||
| May 1 – 31, 2011 |
— | — | — | 4,503 | ||||||||||||
|
|
|
|
|
|||||||||||||
| Total |
244,032 | $ | 2,349 | $ | 4,503 | |||||||||||
|
|
|
|
|
|||||||||||||
| (1) | Includes 384 shares of common stock pursuant to our restricted stock units program for an aggregate price of approximately $3,000 to satisfy tax withholding obligations that arose on the vesting of restricted stock units. |
34
Table of Contents
Stock Performance Graph and Cumulative Total Return
The following line graph compares the yearly percentage change in the cumulative total stockholder return on our common stock from May 31, 2006 through the end of our fiscal year ended May 31, 2011 with the percentage change in cumulative total stockholder return for (i) the NASDAQ Stock Market—U.S. Index and (ii) the Research Data Group—RDG Technology Composite Index. The comparison assumes an investment of $100 on May 31, 2006 in stock or index, including reinvestment of dividends, if any. The stock price performance shown on the graph below is not necessarily indicative of future price performance.
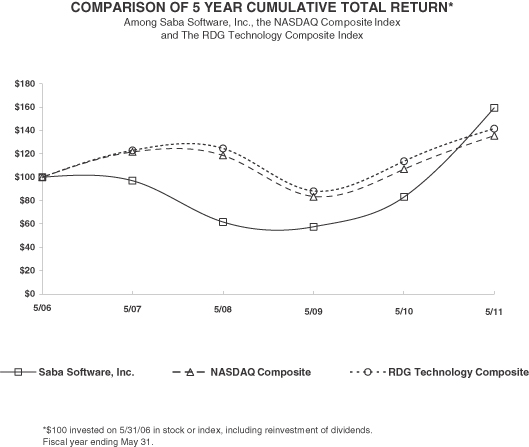
| 5/06 | 5/07 | 5/08 | 5/09 | 5/10 | 5/11 | |||||||||||||||||||
| Saba Software, Inc. |
100.00 | 96.94 | 61.61 | 57.58 | 83.06 | 159.52 | ||||||||||||||||||
| NASDAQ Composite |
100.00 | 121.55 | 118.74 | 83.47 | 106.84 | 135.48 | ||||||||||||||||||
| RDG Technology Composite |
100.00 | 123.13 | 124.74 | 88.38 | 113.80 | 141.62 | ||||||||||||||||||
Equity Compensation Plan Information
For equity compensation plan information, please refer to Part III, Item 12: “Security Ownership of Certain Beneficial Owners and Management and Related Stockholder Matters—Equity Compensation Plan Information” of this Annual Report on Form 10-K.
35
Table of Contents
ITEM 6: SELECTED FINANCIAL DATA
The following selected consolidated financial data should be read in conjunction with Item 8: “Financial Statements”, and Supplementary Data” and Item 7: “Management’s Discussion and Analysis of Financial Condition and Results of Operations” and other financial data included elsewhere in this Annual Report on Form 10-K. The consolidated statements of operations data for each of the three years ended May 31, 2011, 2010 and 2009 and the consolidated balance sheet data as of May 31, 2011 and 2010 are derived from our audited financial statements included elsewhere in this Annual Report on Form 10-K. The consolidated statements of operations data for each of the two years ended May 31, 2008 and 2007 and the consolidated balance sheet data as of May 31, 2009, 2008 and 2007 are derived from our audited financial statements previously filed with the SEC.
| For the years ended May 31, | ||||||||||||||||||||||||||||
| 2011 | 2010 | 2009 | ||||||||||||||||||||||||||
| As Reported |
As Previously Reported |
Adjustments (1) | As Adjusted |
As Previously Reported |
Adjustments (1) | As Adjusted |
||||||||||||||||||||||
| (in thousands, except per share data) | ||||||||||||||||||||||||||||
| Consolidated Statement of Operations |
||||||||||||||||||||||||||||
| Total revenues |
$ | 116,657 | $ | 109,570 | $ | — | $ | 109,570 | $ | 102,821 | $ | — | $ | 102,821 | ||||||||||||||
| Gross profit |
73,638 | 71,579 | — | 71,579 | 61,539 | — | 61,539 | |||||||||||||||||||||
| Total operating expenses |
79,689 | 68,162 | 128 | 68,290 | 62,062 | 156 | 62,218 | |||||||||||||||||||||
| Income (loss) from operations |
(6,051 | ) | 3,417 | (128 | ) | 3,289 | (523 | ) | (156 | ) | (679 | ) | ||||||||||||||||
| Net income (loss) |
$ | (7,263 | ) | $ | 2,893 | $ | (128 | ) | $ | 2,765 | $ | (2,355 | ) | $ | (156 | ) | $ | (2,511 | ) | |||||||||
|
|
|
|
|
|
|
|
|
|
|
|
|
|
|
|||||||||||||||
| Basic net gain (loss) per share |
$ | (0.26 | ) | $ | 0.10 | $ | (0.00 | ) | $ | 0.10 | $ | (0.08 | ) | $ | (0.01 | ) | $ | (0.09 | ) | |||||||||
|
|
|
|
|
|
|
|
|
|
|
|
|
|
|
|||||||||||||||
| Diluted net gain (loss) per share |
$ | (0.26 | ) | $ | 0.10 | $ | (0.01 | ) | $ | 0.09 | $ | (0.08 | ) | $ | (0.01 | ) | $ | (0.09 | ) | |||||||||
|
|
|
|
|
|
|
|
|
|
|
|
|
|
|
|||||||||||||||
| Shares used in computing basic net gain (loss) per share |
28,214 | 28,263 | 28,263 | 28,263 | 29,174 | 29,174 | 29,174 | |||||||||||||||||||||
|
|
|
|
|
|
|
|
|
|
|
|
|
|
|
|||||||||||||||
| Shares used in computing diluted net gain (loss) per share |
28,214 | 29,293 | 29,293 | 29,293 | 29,174 | 29,174 | 29,174 | |||||||||||||||||||||
|
|
|
|
|
|
|
|
|
|
|
|
|
|
|
|||||||||||||||
| May 31, | ||||||||||||||||||||||||||||
| 2011 | 2010 | 2009 | ||||||||||||||||||||||||||
| As Reported |
As Previously Reported |
Adjustments (1) | As Adjusted |
As Previously Reported |
Adjustments (1) | As Adjusted |
||||||||||||||||||||||
| (in thousands) | ||||||||||||||||||||||||||||
| Consolidated Balance Sheet |
||||||||||||||||||||||||||||
| Cash and cash equivalents |
$ | 25,940 | $ | 32,002 | $ | — | $ | 32,002 | $ | 25,978 | $ | — | $ | 25,978 | ||||||||||||||
| Total assets |
113,575 | 103,444 | 524 | 103,968 | 99,723 | 652 | 100,375 | |||||||||||||||||||||
| Long-term obligations, less current portion |
7,196 | 5,500 | — | 5,500 | 6,293 | — | 6,293 | |||||||||||||||||||||
| Total stockholders’ equity |
43,423 | 49,026 | 524 | 49,550 | 48,565 | 652 | 49,217 | |||||||||||||||||||||
36
Table of Contents
| For the years ended May 31, | ||||||||||||||||||||||||
| 2008 | 2007 | |||||||||||||||||||||||
| As Previously Reported |
Adjustments (1) | As Adjusted |
As Previously Reported |
Adjustments (1) | As Adjusted |
|||||||||||||||||||
| (in thousands, except per share data) | ||||||||||||||||||||||||
| Consolidated Statement of Operations |
||||||||||||||||||||||||
| Total revenues |
$ | 107,777 | $ | — | $ | 107,777 | $ | 99,867 | $ | — | $ | 99,867 | ||||||||||||
| Gross profit |
67,553 | — | 67,553 | 62,928 | — | 62,928 | ||||||||||||||||||
| Total operating expenses |
70,216 | (170 | ) | 70,046 | 70,244 | (638 | ) | 69,606 | ||||||||||||||||
| Income (loss) from operations |
(2,663 | ) | 170 | (2,493 | ) | (7,316 | ) | 638 | (6,678 | ) | ||||||||||||||
| Net income (loss) |
$ | (3,542 | ) | $ | 170 | $ | (3,372 | ) | $ | (7,974 | ) | $ | 638 | $ | (7,336 | ) | ||||||||
|
|
|
|
|
|
|
|
|
|
|
|
|
|||||||||||||
| Basic net gain (loss) per share |
$ | (0.12 | ) | $ | 0.01 | $ | (0.12 | ) | $ | (0.28 | ) | $ | 0.02 | $ | (0.26 | ) | ||||||||
|
|
|
|
|
|
|
|
|
|
|
|
|
|||||||||||||
| Diluted net gain (loss) per share |
$ | (0.12 | ) | $ | 0.01 | $ | (0.12 | ) | $ | (0.28 | ) | $ | 0.02 | $ | (0.26 | ) | ||||||||
|
|
|
|
|
|
|
|
|
|
|
|
|
|||||||||||||
| Shares used in computing basic net gain (loss) per share |
29,016 | 29,016 | 29,016 | 28,541 | 28,541 | 28,541 | ||||||||||||||||||
|
|
|
|
|
|
|
|
|
|
|
|
|
|||||||||||||
| Shares used in computing diluted net gain (loss) per share |
29,016 | 29,016 | 29,016 | 28,541 | 28,541 | 28,541 | ||||||||||||||||||
|
|
|
|
|
|
|
|
|
|
|
|
|
|||||||||||||
| May 31, | ||||||||||||||||||||||||
| 2008 (2) | 2007 | |||||||||||||||||||||||
| As Previously Reported |
Adjustments (1) | As Adjusted |
As Previously Reported |
Adjustments (1) | As Adjusted |
|||||||||||||||||||
| (in thousands) | ||||||||||||||||||||||||
| Consolidated Balance Sheet |
||||||||||||||||||||||||
| Cash and cash equivalents |
$ | 16,624 | $ | — | $ | 16,624 | $ | 18,088 | $ | — | $ | 18,088 | ||||||||||||
| Total assets |
98,931 | 808 | 99,739 | 101,613 | 638 | 102,251 | ||||||||||||||||||
| Long-term obligations, less current portion |
6,031 | — | 6,031 | 6,695 | — | 6,695 | ||||||||||||||||||
| Total stockholders’ equity |
48,488 | 808 | 49,296 | 47,901 | 638 | 48,539 | ||||||||||||||||||
| (1) | Certain amounts have been adjusted for the retrospective change in accounting principle for sales commission. (See Note 2 in Item 8: “Financial Statements and Supplemental Data Notes to Consolidated Financial Statements”). |
| (2) | Certain reclassifications have been made to prior period amounts to conform to the current period presentation, as follows: (i) part of the restricted cash has been classified as long-term restricted cash; and (ii) part of deferred revenue related to subscription has been reclassified as long term deferred revenue. Such reclassifications did not have a significant impact on the Company’s net cash (used in) provided by operating activities. |
ITEM 7: MANAGEMENT’S DISCUSSION AND ANALYSIS OF FINANCIAL
CONDITION AND RESULTS OF OPERATIONS
The following discussion and analysis of our financial condition and results of operations should be read in conjunction with the consolidated financial statements and related notes contained herein and the information included in our other filings with the SEC. This discussion includes “forward-looking statements” within the meaning of Section 27A of the Securities Act and Section 21E of the Exchange Act. All statements in this Annual Report on Form 10-K other than statements of historical fact, are forward-looking statements. These forward-looking statements involve known and unknown risks and uncertainties. Our actual results may differ materially from those projected or assumed in such forward-looking statements. Among the factors that could cause actual results to differ materially are the factors detailed under Item 1A: “Risk Factors.” All forward-looking statements and risk factors included in this document are made as of the date of this report, based on information available to us as of such date. We assume no obligation to update any forward-looking statement or risk factor. See “Cautionary Note on Forward-Looking Statements.”
37
Table of Contents
INTRODUCTION
Management’s Discussion and Analysis of Financial Condition and Results of Operations (“MD&A”) is intended to provide readers with an understanding of Saba. The following sections are included in our MD&A:
| • | Overview; |
| • | Critical Accounting Policies; |
| • | Results of Operations; and |
| • | Liquidity and Capital Resources. |
OVERVIEW
General
We are the premier provider of a new class of learning and talent management solutions providing a unified set of People Cloud Applications that include: enterprise learning, talent management, testing and assessment and collaboration solutions delivered through the Saba People Cloud. Today’s people-driven enterprises are using our solutions to mobilize and engage people around new strategies and initiatives, align and connect people to accelerate the flow of business, and cultivate, capture, and share individual and collective knowhow to effectively compete and succeed. We enable organizations to build a transformative workplace where they can leverage their people networks to become more competitive through innovation, speed, agility, and trust.
The Saba People Cloud consists of a full suite of integrated People Cloud Applications, an open, flexible, service-oriented architecture, a world-class multi-tenant people cloud infrastructure, and a vast people cloud community of human capital experts, partners, practitioners and thought leaders. The Saba People Cloud enables organizations to transform the way they develop, engage and inspire their people network of employees, partners and customers, to achieve sustainable competitive advantage and high impact performance.
Background
We commenced operations in April 1997 and, through March 1998, focused substantially all of our efforts on research activities, developing our products and building our business infrastructure. We shipped our first Saba Enterprise Learning products and began to generate revenues from software license fees, implementation and consulting services fees and support fees in April 1998.
Commencing in fiscal 2011, we experienced an accelerated shift toward increased customer adoption of SaaS transactions from perpetual licenses. To further accelerate the transition, in July 2011, we announced a strategy to offer new customers solely cloud-based subscriptions to our products. Assuming this strategy is successful, we expect that the increased adoption of SaaS by our customers will lead to greater predictability in our quarterly revenue and our results of operations. However, the shift from software licenses has had an impact on our total revenue and results of operations during the last few quarters in part because we recognize revenues from SaaS over the term of the subscription agreement whereas revenue from a software license sale is generally recognized in the period in which the software arrangement is completed and the software is delivered to the customer.
Our corporate headquarters are located in Redwood Shores, California. We have an international presence in Australia, Brazil, Canada, France, Germany, India, Japan and the United Kingdom through which we conduct various operating activities related to our business. In each of the non-U.S. jurisdictions in which we have subsidiaries, other than India, we have employees or consultants engaged in sales and services activities. In the case of our India subsidiary, our employees primarily engage in software development and quality assurance testing activities.
Sources of Revenue
We generate revenues from the sale of subscription services, software licenses and professional services.
38
Table of Contents
Subscription Services
Subscription revenue includes revenue from delivery of our products in the cloud and revenue from license updates and product support. Customers that desire to access our products in the cloud generally sign subscription agreements with terms typically ranging from one to three years. License updates and product support include the right to receive future unspecified updates for the applicable software product and technical support. We typically sell license updates and product support for an initial period of one year concurrently with the sale of the related software license. After the initial period, license updates and product support is renewable on an annual basis at the option of the customer. Our subscription revenue depends upon both our sales of additional subscription services and renewals of existing agreements.
We believe that subscription revenue will grow steadily for the foreseeable future as we anticipate that the majority of our customers will renew their annual contracts and we will continue to add new subscription customers.
Software Licenses
Although we expect that our new customers will primarily purchase our products in the cloud on a software as a service basis, we will continue to license our products on a limited basis primarily to existing customers. When we license our software, it is included in multiple-element arrangement that includes a combination of our software, license updates and product support and/or professional services. A significant amount of our license sales are for perpetual licenses. Our license revenue is affected by, among other things, the strength of general economic and business conditions, as well as customers’ budgetary cycles and the competitive position of our software products. In addition, the sales cycle for our products is typically six to twelve months. The timing of a few large software license transactions can substantially affect our quarterly license revenue.
Professional Services
Our professional services business consists of consulting and education services. Consulting and education services are typically provided to customers that have purchased our products directly from us. These consulting and education services are generally provided over a period of three to nine months after the product purchase. Accordingly, our consulting and education services revenue varies directly with the levels of new product bookings generated from our direct sales organization in the preceding three to nine month period. In addition, our consulting and education services revenue varies following our commercial release of significant software updates as our license customers may engage our services to assist with the implementation of their software update. We provide consulting services on a time and materials basis and on a fixed fee basis. Generally, consulting services related to software implementation are not considered essential to the functionality of the software.
Impact of Adoption
Prior to adoption of Financial Accounting Standards Board (“FASB”) Accounting Standards Update No. 2009-13 Revenue Recognition (Topic 605) Multiple-Deliverable Revenue Arrangements (A Consensus of the FASB Emerging Issues Task Force) (ASU 2009-13), our professional services, when sold with cloud based offerings, did not qualify as separate units of accounting and were recognized as revenue ratably over the longest subscription period in the arrangement. Under subscription accounting, we also deferred the associated professional services costs and recognized them on a straight-line basis over the same subscription period. This resulted in the deferral of professional services revenue and professional services cost of revenue.
With the adoption of ASU 2009-13, arrangement consideration is allocated using the relative selling price method and recognized as individual deliverables in accordance with the guidance described in the Critical Accounting Policies. Additionally, we expense the direct cost related to the professional services as incurred.
39
Table of Contents
Total revenues for the year ended May 31, 2011 were $116.7 million with the adoption of ASU 2009-13. If we did not elect an early adoption of ASU 2009-13, our total revenues would have been $113.7 million for the year ended May 31, 2011. The increase in total revenues was primarily due to an increase of $2.7 million in professional services revenue that we recognized based on the adoption of ASU 2009-13.
Cost of revenues for the year ended May 31, 2011 was $43.0 million with the adoption of ASU 2009-13. Cost of revenues would have been $41.2 million for the year ended May 31, 2011 had we not adopted ASU 2009-13. The increase in cost of revenues was the result of expensing direct costs related to the professional services as incurred.
As of May 31, 2011, our deferred revenue was $45.8 million. Our deferred revenue would have been $48.8 million had we not adopted ASU 2009-13.
The impact of our adoption of ASU 2009-13 will vary, in the future, based on the nature and volume of new or materially modified arrangements.
Cost of Revenue
Our cost of revenue primarily consists of compensation, employee benefits and out-of-pocket travel-related expenses for our employees, and the fees of third-party subcontractors, who provide professional services. Cost of revenue also includes external hosting fees and depreciation and amortization charges related to the infrastructure required to deliver our products in the cloud, third-party license royalty costs, overhead allocated based on headcount and reimbursed expenses. The amortization of acquired developed technology, which is comprised of the ratable amortization of technological assets acquired in acquisitions, is also included in the cost of revenue. Many factors affect our cost of revenue, including changes in the mix of products and services, pricing trends and changes in the amount of reimbursed expenses. Because cost as a percentage of revenues is higher for services than for software licenses, an increase in services, including subscription services, as a percentage of our total revenue would reduce gross profit as a percentage of total revenue.
We classify deferred revenue and deferred costs on our condensed consolidated balance sheet as current if we expect to recognize such revenue or cost within the following twelve months. As of May 31, 2011, the deferred balance of the professional services revenue related to such subscription offerings and the related deferred costs was $1.4 million and $0.8 million, respectively, related to contracts that were entered into prior to adoption of ASU 2009-13 and 2009-14. Deferred revenue and deferred costs related to contracts that were entered into prior to June 1, 2010 continue to be recognized and amortized ratably over the subscription period provided that such contracts were not subsequently modified.
Operating Expenses
We classify all operating expenses, except amortization of purchased intangible assets and restructuring, to the research and development, sales and marketing, and general and administrative expense categories based on the nature of the expenses. Each of these three categories includes commonly recurring expenses such as salaries (including stock-based compensation), employee benefits, travel and entertainment costs, and allocated communication, rent and depreciation costs. We allocate communication, rent and depreciation costs to each of the functional areas that derive a benefit from such costs based upon their respective headcounts. The sales and marketing category of operating expenses also includes sales commissions and expenses related to public relations and advertising, trade shows and marketing collateral materials. The general and administrative category of operating expenses also includes allowances for doubtful accounts, and administrative and professional services fees.
In the third quarter of fiscal year 2011, we voluntarily changed our accounting policy for sales commissions related to non-cancellable annual or multi-year SaaS contracts, from recording an expense when incurred, to deferral and amortization of the sales commission in proportion to the revenue recognized over the
40
Table of Contents
non-cancellable term of the contract. All other sales commissions are generally expensed as they are earned per the terms of the sales compensations plans. We believe this method is preferable because commission charges are so closely related to the revenue from the non-cancellable contracts that they should be deferred and charged to expense over the same period that the related revenue is recognized. Furthermore, the adoption of this accounting policy enhances the comparability of the Company’s consolidated financial statements by changing to the predominant method utilized in our industry. For additional discussion related to the sales commission accounting policy change, refer to Note 2 of the Consolidated Financial Statements.
CRITICAL ACCOUNTING POLICIES
Our discussion and analysis of our financial condition and results of operations is based upon our consolidated financial statements, which have been prepared in accordance with United States Generally Accepted Accounting Principles (“GAAP”) as set forth in the Financial Accounting Standards Board’s Accounting Standard Codification (the “Codification”) and consider the various staff accounting bulletins and other applicable guidance issued by the SEC. GAAP, as set forth within the Codification, requires us to make estimates and judgments that affect the reported amounts of assets and liabilities at the date of the financial statements and the reported amounts of revenues and expenses during the reporting periods. Actual results could differ materially from those estimates. We base our estimates and judgments on historical experience and on various other assumptions that we believe are reasonable under the circumstances. However, future events are subject to change and the best estimates and judgments routinely require adjustment. While a number of accounting policies, methods and estimates affect our financial statements, areas that are particularly significant include revenue recognition policies, the assessment of recoverability of goodwill and purchased intangible assets, share-based payments, income taxes and business combinations. We have reviewed the critical accounting policies described in the following paragraphs with the Audit Committee of our Board of Directors.
Revenue recognition
In October 2009, the FASB issued ASU 2009-13 which amends the revenue recognition for certain multiple element revenue arrangements excluding license arrangements to:
| • | provide updated guidance on whether multiple elements exist, how the elements in an arrangement should be separated, and how the arrangement consideration should be allocated to the separate elements; |
| • | require an entity to allocate arrangement consideration to each element based on a selling price hierarchy, where the selling price for an element is based on vendor-specific objective evidence (“VSOE”), if available; third-party evidence (“TPE”), if available and if VSOE is not available; or the best estimate of selling price (“BESP”), if neither VSOE nor TPE is available; and |
| • | eliminate the use of the residual method and require an entity to allocate arrangement consideration using the relative selling price method. |
Although the amended standards were not required to be adopted by us until June 1, 2011 (the beginning of our fiscal year 2012), we elected to early adopt this accounting guidance retrospectively to the beginning of its first quarter of fiscal 2011 for transactions entered into or materially modified after May 31, 2010. We generate revenues from the sale of software licenses, subscription services and professional services and recognize revenues when all of the following conditions are met:
| • | persuasive evidence of an agreement exists; |
| • | delivery has occurred; |
| • | the fee is fixed or determinable; and |
| • | collection is probable. |
41
Table of Contents
Subscription Services Arrangements
Subscription services arrangements generally include a combination of our products delivered via an internet-based cloud architecture, and product updates and support related to licenses and professional services. Subscription revenue includes revenue from cloud-based offerings and product updates and support related to licenses.
Revenue from cloud-based offerings that are integrated offerings pursuant to which the customers’ ability to access our software is not separable from the services necessary to operate the software (and customers are not allowed to take possession of our software) are recognized ratably over the term of the arrangement as delivered. We do not grant our resellers the right of return and do not recognize revenue from resellers until an end-user has been identified and the other conditions of ASC 985-605 are satisfied. Revenue from product updates, support and hosting services related to licenses are recognized ratably over the term of the arrangement as delivered or on an as-used basis if defined in the contract.
When subscription services arrangements involve multiple elements that qualify as separate units of accounting, we allocate arrangement consideration in multiple-deliverable revenue arrangements at the inception of an arrangement to all deliverables based on the relative selling price method in accordance with the selling price hierarchy, which includes: (i) VSOE if available; (ii) TPE if VSOE is not available; and (iii) BESP if neither VSOE nor TPE is available.
We determine VSOE based on its historical pricing and discounting practices for the specific product or service when sold separately. In determining VSOE, we require that a substantial majority of the selling prices for these services fall within a reasonably narrow pricing range. We limit our assessment of VSOE for each element to either the price charged when the same element is sold separately or the price established by management, having the relevant authority to do so, for an element not yet sold separately.
When VSOE cannot be established for deliverables in multiple element arrangements, we apply judgment with respect to whether we can establish a selling price based on TPE. TPE is determined based on competitor prices for similar deliverables when sold separately. Generally, our go-to-market strategy differs from that of our peers and our offerings contain a significant level of differentiation such that the comparable pricing of services with similar functionality cannot be obtained. Furthermore, we are unable to reliably determine what similar competitor services’ selling prices are on a stand-alone basis. As a result, we have not been able to establish selling price based on TPE.
When it is unable to establish a selling price using VSOE or TPE, we use BESP in our allocation of arrangement consideration. The objective of BESP is to determine the price at which we would transact a sale if the product or service were sold on a stand-alone basis. We determine BESP for deliverables by considering multiple factors including, but not limited to, prices we charge for similar offerings, market conditions, competitive landscape and pricing practices.
We have not historically priced our cloud-based offerings within a narrow range and limited historical renewal rate information is available based on the life cycle of these offerings. As a result, we use BESP in order to allocate the selling price to cloud-based deliverables. In general, we use VSOE in order to allocate the selling price to professional service deliverables.
Certain cloud-based offerings include arrangements with customers that have separately licensed and taken possession of our software. When these offerings are part of a multiple element arrangement involving licenses, we recognize revenue in accordance with ASC 985-605.
Software License Arrangements
Software license arrangements generally include a combination of our software, license updates and product support and/or professional services. A significant amount of our software license arrangements are for perpetual licenses.
42
Table of Contents
We recognize revenue earned on perpetual software license arrangements in accordance with FASB’s ASC 985-605, Software-Revenue Recognition. When software arrangements involve multiple elements, we recognize license revenue, using the residual method, in accordance with ASC 985-605. Under the residual method revenue is allocated to undelivered elements based on VSOE of fair value of such undelivered elements and the residual amount of the arrangement is allocated to delivered elements. Accordingly, assuming all other revenue recognition criteria are met, revenues from perpetual licenses are recognized upon delivery using the residual method. We limit our assessment of VSOE for each element to either the price charged when the same element is sold separately or the price established by management, having the relevant authority to do so, for an element not yet sold separately.
License revenues from licenses with a term of three years or more are generally recognized on delivery if the other conditions of ASC 985-605 are satisfied. License revenues from licenses with a term of less than three years are generally recognized ratably over the term of the arrangement. In arrangements where term licenses are bundled with license updates and product support and such revenue is recognized ratably over the term of the arrangement. We allocate the revenue to license revenue and to license updates and product support revenue based on the VSOE of fair value for license updates and product support revenue on perpetual licenses of similar products. We do not grant our resellers the right of return and do not recognize revenue from resellers until an end-user has been identified and the other conditions of ASC 985-605 are satisfied.
Professional Services
Professional services revenues are generally recognized as the services are performed. Although we generally provide professional services on a time-and-materials basis, certain services agreements are provided on a fixed-fee basis. For services performed on a fixed-fee basis, revenues are generally recognized using the proportional performance method, with performance measured based on hours of work performed. For contracts that involve significant customization and implementation or consulting services that are essential to the functionality of the software, the license and services revenues are recognized using the percentage-of-completion method or, if we are unable to reliably estimate the costs to complete the services, We use the completed-contract method of accounting in accordance with ASC 985-605 and relevant guidance of ASC 605-35 Construction-Type and Certain Production–Type. A contract is considered complete when all significant costs have been incurred or the item has been accepted by the customer.
If the requirements of ASC 985-605 are not met when we bill a customer or a customer pays us, the billed or paid amount is recorded as deferred revenue, which is a liability account. As the revenue recognition criteria of ASC 985-605 are satisfied, the requisite amounts are recognized as revenue.
We classify deferred revenue and deferred costs on our consolidated balance sheet as current if we expect to recognize such revenue or cost within the following twelve months. When the revenue from professional services is recognized ratably over the subscription for transactions entered in prior to adoption of ASU 2009-13, we allocate the revenue to professional services revenue and to subscription revenue based on the VSOE of fair value for similar professional services that qualify as a separate element of the arrangement. Our judgment as to whether the consulting services qualify as a separate unit of accounting may materially affect the timing of our revenue recognition and results of operations.
Recoverability of goodwill and purchased intangible assets
We account for goodwill under ASC 350-20 Goodwill. Our goodwill balance at May 31, 2011 and May 31, 2010 was $41.5 million and $36.1 million, respectively. We account for purchased intangible assets under ASC 350-30 General Intangibles Other than Goodwill. Amortization of purchased intangible assets, including acquired developed technology, was $3.3 million for 2011 and $4.0 million for fiscal 2010 and 2009. As of May 31, 2011 and May 31, 2010, our purchased intangible assets balance was $8.7 million and $5.0 million, net of accumulated amortization. The total expected future amortization related to purchased intangible assets will be approximately $2.7 million and $0.9 million in fiscal years 2012 and 2013, respectively.
43
Table of Contents
ASC 350-20 prescribes a two-phase process for impairment testing of goodwill. The first phase requires us to test for impairment, while the second phase, if necessary, requires us to measure and allocate for the impairment. We consider Saba to be a single reporting unit. Accordingly, all of our goodwill is associated with the entire company. We perform the required impairment analysis of goodwill annually or on a more frequent basis if indicators of impairment arise or circumstances otherwise dictate. A significant and extended reduction in our enterprise fair value to below the recorded amount of our stockholders’ equity could indicate a change in our business climate and under ASC 350-20, we could be required to write down the carrying value of our goodwill and record an expense for an impairment loss.
In accordance with ASC 350-30 and ASC 360-10 Property, Plant and Equipment, we review our long-lived asset groups, including property and equipment and other intangibles, for impairment whenever events indicate that their carrying amount may not be recoverable. We did not identify any such indicators in each of the fiscal years ended May 31, 2011, 2010 and 2009.
Share-based compensation
Under ASC718-10 Compensation—Stock Compensation, we are required to estimate the awards that we ultimately expect to vest and reduce share-based compensation expense for the effects of estimated forfeitures of awards over the expense recognition period. Although, we estimate forfeitures based on historical experience, forfeitures in the future may differ. The forfeiture rate must be revised if actual forfeitures differ from our original estimates. We recognize awards granted under the straight-line amortization method. We estimate the fair value of employee stock options using the Black-Scholes-Merton (“BSM”) pricing model. The fair value of an award is affected by our stock price on the date of grant as well as other assumptions including the estimated volatility of our stock price over the term of the awards and the estimated period of time that we expect employees to hold their stock options. The risk-free interest rate assumption is based upon United States treasury interest rates appropriate for the expected life of the awards. We estimate the volatility of our common stock based upon our historical stock price volatility over the length of the expected term of the stock option. We use historical data to estimate pre-vesting option forfeitures and record share-based compensation expense only for those awards that are expected to vest. Our expected dividend rate is zero since we do not currently pay cash dividends on our common stock and do not anticipate doing so in the foreseeable future.
ASC 718-10 requires the benefits of tax deductions in excess of the tax-effected compensation that would have been recognized as if we had always accounted for our stock-based award activity under ASC 718-10 to be reported as a cash flow from financing activities, rather than as a cash flow from operating activities. Excess benefits of tax deductions were $39,000 and have been recorded for the year ended May 31, 2011.
To the extent we change the terms of our employee stock-based compensation programs and refine different assumptions in future periods such as forfeiture rates that differ from our estimates, the stock-based compensation expense that we record in future periods may differ significantly from what we have recorded during our fiscal 2011 reporting period.
Income Taxes
Significant judgment is required in determining our worldwide income tax provision. In the ordinary course of a global business, there are many transactions and calculations where the ultimate tax outcome is uncertain. Some of these uncertainties arise as a consequence of the process of identifying items of revenues and expenses that qualify for preferential tax treatment, segregating foreign and domestic earnings and expenses to avoid double taxation, and determining required intercompany revenue sharing, cost reimbursement and other transfer pricing arrangements among related entities. Although we believe that our estimates are reasonable, the final tax outcome of these matters could be different from that which is reflected in our historical income tax provisions and accruals. Such differences could have a material effect on our income tax provision and net income in the period in which such determination is made.
44
Table of Contents
We record a valuation allowance to reduce our deferred tax assets to the amount that is more likely than not to be realized. Our deferred tax assets consist primarily of net operating loss carry forwards and tax credit carryforwards. In order for us to realize our deferred tax assets, we must be able to generate sufficient taxable income in those jurisdictions where the deferred tax assets are located. We consider future growth, forecasted earnings, future taxable income, the mix of earnings in the jurisdictions in which we operate and prudent and feasible tax planning strategies in determining the need for a valuation allowance. We maintain a full valuation allowance on our U.S. deferred tax assets. A portion of the valuation allowance pertains to deferred tax assets established in connection with prior acquisitions, and to the extent that this portion of the valuation allowance was reversed in fiscal 2009, goodwill was adjusted. The reversal of the valuation allowance in fiscal year 2010 and thereafter, pertaining to deferred tax assets established in connection with such prior acquisitions, would be credited to earnings. Although we believe that our tax estimates are reasonable, the ultimate tax determination involves significant judgment that could become subject to audit by tax authorities in the ordinary course of business. In the event that we were to determine that it is more likely than not that all or part of the net deferred tax assets would be realized, an adjustment to the deferred tax assets valuation allowance would be credited to earnings in the period in which we made such determination. If we later determine that we would not be able to realize all or part of the net deferred tax assets, an adjustment to the deferred tax assets valuation allowance would be charges to earnings at such time.
We calculate our current and deferred tax provision based on estimates and assumptions that could differ from the actual results reflected in income tax returns filed during the subsequent year. Adjustments based on filed returns are generally recorded in the period when the tax returns are filed and the global tax implications are known. The amount of income tax we pay is subject to ongoing audits by federal, state and foreign tax authorities, which often result in proposed assessments. Our estimate of the potential outcome for any uncertain tax issue is highly judgmental. We believe we have adequately provided for any reasonably foreseeable outcome related to these matters. However, our future results may include favorable or unfavorable adjustments to our estimated tax liabilities in the period the assessments are made or resolved, audits are closed or when statutes of limitation on potential assessments expire. Additionally, the jurisdictions in which our earnings or deductions are realized may differ from our current estimates. As a result, our effective tax rate may fluctuate significantly on a quarterly basis.
Under ASC 740-10 Income Taxes, we recognize and measure uncertain tax positions taken or expected to be taken in a tax return based on a two-step approach. The first step is to determine if the weight of available evidence indicates that it is more likely than not that the tax position will be sustained on tax audit assuming that all issues are audited and resolution of any related appeals or litigation processes are considered. The second step is to measure the tax benefit as the largest amount that is more than 50% likely to be realized upon settlement. Although we believe we have adequately reserved for our uncertain tax positions, no assurance can be given with respect to the final outcome of such matters. We adjust reserves for our uncertain tax positions due to changing facts and circumstances, such as the closing of a tax audit, expiration of statutes of limitation on potential assessments or the refinement of an estimate. To the extent that the final outcome of these matters is different than the amounts recorded, such differences will impact our provision for income taxes in the period in which such a determination is made. Our provisions for income taxes include the impact of reserve provisions and changes to reserves that are considered appropriate and also include the related interest and penalties.
Business Combinations
We allocate the purchase price of acquired companies to the assets acquired and liabilities assumed based on their estimated fair values. Goodwill as of the acquisition date is measured as the excess of consideration transferred and the net of the acquisition date fair value of the assets acquired and liabilities assumed. We make significant estimates and assumptions, especially with respect to intangible assets, to estimate the fair value of assets acquired and liabilities assumed. The estimates of fair value are based upon assumptions believed to be reasonable by us, but are inherently uncertain and unpredictable and, therefore, actual results may differ from estimates. As a result, during the measurement period, which may be up to one year from the acquisition date, we
45
Table of Contents
may record adjustments to the fair value of assets acquired and liabilities assumed, with the corresponding offset to goodwill. Upon the conclusion of the measurement period or final determination of the fair value of assets acquired or liabilities assumed, whichever comes first, any subsequent adjustments are recorded to our consolidated statements of operations.
The fair value of asset acquired and liabilities assumed are estimated using various valuation approaches, which include unobservable inputs that reflect our assessment of the assumptions market participants would use to value such assets and liabilities. Significant inputs to estimate the fair value of assets acquired and liabilities assumed include, but are not limited to, discount rates, probability of future cash pay-outs related to contingent consideration, and future expected cash flows from customer contracts, customer lists, acquired developed technologies and patents and brand awareness and market position, as well as assumptions about the period of time the brand will continue to be used in our product portfolio.
In addition, uncertain tax positions and tax related valuation allowances assumed in connection with a business combination are initially estimated as of the acquisition date. We reevaluate these items quarterly and record any adjustments to our preliminary estimates to goodwill provided that we are within the measurement period and we continue to collect information in order to determine their estimated fair values as of the date of acquisition. Subsequent to the measurement period or our final determination of the tax allowance’s or contingency’s estimated value, changes to these uncertain tax positions and tax related valuation allowances will affect our provision for income taxes in our consolidated statement of operations.
RESULTS OF OPERATIONS
YEARS ENDED MAY 31, 2011, 2010, AND 2009
Revenues
| Years ended May 31, | ||||||||||||||||||||||||
| 2011 | Percent of Total Revenues |
2010 | Percent of Total Revenues |
2009 | Percent of Total Revenues |
|||||||||||||||||||
| (dollars in thousands) | ||||||||||||||||||||||||
| Revenues: |
||||||||||||||||||||||||
| Subscription |
$ | 64,539 | 55% | $ | 57,312 | 52% | $ | 55,277 | 54% | |||||||||||||||
| License |
18,189 | 16% | 24,541 | 22% | 15,139 | 15% | ||||||||||||||||||
| Professional services |
33,929 | 29% | 27,717 | 26% | 32,405 | 31% | ||||||||||||||||||
|
|
|
|
|
|
|
|
|
|
|
|
|
|||||||||||||
| Total revenues |
$ | 116,657 | 100% | $ | 109,570 | 100% | $ | 102,821 | 100% | |||||||||||||||
|
|
|
|
|
|
|
|
|
|
|
|
|
|||||||||||||
Total revenues increased by 6% during fiscal year 2011 compared to fiscal year 2010 and 7% during fiscal year 2010 compared to fiscal year 2009. In each of fiscal years 2011, 2010 and 2009, no single customer represented more than 10% of total revenues. Total revenues during fiscal year 2011 were unfavorably impacted by a reduction in license revenue due to the accelerated shift in our business to delivery of our products in the cloud from traditional on-premise licenses. We expect license revenue to continue to decline in fiscal year 2012 as we accelerate our transition to a subscription-based cloud business.
Revenues from customers inside the United States represented approximately 64% of total revenues for fiscal year 2011, 68% of total revenues for fiscal year 2010 and 71% of total revenues for fiscal year 2009. Revenues from customers outside the United States represented approximately 36% of total revenues for fiscal year 2011, 32% of total revenues for fiscal year 2010 and 29% of total revenues for fiscal year 2009. The only country outside the United States in which revenues from customers represented more than 10% of total revenues was the United Kingdom, which represented 15% of total revenues for fiscal year 2011 and fiscal year 2010 and 14% of total revenues for fiscal year 2009.
46
Table of Contents
Subscription Revenue. Subscription revenue increased by $7.2 million, or 13%, during fiscal year 2011 compared to fiscal year 2010. The increase reflects an increase of subscription revenue from new customers and an increase in subscription revenue from existing customers, which includes both renewals and subscription for additional products and users. Subscription revenue increased by $2.1 million, or 4%, during fiscal year 2010 compared to fiscal year 2009. The increase reflects an increase of subscription revenue from new customers as well as an increase in subscription revenue from existing customers, which included both renewals and subscription for additional products and users. If we are successful in offering new customers only cloud-based offerings, we expect subscription revenue to increase in fiscal year 2012.
License Revenue. License revenue decreased by $6.4 million, or 26%, during fiscal year 2011 compared to fiscal year 2010. The decrease in license revenue reflects our customers’ growing preference to use our cloud-based subscription services rather than purchase perpetual licenses. License revenue increased $9.4 million, or 62%, during fiscal year 2010 compared to fiscal year 2009. The increase in license revenue is due to an increase in license sales to both new and existing customers as well as an increase in license sales of our performance and succession products.
Professional Services Revenue. Professional services revenue increased by $6.2 million, or 22%, during fiscal year 2011 compared to fiscal year 2010. The increase was primarily due to an increased demand for our professional services from our expanded customer base. In addition, fiscal year 2011 revenue increased $2.7 million due to the adoption of ASU 2009-13. Professional services revenue decreased $4.7 million, or 15%, during fiscal year 2010 compared to fiscal year 2009. The decrease was primarily due to the recessionary environment experienced in the prior fiscal year and an increase in sales of professional services for Saba products through indirect channels negatively impacting our professional services revenue as services related to these sales are generally provided by our channel partners.
International revenues as a percentage of total revenues and the mix of revenues have varied significantly primarily due to variability in new license sales.
Geographic Information
The following table sets forth revenue information by geographic area as of and for the fiscal years ended May 31, 2011, 2010 and 2009:
| Years ended May 31, | ||||||||||||
| Total Revenue | ||||||||||||
| 2011 | 2010 | 2009 | ||||||||||
| (in thousands) | ||||||||||||
| United States |
$ | 74,401 | $ | 74,282 | $ | 72,602 | ||||||
| United Kingdom |
17,032 | 16,189 | 14,090 | |||||||||
| Rest of the World |
25,224 | 19,099 | 16,129 | |||||||||
|
|
|
|
|
|
|
|||||||
| Total |
$ | 116,657 | $ | 109,570 | $ | 102,821 | ||||||
|
|
|
|
|
|
|
|||||||
47
Table of Contents
Cost of Revenues
| Years ended May 31, | ||||||||||||||||||||||||
| 2011 | Percent of Total Revenues |
2010 | Percent of Total Revenues |
2009 | Percent of Total Revenues |
|||||||||||||||||||
| (dollars in thousands) | ||||||||||||||||||||||||
| Cost of revenues |
||||||||||||||||||||||||
| Cost of subscription |
$ | 16,089 | 14% | $ | 16,439 | 15% | $ | 17,348 | 17% | |||||||||||||||
| Cost of license |
946 | 1% | 897 | 1% | 909 | 1% | ||||||||||||||||||
| Cost of professional services |
25,186 | 21% | 19,477 | 18% | 21,847 | 21% | ||||||||||||||||||
| Amortization of acquired developed technology |
798 | 1% | 1,178 | 1% | 1,178 | 1% | ||||||||||||||||||
|
|
|
|
|
|
|
|
|
|
|
|
|
|||||||||||||
| Total cost of revenues |
$ | 43,019 | 37% | $ | 37,991 | 35% | $ | 41,282 | 40% | |||||||||||||||
|
|
|
|
|
|
|
|
|
|
|
|
|
|||||||||||||
The following table is the summary of gross margin:
| Years ended May 31, | ||||||||||||
| 2011 | 2010 | 2009 | ||||||||||
| (dollars in thousands) | ||||||||||||
| Gross margin: |
||||||||||||
| Subscription |
$ | 48,450 | $ | 40,873 | $ | 37,929 | ||||||
| Percentage of subscription revenue |
75% | 71% | 69% | |||||||||
| License (including amortization of acquired developed technology) |
16,445 | 22,466 | 13,052 | |||||||||
| Percentage of license revenue |
90% | 92% | 86% | |||||||||
| Professional services |
8,743 | 8,240 | 10,558 | |||||||||
| Percentage of professional services revenue |
26% | 30% | 33% | |||||||||
|
|
|
|
|
|
|
|||||||
| Total |
$ | 73,638 | $ | 71,579 | $ | 61,539 | ||||||
|
|
|
|
|
|
|
|||||||
| Percentage of total revenues |
63% | 65% | 60% | |||||||||
Total cost of revenues increased by $5.0 million, or 13%, in fiscal year 2011 when compared to fiscal year 2010 and decreased $3.3 million, or 8%, in fiscal year 2010 when compared to fiscal year 2009.
Cost of Subscription Revenue. Cost of subscription revenue decreased by $0.4 million, or 2%, in fiscal year 2011 compared to fiscal year 2010. The decrease was primarily due to decreases in external hosting fees of $0.5 million. Subscription gross margin increased to 75% in fiscal year 2011 from 71% during fiscal year 2010. The increase in subscription gross margin is primarily the result of decreases in cost associated with providing cloud-based subscription services. Cost of subscription revenue decreased $0.9 million, or 5%, in fiscal year 2010 compared to fiscal year 2009. The decrease was the result of decreases in third party consulting fees of $0.5 million, facilities and allocations related costs of $0.3 million and third party royalties of $0.1 million. Subscription gross margin increased to 71% in fiscal year 2010 from 69% during fiscal year 2009. The increase in subscription gross margin is primarily the result of decreases in cost associated with providing cloud-based subscription services, decreases in salaries and related benefits and decreases in third party consulting fees.
Cost of License Revenue. Cost of license revenue increased by $49,000, or 5%, in fiscal year 2011 compared to fiscal year 2010. License revenue gross margin decreased to 90% in fiscal year 2011 from 92% in fiscal year 2010. This decrease in license revenue gross margin was primarily the result of a decrease in license revenue relative to the generally fixed cost of license revenue. Cost of license revenue decreased by $12,000, or 1%, in fiscal year 2010 compared to fiscal year 2009. License revenue gross margin increased to 92% in fiscal year 2010 from 86% in fiscal year 2009. This increase was primarily the result of an increase in license revenue relative to the generally fixed cost of license revenue.
48
Table of Contents
Cost of Professional Services Revenue. Cost of professional services increased by $5.7 million, or 29%, in fiscal year 2011 compared to fiscal year 2010. The increase was primarily attributable to increases in salaries and related benefits of $3.6 million and third party labor of $1.5 million. The professional services gross margin decreased to 26% in fiscal year 2011 compared to 30% in fiscal year 2010. The decrease in gross margin is primarily due to a disproportionate increase in professional services costs as compared to the increase in professional services revenue primarily due to higher salaries and benefit costs compared to the revenue increase. Cost of professional services decreased by $2.4 million, or 11%, in fiscal year 2010 compared to fiscal year 2009. The decrease was attributable to decreases in third party labor of $1.9 million, salaries and related benefits of $0.3 million and facilities and telecom allocations of $0.2 million. The professional services gross margin decreased to 30% in fiscal year 2010 compared to 33% in fiscal year 2009. The decrease in gross margin is primarily due to a smaller decrease in professional services costs as compared to the decrease in professional services revenue.
Amortization of acquired developed technology. The amortization of acquired developed technology is comprised of the ratable amortization of technological assets acquired in our acquisition of Centra in 2006 and Pedagogue and Comartis in 2011. We amortize the cost of these assets over a period of five years. Amortization expense was $0.8 million in fiscal year 2011 and $1.2 million in each year of fiscal 2010 and 2009. The decrease in amortization of acquired developed technology is primarily due to the Centra acquired technological assets becoming fully amortized in the third quarter of fiscal 2011.
Operating Expenses
| Years ended May 31, | ||||||||||||||||||||||||||||||||||||||||
| 2011 | 2010 | 2009 | ||||||||||||||||||||||||||||||||||||||
| As Reported |
Percent of Total Revenue |
As Previously Reported |
Adjustment (1) |
As Reported |
Percent of Total Revenue |
As Previously Reported |
Adjustment (1) |
As Reported |
Percent of Total Revenue |
|||||||||||||||||||||||||||||||
| (dollars in thousands) | ||||||||||||||||||||||||||||||||||||||||
| Operating expenses: |
||||||||||||||||||||||||||||||||||||||||
| Research and development |
$ | 18,494 | 16% | $ | 17,787 | $ | — | $ | 17,787 | 16% | $ | 17,380 | $ | — | $ | 17,380 | 17% | |||||||||||||||||||||||
| Sales and marketing |
43,705 | 37% | 33,405 | 128 | 33,533 | 31% | 26,405 | 156 | 26,561 | 26% | ||||||||||||||||||||||||||||||
| General and administrative |
14,982 | 13% | 14,470 | — | 14,470 | 13% | 15,200 | — | 15,200 | 15% | ||||||||||||||||||||||||||||||
| Restructuring |
— | —% | (38 | ) | — | (38 | ) | 0% | 539 | — | 539 | 1% | ||||||||||||||||||||||||||||
| Amortization of purchased intangible assets |
2,508 | 2% | 2,538 | — | 2,538 | 2% | 2,538 | — | 2,538 | 2% | ||||||||||||||||||||||||||||||
|
|
|
|
|
|
|
|
|
|
|
|
|
|
|
|
|
|
|
|
|
|||||||||||||||||||||
| Total operating expenses |
$ | 79,689 | 68% | $ | 68,162 | $ | 128 | $ | 68,290 | 62% | $ | 62,062 | $ | 156 | $ | 62,218 | 61% | |||||||||||||||||||||||
|
|
|
|
|
|
|
|
|
|
|
|
|
|
|
|
|
|
|
|
|
|||||||||||||||||||||
| (1) | Certain amounts have been adjusted for the retrospective change in accounting principle for sales commissions. (See Note 2 in Item 8: “Financial Statements and Supplementary Data—Notes to Consolidated Financial Statements.”) |
We expect operating expenses to increase in fiscal year 2012 due to the full year impact of the acquisitions of Comartis and Pedagogue, as well as increased spending levels in sales and marketing in support of our continued expansion of our sales coverage to align with key growth initiatives.
Research and development. Research and development expenses increased by $0.7 million, or 4%, during fiscal year 2011 compared to fiscal year 2010. The increase was primarily due to increases in salaries and benefits related expenses of $0.6 million, equipment expenses of $0.2 million and employee travel-related expenses of $0.2 million, partially offset by a decrease in third party consulting fees of $0.2 million. Research and development expenses increased by $0.4 million, or 2%, during fiscal year 2010 compared to fiscal year 2009. This increase was primarily due to increases in salaries and related expenses of $0.4 million, an increase in recruiting expenses of $0.2 million partially offset by decreases in facilities and internal information technology related costs of $0.1 million and third party consulting fee of $0.1 million.
Sales and marketing. Sales and marketing expenses increased by $10.2 million, or 30%, during fiscal year 2011 compared to fiscal year 2010. The increase in sales and marketing expenses in fiscal year 2011 was attributable to increases in salaries and benefits related expenses of $5.9 million, marketing relates expenses of $2.2 million,
49
Table of Contents
employee-related travel expenses of $1.1 million, recruiting fees of $0.5 million and facilities and allocations expenses of $0.4 million. These increases reflect our plan to expand our sales coverage and marketing support to align with key growth initiatives which we expect will continue in fiscal year 2012. Sales and marketing expenses increased by approximately $7.0 million, or 26%, during fiscal year 2010 compared to fiscal year 2009. The increase in sales and marketing expenses in fiscal year 2010 was attributable to increases in salaries and benefits related expenses of $4.4 million, third party consulting fees of $0.9 million, marketing related expenses of $0.8 million, recruiting expenses of $0.4 million, conferences and meetings expenses of $0.3 million and facilities related expenses of $0.2 million. These increases reflect our plan to expand our sales coverage and marketing support to align with key growth initiatives.
General and administrative. General and administrative expenses increased by $0.5 million, or 4%, during fiscal year 2011 compared to fiscal year 2010. This increase was primarily due to expenses incurred in connection with the acquisitions of Comartis and Pedagogue. General and administrative expenses decreased $0.7 million, or 5%, during fiscal year 2010 compared to fiscal year 2009. This decrease was primarily due to a decrease in accounting and tax fees of $0.4 million and legal fees of $0.4 million, partially offset by increases in recruiting expenses of $0.1 million.
Amortization of purchased intangible assets. Amortization of purchased intangible assets totaled $2.5 million in fiscal years 2011, 2010, and fiscal 2009. Future amortization expense is currently expected to be $2.4 million in fiscal year 2012, $0.6 million in fiscal 2013 and $0.6 million thereafter. We review our intangible assets at least annually and the estimated remaining useful lives of our intangible assets for impairment. Any impairment or reduction in our estimate of remaining useful lives could result in increased amortization expense in future periods.
Interest income and other, net
Interest income and other, net consists of interest income and other non-operating expenses, including foreign currency exchange gains or losses. Interest income and other, net decreased by $0.6 million to an expense of $0.5 million in fiscal year 2011 from an income of $0.1 million in fiscal year 2010. This decrease compared to the prior year was attributable to a decrease in foreign currency losses of $0.5 million and a decrease in income on certain foreign denominated transactions of $0.1 million. Interest income and other, net increased by $68,000 to $123,000 in fiscal year 2010 from $55,000 in fiscal year 2009. This increase compared to the prior year was attributable to a decrease in income on certain foreign denominated transactions of $0.1 million, partially offset by an increase in foreign currency losses of $0.2 million.
Provision for income taxes
From inception to May 31, 2007, we incurred net losses for federal and state tax purposes. Income tax expense from inception to May 31, 2011 includes United States deferred and foreign income taxes and also a provision for federal alternative minimum tax, state income taxes and usage of net operating losses in acquisitions. We recorded income tax expense of approximately $0.8 million in fiscal year 2011, $0.6 million in fiscal year 2010 and $1.9 million in fiscal year 2009.
We have recorded a valuation allowance for the full amount of the net United States deferred tax assets, as we believe it is more likely than not that the deferred tax assets will not be realized.
50
Table of Contents
DEFERRED REVENUES
Deferred revenues consisted of the following:
| May 31, | ||||||||
| 2011 | 2010 | |||||||
| (in thousands) | ||||||||
| Subscription |
$ | 42,688 | $ | 32,985 | ||||
| Professional services |
3,046 | 3,610 | ||||||
| Licenses |
49 | 399 | ||||||
|
|
|
|
|
|||||
| Total deferred revenues |
$ | 45,783 | $ | 36,994 | ||||
|
|
|
|
|
|||||
| Deferred revenues, current |
$ | 42,513 | $ | 34,435 | ||||
| Deferred revenues, non-current |
3,270 | 2,559 | ||||||
|
|
|
|
|
|||||
| Total deferred revenues |
$ | 45,783 | $ | 36,994 | ||||
|
|
|
|
|
|||||
Deferred subscription revenue includes deferred software license updates and product support revenue as well as deferred revenue from products made available in the cloud. Deferred subscription revenue represents contracts for which cash has been received plus billings for which the service has started but cash has not been received. Subscription contracts are typically billed on a per annum basis in advance and revenues are recognized ratably over the subscription period. Deferred professional services revenues include amounts invoiced for consulting and educational services, which have not yet been delivered. In addition, deferred professional services revenue includes amounts invoiced for services that have been delivered, but are not separable from cloud-based subscriptions. Revenues for services that are not separable from cloud-based subscriptions are deferred until performance has been completed and then recognized ratably over the longest period of the arrangement. Deferred revenues from new software licenses typically result from undelivered products or specified enhancements, term license agreements that are recognized over the related term, customer specific acceptance provisions, and software license transactions that cannot be segmented from consulting services or certain extended payment term arrangements. Our deferred revenue is generally at its lowest annual levels at the end of the first and second fiscal quarters. We have disproportionately higher levels of subscription renewal billing, during our third and fourth fiscal quarters.
KEY OPERATING METRICS
Billing and Renewal Rates
We track operating metrics for invoicing, which represents our total billings, and renewal rates for subscription services. We invoiced $127.5 million for the fiscal year ended May 31, 2011, compared to $116.0 million for the fiscal year ended May 31, 2010. Our subscription renewal rate on a dollar basis was 89% for the fiscal year ended May 31, 2011 compared to 93% for the fiscal year ended May 31, 2010.
QUARTERLY RESULTS OF OPERATIONS
The following table sets forth condensed consolidated statement of operations data for each of the eight quarters in the two-year period ended May 31, 2011. This information has been derived from our unaudited condensed consolidated financial statements that, in the opinion of management, include all adjustments, consisting only of normal recurring adjustments and changes in accounting principles adopted by us during the year ended May 31, 2011, necessary for a fair presentation of this information. This information should be read in conjunction with our audited consolidated financial statements and related notes appearing elsewhere in this Annual Report on Form 10-K.
We have experienced and expect to continue to experience fluctuations in operating results from quarter to quarter. For example, in fiscal 2012, net losses are anticipated to be higher in the early part of the fiscal year as
51
Table of Contents
we accelerate toward a subscription based model. As subscription revenues grow, we expect a substantial reduction in second half net losses compared to the first half. No conclusions should be drawn about our future results based on the results of operations for any quarter, as quarterly results are not necessarily indicative of results for a full fiscal year or any other period.
| Three months ended | ||||||||||||||||||||||||||||||||||
| May 31, 2011 |
Feb 28, 2011 |
Nov 30, 2010 |
Aug 31, 2010 |
May 31, 2010 |
Feb 28, 2010 |
Nov 30, 2009 |
Aug 31, 2009 |
|||||||||||||||||||||||||||
| As Adjusted (1) |
As Adjusted (1) |
As Adjusted (1) |
As Adjusted (1) |
As Adjusted (1) |
As Adjusted (1) |
|||||||||||||||||||||||||||||
| (in thousands, except per share data) | ||||||||||||||||||||||||||||||||||
| Revenues: |
||||||||||||||||||||||||||||||||||
| Subscription |
$ | 17,301 | $ | 16,739 | $ | 15,604 | $ | 14,894 | $ | 14,866 | $ | 14,333 | $ | 14,135 | $ | 13,978 | ||||||||||||||||||
| License |
3,931 | 4,994 | 4,814 | 4,450 | 6,962 | 5,515 | 6,352 | 5,712 | ||||||||||||||||||||||||||
| Professional services |
8,695 | 8,612 | 8,774 | 7,849 | 7,789 | 6,812 | 6,995 | 6,121 | ||||||||||||||||||||||||||
|
|
|
|
|
|
|
|
|
|
|
|
|
|
|
|
|
|||||||||||||||||||
| Total revenues |
29,927 | 30,345 | 29,192 | 27,193 | 29,617 | 26,660 | 27,482 | 25,811 | ||||||||||||||||||||||||||
|
|
|
|
|
|
|
|
|
|
|
|
|
|
|
|
|
|||||||||||||||||||
| Cost of revenues |
11,509 | 10,989 | 10,339 | 10,183 | 9,825 | 9,631 | 9,434 | 9,102 | ||||||||||||||||||||||||||
|
|
|
|
|
|
|
|
|
|
|
|
|
|
|
|
|
|||||||||||||||||||
| Gross profit |
18,418 | 19,356 | 18,853 | 17,010 | 19,792 | 17,029 | 18,048 | 16,709 | ||||||||||||||||||||||||||
| Operating expenses: |
||||||||||||||||||||||||||||||||||
| Research and development |
5,105 | 4,530 | 4,436 | 4,423 | 4,232 | 4,609 | 4,725 | 4,222 | ||||||||||||||||||||||||||
| Sales and marketing |
12,773 | 10,033 | 11,052 | 9,846 | 10,361 | 7,734 | 8,572 | 6,866 | ||||||||||||||||||||||||||
| General and administrative |
4,289 | 3,862 | 3,419 | 3,412 | 3,485 | 3,530 | 3,613 | 3,843 | ||||||||||||||||||||||||||
| Restructuring |
— | — | — | — | — | — | (2 | ) | (37 | ) | ||||||||||||||||||||||||
| Amortization of purchased intangible assets |
618 | 621 | 634 | 634 | 634 | 634 | 634 | 634 | ||||||||||||||||||||||||||
|
|
|
|
|
|
|
|
|
|
|
|
|
|
|
|
|
|||||||||||||||||||
| Total operating expenses |
22,785 | 19,046 | 19,541 | 18,315 | 18,712 | 16,507 | 17,542 | 15,528 | ||||||||||||||||||||||||||
|
|
|
|
|
|
|
|
|
|
|
|
|
|
|
|
|
|||||||||||||||||||
| Income (loss) from operations |
(4,367 | ) | 310 | (688 | ) | (1,305 | ) | 1,080 | 522 | 506 | 1,181 | |||||||||||||||||||||||
| Interest and other income (expense), net |
(198 | ) | (196 | ) | 166 | (225 | ) | 138 | (48 | ) | 54 | (22 | ) | |||||||||||||||||||||
| Interest expense |
(5 | ) | 3 | (2 | ) | (2 | ) | (1 | ) | (1 | ) | (2 | ) | (3 | ) | |||||||||||||||||||
|
|
|
|
|
|
|
|
|
|
|
|
|
|
|
|
|
|||||||||||||||||||
| Income (loss) before provision for income taxes |
(4,570 | ) | 117 | (524 | ) | (1,532 | ) | 1,217 | 473 | 558 | 1,156 | |||||||||||||||||||||||
| (Provision for) benefit from income taxes |
190 | (126 | ) | (272 | ) | (165 | ) | (443 | ) | (44 | ) | 62 | (214 | ) | ||||||||||||||||||||
|
|
|
|
|
|
|
|
|
|
|
|
|
|
|
|
|
|||||||||||||||||||
| Net income (loss) |
$ | (4,760 | ) | $ | (9 | ) | $ | (796 | ) | $ | (1,697 | ) | $ | 774 | $ | 429 | $ | 620 | $ | 942 | ||||||||||||||
|
|
|
|
|
|
|
|
|
|
|
|
|
|
|
|
|
|||||||||||||||||||
| Basic net income (loss) per share |
$ | (0.17 | ) | $ | (0.00 | ) | $ | (0.03 | ) | $ | (0.06 | ) | $ | 0.03 | $ | 0.02 | $ | 0.02 | $ | 0.03 | ||||||||||||||
|
|
|
|
|
|
|
|
|
|
|
|
|
|
|
|
|
|||||||||||||||||||
| Diluted net income (loss) per share |
$ | (0.17 | ) | $ | (0.00 | ) | $ | (0.03 | ) | $ | (0.06 | ) | $ | 0.03 | $ | 0.02 | $ | 0.02 | $ | 0.03 | ||||||||||||||
|
|
|
|
|
|
|
|
|
|
|
|
|
|
|
|
|
|||||||||||||||||||
| Shares used in computing basic net income (loss) per share |
28,248 | 28,260 | 28,197 | 28,151 | 28,048 | 27,922 | 27,851 | 29,220 | ||||||||||||||||||||||||||
|
|
|
|
|
|
|
|
|
|
|
|
|
|
|
|
|
|||||||||||||||||||
| Shares used in computing diluted net income (loss) per share |
28,248 | 28,260 | 28,197 | 28,151 | 29,324 | 29,043 | 28,855 | 29,833 | ||||||||||||||||||||||||||
|
|
|
|
|
|
|
|
|
|
|
|
|
|
|
|
|
|||||||||||||||||||
| (1) | Certain amounts have been adjusted for the retrospective change in accounting principle for sales commissions and the adoption of the new accounting standard for multiple-element revenue arrangements effective June 1, 2010. (See Note 2 in Item 8: “Financial Statements and Supplementary Data—Notes to Consolidated Financial Statements.”) |
52
Table of Contents
The following tables provide account balances impacted by retrospective change in accounting for sales commissions and the adoption of the new accounting standard for multiple-element revenue arrangements effective June 1, 2010, including the amount of the change from balances previously reported for fiscal years 2011 and 2010.
Fiscal 2011
| 2011 Three months ended |
||||||||||||||||||||||||||||||||
| November 30, 2010 | August 31, 2010 | |||||||||||||||||||||||||||||||
| As Previously Reported |
Impact of Commission Adjustments |
Impact of Revenue Adjustments |
As Adjusted |
As Previously Reported |
Impact of Commission Adjustments |
Impact of Revenue Adjustments |
As Adjusted |
|||||||||||||||||||||||||
| (in thousands, except per share data) | ||||||||||||||||||||||||||||||||
| Consolidated Statement of Operations |
||||||||||||||||||||||||||||||||
| Revenue |
$ | 28,562 | $ | — | $ | 630 | $ | 29,192 | $ | 26,814 | $ | — | $ | 379 | $ | 27,193 | ||||||||||||||||
| Sales and marketing |
11,200 | (148 | ) | — | 11,052 | 9,869 | (23 | ) | — | 9,846 | ||||||||||||||||||||||
| Income (loss) from operations |
(1,031 | ) | 148 | 195 | (688 | ) | (1,412 | ) | 23 | 84 | (1,305 | ) | ||||||||||||||||||||
| Net income (loss) |
$ | (1,139 | ) | $ | 148 | $ | 195 | $ | (796 | ) | $ | (1,804 | ) | $ | 23 | $ | 84 | $ | (1,697 | ) | ||||||||||||
|
|
|
|
|
|
|
|
|
|
|
|
|
|
|
|
|
|||||||||||||||||
| Basic net income (loss) per share |
$ | (0.04 | ) | $ | (0.00 | ) | $ | 0.01 | $ | (0.03 | ) | $ | (0.06 | ) | $ | 0.00 | $ | 0.00 | $ | (0.06 | ) | |||||||||||
|
|
|
|
|
|
|
|
|
|
|
|
|
|
|
|
|
|||||||||||||||||
| Diluted net income (loss) per share |
$ | (0.04 | ) | $ | (0.00 | ) | $ | 0.01 | $ | (0.03 | ) | $ | (0.06 | ) | $ | 0.00 | $ | 0.00 | $ | (0.06 | ) | |||||||||||
|
|
|
|
|
|
|
|
|
|
|
|
|
|
|
|
|
|||||||||||||||||
| Shares used in computing basic net income (loss) per share |
28,197 | 28,197 | 28,197 | 28,197 | 28,151 | 28,151 | 28,151 | 28,151 | ||||||||||||||||||||||||
|
|
|
|
|
|
|
|
|
|
|
|
|
|
|
|
|
|||||||||||||||||
| Shares used in computing diluted net income (loss) per share |
28,197 | 28,197 | 28,197 | 28,197 | 28,151 | 28,151 | 28,151 | 28,151 | ||||||||||||||||||||||||
|
|
|
|
|
|
|
|
|
|
|
|
|
|
|
|
|
|||||||||||||||||
Fiscal 2010
| 2010 Three months ended |
||||||||||||||||||||||||||||||||||||||||||||||||
| May 31, 2010 | February 28, 2010 | November 30, 2009 | August 31, 2009 | |||||||||||||||||||||||||||||||||||||||||||||
| As Previously Reported |
Impact
of Commission Adjust- ments |
As Adjusted |
As Previously Reported |
Impact
of Commission Adjust- ments |
As Adjusted |
As Previously Reported |
Impact
of Commission Adjust- ments |
As Adjusted |
As Previously Reported |
Impact
of Commission Adjust- ments |
As Adjusted |
|||||||||||||||||||||||||||||||||||||
| (in thousands, except per share data) | ||||||||||||||||||||||||||||||||||||||||||||||||
| Consolidated Statement of Operations |
||||||||||||||||||||||||||||||||||||||||||||||||
| Sales and marketing |
$ | 10,358 | $ | 3 | $ | 10,361 | $ | 7,733 | $ | 1 | $ | 7,734 | $ | 8,526 | $ | 46 | $ | 8,572 | $ | 6,788 | $ | 78 | $ | 6,866 | ||||||||||||||||||||||||
| Income (loss) from operations |
1,083 | (3 | ) | 1,080 | 523 | (1 | ) | 522 | 552 | (46 | ) | 506 | 1,259 | (78 | ) | 1,181 | ||||||||||||||||||||||||||||||||
| Net income (loss) |
$ | 777 | $ | (3 | ) | $ | 774 | $ | 430 | $ | (1 | ) | $ | 429 | $ | 666 | $ | (46 | ) | $ | 620 | $ | 1,020 | $ | (78 | ) | $ | 942 | ||||||||||||||||||||
|
|
|
|
|
|
|
|
|
|
|
|
|
|
|
|
|
|
|
|
|
|
|
|
|
|||||||||||||||||||||||||
| Basic net income (loss) per share |
$ | 0.03 | $ | (0.00 | ) | $ | 0.03 | $ | 0.02 | $ | (0.00 | ) | $ | 0.02 | $ | 0.02 | $ | (0.00 | ) | $ | 0.02 | $ | 0.03 | $ | (0.00 | ) | $ | 0.03 | ||||||||||||||||||||
|
|
|
|
|
|
|
|
|
|
|
|
|
|
|
|
|
|
|
|
|
|
|
|
|
|||||||||||||||||||||||||
| Diluted net income (loss) per share |
$ | 0.03 | $ | (0.00 | ) | $ | 0.03 | $ | 0.01 | $ | (0.00 | ) | $ | 0.01 | $ | 0.02 | $ | (0.00 | ) | $ | 0.02 | $ | 0.03 | $ | (0.00 | ) | $ | 0.03 | ||||||||||||||||||||
|
|
|
|
|
|
|
|
|
|
|
|
|
|
|
|
|
|
|
|
|
|
|
|
|
|||||||||||||||||||||||||
| Shares used in computing basic net income (loss) per share |
28,048 | 28,048 | 28,048 | 27,922 | 27,922 | 27,922 | 27,851 | 27,851 | 27,851 | 29,220 | 29,220 | 29,220 | ||||||||||||||||||||||||||||||||||||
|
|
|
|
|
|
|
|
|
|
|
|
|
|
|
|
|
|
|
|
|
|
|
|
|
|||||||||||||||||||||||||
| Shares used in computing diluted net income (loss) per share |
29,324 | 29,324 | 29,324 | 29,043 | 29,043 | 29,043 | 28,855 | 28,855 | 28,855 | 29,833 | 29,833 | 29,833 | ||||||||||||||||||||||||||||||||||||
|
|
|
|
|
|
|
|
|
|
|
|
|
|
|
|
|
|
|
|
|
|
|
|
|
|||||||||||||||||||||||||
53
Table of Contents
Our results of operations could vary significantly from quarter to quarter. If revenues fall below our expectations, we may not be able to reduce our spending rapidly in response to the revenue shortfall and operating losses may increase. We anticipate that we will continue to experience long sales cycles. Therefore, the timing of future customer contracts could be difficult to predict, making it difficult to estimate revenues for future quarters.
Factors that could affect our quarterly operating results are described under the caption Item 1A: “Risk Factors.”
LIQUIDITY AND CAPITAL RESOURCES
| Years ended May 31, | ||||||||||||
| 2011 | 2010 (As Adjusted) (1) |
2009 (As Adjusted) (1) |
||||||||||
| (in thousands) | ||||||||||||
| Net cash provided by operating activities |
$ | 3,965 | $ | 11,745 | $ | 12,690 | ||||||
| Net cash used in investing activities |
(8,908 | ) | (792 | ) | (2,071 | ) | ||||||
| Net cash used in financing activities |
(2,365 | ) | (4,448 | ) | (299 | ) | ||||||
| Effect of exchange rate changes on cash and cash equivalents |
1,246 | (481 | ) | (967 | ) | |||||||
| (1) | Certain amounts have been adjusted for the retrospective change in accounting principle for sales commissions. (See Note 2 in Item 8: “Financial Statements and Supplementary Data—Notes to Consolidated Financial Statements.”) |
We have funded our operations through operating activities and our most significant source of operating cash flows stems from customer purchases of our subscription services, professional services and licenses. Our primary uses of cash from operating activities are for personnel and facilities related expenditures. As of May 31, 2011, we had $25.9 million in available cash and cash equivalents.
Cash Provided By Operating Activities
Cash provided by operating activities was $4.0 million in fiscal 2011 compared to cash provided by operating activities of $11.7 million in fiscal 2010. The $7.7 million decrease in fiscal 2011 was primarily attributable to the $10.0 million increase in net loss for the year ended May 31, 2011, increased cash flow due to the reduction of compensation and other accruals of $3.1 million and an increase in prepaid expenses of $1.7 million. The decrease was partially offset by an increase in deferred revenue of $4.5 million, accounts payable of $1.8 million, a decrease in accounts receivables of $1.2 million and an increase in share-based compensation expense of $1.0 million.
Cash provided by operating activities was $11.7 million in fiscal 2010 compared to cash provided by operating activities of $12.7 million in fiscal 2009. The $1.0 million decrease in fiscal 2010 was primarily attributable to a $0.4 million decrease in cash collections resulting from a $1.6 million lower opening accounts receivable balance for fiscal year 2010, partially offset by $1.2 million in higher collections of fiscal year 2010 billings.
Total accounts receivable billing days outstanding (“BDO”) was 73 days at May 31, 2011 and 68 days at May 31, 2010. The increase in BDO was due to lower collections in the quarter ended May 31, 2011 compared to the same period in the prior year. BDO is calculated using the current quarter total billings divided by number of days in the current period to arrive at average billings per day. The accounts receivable aging balance at the end of the period is then divided by the average billings per day amount to determine the BDO at the end of the period.
Total accounts receivable days sales outstanding (“DSO”), based on a quarter calculation, was 86 days at May 31, 2011 and 76 days at May 31, 2010. Changes in accounts receivable have a significant impact on our cash flow. Items that can affect our accounts receivable DSO and BDO include: timing of license revenue and the
54
Table of Contents
proportion of that license revenue relative to our other types of revenue, timing of billing of our professional services revenue, contractual payment terms, client payment patterns (including approval or processing delays and cash management) and the effectiveness of our collection efforts.
Cash Used In Investing Activities
Cash used in investing activities of $8.9 million in fiscal 2011, $0.8 million in fiscal 2010 and $2.1 million in fiscal 2009. In fiscal 2011, the net cash used in investing activities was primarily attributable to $7.1 million for the cost of acquisitions, net of cash acquired related to the purchase of Pedagogue and Comartis as well as $1.8 million to purchase additional equipment for use in our operations. In fiscal 2010 and fiscal 2009, the net cash used in investing activities was wholly attributable to the purchases of property and equipment, primarily to enhance our infrastructure necessary to deliver our cloud-based offerings.
Cash Used In Financing Activities
Cash used in financing activities decreased in fiscal 2011 to $2.4 million compared to $4.4 million in fiscal 2010. The decrease was primarily due to an increase of $2.4 million in proceeds from the issuance of common stock compared to prior year, which was partially offset by a decrease of $0.4 million due to a higher stock buyback of $5.4 million compared to the prior year. Cash used in financing activities increased to $4.4 million in fiscal 2010 compared to $0.3 million in fiscal 2009. The increase included a stock buyback of $4.9 million, repurchase of stock to satisfy employee tax withholding obligations on restricted stock units of $0.1 million and repayment of notes payable of $0.3 million, partially offset by a net increase of proceeds from the issuance of common stock of $0.9 million.
Contractual Obligations and Commitments
On November 22, 2010, we entered into a credit agreement with Wells Fargo Bank, National Association (“Wells Fargo”). The agreement provided for a one year $10 million line of credit. The agreement also included a sublimit of up to $4.0 million for letters of credit.
The agreement includes certain covenants with which we must comply during the term of the agreement, including that our minimum cash and cash equivalents balance shall be at all times equal to not less than $15 million (including minimum U.S. cash and cash equivalents balance shall not be less than $10 million), and that at the end of each fiscal quarter net losses after taxes during the four consecutive fiscal quarter period then ended shall be equal to not more than $4 million. We were not in compliance with the covenants as of May 31, 2011. As a result, we would not have been able to borrow on the credit agreement as of May 31, 2011.
The line of credit is secured by all of our personal property other than our intellectual property. The agreement includes certain negative covenants restricting or limiting our ability and our subsidiaries ability to, among other things, incur additional indebtedness, make investments and acquisitions, merge or consolidate with any other entity, and convey, sell, lease, transfer or otherwise dispose of assets. Such restrictions and limitations are subject to usual and customary exceptions contained in credit agreements of this nature.
The agreement also contains usual and customary events of default (subject to certain threshold amounts and grace periods). If an event of default occurs and is continuing, we may be required to repay the obligations under the line of credit prior to the stated maturity date, our ability to continue to borrow under the credit agreement may terminate, and the Bank may be able to foreclose on any or all collateral provided by us or our subsidiaries.
No amounts were borrowed under the credit agreement as of May 31, 2011.
Amended Credit Agreement
On June 27, 2011, we entered into an Amended and Restated Credit Agreement with Wells Fargo (the “Amended Agreement”), which supersedes our prior line of credit, increases the available revolving credit limit to $40 million and extends the term of the line of credit to June 27, 2016. To date, no amounts have been borrowed under the line of credit.
55
Table of Contents
The line of credit is secured by all of our personal property other than our intellectual property. The line of credit also is guaranteed by, and secured by the assets of, our material domestic subsidiaries. The Amended Agreement includes certain covenants with which we must comply during the term of the Amended Agreement, including a minimum EBITDA covenant that applies only if liquidity (defined as cash plus available unused borrowings under the credit line) drops below $15 million. The Amended Agreement also includes certain customary negative covenants.
The Amended Agreement contains usual and customary events of default (subject to certain threshold amounts and grace periods). If an event of default occurs and is continuing, we may be required to repay the obligations under the line of credit prior to the stated maturity date, our ability to continue to borrow under the Amended Agreement may terminate, and the Bank may be able to foreclose on any or all collateral provided by us or our subsidiaries.
We currently anticipate that our available cash resources, combined with cash flows generated from our operating activities will be sufficient to meet our presently anticipated working capital, capital expense and business expansion requirements, for at least the next 12 months. However, we may be required, or seek, to raise additional funds in the future. Our future liquidity and capital requirements will depend on numerous factors, including our future revenues, the timing and extent of spending to support product development efforts and expansion of sales and marketing and general and administrative activities, the success of our existing and new product and service offerings and competing technological and market developments. There can be no assurance that additional funding, if needed, will be available on terms acceptable to us, if at all. In addition, any raising of additional funds could dilute our current stockholders’ ownership interests.
During the year we amended (the “Lease Agreement”) our lease agreement dated as of March 16, 1999, with respect to the office space comprising our corporate headquarters. The Lease Amendment, which became effective as of August 31, 2010, extended the lease termination date from May 31, 2014 to May 31, 2019. The Lease Amendment also amended the base monthly rent payable under the lease from June 1, 2013 through May 31, 2014 to $162,086, and provided that the monthly rent payable under the lease from June 1, 2014 through May 31, 2019 shall begin at $96,768 on June 1, 2014 and thereafter increase annually by approximately $3,000.
During the fiscal quarter ended February 28, 2009, we entered into a non-cancelable three year contract for software services of which $0.2 million remained payable as of May 31, 2011. As of May 31, 2011, except for this three year contract for software services, we did not have any additional significant purchase obligations for goods or services.
The following table summarizes our contractual obligations at May 31, 2011 and the effect these obligations are expected to have on our liquidity and cash flows in future periods.
| Payments due by fiscal year | ||||||||||||||||||||||||||||
| Total | FY 2012 | FY 2013 | FY 2014 | FY 2015 | FY 2016 | Thereafter | ||||||||||||||||||||||
| (in thousands) | ||||||||||||||||||||||||||||
| Contractual obligations: |
||||||||||||||||||||||||||||
| Long-term contract commitment |
$ | 193 | $ | 193 | $ | — | $ | — | $ | — | $ | — | $ | — | ||||||||||||||
| Operating lease obligations |
15,805 | 3,922 | 3,583 | 2,096 | 1,199 | 1,196 | 3,809 | |||||||||||||||||||||
|
|
|
|
|
|
|
|
|
|
|
|
|
|
|
|||||||||||||||
| Total |
$ | 15,998 | $ | 4,115 | $ | 3,583 | $ | 2,096 | $ | 1,199 | $ | 1,196 | $ | 3,809 | ||||||||||||||
|
|
|
|
|
|
|
|
|
|
|
|
|
|
|
|||||||||||||||
Off-Balance Sheet Arrangements
As of May 31, 2011, we did not have any off-balance sheet arrangements as defined in Item 303(a)(4)(ii) of SEC Regulation S-K.
56
Table of Contents
ITEM 7A: QUANTITATIVE AND QUALITATIVE DISCLOSURES ABOUT MARKET RISK
Interest Rate Risk
Our exposure to market risk for changes in interest rates has historically related primarily to our borrowings and investments.
We do not believe that we currently have any material exposure to interest rate risk. Our revolving line of credit commitment termination date is June 27, 2016 and as of May 31, 2011 no amounts were outstanding.
We do not believe that we currently have any material exposure to interest rate risk resulting from our investments. At May 31, 2011, we had available cash and cash equivalents totaling $25.9 million. Of this amount, approximately $7.1 million was invested in money market accounts bearing variable interest rates of between 0.04% and 7.75%. The remainder of our cash and cash equivalents is held in non-interest bearing accounts at several banks. Variable interest rate securities may produce less income than expected if interest rates fall. A 0.5% change in interest rates would not have a material impact on our financial statements.
Foreign Currency Risk
We provide our products and services to customers in the United States, Europe and elsewhere throughout the world. Sales are primarily made in U.S. dollars, and to a lesser extent, British pounds and Euros; however, as we continue to expand our operations, more of our contracts may be denominated in Australian dollars, Canadian dollars, Japanese yen or other foreign currencies. A strengthening of the U.S. dollar could make our products less competitive in foreign markets. We do not use derivative instruments to manage risks associated with foreign currency transactions in order to minimize the impact of changes in foreign currency exchange rates on earnings.
Our exposure to foreign exchange rate fluctuations also arises in part from our intercompany accounts which are typically denominated in the functional currency of our foreign subsidiaries, which is the local currency. When these intercompany accounts are translated into U.S. dollars, they have an impact on our operating results depending upon the movement in foreign currency rates. During the fiscal year ended May 31, 2011, our total realized and unrealized losses due to movements in foreign currencies, primarily British pound, European Union euro, Japanese yen, Indian rupee and Australian dollar, were $0.5 million. As exchange rates vary, these foreign exchange results may vary and adversely or favorably impact operating results. An unfavorable change of 10% in foreign currency rates would not have a material impact on our financial statements. As of May 31, 2011, we did not enter into any foreign currency hedging contracts although we may do so in the future.
57
Table of Contents
ITEM 8: FINANCIAL STATEMENTS AND SUPPLEMENTARY DATA
SABA SOFTWARE, INC.
INDEX TO CONSOLIDATED FINANCIAL STATEMENTS
58
Table of Contents
Report of Independent Registered Public Accounting Firm
The Board of Directors and Stockholders of Saba Software, Inc.
We have audited the accompanying consolidated balance sheets of Saba Software, Inc. as of May 31, 2011 and 2010, and the related consolidated statements of operations, stockholders’ equity, and cash flows for each of the three years in the period ended May 31, 2011. These financial statements are the responsibility of the Company’s management. Our responsibility is to express an opinion on these financial statements based on our audits.
We conducted our audits in accordance with the standards of the Public Company Accounting Oversight Board (United States). Those standards require that we plan and perform the audit to obtain reasonable assurance about whether the financial statements are free of material misstatement. An audit includes examining, on a test basis, evidence supporting the amounts and disclosures in the financial statements. An audit also includes assessing the accounting principles used and significant estimates made by management, as well as evaluating the overall financial statement presentation. We believe that our audits provide a reasonable basis for our opinion.
In our opinion, the financial statements referred to above present fairly, in all material respects, the consolidated financial position of Saba Software, Inc. at May 31, 2011 and 2010, and the consolidated results of its operations and its cash flows for each of the three years in the period ended May 31, 2011, in conformity with U.S. generally accepted accounting principles.
As discussed in Note 2 to the consolidated financial statements, the Company has elected to change its accounting for commissions related to its non-cancellable annual or multi-year SaaS contracts effective for all periods presented and the Company changed its method of accounting for revenue recognition effective June 1, 2010.
We also have audited, in accordance with the standards of the Public Company Accounting Oversight Board (United States), Saba Software, Inc.’s internal control over financial reporting as of May 31, 2011, based on criteria established in Internal Control—Integrated Framework issued by the Committee of Sponsoring Organizations of the Treadway Commission and our report dated August 5, 2011, expressed an unqualified opinion thereon.
/s/ Ernst &Young LLP
Redwood City, California
August 5, 2011
59
Table of Contents
Report of Independent Registered Public Accounting Firm
The Board of Directors and Stockholders of Saba Software, Inc.
We have audited Saba Software Inc’s Internal Control over Financial Reporting as of May 31, 2011, based on criteria established in Internal Control—Integrated Framework issued by the Committee of Sponsoring Organizations of the Treadway Commission (the COSO criteria). Saba Software, Inc.’s management is responsible for maintaining effective internal control over financial reporting, and for its assessment of the effectiveness of internal control over financial reporting included in the accompanying Management’s Report on Internal Control Over Financial Reporting. Our responsibility is to express an opinion on the company’s internal control over financial reporting based on our audit.
We conducted our audit in accordance with the standards of the Public Company Accounting Oversight Board (United States). Those standards require that we plan and perform the audit to obtain reasonable assurance about whether effective internal control over financial reporting was maintained in all material respects. Our audit included obtaining an understanding of internal control over financial reporting, assessing the risk that a material weakness exists, testing and evaluating the design and operating effectiveness of internal control based on the assessed risk, and performing such other procedures as we considered necessary in the circumstances. We believe that our audit provides a reasonable basis for our opinion.
A company’s internal control over financial reporting is a process designed to provide reasonable assurance regarding the reliability of financial reporting and the preparation of financial statements for external purposes in accordance with generally accepted accounting principles. A company’s internal control over financial reporting includes those policies and procedures that (1) pertain to the maintenance of records that, in reasonable detail, accurately and fairly reflect the transactions and dispositions of the assets of the company; (2) provide reasonable assurance that transactions are recorded as necessary to permit preparation of financial statements in accordance with generally accepted accounting principles, and that receipts and expenditures of the company are being made only in accordance with authorizations of management and directors of the company; and (3) provide reasonable assurance regarding prevention or timely detection of unauthorized acquisition, use, or disposition of the company’s assets that could have a material effect on the financial statements.
Because of its inherent limitations, internal control over financial reporting may not prevent or detect misstatements. Also, projections of any evaluation of effectiveness to future periods are subject to the risk that controls may become inadequate because of changes in conditions, or that the degree of compliance with the policies or procedures may deteriorate.
In our opinion, Saba Software, Inc. maintained, in all material respects, effective internal control over financial reporting as of May 31, 2011, based on the COSO criteria.
We also have audited, in accordance with the standards of the Public Company Accounting Oversight Board (United States), the accompanying consolidated balance sheets of Saba Software, Inc. as of May 31, 2011 and 2010, and the related consolidated statements of operations, stockholders’ equity, and cash flows for each of the three years in the period ended May 31, 2011 of Saba Software, Inc. and our report dated August 5, 2011 expressed an unqualified opinion thereon.
/s/ Ernst &Young LLP
Redwood City, California
August 5, 2011
60
Table of Contents
CONSOLIDATED BALANCE SHEETS
(in thousands, except share and per share data)
| May 31, | ||||||||
| 2011 | 2010 | |||||||
| (As Adjusted) (1) | ||||||||
| ASSETS |
||||||||
| Current assets: |
||||||||
| Cash and cash equivalents |
$ | 25,940 | $ | 32,002 | ||||
| Restricted cash |
— | 20 | ||||||
| Accounts receivable, net of allowances for doubtful accounts of $150 at May 31, 2011 and 2010 |
27,676 | 23,352 | ||||||
| Prepaid expenses and other current assets |
3,411 | 2,113 | ||||||
|
|
|
|
|
|||||
| Total current assets |
57,027 | 57,487 | ||||||
| Property and equipment, net |
3,146 | 3,178 | ||||||
| Goodwill |
41,469 | 36,095 | ||||||
| Purchased intangible assets, net |
8,722 | 5,027 | ||||||
| Restricted cash |
437 | 260 | ||||||
| Other assets |
2,774 | 1,921 | ||||||
|
|
|
|
|
|||||
| Total assets |
$ | 113,575 | $ | 103,968 | ||||
|
|
|
|
|
|||||
| LIABILITIES AND STOCKHOLDERS’ EQUITY |
||||||||
| Current liabilities: |
||||||||
| Accounts payable |
$ | 5,886 | $ | 3,218 | ||||
| Accrued compensation and related expenses |
8,008 | 8,069 | ||||||
| Accrued expenses |
5,330 | 2,746 | ||||||
| Deferred revenue |
42,513 | 34,435 | ||||||
| Current portion of debt and lease obligations |
1,219 | 450 | ||||||
|
|
|
|
|
|||||
| Total current liabilities |
62,956 | 48,918 | ||||||
| Deferred revenue |
3,270 | 2,559 | ||||||
| Other long-term liabilities |
3,861 | 1,156 | ||||||
| Accrued rent |
65 | 1,785 | ||||||
|
|
|
|
|
|||||
| Total liabilities |
70,152 | 54,418 | ||||||
| Stockholders’ equity: |
||||||||
| Preferred stock, issuable in series $0.001 par value, 5,000,000 authorized shares at May 31, 2011 and May 31, 2010; none issued or outstanding |
— | — | ||||||
| Common stock, $0.001 par value, 50,000,000 authorized; 29,186,633 shares issued at May 31, 2011 and 28,252,131 shares issued at May 31, 2010 |
29 | 29 | ||||||
| Additional paid-in capital |
261,900 | 255,938 | ||||||
| Treasury stock: 880,288 shares at May 31, 2011 and 121,997 at May 31, 2010. |
(5,701 | ) | (328 | ) | ||||
| Accumulated deficit |
(213,075 | ) | (205,812 | ) | ||||
| Accumulated other comprehensive income (loss) |
270 | (277 | ) | |||||
|
|
|
|
|
|||||
| Total stockholders’ equity |
43,423 | 49,550 | ||||||
|
|
|
|
|
|||||
| Total liabilities and stockholders’ equity |
$ | 113,575 | $ | 103,968 | ||||
|
|
|
|
|
|||||
| (1) | Certain amounts have been adjusted for the retrospective change in accounting principle for sales commissions. (See Note 2 on the Notes to Consolidated Financial Statements.) |
See accompanying Notes to Consolidated Financial Statements.
61
Table of Contents
CONSOLIDATED STATEMENTS OF OPERATIONS
(in thousands, except per share data)
| Years ended May 31, | ||||||||||||
| 2011 | 2010 | 2009 | ||||||||||
| (As Adjusted) (1) | (As Adjusted) (1) | |||||||||||
| Revenues: |
||||||||||||
| Subscription |
$ | 64,539 | $ | 57,312 | $ | 55,277 | ||||||
| License |
18,189 | 24,541 | 15,139 | |||||||||
| Professional services |
33,929 | 27,717 | 32,405 | |||||||||
|
|
|
|
|
|
|
|||||||
| Total revenues |
116,657 | 109,570 | 102,821 | |||||||||
| Cost of revenues: |
||||||||||||
| Subscription |
16,089 | 16,439 | 17,348 | |||||||||
| License |
946 | 897 | 909 | |||||||||
| Professional services |
25,186 | 19,477 | 21,847 | |||||||||
| Amortization of acquired developed technology |
798 | 1,178 | 1,178 | |||||||||
|
|
|
|
|
|
|
|||||||
| Total cost of revenues |
43,019 | 37,991 | 41,282 | |||||||||
|
|
|
|
|
|
|
|||||||
| Gross profit |
73,638 | 71,579 | 61,539 | |||||||||
| Operating expenses: |
||||||||||||
| Research and development |
18,494 | 17,787 | 17,380 | |||||||||
| Sales and marketing |
43,705 | 33,533 | 26,561 | |||||||||
| General and administrative |
14,982 | 14,470 | 15,200 | |||||||||
| Restructuring |
— | (38 | ) | 539 | ||||||||
| Amortization of purchased intangible assets |
2,508 | 2,538 | 2,538 | |||||||||
|
|
|
|
|
|
|
|||||||
| Total operating expenses |
79,689 | 68,290 | 62,218 | |||||||||
|
|
|
|
|
|
|
|||||||
| Income (loss) from operations |
(6,051 | ) | 3,289 | (679 | ) | |||||||
| Interest and other income (expense), net |
(454 | ) | 123 | 55 | ||||||||
| Interest expense |
(5 | ) | (7 | ) | (31 | ) | ||||||
|
|
|
|
|
|
|
|||||||
| Income (loss) before provision for income taxes |
(6,510 | ) | 3,405 | (655 | ) | |||||||
| Provision for income taxes |
(753 | ) | (640 | ) | (1,856 | ) | ||||||
|
|
|
|
|
|
|
|||||||
| Net income (loss) |
$ | (7,263 | ) | $ | 2,765 | $ | (2,511 | ) | ||||
|
|
|
|
|
|
|
|||||||
| Basic net income (loss) per share |
$ | (0.26 | ) | $ | 0.10 | $ | (0.09 | ) | ||||
|
|
|
|
|
|
|
|||||||
| Diluted net income (loss) per share |
$ | (0.26 | ) | $ | 0.09 | $ | (0.09 | ) | ||||
|
|
|
|
|
|
|
|||||||
| Shares used in computing basic net income (loss) per share |
28,214 | 28,263 | 29,174 | |||||||||
|
|
|
|
|
|
|
|||||||
| Shares used in computing diluted net income (loss) per share |
28,214 | 29,293 | 29,174 | |||||||||
|
|
|
|
|
|
|
|||||||
| (1) | Certain amounts have been adjusted for the retrospective change in accounting principle for sales commissions. (See Note 2 on the Notes to Consolidated Financial Statements.) |
See accompanying Notes to Consolidated Financial Statements.
62
Table of Contents
CONSOLIDATED STATEMENTS OF STOCKHOLDERS’ EQUITY
(in thousands)
| Preferred Stock | Common Stock | Additional Paid in Capital |
Treasury Stock | Accumulated Deficit (As Adjusted) (1) |
Accumulated Other Comprehensive Income (Loss) |
Total Stockholders Equity (As Adjusted) (1) |
||||||||||||||||||||||||||||||||||
| Shares | Amount | Shares | Amount | Shares | Amount | |||||||||||||||||||||||||||||||||||
| Balance at May 31, 2008 |
— | $ | — | 29,227,656 | $ | 30 | $ | 255,637 | (102,997 | ) | $ | (232 | ) | $ | (206,066 | ) | $ | (72 | ) | $ | 49,297 | |||||||||||||||||||
| Issuance of common stock under employee stock purchase plan |
— | — | 72,492 | — | 150 | — | — | — | — | 150 | ||||||||||||||||||||||||||||||
| Share-based compensation |
— | — | — | — | 2,341 | — | — | — | — | 2,341 | ||||||||||||||||||||||||||||||
| Net loss |
— | — | — | — | — | — | — | (2,511 | ) | — | (2,511 | ) | ||||||||||||||||||||||||||||
| Foreign currency translation adjustments |
— | — | — | — | — | — | — | — | (59 | ) | (59 | ) | ||||||||||||||||||||||||||||
|
|
|
|||||||||||||||||||||||||||||||||||||||
| Comprehensive loss |
— | — | — | — | — | — | — | — | — | (2,570 | ) | |||||||||||||||||||||||||||||
|
|
|
|
|
|
|
|
|
|
|
|
|
|
|
|
|
|
|
|
|
|||||||||||||||||||||
| Balance at May 31, 2009 |
— | — | 29,300,148 | 30 | 258,128 | (102,997 | ) | (232 | ) | (208,577 | ) | (131 | ) | 49,218 | ||||||||||||||||||||||||||
| Issuance of common stock in connection with exercise of stock options |
— | — | 221,573 | 0 | 762 | — | — | — | — | 762 | ||||||||||||||||||||||||||||||
| Issuance of common stock under employee stock purchase plan |
— | — | 64,013 | 0 | 108 | — | — | — | — | 108 | ||||||||||||||||||||||||||||||
| Repurchase of common stock |
— | — | (1,384,920 | ) | (1 | ) | (4,846 | ) | (19,000 | ) | (96 | ) | — | — | (4,943 | ) | ||||||||||||||||||||||||
| Issuance of common stock net of repurchase of stock to satisfy employee tax withholding obligations |
— | — | 51,317 | — | (140 | ) | — | — | — | — | (140 | ) | ||||||||||||||||||||||||||||
| Share-based compensation |
— | — | — | — | 1,908 | — | — | — | — | 1,908 | ||||||||||||||||||||||||||||||
| Stock option excess income tax benefit |
— | — | — | — | 18 | — | — | — | — | 18 | ||||||||||||||||||||||||||||||
| Net income |
— | — | — | — | — | — | — | 2,765 | — | 2,765 | ||||||||||||||||||||||||||||||
| Foreign currency translation adjustments |
— | — | — | — | — | — | — | — | (146 | ) | (146 | ) | ||||||||||||||||||||||||||||
|
|
|
|||||||||||||||||||||||||||||||||||||||
| Comprehensive loss |
— | — | — | — | — | — | — | — | — | 2,619 | ||||||||||||||||||||||||||||||
|
|
|
|
|
|
|
|
|
|
|
|
|
|
|
|
|
|
|
|
|
|||||||||||||||||||||
| Balance at May 31, 2010 |
— | — | 28,252,131 | 29 | 255,938 | (121,997 | ) | (328 | ) | (205,812 | ) | (277 | ) | 49,550 | ||||||||||||||||||||||||||
| Issuance of common stock in connection with exercise of stock options |
— | — | 772,925 | 1 | 3,119 | — | — | — | — | 3,120 | ||||||||||||||||||||||||||||||
| Issuance of common stock under employee stock purchase plan |
— | — | 73,749 | — | 169 | — | — | — | — | 169 | ||||||||||||||||||||||||||||||
| Repurchase of common stock |
— | — | — | (1 | ) | — | (758,291 | ) | (5,373 | ) | — | — | (5,374 | ) | ||||||||||||||||||||||||||
| Issuance of common stock net of repurchase of stock to satisfy employee tax withholding obligations |
— | — | 87,828 | — | (319 | ) | — | — | — | — | (319 | ) | ||||||||||||||||||||||||||||
| Share-based compensation |
— | — | — | — | 2,954 | — | — | — | — | 2,954 | ||||||||||||||||||||||||||||||
| Stock option excess income tax benefit |
— | — | — | — | 39 | — | — | — | — | 39 | ||||||||||||||||||||||||||||||
| Net loss |
— | — | — | — | — | — | — | (7,263 | ) | — | (7,263 | ) | ||||||||||||||||||||||||||||
| Foreign currency translation adjustments |
— | — | — | — | — | — | — | — | 547 | 547 | ||||||||||||||||||||||||||||||
|
|
|
|||||||||||||||||||||||||||||||||||||||
| Comprehensive loss |
— | — | — | — | — | — | — | — | — | (6,716 | ) | |||||||||||||||||||||||||||||
|
|
|
|
|
|
|
|
|
|
|
|
|
|
|
|
|
|
|
|
|
|||||||||||||||||||||
| Balance at May 31, 2011 |
— | $ | — | 29,186,633 | $ | 29 | $ | 261,900 | (880,288 | ) | $ | (5,701 | ) | $ | (213,075 | ) | $ | 270 | $ | 43,423 | ||||||||||||||||||||
|
|
|
|
|
|
|
|
|
|
|
|
|
|
|
|
|
|
|
|
|
|||||||||||||||||||||
| (1) | Certain amounts have been adjusted for the retrospective change in accounting principle for sales commissions. (See Note 2 on the Notes to Consolidated Financial Statements.) |
See accompanying Notes to Consolidated Financial Statements
63
Table of Contents
CONSOLIDATED STATEMENTS OF CASH FLOWS
(in thousands)
| Years ended May 31, | ||||||||||||
| 2011 | 2010 | 2009 | ||||||||||
| (As Adjusted) (1) | (As Adjusted) (1) | |||||||||||
| Operating activities: |
||||||||||||
| Net income (loss) |
$ | (7,263 | ) | $ | 2,765 | $ | (2,511 | ) | ||||
| Adjustments to reconcile net income (loss) to net cash provided by operating activities: |
||||||||||||
| Depreciation and amortization |
2,150 | 2,386 | 2,422 | |||||||||
| Amortization of purchased intangible assets |
3,306 | 3,716 | 3,716 | |||||||||
| Non-cash adjustment to goodwill |
— | — | 1,613 | |||||||||
| Share-based compensation |
2,954 | 1,908 | 2,341 | |||||||||
| Stock option excess income tax benefit |
— | (18 | ) | — | ||||||||
| Loss on disposal of property and equipment |
(13 | ) | (67 | ) | — | |||||||
| Changes in operating assets and liabilities: |
||||||||||||
| Accounts receivable |
(2,767 | ) | (3,956 | ) | 1,294 | |||||||
| Prepaid expenses and other current assets |
(1,098 | ) | 597 | 697 | ||||||||
| Other assets |
(22 | ) | (272 | ) | (18 | ) | ||||||
| Accounts payable |
2,416 | 606 | (1,283 | ) | ||||||||
| Accrued compensation and related expenses |
(687 | ) | 2,460 | 290 | ||||||||
| Accrued expenses |
(599 | ) | (236 | ) | (623 | ) | ||||||
| Deferred revenue |
6,878 | 2,377 | 4,919 | |||||||||
| Restricted cash |
(146 | ) | — | — | ||||||||
| Accrued rent |
(1,144 | ) | (521 | ) | (167 | ) | ||||||
|
|
|
|
|
|
|
|||||||
| Net cash provided by operating activities |
3,965 | 11,745 | 12,690 | |||||||||
| Investing activities: |
||||||||||||
| Purchases of property and equipment |
(1,831 | ) | (770 | ) | (2,071 | ) | ||||||
| Purchases of investments, net |
— | (22 | ) | — | ||||||||
| Cost of acquisitions, net of cash acquired |
(7,077 | ) | — | — | ||||||||
|
|
|
|
|
|
|
|||||||
| Net cash used in investing activities |
(8,908 | ) | (792 | ) | (2,071 | ) | ||||||
| Financing activities: |
||||||||||||
| Proceeds from issuance of common stock under stock plans |
3,289 | 870 | 150 | |||||||||
| Stock option excess income tax benefit |
39 | 18 | — | |||||||||
| Repurchase of common stock |
(5,374 | ) | (4,942 | ) | — | |||||||
| Repurchase of stock to satisfy employee tax withholding obligations |
(319 | ) | (140 | ) | — | |||||||
| Repayments of borrowings under credit facility |
— | (232 | ) | (331 | ) | |||||||
| Repayments under equipment term loans |
— | — | (72 | ) | ||||||||
| Repayments of note payable |
— | (22 | ) | (46 | ) | |||||||
|
|
|
|
|
|
|
|||||||
| Net cash used in financing activities |
(2,365 | ) | (4,448 | ) | (299 | ) | ||||||
| Effect of exchange rate changes on cash and cash equivalents |
1,246 | (481 | ) | (967 | ) | |||||||
| Increase (decrease) in cash and equivalents |
(6,062 | ) | 6,024 | 9,354 | ||||||||
| Cash and cash equivalents, beginning |
32,002 | 25,978 | 16,624 | |||||||||
|
|
|
|
|
|
|
|||||||
| Cash and cash equivalents, end |
$ | 25,940 | $ | 32,002 | $ | 25,978 | ||||||
|
|
|
|
|
|
|
|||||||
| Supplemental disclosure of other cash flow information: |
||||||||||||
| Cash paid for income taxes, net of refunds |
$ | 1,101 | $ | 356 | $ | 696 | ||||||
|
|
|
|
|
|
|
|||||||
| Cash paid for interest |
$ | — | $ | 3 | $ | 31 | ||||||
|
|
|
|
|
|
|
|||||||
| (1) | Certain amounts have been adjusted for the retrospective change in accounting principle for sales commissions. (See Note 2 on the Notes to Consolidated Financial Statements.) |
See accompanying Notes to Consolidated Financial Statements.
64
Table of Contents
NOTES TO CONSOLIDATED FINANCIAL STATEMENTS
1. The Company
Saba Software, Inc. (the “Company”) was incorporated in the State of Delaware in April 1997. The Company is the premier provider of a new class of learning and talent management solutions providing a unified set of People Cloud Applications that include: enterprise learning, talent management, testing and assessment and collaboration solutions delivered through the Saba People Cloud. The Saba People Cloud consists of a full suite of integrated People Cloud Applications, an open, flexible, service-oriented architecture, a multi-tenant people cloud infrastructure, and a people cloud community of customers, partners and human capital professionals.
The Company sells its products and related services worldwide primarily through a direct sales force and alliance partners. The Company’s corporate headquarters are located in Redwood Shores, California. In addition, the Company has international subsidiaries in India, France, Japan, Germany, Switzerland, Morocco, the United Kingdom, Canada, Brazil and Australia through which it conducts various operating activities related to its business. In each of the non-U.S. jurisdictions in which it has subsidiaries, other than India, the Company has employees or consultants engaged in sales and services activities. In the case of its India subsidiary, the Company’s employees primarily engage in software development and quality assurance testing activities.
2. Summary of Significant Accounting Policies
Basis of Presentation
The consolidated financial statements include the accounts of the Company and its wholly owned subsidiaries. All significant intercompany accounts and transactions have been eliminated in consolidation.
Use of Estimates
The preparation of consolidated financial statements in conformity with U.S. generally accepted accounting principles requires management to make estimates and assumptions that affect the reported amounts of assets and liabilities at the date of the financial statements and the reported amounts of revenue and expenses during the reporting periods. The Company bases its estimates for the carrying values of assets and liabilities using historical experience and other assumptions that are believed to be reasonable. Actual results could differ materially from those estimates. On an ongoing basis, the Company evaluates its estimates, including those related to allowance for doubtful accounts, fair values of intangible assets and goodwill, useful lives of intangible assets, property and equipment, fair values of options to purchase the Company’s common stock, and valuation of deferred tax assets, among others.
Cash and Cash Equivalents
Cash equivalents consist of highly liquid short-term investments with insignificant interest rate risk and original maturities from the date of purchase of three months or less. Cash and cash equivalents are stated at fair value based on quoted market prices.
Fair Value of Financial Instruments
The carrying values of the Company’s financial instruments including cash, cash equivalents, trade accounts receivable, trade accounts payable and accrued liabilities approximate their estimated fair value due to their short maturities.
The restricted cash as of May 31, 2011 is comprised of cash deposits of $374,000 and $63,000 related to a building lease and certain sales agreement, respectively.
65
Table of Contents
SABA SOFTWARE, INC.
NOTES TO CONSOLIDATED FINANCIAL STATEMENTS—(Continued)
Trade Accounts Receivable and Concentrations of Credit Risk
Financial instruments that are potentially subject to concentrations of credit risk include cash, cash equivalents and trade accounts receivable. Management believes the financial risks associated with cash and cash equivalents are minimal because these amounts are held in large well-established financial institutions. The Company is exposed to risk in the event of default by these financial institutions or the issuers of these securities to the extent the balances are in excess of amounts that are insured by the FDIC.
The Company conducts business with companies in various industries throughout the world. Trade accounts receivable are recorded at the invoiced amount, do not bear interest, and generally do not require collateral. Saba Enterprise Learning and related services have accounted for a substantial majority of the Company’s revenues since inception. An allowance is maintained for potential credit losses, and to date, such losses have been within management’s expectations. The allowance for doubtful accounts is based on management’s assessment of the amount of probable credit losses in the existing accounts receivable. Management determines the allowance based on the aging of the accounts receivable, the financial condition of the Company’s customers and their payment history, its historical write-off experience and other assumptions. Past due balances based on purchase order terms and other specific accounts as necessary are reviewed monthly. Account balances are charged off against the allowance after all means of collection have been exhausted and the potential for recovery is considered remote. The changes in the allowance for doubtful accounts are as follows:
| Beginning Balance |
Additions or Adjustments charged to Operations |
Write-Offs | Ending Balance |
|||||||||||||
| (in thousands) | ||||||||||||||||
| Year Ended: |
||||||||||||||||
| May 31, 2009 |
$ | 309 | $ | (25 | ) | $ | 183 | $ | 101 | |||||||
| May 31, 2010 |
101 | 126 | 77 | 150 | ||||||||||||
| May 31, 2011 |
150 | 36 | 36 | 150 | ||||||||||||
Accounts receivable includes amounts earned but unbilled of $2.5 million and $1.9 million at May 31, 2011 and 2010. At May 31, 2011 and 2010, there was no single customer representing more than 10% of the Company’s accounts receivable balance.
Property and Equipment
Property and equipment are stated at cost and are depreciated using the straight-line method over the estimated useful lives of the related assets, which are generally three to five years. Assets acquired under capital lease obligations are amortized over the shorter of the estimated useful life of the asset or the life of the lease. Amortization expense for assets acquired under capital lease obligations is included with depreciation expense. Leasehold improvements are amortized over the shorter of the estimated useful lives of the assets or the remaining life of the lease.
Purchased Intangible Assets and Goodwill
Purchased intangible assets consist of acquired developed technology, customer relationships, tradenames and customer backlog acquired as part of a purchase business combination. The intangible assets are stated at cost less accumulated amortization and are being amortized on a straight-line basis over their estimated useful lives of two to ten years.
Goodwill represents the excess of the purchase price over the fair value of tangible and identifiable intangible assets acquired. Goodwill amounts are not amortized, but rather are tested for impairment at least annually or on a
66
Table of Contents
SABA SOFTWARE, INC.
NOTES TO CONSOLIDATED FINANCIAL STATEMENTS—(Continued)
more frequent basis if indicators of impairment arise or circumstances otherwise dictate. The first phase of the goodwill impairment test requires us to test for impairment, while the second phase, if necessary, requires us to measure and allocate for the impairment. The Company operates as a single operating segment as discussed in Note 11. Accordingly, all of the Company’s goodwill is associated with the entire company.
In the event that the Company determines that the value of goodwill has become impaired, the Company will incur an impairment charge for the fiscal quarter in which such determination is made. Goodwill is not deductible for income tax purposes.
Software Development Costs
The Company accounts for software development costs in accordance with ASC 985-20 Software- Cost of Software to Be Sold, Lease, or Marketed, whereby costs for the development of new software products and substantial enhancements to existing software products are expensed as incurred until technological feasibility has been established, at which time any additional costs are capitalized. Technological feasibility is established upon completion of a working model. Through May 31, 2011, software development costs incurred subsequent to the establishment of technological feasibility have not been significant, and all software development costs have been charged to research and development expense in the accompanying consolidated statements of operations.
Income Taxes
The Company accounts for income taxes in accordance with ASC 740-10 Income Taxes. Deferred income taxes are recorded for the expected tax consequences of temporary differences between the tax bases of assets and liabilities for financial reporting purposes and amounts recognized for income tax purposes. A valuation allowance is recorded to reduce the Company’s deferred tax assets to the amount of future tax benefit that is more likely than not to be realized.
The calculation of tax liabilities involves dealing with uncertainties in the application of complex tax regulations. The Company recognizes liabilities for uncertain tax positions based on the two-step process prescribed within ASC 740-10. The first step is to determine if the weight of available evidence indicates that it is more likely than not that the tax position will be sustained on tax audit assuming that all issues are audited and resolution of any related appeals or litigation processes are considered. The second step is to measure the tax benefit as the largest amount that is more than 50% likely to be realized upon ultimate settlement. The reserves for uncertain tax positions are adjusted due to changing facts and circumstances, such as the closing of a tax audit, expiration of statutes of limitation on potential assessments or the refinement of an estimate. To the extent that the final outcome of these matters is different than the amounts recorded, such differences will impact the provision for income taxes in the period in which such a determination is made. The provisions for income taxes include the impact of reserve provisions and changes to reserves that are considered appropriate and also include the related interest and penalties.
Shared-based Compensation
The Company accounts for share-based payments to its employees and non-employee directors in accordance with the provisions of ASC 718-10 Compensation-Stock Compensation, which requires share-based payments to be measured at the grant date based on the fair value of the award and recognized as expense on a straight-line basis over the requisite service period, which is the vesting period.
67
Table of Contents
SABA SOFTWARE, INC.
NOTES TO CONSOLIDATED FINANCIAL STATEMENTS—(Continued)
Basic and Diluted Net Income (Loss) Per Share
Basic and diluted net income (loss) per share information for all periods is presented under the requirements of ASC 260-10 Earnings per Share. Basic earnings per share has been computed using the weighted-average number of shares of common stock outstanding during the period, less shares that may be repurchased, and excludes any dilutive effects of options.
The calculations of basic and diluted net income (loss) per share are as follows:
| Years ended May 31, | ||||||||||||
| 2011 | 2010 (As Adjusted) (1) |
2009 (As Adjusted) (1) |
||||||||||
| (in thousands, except per share data) | ||||||||||||
| Net income (loss) |
$ | (7,263 | ) | $ | 2,765 | $ | (2,511 | ) | ||||
| Weighted-average shares of common stock used in computing basic net income (loss) per share |
28,214 | 28,263 | 29,174 | |||||||||
| Effect of dilutive employee stock plans |
— | 1,030 | — | |||||||||
|
|
|
|
|
|
|
|||||||
| Weighted-average shares of common stock used in computing diluted net income (loss) per share |
28,214 | 29,293 | 29,174 | |||||||||
|
|
|
|
|
|
|
|||||||
| Basic net income (loss) per share |
$ | (0.26 | ) | $ | 0.10 | $ | (0.09 | ) | ||||
|
|
|
|
|
|
|
|||||||
| Diluted net income (loss) per share |
$ | (0.26 | ) | $ | 0.09 | $ | (0.09 | ) | ||||
|
|
|
|
|
|
|
|||||||
| (1) | Certain amounts have been adjusted for the retrospective change in accounting principle for sales commissions. (See Note 2 on the Notes to Consolidated Financial Statements.) |
During fiscal 2010, the Company added 1.0 million common equivalent shares related to employee stock plans to the basic weighted-average shares outstanding to compute the diluted weighted-average shares outstanding. The Company is required to include these dilutive shares in the Company’s calculations of net income per share for fiscal 2010 because it earned a profit. If the Company had earned profit during fiscal 2011 and 2009, it would have added common equivalent shares of 1,835,227 and 23,340 to the basic weighted-average shares outstanding to compute the diluted weighted-average shares outstanding for these periods, respectively.
Shares used in diluted net income per common share calculations exclude anti-dilutive common equivalent shares, consisting of stock options and restricted stock units, if they have exercise prices, higher than the average stock price during the respective periods, under the treasury method. These anti-dilutive common equivalent shares totaled 1.6 million, 3.8 million and 4.7 million shares for fiscal year 2011, 2010 and 2009, respectively. While these common equivalent shares are anti-dilutive, they could be dilutive in the future.
Revenue Recognition
In October 2009, the Financial Accounting Standards Board (“FASB”) issued Accounting Standards Update No. 2009-13 Revenue Recognition (Topic 605) Multiple-Deliverable Revenue Arrangements (A Consensus of the FASB Emerging Issues Task Force) (ASU 2009-13) which amends the revenue recognition for certain multiple element revenue arrangements excluding license arrangements to:
| • | provide updated guidance on whether multiple elements exist, how the elements in an arrangement should be separated, and how the arrangement consideration should be allocated to the separate elements; |
| • | require an entity to allocate arrangement consideration to each element based on a selling price hierarchy, where the selling price for an element is based on vendor-specific objective evidence (“VSOE”), if available; third-party evidence (“TPE”), if available and if VSOE is not available; or the best estimate of selling price (“BESP”), if neither VSOE nor TPE is available; and |
68
Table of Contents
SABA SOFTWARE, INC.
NOTES TO CONSOLIDATED FINANCIAL STATEMENTS—(Continued)
| • | eliminate the use of the residual method and require an entity to allocate arrangement consideration using the relative selling price method. |
Although the amended standards were not required to be adopted by the Company until June 1, 2011 (the beginning of the Company’s fiscal year 2012), the Company elected to early adopt this accounting guidance retrospectively to the beginning of its first quarter of fiscal 2011 for transactions entered into or materially modified after May 31, 2010. The Company generates revenues from the sale of software licenses, subscription services and professional services and recognizes revenues when all of the following conditions are met:
| • | persuasive evidence of an agreement exists; |
| • | delivery has occurred; |
| • | the fee is fixed or determinable; and |
| • | collection is probable. |
Subscription Services Arrangements
Subscription services arrangements generally include a combination of our products delivered via an internet-based cloud architecture, product updates and support related to licenses and professional services. Subscription revenue includes revenue from cloud-based offerings and product updates and support related to licenses.
Revenue from cloud-based offerings that are integrated offerings pursuant to which the customers’ ability to access the Company’s software is not separable from the services necessary to operate the software and customers are not allowed to take possession of the Company’s software are recognized ratably over the term of the arrangement as delivered or on an as-used basis if defined in the contract. Saba does not grant its resellers the right of return and does not recognize revenue from resellers until an end-user has been identified and the other conditions of ASC 985-605 are satisfied. Revenue from product updates, support and hosting services related to licenses are recognized ratably over the term of the arrangement as delivered or on an as-used basis if defined in the contract.
When subscription services arrangements involve multiple elements that qualify as separate units of accounting, the Company allocates arrangement consideration in multiple-deliverable revenue arrangements at the inception of an arrangement to all deliverables based on the relative selling price method in accordance with the selling price hierarchy, which includes: (i) VSOE if available; (ii) TPE if VSOE is not available; and (iii) BESP if neither VSOE nor TPE is available.
The Company determines VSOE based on its historical pricing and discounting practices for the specific product or service when sold separately. In determining VSOE, the Company requires that a substantial majority of the selling prices for these services fall within a reasonably narrow pricing range. The Company limits its assessment of VSOE for each element to either the price charged when the same element is sold separately or the price established by management, having the relevant authority to do so, for an element not yet sold separately.
When VSOE cannot be established for deliverables in multiple element arrangements, the Company applies judgment with respect to whether it can establish a selling price based on TPE. TPE is determined based on competitor prices for similar deliverables when sold separately. Generally, the Company’s go-to-market strategy differs from that of its peers and its offerings contain a significant level of differentiation such that the comparable pricing of services with similar functionality cannot be obtained. Furthermore, the Company is unable to reliably determine what similar competitor services’ selling prices are on a stand-alone basis. As a result, the Company has not been able to establish selling price based on TPE.
69
Table of Contents
SABA SOFTWARE, INC.
NOTES TO CONSOLIDATED FINANCIAL STATEMENTS—(Continued)
When it is unable to establish a selling price using VSOE or TPE, the Company uses BESP in its allocation of arrangement consideration. The objective of BESP is to determine the price at which the Company would transact a sale if the product or service were sold on a stand-alone basis. The Company determines BESP for deliverables by considering multiple factors including, but not limited to, prices it charges for similar offerings, market conditions, competitive landscape and pricing practices.
The Company has not historically priced its cloud-based offerings within a narrow range and limited historical renewal rate information is available based on the life cycle of these offerings. As a result, the Company uses BESP in order to allocate the selling price to cloud-based deliverables. In general, the Company uses VSOE in order to allocate the selling price to professional service deliverables.
Certain cloud-based offerings include arrangements with customers that have separately licensed and taken possession of the Company’s software. When these offerings are part of a multiple element arrangement involving licenses, the Company recognizes revenue in accordance with ASC 985-605.
Software License Arrangements
Software license arrangements generally include a combination of the Company’s software, license updates and product support and/or professional services. A significant amount of the Company’s software license arrangements are for perpetual licenses.
The Company recognizes revenue earned on perpetual software license arrangements in accordance with FASB’s Accounting Standards Codification (“ASC”) 985-605, Software-Revenue Recognition. When software arrangements involve multiple elements, the Company recognizes license revenue, using the residual method. Under the residual method revenue is allocated to undelivered elements based on VSOE of fair value of such undelivered elements and the residual amount of the arrangement is allocated to delivered elements. Accordingly, assuming all other revenue recognition criteria are met, revenues from perpetual licenses are recognized upon delivery using the residual method. The Company limits its assessment of VSOE for each element to either the price charged when the same element is sold separately or the price established by management, having the relevant authority to do so, for an element not yet sold separately.
License revenues from licenses with a term of three years or more are generally recognized on delivery if the other conditions of ASC 985-605 are satisfied. License revenues from licenses with a term of less than three years are generally recognized ratably over the term of the arrangement. In arrangements where term licenses are bundled with license updates and product support and such revenue is recognized ratably over the term of the arrangement, The Company allocates the revenue to license revenue and to license updates and product support revenue based on the VSOE of fair value for license updates and product support revenue on perpetual licenses of similar products. The Company does not grant its resellers the right of return and does not recognize revenue from resellers until an end-user has been identified and the other conditions of ASC 985-605 are satisfied.
Professional Services
Professional services revenues are generally recognized as the services are performed. Although the Company generally provides professional services on a time-and-materials basis, certain services agreements are provided on a fixed-fee basis. For services performed on a fixed-fee basis, revenues are generally recognized using the proportional performance method, with performance measured based on hours of work performed. For contracts that involve significant customization and implementation or consulting services that are essential to the functionality of the software, the license and services revenues are recognized using the percentage-of-completion method or, if Saba is unable to reliably estimate the costs to complete the services,
70
Table of Contents
SABA SOFTWARE, INC.
NOTES TO CONSOLIDATED FINANCIAL STATEMENTS—(Continued)
Saba uses the completed-contract method of accounting in accordance with ASC 985-605 and relevant guidance of ASC 605-35 Construction-Type and Certain Production–Type . A contract is considered complete when all significant costs have been incurred or the item has been accepted by the customer.
If the requirements of ASC 985-605 are not met when the Company bills a customer or a customer pays the Company, the billed or paid amount is recorded as deferred revenue, which is a liability account. As the revenue recognition criteria of ASC 985-605 are satisfied, the requisite amounts are recognized as revenue.
The Company classifies deferred revenue and deferred costs on its consolidated balance sheet as current if the Company expects to recognize such revenue or cost within the following twelve months. When the revenue from professional services is recognized ratably over the subscription for transactions entered into prior to adoption of ASC 2009-13, the Company allocates the revenue to professional services revenue and to subscription revenue based on the VSOE of fair value for similar professional services that qualify as a separate element of the arrangement. The Company’s judgment as to whether the consulting services qualify as a separate unit of accounting may materially affect the timing of the Company’s revenue recognition and results of operations.
Impact of Adoption
Prior to adoption of ASU 2009-13, our professional services, when sold with cloud based offerings, did not qualify as separate units of accounting and were recognized as revenue ratably over the longest subscription period in the arrangement. Under subscription accounting, the Company also deferred the associated professional services costs and recognized them on a straight-line basis over the same subscription period. This resulted in the deferral of professional services revenue and professional services cost of revenue.
With the adoption of ASU 2009-13, arrangement consideration is allocated using the relative selling price method and recognized as individual deliverables in accordance with the guidance described in the Critical Accounting Policies. Additionally, the Company expenses the direct cost related to the professional services as incurred.
Total revenues for the year ended May 31, 2011 were $116.7 million with the adoption of ASU 2009-13. If the Company did not elect an early adoption of ASU 2009-13, its total revenues would have been $113.7 million for the year ended May 31, 2011. The increase in total revenues was primarily due to an increase of $2.7 million in professional services revenue that the Company recognized based on the adoption of ASU 2009-13.
Cost of revenues for the year ended May 31, 2011 was $43.0 million with the adoption of ASU 2009-13. Cost of revenues would have been $41.2 million for the year ended May 31, 2011 had the Company not adopted ASU 2009-13. The increase in cost of revenues was the result of expensing direct costs related to the professional services as incurred.
As of May 31, 2011, deferred revenue was $45.8 million. Deferred revenue would have been $48.8 million had the Company not adopted ASU 2009-13.
The impact of adoption of ASU 2009-13 will vary, in the future, based on the nature and volume of new or materially modified arrangements.
71
Table of Contents
SABA SOFTWARE, INC.
NOTES TO CONSOLIDATED FINANCIAL STATEMENTS—(Continued)
Changes in Accounting Principle
In the third quarter of fiscal 2011, the Company voluntarily changed its accounting policy for sales commissions related to non-cancellable annual or multi-year SaaS contracts, from recording an expense when incurred to deferral and amortization of the sales commission in proportion to the revenue recognized over the non-cancellable term of the contract. The Company believes this method is preferable because commission charges are so closely related to the revenue from the non-cancelable contracts that they should be deferred and charged to expense over the same period that the related revenue is recognized. Furthermore, the adoption of this accounting policy enhances the comparability of the Company’s consolidated financial statements by changing to the predominant method utilized in the Company’s industry. Deferred commission amounts are recoverable through the future revenue streams under the non-cancellable arrangements. Short-term deferred commissions are included in prepaid expenses and other current assets, while long-term deferred commissions are included in other assets in the accompanying consolidated balance sheets. The amortization of deferred commissions is included in sales and marketing expense in the accompanying condensed consolidated statements of operations.
The accompanying audited consolidated financial statements and related notes have been adjusted to reflect the impact of this change retrospectively to all prior periods.
The following tables present the effects of the retrospective application of the voluntary change in accounting principle for sales commissions related to non-cancellable annual or multi-year SaaS contracts for all periods presented (in thousands):
| For the years ended May 31, | ||||||||||||||||||||||||
| 2010 | 2009 | |||||||||||||||||||||||
| As Previously Reported |
Adjustments (1) | As Adjusted |
As Previously Reported |
Adjustments (1) | As Adjusted |
|||||||||||||||||||
| (in thousands, except per share data) | ||||||||||||||||||||||||
| Consolidated Statement of Operations |
||||||||||||||||||||||||
| Sales and marketing |
$ | 33,405 | $ | 128 | $ | 33,533 | $ | 26,405 | $ | 156 | $ | 26,561 | ||||||||||||
| Income (loss) from operations |
3,417 | (128 | ) | 3,289 | (523 | ) | (156 | ) | (679 | ) | ||||||||||||||
| Net income (loss) |
$ | 2,893 | $ | (128 | ) | $ | 2,765 | $ | (2,355 | ) | $ | (156 | ) | $ | (2,511 | ) | ||||||||
|
|
|
|
|
|
|
|
|
|
|
|
|
|||||||||||||
| Basic net gain (loss) per share |
$ | 0.10 | $ | (0.00 | ) | $ | 0.10 | $ | (0.08 | ) | $ | (0.01 | ) | $ | (0.09 | ) | ||||||||
|
|
|
|
|
|
|
|
|
|
|
|
|
|||||||||||||
| Diluted net gain (loss) per share |
$ | 0.10 | $ | (0.01 | ) | $ | 0.09 | $ | (0.08 | ) | $ | (0.01 | ) | $ | (0.09 | ) | ||||||||
|
|
|
|
|
|
|
|
|
|
|
|
|
|||||||||||||
| Shares used in computing basic net gain (loss) per share |
28,263 | 28,263 | 28,263 | 29,174 | 29,174 | 29,174 | ||||||||||||||||||
|
|
|
|
|
|
|
|
|
|
|
|
|
|||||||||||||
| Shares used in computing diluted net gain (loss) per share |
29,293 | 29,293 | 29,293 | 29,174 | 29,174 | 29,174 | ||||||||||||||||||
|
|
|
|
|
|
|
|
|
|
|
|
|
|||||||||||||
| May 31, | ||||||||||||||||||||||||
| 2010 | 2009 | |||||||||||||||||||||||
| As Previously Reported |
Adjustments (1) | As Adjusted |
As Previously Reported |
Adjustments (1) | As Adjusted |
|||||||||||||||||||
| (in thousands) | ||||||||||||||||||||||||
| Consolidated Balance Sheet |
||||||||||||||||||||||||
| Prepaid and other current assets |
$ | 1,788 | $ | 325 | $ | 2,113 | $ | 2,245 | $ | 501 | $ | 2,746 | ||||||||||||
| Other assets |
1,722 | 199 | 1,921 | 1,537 | 151 | 1,688 | ||||||||||||||||||
| Total assets |
103,444 | 524 | 103,968 | 99,723 | 652 | 100,375 | ||||||||||||||||||
| Accumulated defecit |
(206,336 | ) | 524 | (205,812 | ) | (209,230 | ) | 652 | (208,578 | ) | ||||||||||||||
| (1) | Certain amounts have been adjusted for the retrospective change in accounting principle for sales commissions. (See Note 2 on the Notes to Consolidated Financial Statements.) |
72
Table of Contents
SABA SOFTWARE, INC.
NOTES TO CONSOLIDATED FINANCIAL STATEMENTS—(Continued)
Fair Value Measurements
The Company performs fair value measurements in accordance with the guidance provided by ASC 820, Fair Value Measurements and Disclosures. ASC 820 defines fair value as the price that would be received from selling an asset or paid to transfer a liability in an orderly transaction between market participants at the measurement date. When determining the fair value measurements for assets and liabilities required to be recorded at their fair values, the Company considers the principal or most advantageous market in which it transacts and considers assumptions that market participants would use when pricing the assets or liabilities, such as inherent risk, transfer restrictions, and risk of nonperformance.
ASC 820 establishes a fair value hierarchy that requires an entity to maximize the use of observable inputs and minimize the use of unobservable inputs when measuring fair value. An asset’s or liability’s categorization within the fair value hierarchy is based upon the lowest level of input that is significant to the fair value measurement. ASC 820 establishes three levels of inputs that may be used to measure fair value:
| • | Level 1: quoted prices in active markets for identical assets or liabilities; |
| • | Level 2: inputs other than Level 1 that are observable, either directly or indirectly, such as quoted prices in active markets for similar assets or liabilities, quoted prices for identical or similar assets or liabilities in markets that are not active, or other inputs that are observable or can be corroborated by observable market data for substantially the full term of the assets or liabilities; or |
| • | Level 3: unobservable inputs that are supported by little or no market activity and that are significant to the fair values of the assets or liabilities. |
Business Combinations
The Company allocates the purchase price of acquired companies to the assets acquired and liabilities assumed based on their estimated fair values. Goodwill as of the acquisition date is measured as the excess of consideration transferred and the net of the acquisition date fair value of the assets acquired and liabilities assumed. Management makes significant estimates and assumptions, especially with respect to intangible assets, to estimate the fair value of assets acquired and liabilities assumed. The estimates of fair value are based upon assumptions believed to be reasonable by management, but are inherently uncertain and unpredictable and, therefore, actual results may differ from estimates. As a result, during the measurement period, which may be up to one year from the acquisition date, the Company may record adjustments to the fair value of assets acquired and liabilities assumed, with the corresponding offset to goodwill. Upon the conclusion of the measurement period or final determination of the fair value of assets acquired or liabilities assumed, whichever comes first, any subsequent adjustments are recorded to the Company’s consolidated statements of operations.
The fair value of asset acquired and liabilities assumed are estimated using various valuation approaches, which include unobservable inputs that reflect the Company’s assessment of the assumptions market participants would use to value such assets and liabilities. Significant inputs to estimate the fair value of assets acquired and liabilities assumed include, but are not limited to, discount rates, probability of future cash pay-outs related to contingent consideration, and future expected cash flows from customer contracts, customer lists, acquired developed technologies and patents and brand awareness and market position, as well as assumptions about the period of time the brand will continue to be used in the Company’s product portfolio. The fair value of contingent consideration is remeasured at each reporting period with any changes to such fair value recorded as operating expense.
In addition, uncertain tax positions and tax related valuation allowances assumed in connection with a business combination are initially estimated as of the acquisition date. The Company reevaluates these items quarterly and records any adjustments to the Company’s preliminary estimates to goodwill provided that the
73
Table of Contents
SABA SOFTWARE, INC.
NOTES TO CONSOLIDATED FINANCIAL STATEMENTS—(Continued)
Company is within the measurement period and the Company continues to collect information in order to determine their estimated fair values as of the date of acquisition. Subsequent to the measurement period or the Company’s final determination of the tax allowance’s or contingency’s estimated value, changes to these uncertain tax positions and tax related valuation allowances will affect the Company’s provision for income taxes in the Company’s consolidated statement of operations.
Advertising Expense
Advertising costs are expensed as incurred and recorded in sales and marketing. The Company incurred advertising costs of $0.2 million in fiscal 2011, 2010 and 2009.
Foreign Currency Translation
In general, the functional currency of the Company’s foreign subsidiaries is the local currency. Foreign currency balance sheets are translated using end of period currency rates, while foreign currency statements of operations are translated using average rates for the period. Gains and losses resulting from translation of these foreign currency financial statements into U.S. dollars are recorded within stockholders’ equity as part of accumulated other comprehensive loss.
Accumulated Other Comprehensive Income (Loss)
Comprehensive loss is comprised of net loss and other comprehensive income (loss) and is reported in the accompanying statement of stockholders’ equity. Accumulated other comprehensive income (loss) is comprised of foreign currency translation activity as follows:
| May 31, | ||||||||
| 2011 | 2010 | |||||||
| (in thousands) | ||||||||
| Foreign currency translation adjustment |
$ | 270 | $ | (277 | ) | |||
|
|
|
|
|
|||||
| Accumulated other comprehensive income (loss) |
$ | 270 | $ | (277 | ) | |||
|
|
|
|
|
|||||
Recent Accounting Pronouncements
In December 2010, the FASB issued Accounting Standards Update No. 2010-28, When to Perform Step 2 of the Goodwill Impairment Test for Reporting Units with Zero or Negative Carrying Amounts (Topic 350)—Intangibles—Goodwill and Other (ASU 2010-28). ASU 2010-28 amends the criteria for performing Step 2 of the goodwill impairment test for reporting units with zero or negative carrying amounts and requires performing Step 2 if qualitative factors indicate that it is more likely than not that a goodwill impairment exists. The Company will adopt ASU 2010-28 in fiscal 2012 and any impairment to be recorded upon adoption will be recognized as an adjustment to the Company’s beginning retained earnings. The Company is currently evaluating the impact of the pending adoption of ASU 2010-28 on its condensed consolidated financial statements.
As previously discussed in Note 2 to the condensed consolidated financial statements, the Company adopted ASU 2009-13, which amends the revenue recognition for certain multiple element revenue arrangements.
In October 2009, the FASB issued Accounting Standards Update 2009-14, Revenue Recognition (Topic 605)—Applicability of AICPA Statement of Position 97-2 to Certain Arrangements That Include Software Elements (ASU 2009-14). ASU 2009-14 excludes tangible products containing software components and non-software components that function together to deliver the product’s essential functionality from the scope of
74
Table of Contents
SABA SOFTWARE, INC.
NOTES TO CONSOLIDATED FINANCIAL STATEMENTS—(Continued)
ASC 985-605. Although ASU 2009-14 is not required to be adopted by the Company until June 1, 2011 (the beginning of the Company’s fiscal year 2012), the Company elected to early adopt this accounting guidance retrospectively to the beginning of its first quarter of fiscal 2011 for transactions entered into or materially modified after May 31, 2010. The adoption of ASU 2009-14 did not have an impact on the Company’s condensed consolidated financial statements.
3. Business Combinations
Comartis Group Ltd. (Comartis) and Pedagogue Solutions, Inc. (Pedagogue)
On May 16, 2011, the Company completed the acquisition of Comartis Group Ltd., a Swiss corporation (Comartis), a provider of testing and assessment and talent development software, and on May 24, 2011, the Company completed the acquisition of Pedagogue Solutions, Inc. (Pedagogue), a New Jersey corporation, a provider of testing and assessment software for the pharmaceutical and life sciences industries. The Comartis and Pedagogue acquisitions support the Company’s long-term strategic direction to strengthen its competitive position in the Human Capital Management market, provide solutions to its customers with enterprise-wide compliance and regulatory requirements, expand its customer base in North America and Europe, and accelerate innovation of mission-critical solutions for its customers.
The total purchase price and the fair value of contingent consideration was allocated to the assets acquired and liabilities assumed based upon their fair value at the date of acquisition. The total purchase price for both acquisitions totals $11.0 million, which includes $7.1 million in cash paid at closing of the transactions, $1.5 million of the aggregate purchase price was subject to a liability holdback, as security from the selling stockholders’ obligations under each purchase agreement and related transactional agreements and $2.5 million for the fair value of contingent consideration, or earn-out payments, that are based on future performance over the 12 months following the respective closing dates. Subject to the terms of the agreement, the Company is obligated to pay any remaining balance of the holdback after the 18 month anniversary of the closing date of the respective acquisitions. The total purchase price, including the fair value of the contingent consideration was allocated to the net tangible and intangible assets based upon their fair values as of the respective acquisition dates as set forth below. The excess of the purchase price over the net tangible and intangible assets was recorded as goodwill. The following table summarizes the estimated fair values of the assets and liabilities assumed at the acquisition date. The Company is in the process of finalizing the assets and liabilities for both acquisitions which is expected in the first quarter of fiscal 2012.
| Purchase Price Allocation |
Estimated | |||||
| (in thousands) | ||||||
| Accounts receivable |
$ | 789 | ||||
| Prepaid expenses |
116 | |||||
| Property and equipment |
197 | |||||
| Customer relationships |
5,000 | 10 years | ||||
| Tradenames |
500 | 5 years | ||||
| Acquired development technology |
1,500 | 5 years | ||||
| Goodwill |
5,374 | |||||
| Other long-term assets |
89 | |||||
| Accounts payable |
(219 | ) | ||||
| Accrued expenses |
(400 | ) | ||||
| Deferred revenue |
(956 | ) | ||||
| Other long-term liabilities |
(1,000 | ) | ||||
|
|
|
|||||
| Total purchase price |
$ | 10,990 | ||||
|
|
|
|||||
75
Table of Contents
SABA SOFTWARE, INC.
NOTES TO CONSOLIDATED FINANCIAL STATEMENTS—(Continued)
Customer relationships represent the fair values of the underlying relationships and agreements with Comartis’ and Pedagogue’s customers. Acquired developed technology represents the fair values of each acquired company’s testing and assessment technology. Tradenames represents the fair values of brand and name recognition associated with the marketing of Comartis’ and Pedagogue’s services.
The fair value of intangible assets was based on the income approach and the fair value of the acquisition-related liability-classified contingent consideration was estimated using the probability weighted expected pay-out model. Acquisition-related transaction costs of approximately $0.5 million consist of the Company’s legal and due diligence fees and other external costs directly related to the Comartis and Pedagogue acquisitions. All acquisition related transaction costs were expensed as incurred.
Pro forma results of operations have not been presented because the effect of the acquisitions individually or in the aggregate were not significant.
4. Property and Equipment
Property and equipment consists of the following:
| May 31, |
Estimated | |||||||||
| 2011 | 2010 | |||||||||
| (in thousands) | ||||||||||
| Computer equipment |
$ | 18,796 | $ | 17,181 | 1 to 3 Years | |||||
| Office furniture and fixtures |
2,034 | 1,925 | 5 Years | |||||||
| Leasehold improvements |
2,094 | 1,662 | 1 to 5 Years | |||||||
|
|
|
|
|
|||||||
| 22,924 | 20,768 | |||||||||
| Less accumulated depreciation and amortization |
(19,778 | ) | (17,590 | ) | ||||||
|
|
|
|
|
|||||||
| $ | 3,146 | $ | 3,178 | |||||||
|
|
|
|
|
|||||||
Depreciation expense for the fiscal years ended May 31, 2011, 2010 and 2009 was $2.1 million, $2.4 million and $2.4 million, respectively.
5. Purchased Intangible Assets and Goodwill
The following tables provide a summary of the carrying amounts of purchased intangible assets that continue to be amortized:
| May 31, 2011 |
Weighted | |||||||||||||
| Gross Carrying Amount |
Accumulated Amortization |
Net Carrying Amount |
||||||||||||
| (in thousands) | ||||||||||||||
| Customer relationships |
$ | 19,920 | $ | (13,182 | ) | $ | 6,738 | 7.2 Years | ||||||
| Tradenames |
1,320 | (824 | ) | 496 | 5.0 Years | |||||||||
| Acquired developed technology |
7,390 | (5,902 | ) | 1,488 | 5.0 Years | |||||||||
|
|
|
|
|
|
|
|||||||||
| Total |
$ | 28,630 | $ | (19,908 | ) | $ | 8,722 | |||||||
|
|
|
|
|
|
|
|||||||||
76
Table of Contents
SABA SOFTWARE, INC.
NOTES TO CONSOLIDATED FINANCIAL STATEMENTS—(Continued)
| May 31, 2010 |
Weighted | |||||||||||||
| Gross Carrying Amount |
Accumulated Amortization |
Net Carrying Amount |
||||||||||||
| (in thousands) | ||||||||||||||
| Customer relationships |
$ | 14,920 | $ | (10,788 | ) | $ | 4,132 | 6.3 Years | ||||||
| Tradenames |
820 | (710 | ) | 110 | 5.0 Years | |||||||||
| Acquired developed technology |
5,890 | (5,105 | ) | 785 | 5.0 Years | |||||||||
|
|
|
|
|
|
|
|||||||||
| Total |
$ | 21,630 | $ | (16,603 | ) | $ | 5,027 | |||||||
|
|
|
|
|
|
|
|||||||||
Amortization expense related to purchased intangible assets was $3.3 million, $3.7 million and $3.7 million in fiscal years 2011, 2010 and 2009, respectively. The total expected future amortization related to purchased intangible assets will be approximately $2.7 million for the year ended May 31, 2012 and $0.9 million for each of the years ended May 31, 2013, 2014, 2015 and 2016.
During the fourth quarter of fiscal 2011, the Company performed the required annual impairment analysis and determined that there was no indication of impairment of goodwill. Any future reduction of the enterprise fair value below the amount of stockholders’ equity could require the Company to write down the value of goodwill to its fair value and record an expense for the impairment loss.
The changes in the carrying amount of goodwill as of May 31, 2011, 2010 and 2009 are as follows and described in Note 3:
| Net Carrying Amount |
||||
| (in thousands) | ||||
| Goodwill, as of May 31, 2009 and 2010 |
$ | 36,095 | ||
| Additions to goodwill related to acquisitions (see Note 3) |
5,374 | |||
|
|
|
|||
| Goodwill, as of May 31, 2011 |
$ | 41,469 | ||
|
|
|
|||
6. Debt and Lease Obligations
Credit Agreement
On November 22, 2010, the Company entered into a credit agreement with Wells Fargo Bank, National Association (“Wells Fargo”). The agreement provided for a one year $10 million line of credit. The agreement also included a sublimit of up to $4.0 million for letters of credit.
The agreement included certain covenants with which the Company must comply during the term of the agreement, including that the Company’s minimum cash and cash equivalents balance shall be at all times equal to not less than $15 million (including minimum U.S. cash and cash equivalents balance shall not be less than $10 million), and that at the end of each fiscal quarter net losses after taxes during the four consecutive fiscal quarter period then ended shall be equal to not more than $4 million. The Company was not in compliance with the covenants as of May 31, 2011. As a result, the Company would not have been able to borrow on the credit agreement as of May 31, 2011.
The line of credit was secured by all of the Company’s personal property other than its intellectual property. The agreement included certain negative covenants restricting or limiting the ability of the Company and its subsidiaries to, among other things, incur additional indebtedness, make investments and acquisitions, merge or consolidate with any other entity, and convey, sell, lease, transfer or otherwise dispose of assets. Such restrictions and limitations are subject to usual and customary exceptions contained in credit agreements of this nature.
77
Table of Contents
SABA SOFTWARE, INC.
NOTES TO CONSOLIDATED FINANCIAL STATEMENTS—(Continued)
The agreement also contained usual and customary events of default (subject to certain threshold amounts and grace periods). If an event of default occurs and is continuing, the Company may be required to repay the obligations under the line of credit prior to the stated maturity date, the Company’s ability to continue to borrow under the credit agreement may terminate, and the Bank may be able to foreclose on any or all collateral provided by the Company or the Company’s subsidiaries.
No amounts were borrowed under the credit agreement as of May 31, 2011.
Amended Credit Agreement
On June 27, 2011, the Company entered into an Amended and Restated Credit Agreement with Wells Fargo (the “ Amended Agreement”), which supersedes the Company’s prior line of credit, increases the available revolving credit limit to $40 million and extends the term of the line of credit to June 27, 2016. To date, no amounts have been borrowed under the line of credit.
The line of credit is secured by all of the Company’s personal property other than its intellectual property. The line of credit also is guaranteed by, and secured by the assets of, the Company’s material domestic subsidiaries. The Amended Agreement includes certain covenants with which the Company must comply during the term of the Amended Agreement, including a minimum EBITDA covenant that applies only if liquidity (defined as cash plus available unused borrowings under the credit line) drops below $15 million. The Amended Agreement also includes certain customary negative covenants.
The Amended Agreement contains usual and customary events of default (subject to certain threshold amounts and grace periods). If an event of default occurs and is continuing, the Company may be required to repay the obligations under the line of credit prior to the stated maturity date, the Company’s ability to continue to borrow under the Amended Agreement may terminate, and the Bank may be able to foreclose on any or all collateral provided by the Company or the Company’s subsidiaries.
Leases
Saba leases its office facilities under various non-cancelable operating leases that expire at various dates through 2019. Rent expense was $4.0 million, $4.3 million and $4.4 million in fiscal years 2011, 2010 and 2009, respectively. Rent expense of Saba’s facility leases is recognized on a straight-line basis over the term of the lease. The difference between the amounts paid and the amounts expensed is classified as accrued rent in the consolidated balance sheets.
On September 7, 2010, the Company entered into a Third Amendment to Lease with Westport Office Park, LLC (the “Landlord”), which amended the Lease Agreement dated as of March 16, 1999, as amended, between the Company and the Landlord relating to the lease of the office space comprising the Company’s corporate headquarters. The Third Amendment to Lease, which became effective as of August 31, 2010, extended the lease termination date from May 31, 2014 to May 31, 2019. The Third Amendment to Lease also amended the Lease Agreement so that the base monthly rent payable from June 1, 2013 through May 31, 2014 under the Lease Agreement is $162,086 and the monthly rent payable from June 1, 2014 through May 31, 2019 under the Lease Agreement will begin at $96,768 on June 1, 2014 and thereafter increase annually by approximately $3,000. The amended lease modification resulted in a reduction of straight-line rent expense, beginning in the second quarter of fiscal 2011, which is reflected on the Company’s condensed consolidated statement of operations.
During the quarter ended February 28, 2009, the Company entered into a non-cancelable three year contract for software services of which $0.2 million remained as of May 31, 2011.
78
Table of Contents
SABA SOFTWARE, INC.
NOTES TO CONSOLIDATED FINANCIAL STATEMENTS—(Continued)
The following table summarizes the Company’s future minimum lease payments and contract obligations as of May 31, 2011.
| Payments due by fiscal year | ||||||||||||||||||||||||||||
| Total | FY 2012 | FY 2013 | FY 2014 | FY 2015 | FY 2016 | Thereafter | ||||||||||||||||||||||
| (in thousands) | ||||||||||||||||||||||||||||
| Contractual obligations: |
||||||||||||||||||||||||||||
| Long-term contract commitment |
$ | 193 | $ | 193 | $ | — | $ | — | $ | — | $ | — | $ | — | ||||||||||||||
| Operating lease obligations |
15,805 | 3,922 | 3,583 | 2,096 | 1,199 | 1,196 | 3,809 | |||||||||||||||||||||
|
|
|
|
|
|
|
|
|
|
|
|
|
|
|
|||||||||||||||
| Total |
$ | 15,998 | $ | 4,115 | $ | 3,583 | $ | 2,096 | $ | 1,199 | $ | 1,196 | $ | 3,809 | ||||||||||||||
|
|
|
|
|
|
|
|
|
|
|
|
|
|
|
|||||||||||||||
7. Fair Value Measurements
The Company estimates the fair value of acquisition-related liability-classified contingent consideration using the probability weighted expected pay-out model. The key assumptions in applying the approach is the probability of certain customer renewal weight targets and revenue booking targets. The contingent consideration liabilities are classified as Level 3 liabilities, because the Company uses unobservable inputs to value them, reflecting the Company’s assessment of the assumptions market participants would use to value these liabilities.
The following table presents the liabilities carried at fair value as of May 31, 2011:
| Fair Value Measurements Using | ||||||||||||||||
| Description |
As of May 31, 2011 |
Quoted Prices in Active Market for Identical Assets (Level 1) |
Significant Other Observable Inputs (Level 2) |
Significant Other Unobservable Inputs (Level 3) |
||||||||||||
| (in thousands) | ||||||||||||||||
| Liabilities: |
||||||||||||||||
| Acquisition contingent consideration |
$ | 2,574 | $ | — | $ | — | $ | 2,574 | ||||||||
|
|
|
|
|
|
|
|
|
|||||||||
| Total liabilities |
$ | 2,574 | $ | — | $ | — | $ | 2,574 | ||||||||
|
|
|
|
|
|
|
|
|
|||||||||
8. Stockholders’ Equity
Share-based Compensation
The Company currently uses the Black-Scholes-Merton option pricing model to determine the fair value of stock options and employee stock purchase plan shares. The determination of the fair value of share-based payment awards on the date of grant using an option-pricing model is affected by the Company’s stock price as well as assumptions regarding a number of complex and subjective variables. These variables include the expected term of the awards; the Company’s expected stock price volatility over the term of the awards, actual and projected employee stock option exercise behaviors, risk-free interest rate and expected dividends. The Company estimates the expected term of the share-based awards based on its historical option activities including option exercises and holding patterns in accordance with ASC 718-10. The Company estimates the volatility of its common shares based upon its historical stock price volatility over the length of the expected term of the options. The Company bases the risk-free interest rate that it uses in the option valuation model on U.S. Treasury zero-coupon issues with remaining maturities similar to the expected term of the options. The Company does not anticipate paying any cash dividends in the foreseeable future and therefore uses an expected dividend yield of zero in the option valuation model. The Company is required to estimate forfeitures at the time of grant and revise those estimates in subsequent periods if actual forfeitures differ from those estimates. The Company uses historical data to estimate pre-vesting option forfeitures and records share-based compensation expense only for
79
Table of Contents
SABA SOFTWARE, INC.
NOTES TO CONSOLIDATED FINANCIAL STATEMENTS—(Continued)
those awards that are expected to vest. The expected term of employee stock purchase plan shares is the average of the remaining purchase periods under each offering period. The following assumptions have been used to value the awards granted under the Company’s stock option plans and stock purchased under the Employee Stock Purchase Plan:
| Years ended May 31, | ||||||||||||
| 2011 | 2010 | 2009 | ||||||||||
| Stock Options: |
||||||||||||
| Expected volatility |
55 | % | 57 | % | 59 | % | ||||||
| Risk-free interest rates |
1.92 | % | 2.76 | % | 1.60 | % | ||||||
| Expected term (years) |
5.3 | 5.7 | 4.1 | |||||||||
| Expected dividend yield |
0 | % | 0 | % | 0 | % | ||||||
| Employee Stock Purchase Plan: |
||||||||||||
| Expected volatility |
43 | % | 74 | % | 77 | % | ||||||
| Risk-free interest rates |
0.4 | % | 0.4 | % | 0.5 | % | ||||||
| Expected term (years) |
0.5 - 2.0 | 0.5 - 2.0 | 0.5 - 2.0 | |||||||||
| Expected dividend yield |
0 | % | 0 | % | 0 | % | ||||||
The following table summarizes the stock-based compensation expense for stock options, restricted stock units and Employee Stock Purchase Plan shares that was recorded in the Company’s results of operations in accordance with ASC 718-10:
| Years ended May 31, | ||||||||||||
| 2011 | 2010 | 2009 | ||||||||||
| (in thousands) | ||||||||||||
| Cost of revenues |
$ | 403 | $ | 322 | $ | 384 | ||||||
| Research and development |
437 | 393 | 426 | |||||||||
| Sales and marketing |
883 | 478 | 729 | |||||||||
| General and administrative |
1,231 | 715 | 802 | |||||||||
|
|
|
|
|
|
|
|||||||
| Share-based compensation expense included in net income (loss) |
$ | 2,954 | $ | 1,908 | $ | 2,341 | ||||||
|
|
|
|
|
|
|
|||||||
The share-based compensation expense categorized by various equity components is summarized in the table below:
| Years ended May 31, | ||||||||||||
| 2011 | 2010 | 2009 | ||||||||||
| (in thousands) | ||||||||||||
| Stock options |
$ | 2,134 | $ | 1,627 | $ | 2,173 | ||||||
| Restricted stock units |
722 | 220 | 29 | |||||||||
| Employee stock purchase plan |
98 | 61 | 139 | |||||||||
|
|
|
|
|
|
|
|||||||
| Total share-based compensation |
$ | 2,954 | $ | 1,908 | $ | 2,341 | ||||||
|
|
|
|
|
|
|
|||||||
Prior to the fiscal third quarter ended February 28, 2009, the Board of Directors of the Company granted only stock options. The Board of Directors commenced granting restricted stock units (“RSUs”) in addition to stock options during the fiscal third quarter ended February 28, 2009.
RSUs granted by the Board of Directors have been awarded under the Company’s 2000 Stock Incentive Plan (the “2000 Stock Plan”) and the 2009 Stock Incentive Plan (the “2009 Stock Plan”). The RSUs vest in four annual installments commencing on the one year anniversary of the date of the award. Stock-based compensation
80
Table of Contents
SABA SOFTWARE, INC.
NOTES TO CONSOLIDATED FINANCIAL STATEMENTS—(Continued)
expenses for RSUs that were recorded in the Company’s results of operations in accordance with ASC 718-10 for the fiscal year ended May 31, 2011 and 2010 were $0.7 million and $0.2 million, respectively. During the year ended May 31, 2011 and 2010, 139,844 shares and 81,800 shares of the RSUs vested, respectively. In order to satisfy tax withholding obligations that arose on the vesting of restricted stock units, 52,016 and 30,483 shares of common stock pursuant to the Company’s 2000 Stock Plan and 2009 Stock Plan were repurchased in 2011 and 2010 for an aggregate price of approximately $0.4 million and $0.1 million, respectively.
In order to provide an incentive to its employees, the Board of the Company approved a modification of the contractual term of certain vested and unvested options outstanding as of March 10, 2009 to extend their contractual term from six years to ten years. As a result of this modification, incremental share-based compensation expense for vested awards totaling $0.4 million was recorded on March 10, 2009. In addition, incremental share-based compensation expense for unvested awards totaling $0.2 million will be recognized over the remaining vesting periods of the unvested awards that were modified. The incremental share-based compensation expense for vested and unvested awards was determined using the BSM valuation model as the excess of the fair values of the modified replacement awards over the fair value of the existing unmodified awards determined as of March 10, 2009.
As of May 31, 2011, the Company had a total of $3.0 million of unrecognized compensation expense before income tax benefits related to non-vested stock-based compensation arrangements granted under all of its equity compensation plans. Unrecognized compensation cost will be adjusted for future changes in estimated forfeitures and other factors. The Company expects to recognize this cost over a weighted average period of 1.7 years.
Shares of Common Stock Reserved for Future Issuance
As of May 31, 2011, Saba had reserved the following shares of common stock for issuance:
| Stock options outstanding |
5,691,077 | |||
| Restricted Stock Units outstanding |
854,974 | |||
| Awards available for future grant (1) |
3,245,618 | |||
| Employees stock purchase plan |
633,070 | |||
|
|
|
|||
| Total |
10,424,739 | |||
|
|
|
| (1) | For purposes of determining the awards available for future grant, each RSU granted reduces the number of awards available for grant under the 2009 Stock Plan by 1.26 shares and each RSU forfeited increases awards available for grant under the 2009 Stock Plan by 1.26. |
Employee Stock Purchase Plan
Under the Company’s 2000 Employee Stock Purchase Plan (“ESPP”), eligible employees may purchase common stock at 85% of the lesser of the fair market value of Saba’s common stock on the first day of the applicable two-year offering period or the last day of the applicable six-month purchase period. Beginning June 1, 2001, shares reserved for issuance under the ESPP increase annually in increments equal to the lesser of (i) 500,000 shares, (ii) two percent of the outstanding shares at June 1 of each year, or (iii) a lesser number of shares determined by the Board of Directors. An amendment and restatement of the ESPP (the “Amended and Restated ESPP”) was approved by the Company’s stockholders in November 2009. The Amended and Restated ESPP provides eligible employees of the Company and its participating subsidiaries with the opportunity to purchase shares of the Company’s common stock through payroll deductions. The Amended and Restated ESPP
81
Table of Contents
SABA SOFTWARE, INC.
NOTES TO CONSOLIDATED FINANCIAL STATEMENTS—(Continued)
amended and restated the ESPP to (i) extend the term of the ESPP through November 18, 2019, (ii) eliminate the automatic annual share increase provision of the ESPP, (iii) increase the number of shares of common stock reserved for issuance under the ESPP by 261,693 shares, to an aggregate of 1,000,000 shares available for issuance by the Company under the ESPP as of November 18, 2009 and (iv) effect various technical revisions and improvements. Shares issued under the Amended ESPP were 73,749 during fiscal year 2011 and 64,013 during fiscal year 2010. As of May 31, 2011, 633,070 shares were available for issuance under the ESPP.
Stock Option Plans
Under the 1997 Stock Option Plan, as amended, (the “1997 Plan”), options to purchase up to shares of common stock could be granted to employees, directors and consultants at prices not less than the fair market value at the date of grant for incentive stock options (110% in certain circumstances) and not less than 85% of fair market value for non-statutory stock options. Options generally expire ten years from the date of grant and generally vest over four years. The total number of shares reserved for issuance under the 1997 Plan was 2,703,807. As of May 31, 2010, shares are no longer available for issuance under the 1997 Plan.
In January 2000, the Board of Directors adopted the 2000 Stock Incentive Plan (the “2000 Plan”) and reserved 1,500,000 shares for grant under the 2000 Plan. The terms of the 2000 Plan are substantially similar to the 1997 Plan, except that options generally expire six years from the date of grant. Beginning June 1, 2001, stock options reserved for issuance under the 2000 Plan increase annually in increments equal to the lesser of (i) 750,000 shares, (ii) five percent of the outstanding shares on June 1, or (iii) a lesser number of shares determined by the Board of Directors. On January 16, 2009, the Board of Directors implemented and issued from the 2000 Plan, restricted stock units as an incentive to the employees. In addition, on March 10, 2009 the Board of Directors approved a modification of the contractual term of certain options outstanding by extending their contractual term from six to ten years. As of May 31, 2010, shares are no longer available for issuance under the 2000 Plan.
The 2009 Stock Plan was adopted by the Company’s Board in September 2009, subject to the approval of the Company’s stockholders. At the annual meeting of stockholders of the Company held on November 18, 2009, the Company’s stockholders approved the 2009 Stock Plan.
The 2009 Stock Plan allows the Company to make broad-based grants of stock options, stock appreciation rights, restricted stock and restricted stock units to employees, non-employee directors and consultants as key elements of compensation. On March 18, 2011, following Board approval, the Company’s stockholders approved an increase of 3,000,000 shares to the number of shares reserved for issuance under the 2009 Stock Plan, making the total shares reserved for issuance under the 2009 Stock Plan 5,900,000 shares. As of May 31, 2011, there were 3,245,618 shares available for grant.
82
Table of Contents
SABA SOFTWARE, INC.
NOTES TO CONSOLIDATED FINANCIAL STATEMENTS—(Continued)
Details of activity under the 1997 Plan, 2000 Plan and 2009 Plan are as follows:
| Options Outstanding | ||||||||||||||||||||
| Number of Shares |
Weighted- Average Exercise Price Per Share |
Weighted- Average Grante Date Fair Value |
Weighted- Average Remaining Contractual Term |
Aggregate Intrinsic Value |
||||||||||||||||
| Balance, May 31, 2008 |
4,837,009 | $ | 5.02 | |||||||||||||||||
| Granted |
1,286,150 | 1.63 | $ | 0.76 | ||||||||||||||||
| Exercised |
— | — | ||||||||||||||||||
| Canceled |
(1,191,555 | ) | 5.41 | |||||||||||||||||
|
|
|
|||||||||||||||||||
| Balance, May 31, 2009 |
4,931,604 | 4.04 | ||||||||||||||||||
| Granted |
1,317,175 | 4.29 | 2.31 | |||||||||||||||||
| Exercised |
(221,573 | ) | 3.44 | |||||||||||||||||
| Canceled |
(430,079 | ) | 4.34 | |||||||||||||||||
|
|
|
|||||||||||||||||||
| Balance, May 31, 2010 |
5,597,127 | 4.10 | ||||||||||||||||||
| Granted |
1,335,550 | 5.72 | 2.87 | |||||||||||||||||
| Exercised |
(772,925 | ) | 4.04 | |||||||||||||||||
| Canceled |
(468,675 | ) | 4.58 | |||||||||||||||||
|
|
|
|||||||||||||||||||
| Balance, May 31, 2011 |
5,691,077 | 4.45 | ||||||||||||||||||
|
|
|
|||||||||||||||||||
| Exercisable at May 31, 2011 |
3,301,392 | 4.42 | 5.16 | $ | 18,073,159 | |||||||||||||||
| Expected to vest at May 31, 2011 |
2,389,685 | 4.50 | 8.22 | 12,890,935 | ||||||||||||||||
The total fair value of options vested during the year was $2.0 million, $1.7 million and $2.0 million for the years ended May 31, 2011, 2010 and 2009, respectively. The total intrinsic value of options exercised during the year was $2.5 million and $0.3 million for the years ended May 31, 2011 and 2010, respectively.
Additional information regarding options outstanding as of May 31, 2011 is as follows:
| Options Outstanding |
Options Exercisable | |||||||||||||||||||
| Exercise Prices |
Number Outstanding |
Weighted-Average Remaining Contractual Life (Years) |
Weighted-Average Exercise Price |
|||||||||||||||||
| Number | Weighted-Average Exercise Price |
|||||||||||||||||||
| $0.00 - $1.20 |
260,000 | 3.5 | $ | 1.02 | 128,750 | $ | 1.02 | |||||||||||||
| 1.21 - 2.94 |
849,068 | 4.8 | 1.77 | 519,032 | 1.92 | |||||||||||||||
| 2.95 - 3.69 |
354,368 | 4.6 | 3.52 | 292,603 | 3.56 | |||||||||||||||
| 3.70 - 3.89 |
127,250 | 2.8 | 3.78 | 127,250 | 3.78 | |||||||||||||||
| 3.90 - 4.19 |
402,695 | 6.5 | 4.12 | 266,150 | 4.13 | |||||||||||||||
| 4.20 - 5.00 |
1,640,457 | 7.6 | 4.62 | 753,107 | 4.61 | |||||||||||||||
| 5.01 - 5.20 |
237,257 | 5.8 | 5.14 | 224,935 | 5.14 | |||||||||||||||
| 5.21 - 6.39 |
1,249,457 | 7.8 | 6.00 | 549,140 | 6.15 | |||||||||||||||
| 6.40 - 6.60 |
440,425 | 5.0 | 6.40 | 440,425 | 6.40 | |||||||||||||||
| 6.61 - 10.00 |
130,100 | 9.8 | 8.05 | — | — | |||||||||||||||
|
|
|
|
|
|||||||||||||||||
| 5,691,077 | 6.4 | 4.45 | 3,301,392 | 4.42 | ||||||||||||||||
|
|
|
|
|
|||||||||||||||||
83
Table of Contents
SABA SOFTWARE, INC.
NOTES TO CONSOLIDATED FINANCIAL STATEMENTS—(Continued)
Restricted Stock Units
A summary of the Company’s RSU activity and related information for the three years ended May 31, 2011, is as follows:
| Restricted Stock Units Outstanding | ||||||||||||
| Number of Shares |
Weighted- Average Grant Date Fair Value |
Aggregate Intrinsic Value |
||||||||||
| Balance, May 31, 2008 |
— | — | ||||||||||
| Granted |
360,200 | $ | 1.30 | |||||||||
| Vested |
— | — | ||||||||||
| Canceled |
(2,000 | ) | 1.30 | |||||||||
|
|
|
|||||||||||
| Balance, May 31, 2009 |
358,200 | 1.30 | ||||||||||
| Granted |
289,388 | 4.11 | ||||||||||
| Vested |
(81,800 | ) | 1.30 | |||||||||
| Canceled |
(53,125 | ) | 1.64 | |||||||||
|
|
|
|||||||||||
| Balance, May 31, 2010 |
512,663 | 2.85 | ||||||||||
| Granted |
558,500 | 5.31 | ||||||||||
| Vested |
(139,844 | ) | 2.70 | |||||||||
| Canceled |
(76,345 | ) | 3.06 | |||||||||
|
|
|
|||||||||||
| Balance, May 31, 2011 |
854,974 | 4.47 | $ | 8,455,693 | ||||||||
|
|
|
|
|
|
|
|||||||
The total fair value of RSUs vested during the year was $0.4 million and $0.1 million for the years ended May 31, 2011 and 2010, respectively.
Shareholder Rights Plan
On June 2, 2009, the Company entered into a Rights Agreement (the “Rights Agreement”) with Mellon Investor Services LLC, as rights agent. In connection with the Rights Agreement the Board of Directors of the Company authorized and declared a dividend of one right for each outstanding share of the Company common stock to stockholders of record at the close of business on June 15, 2009. Each right entitles the registered holder, subject to the terms of the Rights Agreement, to purchase from the Company one one-thousandth of a share (a “Unit”) of Series A Preferred Stock, par value $0.001 per share at a purchase price of $12.50 per Unit, subject to adjustment. The rights will expire at the close of business June 2, 2012 unless earlier redeemed or exchanged. Until a right is exercised, the holder thereof, as such, will have no rights as one of the Company’s stockholders, including the right to vote or to receive dividends. The rights are not immediately exercisable. Subject to the terms and conditions of the Rights Agreement, they will become exercisable ten business days after a person or group acquires, or commences a tender or exchange offer which would lead to the acquisition of, beneficial ownership of 15% or more of the Company’s outstanding common stock. Once a person or group acquires beneficial ownership of 15% or more of the Company’s outstanding common stock, subject to the terms of the rights agreement, each right not owned by that person or group or certain related parties will entitle its holder to purchase, at the right’s then-current purchase price, units of Series A Preferred Stock or, at the Company’s option, shares of common stock or cash, property or other securities of the Company having a market value equal to twice the then-current purchase price.
84
Table of Contents
SABA SOFTWARE, INC.
NOTES TO CONSOLIDATED FINANCIAL STATEMENTS—(Continued)
9. Income Taxes
The provision for income taxes is comprised of the following:
| Years ended May 31, | ||||||||||||
| 2011 | 2010 | 2009 | ||||||||||
| (in thousands) | ||||||||||||
| Current: |
||||||||||||
| Federal |
$ | 26 | $ | 333 | $ | 37 | ||||||
| Foreign |
624 | 187 | 522 | |||||||||
| State |
117 | 211 | 56 | |||||||||
|
|
|
|
|
|
|
|||||||
| Total current |
767 | 731 | 615 | |||||||||
| Deferred: |
||||||||||||
| Foreign |
(14 | ) | (91 | ) | (142 | ) | ||||||
| Federal |
— | — | 1,383 | |||||||||
|
|
|
|
|
|
|
|||||||
| Total deferred |
(14 | ) | (91 | ) | 1,241 | |||||||
|
|
|
|
|
|
|
|||||||
| Total provision |
$ | 753 | $ | 640 | $ | 1,856 | ||||||
|
|
|
|
|
|
|
|||||||
The components of (loss) income before provision for income taxes for the years ended May 31, 2011, 2010 and 2009 are as follows:
| Years ended May 31, | ||||||||||||
| 2011 | 2010 (As Adjusted) (1) |
2009 (As Adjusted) (1) |
||||||||||
| (in thousands) | ||||||||||||
| United States |
$ | (8,689 | ) | $ | 1,747 | $ | (2,398 | ) | ||||
| Foreign |
2,179 | 1,658 | 1,743 | |||||||||
|
|
|
|
|
|
|
|||||||
| Total loss before provision for income taxes |
$ | (6,510 | ) | $ | 3,405 | $ | (655 | ) | ||||
|
|
|
|
|
|
|
|||||||
| (1) | Certain amounts have been adjusted for the retrospective change in accounting principle for sales commissions. (See Note 2 on the Notes to Consolidated Financial Statements.) |
85
Table of Contents
SABA SOFTWARE, INC.
NOTES TO CONSOLIDATED FINANCIAL STATEMENTS—(Continued)
The Company has not provided U.S. income taxes on certain non-U.S. subsidiaries for which the earnings are permanently reinvested. Deferred income taxes reflect the tax effects of temporary differences between the carrying amounts of assets and liabilities for financial reporting purposes and the amounts used for income tax purposes. The components of deferred tax assets and liabilities are as follows:
| May 31, | ||||||||
| 2011 | 2010 (As Adjusted) (1) |
|||||||
| (in thousands) | ||||||||
| Deferred tax assets: |
||||||||
| Net operating loss carryforwards |
$ | 72,979 | $ | 73,899 | ||||
| Deferred revenue |
2,741 | 1,241 | ||||||
| Accruals |
2,378 | 3,714 | ||||||
| Property, equipment and purchased intangible assets |
461 | 428 | ||||||
| Foreign deferred tax asset |
377 | 301 | ||||||
| Tax credit carryforwards |
4,728 | 5,187 | ||||||
| Stock compensation |
945 | 674 | ||||||
| Valuation allowance |
(83,125 | ) | (82,998 | ) | ||||
|
|
|
|
|
|||||
| Total deferred tax assets |
1,484 | 2,446 | ||||||
| Purchased intangible assets |
(1,532 | ) | (1,972 | ) | ||||
| Capitalized commissions |
(493 | ) | (206 | ) | ||||
| Other |
79 | 33 | ||||||
|
|
|
|
|
|||||
| Net deferred tax (liabilities) assets |
$ | (462 | ) | $ | 301 | |||
|
|
|
|
|
|||||
| (1) | Certain amounts have been adjusted for the retrospective change in accounting principle for sales commissions. (See Note 2 on the Notes to Consolidated Financial Statements.) |
A reconciliation of income tax expense at the statutory federal income tax rate to net income tax expense included in the accompanying consolidated statement of operations is as follows:
| Years ended May 31, | ||||||||||||
| 2011 | 2010 (As Adjusted) (1) |
2009 (As Adjusted) (1) |
||||||||||
| (in thousands) | ||||||||||||
| Income tax (benefit) expense at the federal statutory rate |
$ | (2,278 | ) | $ | 1,191 | $ | (230 | ) | ||||
| State taxes, net of federal benefit |
(286 | ) | 150 | 36 | ||||||||
| Change in valuation allowance |
3,063 | (691 | ) | 863 | ||||||||
| Use of acquired net operating losses |
— | — | 453 | |||||||||
| Non-deductible expenses and other |
180 | 70 | 239 | |||||||||
| Non-deductible stock compensation |
396 | 433 | 907 | |||||||||
| Foreign tax at lower rates |
(284 | ) | (264 | ) | (352 | ) | ||||||
| Prior year true up and other |
208 | 120 | 70 | |||||||||
| R&D credits |
(242 | ) | (101 | ) | (195 | ) | ||||||
| Tax reserve |
(4 | ) | (268 | ) | 65 | |||||||
|
|
|
|
|
|
|
|||||||
| Total |
$ | 753 | $ | 640 | $ | 1,856 | ||||||
|
|
|
|
|
|
|
|||||||
| (1) | Certain amounts have been adjusted for the retrospective change in accounting principle for sales commissions. (See Note 2 on the Notes to Consolidated Financial Statements.) |
86
Table of Contents
SABA SOFTWARE, INC.
NOTES TO CONSOLIDATED FINANCIAL STATEMENTS—(Continued)
The Company’s India subsidiary operated under a 10 year tax holiday until its expiration in 2011. The net impact of the tax holiday expiration is immaterial.
As of May 31, 2011, the Company had net operating loss carryforwards of approximately $198.4 million for federal tax purposes and approximately $63.1 million for state tax purposes. Saba also has research credit carryforwards for federal tax purposes of approximately $3.7 million and approximately $1.5 million for state tax purposes. If not utilized, the federal net operating loss and research credit carryforwards will expire in various amounts from fiscal 2012 through fiscal 2031. The state net operating loss carryforwards will expire in fiscal 2012 through 2031 and the California state research credit will carry forward indefinitely. Utilization of net operating loss and tax credit carryforwards may be subject to substantial annual limitations in the future due to any ownership changes as provided by the Internal Revenue Code and similar state provisions. The annual limitations based on such potential ownership changes could result in the expiration of the net operating loss and tax credit carryforwards before utilization.
A valuation allowance is provided when it is more likely than not that some portion of the deferred tax asset will not be realized. Based on available evidence, including the Company’s history of operating losses, and lack of any carryback potential, the Company has determined that a valuation allowance continues to be necessary for all US deferred tax assets. The deferred taxes of the Company’s India and UK subsidiaries are more likely than not to be realized and therefore no valuation allowance is established against them.
The aggregate changes in the balance of the gross unrecognized tax benefits were as follows (in thousands):
| Years ended May 31, | ||||||||||||
| 2011 | 2010 | 2009 | ||||||||||
| (in thousands) | ||||||||||||
| Beginning balance, gross uncertain tax positions |
$ | 9,980 | $ | 10,618 | $ | 7,289 | ||||||
| Gross increases (decreases) related to prior years’ tax position |
— | (947 | ) | 2,715 | ||||||||
| Gross increases related to current year tax positions |
943 | 462 | 696 | |||||||||
| Lapses of applicable statutes of limitations |
(123 | ) | (153 | ) | (82 | ) | ||||||
| Settlements |
(13 | ) | — | — | ||||||||
| Gross increases related to business combinations |
81 | — | — | |||||||||
|
|
|
|
|
|
|
|||||||
| Ending balance, gross uncertain tax positions |
$ | 10,868 | $ | 9,980 | $ | 10,618 | ||||||
|
|
|
|
|
|
|
|||||||
As of May 31, 2011, $1.1 million of unrecognized benefits would affect the Company’s effective tax rate if realized. The Company recognized interest and penalties related to uncertain tax positions in the provision of income tax line of the consolidated statements of operations during fiscal 2011. The gross amount of interest and penalties accrued as of May 31, 2011 was $0.4 million. Interest released on current year reserve releases was ($0.1) million. Domestically, there are currently no examinations for U. S federal and state taxing authorities. With few exceptions, the Company is no longer subject to U.S. federal, state and local income tax examinations by tax authorities for fiscal years before 2007. In addition, the Company has certain U.S. federal and state tax attribute carryforwards from years before fiscal year 2007 that remain subject to examination until utilized. Internationally, tax authorities from a number of non-U.S. jurisdictions are examining returns affecting unrecognized tax benefits. The Company believes that, as of May 31, 2011, the gross unrecognized tax benefits will not materially change in the next twelve months. The Company believes that it has adequately provided for any reasonably foreseeable outcomes related to any tax audits and that any settlement will not have a material adverse effect on its consolidated financial position or results of operations. However, there can be no assurances as to the possible outcomes.
87
Table of Contents
SABA SOFTWARE, INC.
NOTES TO CONSOLIDATED FINANCIAL STATEMENTS—(Continued)
10. Retirement Plan
The Company has established the Saba Software 401(k) Plan (the “401(k) Plan”) under section 401(k) of the Internal Revenue Code, covering substantially all of its U.S. employees. Under the 401(k) Plan, participating employees may defer a portion of their pretax earnings subject to an annual contribution limit. Saba may also make matching contributions equal to a discretionary percentage of the employees’ deferral. To date, no matching contributions have been made.
11. Segment Information
The Company operates in a single operating segment.
Geographic Information
The following tables represent revenue and long-lived assets information by geographic area as of and for the fiscal years ended May 31, 2011, 2010 and 2009. Long-lived assets consist of property and equipment, goodwill and purchased intangible assets:
| Years ended May 31, | May 31, | |||||||||||||||||||
| Total Revenue | Long-Lived Assets | |||||||||||||||||||
| 2011 | 2010 | 2009 | 2011 | 2010 | ||||||||||||||||
| (in thousands) | (in thousands) | |||||||||||||||||||
| United States |
$ | 74,401 | $ | 74,282 | $ | 72,602 | $ | 45,114 | $ | 43,729 | ||||||||||
| United Kingdom |
17,032 | 16,189 | 14,090 | 230 | 295 | |||||||||||||||
| Rest of the World |
25,224 | 19,099 | 16,129 | 7,993 | 276 | |||||||||||||||
|
|
|
|
|
|
|
|
|
|
|
|||||||||||
| Total |
$ | 116,657 | $ | 109,570 | $ | 102,821 | $ | 53,337 | $ | 44,300 | ||||||||||
|
|
|
|
|
|
|
|
|
|
|
|||||||||||
Major Customers
For fiscal years 2011, 2010 and 2009, no single customer accounted for greater than 10% of revenues.
12. Litigation
Litigation Relating to Initial Public Offering of Saba
In November 2001, a complaint was filed in the United States District Court for the Southern District of New York (the “District Court”) against the Company, certain of its officers and directors, and certain underwriters of the Company’s initial public offering. The complaint was purportedly filed on behalf of a class of certain persons who purchased the Company’s common stock between April 6, 2000 and December 6, 2000. The complaint alleges violations by the Company and its officers and directors of Section 11 of the Securities Act of 1933, as amended (the “Securities Act”), Section 10(b) of the Securities Exchange Act of 1934, as amended (the “Exchange Act”), and other related provisions in connection with certain alleged compensation arrangements entered into by the underwriters in connection with the initial public offering. An amended complaint was filed in April 2002. Similar complaints have been filed against hundreds of other issuers that have had initial public offerings since 1998. The complaints allege that the prospectus and the registration statement for the initial public offering failed to disclose that the underwriters allegedly solicited and received “excessive” commissions from investors and that some investors in the initial public offering agreed with the underwriters to buy additional shares in the aftermarket in order to inflate the price of the Company’s stock. The complaints were later consolidated into a single action. The complaint seeks unspecified damages, attorney and expert fees, and other unspecified litigation costs.
88
Table of Contents
SABA SOFTWARE, INC.
NOTES TO CONSOLIDATED FINANCIAL STATEMENTS—(Continued)
On July 1, 2002, the underwriter defendants in the consolidated actions moved to dismiss all of the actions, including the action involving the Company. On July 15, 2002, the Company, along with other non-underwriter defendants in the coordinated cases, moved to dismiss the litigation. On February 19, 2003, the District Court ruled on the motions. The District Court granted the Company’s motion to dismiss the claims against the Company under Rule 10b-5, due to the insufficiency of the allegations against the Company. The District Court also granted the motion of the individual defendants, Bobby Yazdani and Terry Carlitz, the Company’s Chief Executive Officer and Chairman of the Board and former Chief Financial Officer and a member of the Company’s Board of Directors, to dismiss the claims against them under Rule 10b-5 and Section 20 of the Exchange Act. The motions to dismiss the claims under Section 11 of the Securities Act were denied as to virtually all of the defendants in the consolidated cases, including the Company.
In June 2003, a proposed collective partial settlement of this litigation was structured between the plaintiffs, the issuer defendants in the consolidated actions, the issuer officers and directors named as defendants, and the issuers’ insurance companies. In June 2004, an agreement of partial settlement was submitted to the District Court for preliminary approval. The District Court granted the preliminary approval motion on February 15, 2005, subject to certain modifications. On August 31, 2005 the District Court issued a preliminary order further approving the modifications to the settlement and certifying the settlement classes. The District Court also appointed the notice administrator for the settlement and ordered that notice of the settlement be distributed to all settlement class members by January 15, 2006. The settlement fairness hearing occurred on April 24, 2006, and the court reserved decision at that time.
While the partial settlement was pending approval, the plaintiffs continued to litigate against the underwriter defendants. The District Court directed that the litigation proceed within a number of “focus cases” rather than in all of the 310 cases that have been consolidated. The Company’s case is not one of these focus cases. On October 13, 2004, the District Court certified the focus cases as class actions. The underwriter defendants appealed that ruling, and on December 5, 2006, the Court of Appeals for the Second Circuit reversed the District Court’s class certification decision. On April 6, 2007, the Second Circuit denied plaintiffs’ petition for rehearing. In light of the Second Circuit opinion, counsel for the issuer defendants informed the District Court that this settlement could not be approved because the defined settlement class, like the litigation class, could not be certified. On June 25, 2007, the District Court entered an order terminating the settlement agreement. On August 14, 2007, the plaintiffs filed their second consolidated amended class action complaints against the focus cases and on September 27, 2007, again moved for class certification. On November 12, 2007, certain of the defendants in the focus cases moved to dismiss the second consolidated amended class action complaints. On March 26, 2008, the District Court denied the motions to dismiss except as to Section 11 claims raised by those plaintiffs who sold their securities for a price in excess of the initial offering price and those who purchased outside the previously certified class period. Briefing on the class certification motion was completed in May 2008. That motion was withdrawn without prejudice on October 10, 2008.
On April 2, 2009, a stipulation and agreement of settlement among the plaintiffs, issuer defendants and underwriter defendants was submitted to the Court for preliminary approval. The Court granted the plaintiffs’ motion for preliminary approval and preliminarily certified the settlement classes on June 10, 2009. The settlement fairness hearing was held on September 10, 2009. On October 5, 2009, the Court entered an opinion granting final approval to the settlement and directing that the Clerk of the Court close these actions. Appeals of the opinion granting final approval were filed, and the appeals filed by one objector have been remanded to the district court to determine standing to appeal.
The Company intends to dispute these claims and defend the lawsuit vigorously. However, due to the inherent uncertainties of litigation and because the settlement remains subject to appeal,, the ultimate outcome of the litigation is uncertain. An unfavorable outcome in litigation could materially and adversely affect the Company’s business, financial condition and results of operations.
89
Table of Contents
SABA SOFTWARE, INC.
NOTES TO CONSOLIDATED FINANCIAL STATEMENTS—(Continued)
Litigation Relating to Centra’s Initial Public Offering
Centra, certain of its former officers and directors and the managing underwriters of Centra’s initial public offering were named as defendants in an action filed in the District Court. The plaintiffs filed an initial complaint on December 6, 2001 and purported to serve the Centra defendants on or about March 18, 2002. The original complaint has been superseded by an amended complaint filed in April 2002. The action, captioned in re Centra Software, Inc. Initial Public Offering Securities Litigation, No. 01 CV 10988, is purportedly brought on behalf of the class of persons who purchased Centra’s common stock between February 3, 2000 and December 6, 2000. The complaint asserts claims under Sections 11 and 15 of the Securities Act and Sections 10(b) and 20(a) of the Exchange Act. The complaint alleges that, in connection with Centra’s initial public offering in February 2000, the underwriters received undisclosed commissions from certain investors in exchange for allocating shares to them and also agreed to allocate shares to certain customers in exchange for the agreement of those customers to purchase additional shares in the aftermarket at pre-determined prices. The complaint asserts that Centra’s registration statement and prospectus for the offering were materially false and misleading due to their failure to disclose these alleged arrangements. The complaint seeks damages in an unspecified amount against Centra and the named individuals. Similar complaints have been filed against hundreds of other issuers that have had initial public offerings since 1998; the complaints have been consolidated into an action captioned in re Initial Public Offering Securities Litigation, No. 21 MC 92.
On July 1, 2002, the underwriter defendants in the consolidated actions moved to dismiss all the actions, including the action involving Centra. On July 15, 2002, Centra, along with other non-underwriter defendants in the coordinated cases, moved to dismiss the litigation. On October 9, 2002, pursuant to agreements tolling the statute of limitations for claims related to the litigation, the plaintiffs dismissed, without prejudice, the claims against the named Centra officers and directors in the above-referenced action. Subsequent addenda to the agreements extended the tolling period through August 27, 2010. On February 19, 2003, the District Court issued an order denying the motion to dismiss the claims against Centra under Rule 10b-5. The motions to dismiss the claims under Section 11 of the Securities Act were denied as to virtually all of the defendants in the consolidated cases, including Centra.
In June 2003, a proposed collective partial settlement of this litigation was structured between the plaintiffs, the issuer defendants in the consolidated actions, the issuer officers and directors named as defendants, and the issuers’ insurance companies. In June 2004, an agreement of settlement was submitted to the District Court for preliminary approval. The District Court granted the preliminary approval motion on February 15, 2005, subject to certain modifications. On August 31, 2005 the District Court issued a preliminary order further approving the modifications to the settlement and certifying the settlement classes. The District Court also appointed the notice administrator for the settlement and ordered that notice of the settlement be distributed to all settlement class members by January 15, 2006. The settlement fairness hearing occurred on April 24, 2006, and the court reserved decision at that time.
While the partial settlement was pending approval, the plaintiffs continued to litigate against the underwriter defendants. The District Court directed that the litigation proceed within a number of “focus cases” rather than in all of the 310 cases that have been consolidated. The Company’s case is not one of these focus cases. On October 13, 2004, the District Court certified the focus cases as class actions. The underwriter defendants appealed that ruling, and on December 5, 2006, the Court of Appeals for the Second Circuit reversed the District Court’s class certification decision. On April 6, 2007, the Second Circuit denied plaintiffs’ petition for rehearing. In light of the Second Circuit opinion, counsel for the issuer defendants informed the District Court that this settlement could not be approved because the defined settlement class, like the litigation class, could not be certified. On June 25, 2007, the District Court entered an order terminating the settlement agreement. On August 14, 2007, the plaintiffs filed their second consolidated amended class action complaints against the focus cases and on September 27, 2007, again moved for class certification. On November 12, 2007, certain of the
90
Table of Contents
SABA SOFTWARE, INC.
NOTES TO CONSOLIDATED FINANCIAL STATEMENTS—(Continued)
defendants in the focus cases moved to dismiss the second consolidated amended class action complaints. On March 26, 2008, the District Court denied the motions to dismiss except as to Section 11 claims raised by those plaintiffs who sold their securities for a price in excess of the initial offering price and those who purchased outside the previously certified class period. Briefing on the class certification motion was completed in May 2008. That motion was withdrawn without prejudice on October 10, 2008.
On April 2, 2009, a stipulation and agreement of settlement among the plaintiffs, issuer defendants and underwriter defendants was submitted to the Court for preliminary approval. The Court granted the plaintiffs’ motion for preliminary approval and preliminarily certified the settlement classes on June 10, 2009. The settlement fairness hearing was held on September 10, 2009. On October 5, 2009, the Court entered an opinion granting final approval to the settlement and directing that the Clerk of the Court close these actions. On August 26, 2010, based on the expiration of the tolling period stated in the agreements between the plaintiffs and the named Centra officers and directors, the plaintiffs filed a notice to terminate the tolling agreement and recommence litigation against the named Centra officers and directors. The plaintiffs stated to the Court that they do not intend to take any further action against the named Centra officers and directors at this time. Appeals of the opinion granting final approval were filed, and the appeals filed by one objector were remanded to the district court to determine standing to appeal.
The Company, on behalf of Centra, intends to dispute these claims and defend the lawsuit vigorously. However, due to the inherent uncertainties of litigation and because the settlement remains subject to appeal, the ultimate outcome of the litigation is uncertain. An unfavorable outcome in litigation could materially and adversely affect the Company’s business, financial condition and results of operations.
Litigation Relating to Claim of Patent Infringement by Centra
On August 19, 2003, a complaint was filed against Centra and two other defendants by EdiSync Systems, LLC, in the United States District Court for the District of Colorado (No. 03-D-1587 (OES)) (the “Colorado District Court”). The complaint alleges infringement of two patents for a remote multiple user editing system and method and seeks permanent injunctive relief against continuing infringement, compensatory damages in an unspecified amount, and interest, costs and expenses associated with the litigation. Centra filed an answer to the complaint denying all of the allegations. No amount has been accrued related to this matter and legal costs incurred in the defense of the matter are being expensed as incurred. Centra filed a request for reexamination of the patents at issue with the U.S. Patent and Trademark Office (the “Patent Office”). The Company’s patent counsel is of the opinion that claims of the patents involved in the suit are invalid. The re-examination request was accepted by the Patent Office and the Colorado District Court approved the parties’ motion to stay the court proceedings during the re-examination proceedings. A reexamination certificate has been issued for one of the patents that canceled all of the patent’s claims, thereby rendering that patent of no further force or effect. The Patent Office issued a reexamination certificate for the other patent canceling all of the patent’s original claims and allowing certain newly-added claims. The Company believes that it is free from liability for actions prior to April 18, 2009, as the Company believes the newly-added claims would be enforceable only prospectively as of the issue date of the reexamination certificate. Centra has since filed a second reexamination request asking the Patent Office to reconsider the patentability of the newly-added claims in view of newly-discovered prior art and the Patent Office has granted that request. The Colorado District Court again stayed the litigation pending the outcome of the second reexamination proceeding. On July 15, 2011, EdiSync made a filing with the Patent Office requesting the entry of various amendments to the pending claims and indicating that the Patent Office had agreed that such claims would be found patentable in view of those amendments. The Company believes that it has meritorious defenses with respect to any future claims and intends to vigorously defend this action. However, due to the inherent uncertainties of litigation, the Company cannot accurately predict the ultimate outcome of the litigation. An unfavorable outcome of the litigation could materially and adversely affect the Company’s business, financial condition and results of operations.
91
Table of Contents
SABA SOFTWARE, INC.
NOTES TO CONSOLIDATED FINANCIAL STATEMENTS—(Continued)
Litigation Relating to Claim of Patent Infringement by Saba
On November 19, 2007, a complaint was filed against the Company and ten other defendants by Gemini IP, LLC (“Gemini”), in the United States District Court for the Eastern District of Texas (No. 07-CV-521) (the “Texas District Court”). The complaint alleges infringement of a patent directed to a method for processing client help requests using a computer network and seeks permanent injunctive relief against continuing infringement, compensatory damages in an unspecified amount, and interest, costs and expenses associated with the litigation. The Company filed an answer to the complaint denying all of the allegations. At the Company’s request, the Patent Office instituted reexamination proceedings against the asserted patent and the Texas District Court stayed the action pending the outcome of those proceedings. On September 14, 2010, the Patent Office issued a Reexamination Certificate cancelling all of the patent’s original claims that were asserted against the Company in the litigation. The Reexamination Certificate also includes several new claims that were added during the reexamination proceeding. The Company settled the litigation for an immaterial amount, and the case was dismissed with prejudice on May 31, 2011.
13. Guarantees
The Company enters into license agreements that generally provide indemnification against intellectual property claims for its customers. To date, the Company has not incurred any material costs as a result of such indemnifications and has not accrued any liabilities related to such obligations in its consolidated financial statements.
The Company’s license agreements also generally include a warranty that its software products will substantially operate as described in the applicable program documentation generally for a period of 90 days after delivery. To date, the Company has not incurred or accrued any material costs associated with these warranties.
Other guarantees include promises to indemnify, defend and hold harmless each of the Company’s executive officers, non-employee directors and certain key employees from and against losses, damages and costs incurred by each such individual in administrative, legal or investigative proceedings arising from alleged wrongdoing by the individual while acting in good faith within the scope of his or her job duties on behalf of the Company. Historically, minimal costs have been incurred relating to such indemnifications and, as such, no accruals for these guarantees have been made.
14. Restructuring
During fiscal year 2009, management approved and initiated a plan to decrease costs during the third and fourth quarters by eliminating approximately 5% of the workforce across all functions (the “2009 Plan”). The restructuring eliminated 23 positions during the third quarter, 19 positions in the fourth quarter and charges for the workforce reduction consisted primarily of severance and fringe benefits. The restructuring charges are classified as Restructuring on the statement of operations and totaled approximately $0.5 million during the six months ended May 31, 2009 of which approximately $0.4 million had been paid as of May 31, 2009. The total accrued restructuring balance of $0.1 million was adjusted and paid off by the end of the second quarter of fiscal year ended May 31, 2010.
15. Related Party Transactions
During fiscal years 2011, 2010 and 2009, Saba licensed its software and sold related support and services to Varian Medical Systems, Inc. (“Varian”) and Masimo Corporation (“Masimo”). The Executive Vice President of Varian and the Chairman and Chief Executive Officer of Masimo serve as directors on Saba’s Board of Directors.
92
Table of Contents
SABA SOFTWARE, INC.
NOTES TO CONSOLIDATED FINANCIAL STATEMENTS—(Continued)
During fiscal years 2011, 2010 and 2009, the components of related party transactions and movements were as follows:
| Years ended May 31, | May 31, | |||||||||||||||||||
| Sales to Related Party | Accounts Receivable | |||||||||||||||||||
| 2011 | 2010 | 2009 | 2011 | 2010 | ||||||||||||||||
| (in thousands) | (in thousands) | |||||||||||||||||||
| Varian Medical Systems, Inc. |
$ | 240 | $ | 252 | $ | 291 | $ | 39 | $ | 52 | ||||||||||
| Masimo Corporation |
— | 12 | 11 | — | — | |||||||||||||||
|
|
|
|
|
|
|
|
|
|
|
|||||||||||
| Total |
$ | 240 | $ | 264 | $ | 302 | $ | 39 | $ | 52 | ||||||||||
|
|
|
|
|
|
|
|
|
|
|
|||||||||||
On August 28, 2009, the Company repurchased 1,384,920 shares of its common stock directly from funds managed by FirstMark Capital L.L.C. in a negotiated transaction for an aggregate purchase price of $4.85 million. Lawrence D. Lenihan, Jr., a former member of the Company’s Board of Directors until July 17, 2009, is the Chief Executive Officer and Managing Director of FirstMark Capital, LLC.
93
Table of Contents
ITEM 9: CHANGES IN AND DISAGREEMENTS WITH ACCOUNTANTS ON ACCOUNTING AND FINANCIAL DISCLOSURE
None.
ITEM 9A: CONTROLS AND PROCEDURES
| (a) | Evaluation of disclosure controls and procedures. |
Saba Software maintains disclosure controls and procedures that are designed to ensure that information required to be disclosed in our reports filed pursuant to the Securities Exchange Act of 1934, as amended (the “Exchange Act”), is recorded, processed, summarized and reported within the time periods specified in the Securities and Exchange Commission’s rules and forms and that such information is accumulated and communicated to our management, including our Chief Executive Officer and Chief Financial Officer, as appropriate, to allow for timely decisions regarding required disclosure. In designing and evaluating the disclosure controls and procedures, management recognizes that any controls and procedures, no matter how well designed and operated, can provide only reasonable assurance of achieving the desired control objectives, and management is required to apply its judgment in evaluating the cost-benefit relationship of possible controls and procedures.
We, under the supervision and with the participation of our management, including our Chief Executive Officer and Chief Financial Officer, have evaluated the effectiveness of the design and operation of our disclosure controls and procedures. Based on that evaluation, our Chief Executive Officer and Chief Financial Officer have concluded that our disclosure controls and procedures were effective as of May 31, 2011 at the reasonable assurance level described above.
| (b) | Changes in internal control over financial reporting. |
We regularly review our system of internal control over financial reporting and make changes to our processes and systems to improve controls and increase efficiency, while ensuring that we maintain an effective internal control environment. Changes may include such activities as implementing new, more efficient systems, consolidating activities, and migrating processes.
There were no changes in our internal control over financial reporting during our fiscal fourth quarter ended May 31, 2011 that have materially affected, or are reasonably likely to materially affect, our internal control over financial reporting.
| (c) | Management’s report on internal control over financial reporting. |
Our management is responsible for establishing and maintaining adequate internal control over financial reporting for Saba. Our internal control over financial reporting is a process designed to provide reasonable assurance regarding the reliability of financial reporting and the preparation of financial statements for external purposes in accordance with U.S. generally accepted accounting principles. Saba’s internal control over financial reporting includes those policies and procedures that (i) pertain to the maintenance of records that, in reasonable detail, accurately and fairly reflect the transactions and dispositions of the assets of Saba; (ii) provide reasonable assurance that transactions are recorded as necessary to permit preparation of financial statements in accordance with generally accepted accounting principles, and that our receipts and expenditures are being made only in accordance with authorizations of our management and directors; and (iii) provide reasonable assurance regarding prevention or timely detection of unauthorized acquisition, use, or disposition of our assets that could have a material effect on the financial statements.
94
Table of Contents
Saba’s management assessed the effectiveness of our internal control over financial reporting as of May 31, 2011, utilizing the criteria set forth by the Committee of Sponsoring Organizations of the Treadway Commission (“COSO”) in Internal Control-Integrated Framework. Based on the assessment by our management, we determined that Saba’s internal control over financial reporting was effective as of May 31, 2011. The effectiveness of our internal control over financial reporting as of May 31, 2011 has been audited by Ernst & Young LLP, an independent registered public accounting firm, as stated in their report which is included in Part II, Item 8 of this Annual Report on Form 10-K.
| /s/ BOBBY YAZDANI Bobby Yazdani |
Chief Executive Officer and Chairman of |
August 5, 2011 | ||
| /s/ WILLIAM SLATER William Slater |
Chief Financial Officer |
August 5, 2011 | ||
None.
95
Table of Contents
ITEM 10: DIRECTORS, EXECUTIVE OFFICERS AND CORPORATE GOVERNANCE
Information with respect to this item is incorporated by reference from our definitive proxy statement for our 2011 annual meeting of stockholders to be filed with the SEC within 120 days of the end of our fiscal year ended May 31, 2011.
We have adopted a code of ethics that is designed to qualify as a “code of ethics” within the meaning of Section 406 of the Sarbanes-Oxley Act of 2002 and the rules promulgated thereunder. This code of ethics is available on our website at www.saba.com. To the extent required by law, any amendments to, or waivers from, any provision of the code of ethics will be promptly disclosed to the public. To the extent permitted by such legal requirements, we intend to make such public disclosure by posting the relative material on our website in accordance with SEC rules.
ITEM 11: EXECUTIVE COMPENSATION
Information with respect to this item is incorporated by reference from our definitive proxy statement for our 2011 annual meeting of stockholders to be filed with the SEC within 120 days of the end of our fiscal year ended May 31, 2011.
ITEM 12: SECURITY OWNERSHIP OF CERTAIN BENEFICIAL OWNERS AND MANAGEMENT AND RELATED STOCKHOLDER MATTERS
Equity Compensation Plan Information
The following table gives information about our common stock that may be issued upon the exercise of options, warrants and rights under all of our existing equity compensation plans as of May 31, 2011, including the 1997 Stock Incentive Plan, the 2000 Stock Incentive Plan, the 2009 Stock Incentive Plan and the 2000 Employee Stock Purchase Plan.
| (a) Number of securities to be issued upon exercise of outstanding options, warrants, and rights |
(b) Weighted-average exercise price of outstanding options, warrants, and rights |
(c) Number of securities remaining available for future issuance under equity compensation plans (excluding securities reflected in column(a)) |
||||||||||
| Equity compensation plans approved by security holders: |
||||||||||||
| Option Plans |
5,691,077 | $ | 4.45 | 3,245,618 | ||||||||
| Restricted Stock Units |
854,974 | — | — | |||||||||
| Employee Stock Purchase Plan |
— | — | 633,070 | |||||||||
Information with respect to this item is incorporated by reference from our definitive proxy statement for our 2011 annual meeting of stockholders to be filed with the SEC within 120 days of the end of our fiscal year ended May 31, 2011.
ITEM 13: CERTAIN RELATIONSHIPS AND RELATED TRANSACTIONS, AND DIRECTOR INDEPENDENCE
Information with respect to this item is incorporated by reference from our definitive proxy statement for our 2011 annual meeting of stockholders to be filed with the SEC within 120 days of the end of our fiscal year ended May 31, 2011.
96
Table of Contents
ITEM 14: PRINCIPAL ACCOUNTANT FEES AND SERVICES
Information with respect to this item is incorporated by reference from our definitive proxy statement for our 2011 annual meeting of stockholders to be filed with the SEC within 120 days of the end of our fiscal year ended May 31, 2011.
97
Table of Contents
ITEM 15: EXHIBITS AND FINANCIAL STATEMENT SCHEDULES
(a) The following documents are filed as part of this Annual Report on Form 10-K:
1. Financial Statements
2. Financial Statement Schedules
All schedules have been omitted as they are either not required or not applicable, or the required information is included in the consolidated financial statements or notes thereto.
3. Index to Exhibits
See Exhibits Index on page.
98
Table of Contents
Pursuant to the requirements of Section 13 or 15(d) of the Securities Exchange Act of 1934, the registrant has duly caused this report to be signed on its behalf by the undersigned, thereunto duly authorized.
| SABA SOFTWARE, INC. | ||
| By: |
/s/ BOBBY YAZDANI | |
| Bobby Yazdani | ||
| Chief Executive Officer and Chairman of the Board | ||
Dated: August 5, 2011
POWER OF ATTORNEY
KNOW ALL PERSONS BY THESE PRESENTS, that each person whose signature appears below constitutes and appoints each of Bobby Yazdani and William Slater as his true and lawful attorneys-in-fact and agents, with full power of substitution and resubstitution, for him and in his name, place and stead, in any and all capacities, to sign any and all amendments (including post-effective amendments) to this Report on Form 10-K, and to file the same, with all exhibits thereto, and other documents in connection therewith, with the Securities and Exchange Commission, granting unto said attorneys-in-fact and agents, and each of them, full power and authority to do and perform each and every act and thing requisite and necessary to be done in connection therewith and about the premises, as fully to all intents and purposes as he might or could do in person, hereby ratifying and confirming all that said attorneys-in-fact and agents, or any of them, or their or his substitute or substitutes, may lawfully do or cause to be done by virtue hereof.
99
Table of Contents
Pursuant to the requirements of the Securities Exchange Act of 1934, this report has been signed below by the following persons on behalf of the registrant and in the capacities and on the dates indicated:
| Signature |
Title |
Date | ||
| /s/ BOBBY YAZDANI Bobby Yazdani |
Chief Executive Officer and Chairman of the Board (Principal Executive Officer) |
August 5, 2011 | ||
| /s/ WILLIAM SLATER William Slater |
Chief Financial Officer (Principal Financial and Accounting Officer) |
August 5, 2011 | ||
| /s/ MICHAEL ABBOTT Michael Abbott |
Director |
August 5, 2011 | ||
| /s/ MIKE FAWKES Mike Fawkes |
Director |
August 5, 2011 | ||
|
Joe E. Kiani |
Director |
August 5, 2011 | ||
| /s/ WILLIAM M. KLEIN William M. Klein |
Director |
August 5, 2011 | ||
| /s/ WILLIAM N. MACGOWAN William M. MacGowan |
Director |
August 5, 2011 | ||
| /s/ WILLIAM V. RUSSELL William V. Russell |
Director |
August 5, 2011 | ||
| /s/ DOW R. WILSON Dow R. Wilson |
Director |
August 5, 2011 | ||
100
Table of Contents
EXHIBIT INDEX
| Exhibit |
Document | |
| 3.1(1) | Amended and Restated Certificate of Incorporation of the Company effective as of April 12, 2000. | |
| 3.2(2) | Amendment to Amended and Restated Certificate of Incorporation of the Company effective as of May 12, 2003. | |
| 3.3(3) | Amendment to Amended and Restated Certificate of Incorporation of the Company effective as of November 19, 2004. | |
| 3.4( 9 ) | Certificate of Designation of the Series A Preferred Stock, as filed with the Secretary of State of Delaware on June 2, 2009. | |
| 3.5(13) | Amended and Restated Bylaws of the Company effective as of November 17, 2010. | |
| 4.1(9) | Rights Agreement by and between the Company and Mellon Investor Services LLC dated June 2, 2009. | |
| 4.2 | Reference is made to Exhibits 3.1 through 3.5. | |
| 10.1(4) | Form of Indemnification Agreement between the Company and each of its officers and directors. | |
| *10.2(4) | 1997 Stock Incentive Plan. | |
| *10.3(4) | Form of 2000 Stock Incentive Plan. | |
| *10.4(4) | Form of 2000 Employee Stock Purchase Plan. | |
| *10.5 (14) | Amended and Restated 2009 Stock Incentive Plan. | |
| *10.6 (14) | Amended and Restated 2000 Employee Stock Purchase Plan | |
| *10.7(5) | Form of Notice of Option Grant for Certain Executive Officers. | |
| *10.8 (12) | Form of Restricted Stock Unit Agreement Under 2000 Stock Incentive Plan. | |
| *10.9(15) | Form of Stock Option Agreement Under 2009 Stock Incentive Plan. | |
| *10.10(15) | Form of Restricted Stock Unit Agreement Under 2009 Stock Incentive Plan. | |
| 10.12(20) | Third Amendment to Lease effective as of August 31, 2010, by and between Westport Office Park, LLC and the Company | |
| 10.13(11) | Amended and Restated Loan and Security Agreement dated as of July 29, 2009, by and between the Company and Silicon Valley Bank. | |
| *10.14(8) | Amended and Restated Employment Agreement, effective April 8, 2009, by and between the Company and Bobby Yazdani | |
| *10.15(8) | Amended and Restated Employment Agreement, effective April 8, 2009, by and between the Company and Peter E. Williams III. | |
| *10.16(6) | Executive Officers’ Incentive Plan (Second Half Fiscal Year 2009). | |
| *10.17(10) | Executive Officers’ Incentive Plan (Fiscal Year 2010). | |
| *10.18(7) | Employment Agreement, effective December 8, 2008, by and between the Company and William Slater. | |
| *10.19(8) | Amended and Restated Employment Agreement, effective April 8, 2009, by and between the Company and William Slater. | |
| *10.20 | Amendment to Employment Agreement, effective June 22, 2011, by and between the Company and William Slater. | |
| *10.21(16) | Employment Agreement, effective April 1, 2009, by and between the Company and Jeffrey T. Carr. | |
| *10.22 | Offer Letter, effective June 1, 2011, from the Company to Shawn Farshchi. | |
101
Table of Contents
| Exhibit |
Document | |
| 10.23(19) | Credit Agreement, effective November 22, 2010, by and among the Company, the subsidiary guarantors and Wells Fargo Bank, National Association | |
| 10.24(17) | Amended and Restated Credit Agreement, effective as of June 27, 2011, by and among the Company, the subsidiary guarantors and Wells Fargo Bank, National Association. | |
| 21.1 | List of Subsidiaries of the Company. | |
| 23.1 | Consent of Independent Registered Public Accounting Firm. | |
| 24.1(21) | Power of Attorney. | |
| 31.1 | Certification of Bobby Yazdani, Chief Executive Officer and Chairman of the Board, pursuant to Section 302 of the Sarbanes-Oxley Act of 2002. | |
| 31.2 | Certification of William Slater, Chief Financial Officer, pursuant to Section 302 of the Sarbanes-Oxley Act of 2002. | |
| 32.1 | Certification of Bobby Yazdani, Chief Executive Officer and Chairman of the Board, pursuant to Section 906 of the Sarbanes-Oxley Act of 2002. | |
| 32.2 | Certification of William Slater, Chief Financial Officer, pursuant to Section 906 of the Sarbanes-Oxley Act of 2002. | |
| (1) | Incorporated by reference to Exhibit 3.2 to the Company’s Registration Statement on Form S-1 (Registration No. 333-95761). |
| (2) | Incorporated by reference to Exhibit 3.3 to the Company’s Quarterly Report on Form 10-Q for the quarter ended November 30, 2003. |
| (3) | Incorporated by reference to the Company’s Quarterly Report on Form 10-Q for the period ended November 30, 2004. |
| (4) | Incorporated by reference to the same number exhibit previously filed with the Company’s Registration Statement on Form S-1 (Registration No. 333-95761). |
| (5) | Incorporated by reference to the Company’s Annual Report on Form 10-K filed August 30, 2004. |
| (6) | Incorporated by reference to the Company’s Current Report on Form 8-K filed January 9, 2009. |
| (7) | Incorporated by reference to the Company’s Quarterly Report on Form 10-Q filed January 9, 2009. |
| (8) | Incorporated by reference to the Company’s Quarterly Report on Form 10-Q filed April 8, 2009. |
| (9) | Incorporated by reference to the Company’s Current Report on Form 8-K filed June 2, 2009. |
| (10) | Incorporated by reference to the Company’s Current Report on Form 8-K filed July 21, 2009. |
| (11) | Incorporated by reference to the Company’s Current Report on Form 8-K filed July 31, 2009. |
| (12) | Incorporated by reference to the Company’s Annual Report on Form 10-K filed August 12, 2009. |
| (13) | Incorporated by reference to the Company’s Current Report on Form 8-K filed July 18, 2011. |
| (14) | Incorporated by reference to the Company’s Current Report on Form 8-K filed November 24, 2009. |
| (15) | Incorporated by reference to the Company’s Quarterly Report on Form 10-Q filed April 9, 2010. |
| (16) | Incorporated by reference to the Company’s Annual Report on Form 10-K filed August 12, 2010. |
| (17) | Incorporated by reference to the Company’s Current Report on Form 8-K filed July 1, 2011. |
| (18) | Incorporated by reference to the Company’s Current Report on Form 8-K filed March 21, 2011. |
| (19) | Incorporated by reference to the Company’s Current Report on Form 8-K filed November 23, 2010. |
| (20) | Incorporated by reference to the Company’s Quarterly Report on Form 10-Q filed October 7, 2010. |
| (21) | Included on the signature page to this Annual Report on Form 10-K. |
| * | Management contracts or compensatory plans or arrangements. |
102