Attached files
| file | filename |
|---|---|
| 8-K - KAI FORM 8-K 7-28-2011 - KADANT INC | kaiform8k7282011.htm |

Second Quarter 2011 Business Review
Jonathan W. Painter, President & CEO
Thomas M. O’Brien, Executive Vice President & CFO

*
KAI 2Q11 Business Review-July 28, 2011
© 2011 Kadant Inc. All rights reserved.
Forward-Looking Statements
The following constitutes a “Safe Harbor” statement under the Private Securities Litigation Reform
Act of 1995: This presentation contains forward-looking statements that involve a number of risks
and uncertainties, including forward-looking statements about our expected future financial and
operating performance, demand for our products, industry and economic outlook, and pending
orders. There can be no assurance that we will be able to record bookings or recognize revenues on
the pending orders described in this presentation. Our actual results may differ materially from
these forward-looking statements as a result of various important factors, including those set forth
under the heading "Risk Factors" in Kadant's quarterly report on Form 10-Q for the quarter ended
April 2, 2011. These include risks and uncertainties relating to our dependence on the pulp and
paper industry; significance of sales and operation of manufacturing facilities in China; our ability to
expand capacity in China to meet demand; commodity and component price increases or shortages;
international sales and operations; competition; soundness of suppliers and customers; our
effective tax rate; future restructurings; soundness of financial institutions; our debt obligations;
restrictions in our credit agreement; litigation and warranty costs related to our discontinued
operation; our acquisition strategy; protection of patents and proprietary rights; fluctuations in our
share price; and anti-takeover provisions. We undertake no obligation to publicly update any
forward-looking statement, whether as a result of new information, future events, or otherwise.
2

*
KAI 2Q11 Business Review-July 28, 2011
© 2011 Kadant Inc. All rights reserved.
Use of Non-GAAP Financial Measures
In addition to the financial measures prepared in accordance with generally accepted accounting
principles (GAAP), we use certain non-GAAP financial measures, including increases or decreases in
revenues excluding the effect of foreign currency translation, adjusted operating income, earnings
before interest, taxes, depreciation, and amortization (EBITDA), and adjusted EBITDA.
principles (GAAP), we use certain non-GAAP financial measures, including increases or decreases in
revenues excluding the effect of foreign currency translation, adjusted operating income, earnings
before interest, taxes, depreciation, and amortization (EBITDA), and adjusted EBITDA.
A reconciliation of those numbers to the most directly comparable U.S. GAAP financial measures is
shown in our 2011 second quarter earnings press release issued July 27, 2011, which is available in
the Investors section of our website at www.kadant.com under the heading Investors News.
shown in our 2011 second quarter earnings press release issued July 27, 2011, which is available in
the Investors section of our website at www.kadant.com under the heading Investors News.
3

*
KAI 2Q11 Business Review-July 28, 2011
© 2011 Kadant Inc. All rights reserved.
Financial Classifications
All geographic revenues and bookings data are attributed to regions based on selling locations. For
North America and China, this also approximates revenues and bookings based on where the
equipment is shipped to and installed. Our European geographic data, however, includes revenues
and bookings that may be shipped to and installed outside Europe, including South America, Africa,
the Middle East, and certain countries in Asia (excluding China).
Prior period amounts for Parts and Consumables revenues and bookings have been reclassified to
include amounts from our “other” category within the Papermaking Systems segment and Fiber-
based products.
include amounts from our “other” category within the Papermaking Systems segment and Fiber-
based products.
Beginning with 2011, our Accessories product line is now reported as Doctoring.
4

*
KAI 2Q11 Business Review-July 28, 2011
© 2011 Kadant Inc. All rights reserved.
BUSINESS REVIEW
Jonathan W. Painter
President & CEO
5

*
KAI 2Q11 Business Review-July 28, 2011
© 2011 Kadant Inc. All rights reserved.
Financial Highlights
|
|
Q2 2011
|
Q2 2010
|
|
Revenues
|
$82.5 million
|
$69.1 million
|
|
Gross Margins
|
45.7%
|
45.1%
|
|
Diluted EPS
|
$0.59
|
$0.42
|
|
Adjusted EBITDA*
|
$12.5 million
|
$9.0 million
|
|
Adjusted EBITDA/Sales
|
15%
|
13%
|
* Adjusted EBITDA (earnings before interest, taxes, depreciation, and amortization) is a non-GAAP financial measure that excludes certain items
as detailed in our Q2 2011 earnings press release issued July 27, 2011.
as detailed in our Q2 2011 earnings press release issued July 27, 2011.
6

*
KAI 2Q11 Business Review-July 28, 2011
© 2011 Kadant Inc. All rights reserved.
Q2 Revenue Performance
• $82.5 million, up 19% compared to Q2 2010
• Q2 revenue by product line
|
($ Millions)
|
Q2 2011
|
Q2 2010
|
% CHANGE
|
EXCL. FX
|
|
Stock-Preparation
|
$ 32.3
|
$ 25.0
|
29.3%
|
22.5%
|
|
Fluid-Handling
|
24.5
|
20.1
|
21.9%
|
13.1%
|
|
Doctoring
|
13.7
|
12.7
|
7.7%
|
2.1%
|
|
Water-Management
|
8.5
|
8.5
|
(0.6%)
|
(5.1%)
|
|
Fiber-based Products
|
2.9
|
2.2
|
29.9%
|
29.9%
|
|
Other
|
0.6
|
0.6
|
3.3%
|
(3.7%)
|
|
TOTAL
|
$ 82.5
|
$ 69.1
|
19.3%
|
12.6%
|
Percent change calculated using actual numbers reported in our Q2 2011 earnings release dated July 27, 2011.
7

*
KAI 2Q11 Business Review-July 28, 2011
© 2011 Kadant Inc. All rights reserved.
Q2 Booking Performance
• $87.3 million, up 18% compared to Q2 2010
• Q2 bookings by product line
|
($ Millions)
|
Q2 2011
|
Q2 2010
|
% CHANGE
|
EXCL. FX
|
|
Stock-Preparation
|
$ 30.8
|
$ 31.9
|
(3.3%)
|
(9.2%)
|
|
Fluid-Handling
|
28.4
|
20.1
|
41.4%
|
29.2%
|
|
Doctoring
|
14.5
|
12.8
|
13.5%
|
6.8%
|
|
Water-Management
|
11.1
|
7.6
|
46.4%
|
39.6%
|
|
Fiber-based Products
|
1.8
|
1.4
|
23.0%
|
23.0%
|
|
Other
|
0.7
|
0.5
|
44.6%
|
34.8%
|
|
TOTAL
|
$ 87.3
|
$ 74.3
|
17.6%
|
9.9%
|
Percent change calculated using actual numbers reported in our Q2 2011 earnings release dated July 27, 2011.
8

*
KAI 2Q11 Business Review-July 28, 2011
© 2011 Kadant Inc. All rights reserved.
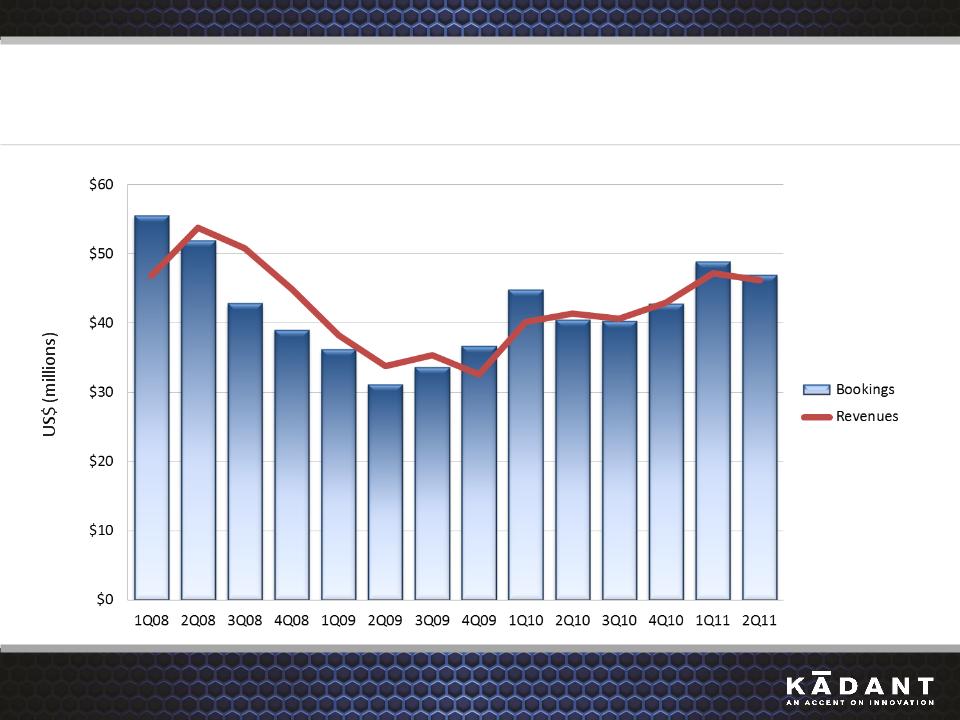
Bookings and Revenues Trends
9
*
KAI 2Q11 Business Review-July 28, 2011
© 2011 Kadant Inc. All rights reserved.
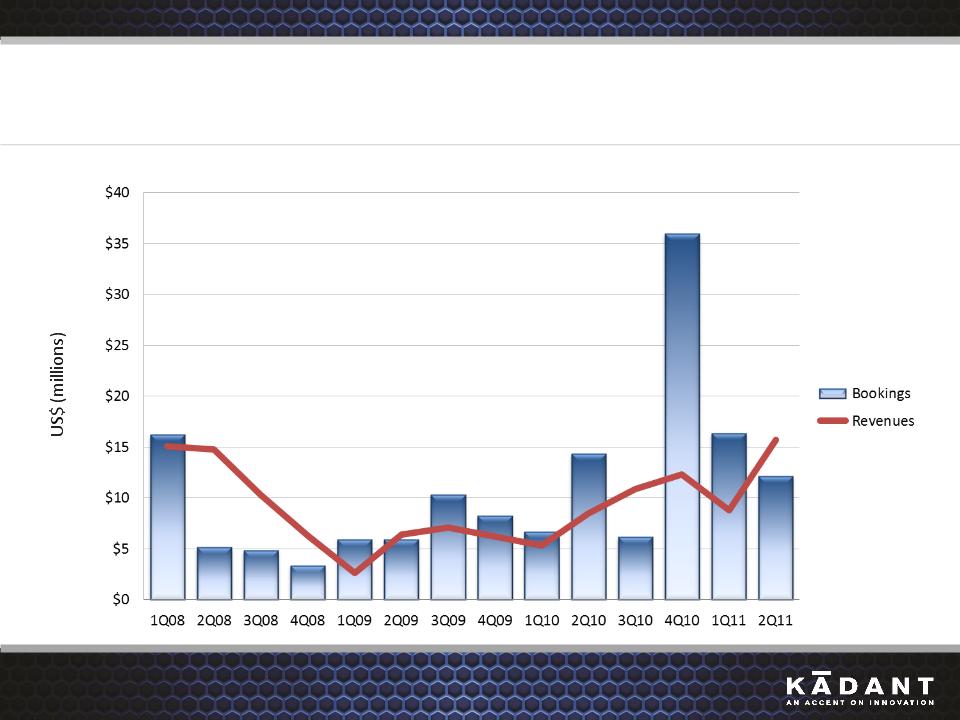
Parts and Consumables Bookings and Revenues
10

*
KAI 2Q11 Business Review-July 28, 2011
© 2011 Kadant Inc. All rights reserved.
Record Backlog in Q2 2011
11

*
KAI 2Q11 Business Review-July 28, 2011
© 2011 Kadant Inc. All rights reserved.
MARKET REVIEW
12

*
KAI 2Q11 Business Review-July 28, 2011
© 2011 Kadant Inc. All rights reserved.
North America Paper Industry Trends
• Paper and board production in 2011 down 1% through May
• Q2 Containerboard operating rates remain strong;
inventory continues to be lean
inventory continues to be lean
• Balance sheets, cash flows remain healthy
• Cost pressures and weak demand in Printing & Writing
• Energy and fiber input costs remain a challenge for mills
13

*
KAI 2Q11 Business Review-July 28, 2011
© 2011 Kadant Inc. All rights reserved.
Input Costs Continue to Escalate
Source: RISI, Inc.
Examples of raw material fiber cost
escalation in the U.S. spot market
escalation in the U.S. spot market
14

*
KAI 2Q11 Business Review-July 28, 2011
© 2011 Kadant Inc. All rights reserved.
North America Bookings and Revenues
15

*
KAI 2Q11 Business Review-July 28, 2011
© 2011 Kadant Inc. All rights reserved.
Europe Paper Industry Trends
• Export demand remains key driver for packaging grades
• Prices are stable, balanced supply and demand
• Energy focus continues to be high
16

*
KAI 2Q11 Business Review-July 28, 2011
© 2011 Kadant Inc. All rights reserved.
Europe Bookings and Revenues
17

*
KAI 2Q11 Business Review-July 28, 2011
© 2011 Kadant Inc. All rights reserved.
China Paper Industry Trends
• Government mandated closure of 8.2 million tons at 599 mills by the
end of 2011 announced this month
end of 2011 announced this month
• Sluggish paper and board demand continued through Q2
• Energy conservation program encouraging mills to take downtime
during summer months
during summer months
• Closing water loops and reducing fresh water consumption is a high
priority to meet new government standards and reduce cost
priority to meet new government standards and reduce cost
• Significant capacity additions coming online in 2H 2011
• Upward pressure on recovered paper pricing
18
*
KAI 2Q11 Business Review-July 28, 2011
© 2011 Kadant Inc. All rights reserved.
China Bookings and Revenues
19

*
KAI 2Q11 Business Review-July 28, 2011
© 2011 Kadant Inc. All rights reserved.
Guidance for Continuing Operations
• FY 2011 revenues of $325 to $335 million
• FY 2011 GAAP diluted EPS of $2.15 to $2.25
• Q3 2011 revenues of $80 to $82 million
• Q3 2011 GAAP diluted EPS of $0.40 to $0.42
20

*
KAI 2Q11 Business Review-July 28, 2011
© 2011 Kadant Inc. All rights reserved.
FINANCIAL REVIEW
Thomas M. O’Brien
Executive Vice President & Chief Financial Officer
21

*
KAI 2Q11 Business Review-July 28, 2011
© 2011 Kadant Inc. All rights reserved.
Gross Margins
|
|
2Q11
|
1Q11
|
2Q10
|
Sequential ∆
|
Y-O-Y ∆
|
|
Papermaking Systems Segment
|
45.3%
|
47.4%
|
44.9%
|
-210 b.p.
|
+40 b.p.
|
|
Fiber-based Products
|
56.6%
|
50.8%
|
50.8%
|
+580 b.p.
|
+580 b.p.
|
|
TOTAL
|
45.7%
|
47.6%
|
45.1%
|
-190 b.p.
|
+60 b.p.
|
22

*
KAI 2Q11 Business Review-July 28, 2011
© 2011 Kadant Inc. All rights reserved.
SG&A
|
($ Millions)
|
2Q11
|
1Q11
|
2Q10
|
Sequential ∆
|
Y-O-Y ∆
|
|
SG&A
|
$25.8
|
$24.5
|
$22.7
|
$1.3
|
$3.1
|
|
% Revenues
|
31.3%
|
34.1%
|
32.8%
|
-280 b.p.
|
-150 b.p.
|
23

*
KAI 2Q11 Business Review-July 28, 2011
© 2011 Kadant Inc. All rights reserved.
2Q11 to 2Q10 Diluted EPS
24

*
KAI 2Q11 Business Review-July 28, 2011
© 2011 Kadant Inc. All rights reserved.
Cash Flow
|
($ Millions)
|
2Q11
|
2Q10
|
|
Income from Continuing Operations
|
7.4
|
5.3
|
|
Depreciation and Amortization
|
2.0
|
1.7
|
|
Stock-Based Compensation
|
1.1
|
0.8
|
|
Other Items
|
-
|
(0.3)
|
|
Change in Current Assets & Liabilities (excluding acquisitions)
|
(3.7)
|
1.5
|
|
Cash Provided by Continuing Operations
|
$ 6.8
|
$ 9.0
|
25
*
KAI 2Q11 Business Review-July 28, 2011
© 2011 Kadant Inc. All rights reserved.
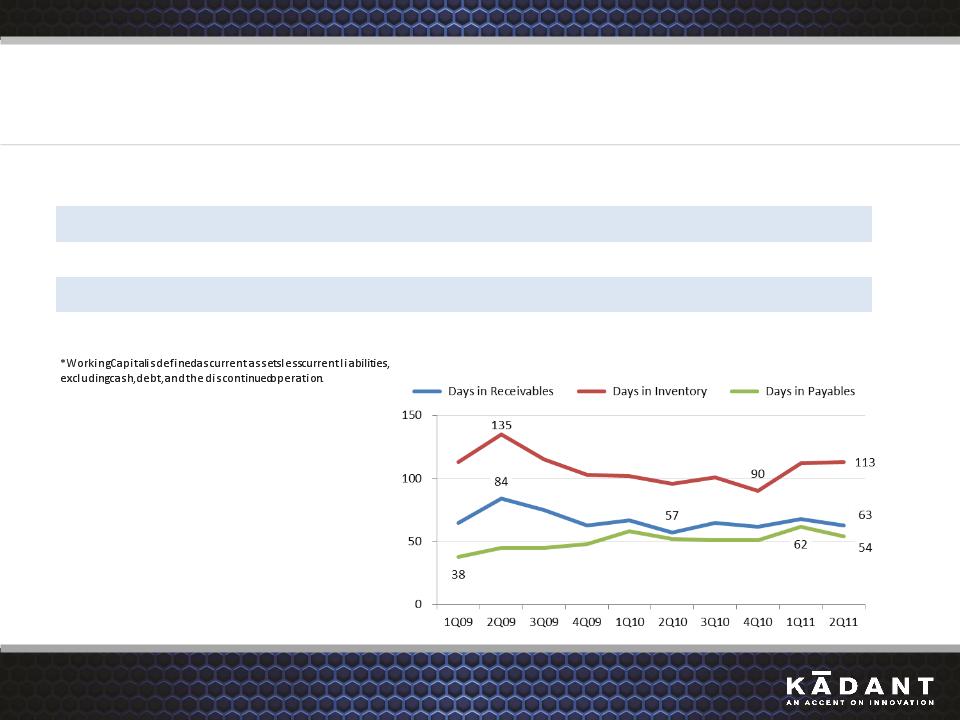
Key Working Capital Metrics
|
|
2Q11
|
1Q11
|
2Q10
|
|
Days in Receivables
|
63
|
68
|
57
|
|
Days in Payables
|
54
|
62
|
52
|
|
Days in Inventory
|
113
|
112
|
96
|
|
Working Capital % LTM Revenues*
|
13.4%
|
12.0%
|
12.3%
|
26
*
KAI 2Q11 Business Review-July 28, 2011
© 2011 Kadant Inc. All rights reserved.
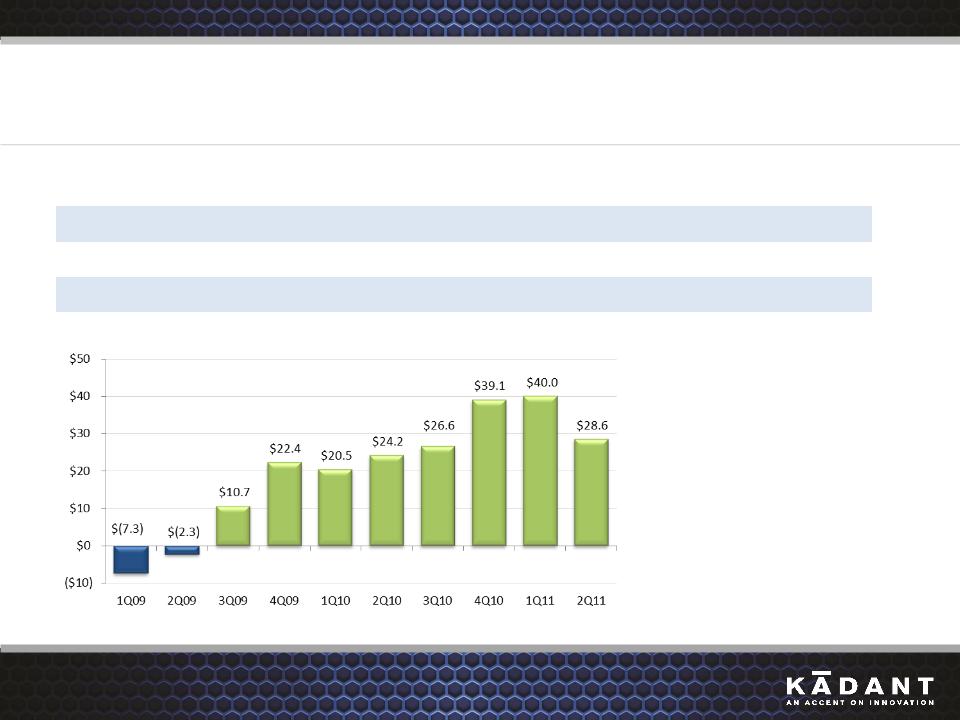
Cash and Debt
|
($ Millions)
|
2Q11
|
1Q11
|
2Q10
|
|
Cash, cash equivalents, restricted cash
|
46.1
|
57.6
|
47.2
|
|
Debt
|
(17.5)
|
(17.6)
|
(23.0)
|
|
NET CASH
|
$ 28.6
|
$ 40.0
|
$ 24.2
|
27

*
KAI 2Q11 Business Review-July 28, 2011
© 2011 Kadant Inc. All rights reserved.
Leverage Ratio
* Calculated by adding or subtracting certain items, as required by our Credit Facility, from Adjusted EBITDA.
28

*
KAI 2Q11 Business Review-July 28, 2011
© 2011 Kadant Inc. All rights reserved.
Questions & Answers
To ask a question, please call 866-804-6926 within the U.S. or
+1-857-350-1672 outside the U.S. and reference 83375884.
+1-857-350-1672 outside the U.S. and reference 83375884.
Please mute the audio on your computer.
29

Second Quarter 2011 Business Review
Jonathan W. Painter, President & CEO
Thomas M. O’Brien, Executive Vice President & CFO
30