Attached files
| file | filename |
|---|---|
| 8-K - 8-K - EarthLink Holdings, LLC | a11-23104_18k.htm |
Exhibit 99.1
|
E |
Investor Presentation July 2011 |
|
|
Cautionary Information Regarding Forward Looking Statements This presentation includes "forward-looking" statements (rather than historical facts) that are subject to risks and uncertainties that could cause actual results to differ materially from those described. Although we believe that the expectations expressed in these forward-looking statements are reasonable, we cannot promise that our expectations will turn out to be correct. Our actual results could be materially different from and worse than our expectations. We disclaim any obligation to update any forward-looking statements contained herein, except as may be required pursuant to applicable law. With respect to forward-looking statements in this press release, the company seeks the protections afforded by the Private Securities Litigation Reform Act of 1995. These risks and uncertainties (1) that we may not be able to execute our business strategy to transition to a leading IP infrastructure and managed services provider, which could adversely impact our results of operations and cash flows; (2) that we may be unsuccessful in making and integrating acquisitions into our business, which could result in operating difficulties, losses and other adverse consequences; (3) that the continuing effects of adverse economic conditions could harm our business; (4) that if we do not continue to innovate and provide products and services that are useful to individual subscribers and business customers, we may not remain competitive, and our revenues and operating results could suffer; (5) that our failure to implement cost reduction initiatives will adversely affect our results of operations; (6) that we will require a significant amount of cash, which may not be available to us, to service our debt and fund our other liquidity needs; (7) that we face significant competition in the Internet industry that could reduce our profitability; (8) that our consumer business is dependent on the availability of third-party network service providers; (9) that the continued decline of our consumer access subscribers, combined with the change in mix of our consumer access base from narrowband to broadband, will adversely affect our results of operations; (10) that our commercial and alliance arrangements may not be renewed or may not generate expected benefits, which could adversely affect our results of operations; (11) that privacy concerns relating to our business could damage our reputation and deter current and potential users from using our services; (12) that changes in technology in the Internet access industry could cause a decline in our business; (13) that we face significant competition in the communications industry that could reduce our profitability; (14) that decisions by the Federal Communications Commission relieving ILECs (incumbent local exchange carrier, which term includes former Bell Systems or other independent telephony companies responsible for providing local telephone exchange services in a specified geographic area) of certain regulatory requirements, and possible further deregulation in the future, may restrict our ability to provide services and may increase the costs we incur to provide these services; (15) that our wholesale services, including our broadband transport services, will be adversely affected by pricing pressure, network overcapacity, service cancellations and other factors; (16) that our financial performance will suffer if we are not offered competitive rates for the access services we need to provide our long distance services; (17) that we may experience reductions in switched access and reciprocal compensation revenue; (18) that our inability to maintain and upgrade our network infrastructure, portions of which we do not own, could adversely affect our operating results; (19) that if we are unable to interconnect with AT&T, Verizon and other incumbent carriers on acceptable terms, our ability to offer competitively priced local telephone services will be adversely affected; (20) that we may not be able to compete effectively if we are unable to install additional network equipment or convert our network to more advanced technology; (21) that failure to obtain and maintain necessary permits and rights-of-way could interfere with our network infrastructure and operations; (22) that we may be unable to retain sufficient qualified personnel, and the loss of any of our key executive officers could adversely affect us; (23) that interruption or failure of our network and information systems and other technologies could impair our ability to provide our services, which could damage our reputation and harm our operating results; (24) that our business depends on effective business support systems and processes; (25) that government regulations could adversely affect our business or force us to change our business practices; (26) that our business may suffer if third parties used for customer service and technical support and certain billing services are unable to provide these services or terminate their relationships with us; (27) that we may not be able to protect our intellectual property; (28) that we may be accused of infringing upon the intellectual property rights of third parties, which is costly to defend and could limit our ability to use certain technologies in the future; (29) that if we, or other industry participants, are unable to successfully defend against legal actions, we could face substantial liabilities or suffer harm to our financial and operational prospects; (30) that we may be required to recognize additional impairment charges on our goodwill and intangible assets, which would adversely affect our results of operations and financial position; (31) that we may have to undertake further restructuring plans that would require additional charges, including incurring facility exit and restructuring charges; (32) that we may have exposure to greater than anticipated tax liabilities and the use of our net operating losses and certain other tax attributes could be limited in the future; (33) that we may reduce, or cease payment of, quarterly cash dividends; (34) that our stock price may be volatile; (35) that our indebtedness could adversely affect our financial health and limit our ability to react to changes in our industry; and (36) that provisions of our second restated certificate of incorporation, amended and restated bylaws and other elements of our capital structure could limit our share price and delay a change of management. These risks and uncertainties, as well as other risks and uncertainties that could cause our actual results to differ significantly from management's expectations, are not intended to represent a complete list of all risks and uncertainties inherent in our business, and should be read in conjunction with the more detailed cautionary statements and risk factors included in our Annual Report on Form 10-K for the year ended December 31, 2010. 1 |
|
|
RAX L Enterprise Value/Adjusted EBITDA is calculated using Enterprise Value based on market capitalization as of 7/26/11 less Q1 '11 Ending Cash plus Debt divided by the latest 2011 full year consensus for estimated EBITDA as provided by Thomson First Call. For EarthLink, Ending Cash and Debt are as of Q2 '11 and Adjusted EBITDA is Q2 '11 annualized. EarthLink’s Valuation Relative to Peers Enterprise value/Adj. EBITDA 2 |
|
|
Investment Thesis • Valuation • Rapidly improving revenue trajectory • Substantial free cash flow; Management team operating experience • Opportunity to rapidly grow managed services • Balance sheet and tax assets 3 1 Multiple of Enterprise Value to Adjusted EBITDA at midpoint of 2011 Guidance |
|
|
EarthLink Stats & Facts • Customer Relationships: Over 1.6 million • Revenue: Over $1.4 Billion (Last Qtr Annualized) • Free Cash Flow: $200M-$215M1 • Employees: Over 3,000 • Core Products • Business Services: MPLS, Internet, Voice, Video • Managed Services: Security, Cloud Hosting, ASP Web Hosting, Customer Interface Portal, Data and Voice CPE • Wholesale: Fiber Capacity and Services • Consumer: Internet Services (65% Broadband) 4 1 Per 2011 Guidance Range |
|
|
EarthLink Origins – The Original Cloud Company • IP is in our DNA as a MPLS and nationwide Internet Service Provider • Operate a Virtual Environment for customers – ecommerce, web content, email, web portal, web security, web hosting • Online customer care –remote centers, chat rooms, self-service capabilities • Billing through 2 million credit cards – in the cloud – high level of network security and PCI compliant • EarthLink ISP consists of 2 large data centers – Pasadena, CA and Atlanta, GA 5 |
|
|
EarthLink Network Evolution Nationwide coverage from legacy New Edge network (grey lines) Added density. Deeper networks drive richer gross margins (~50%+) • New Edge Network - Ubiquitous nationwide IP connectivity that provides secure private networks - Nationwide network coverage - Private MPLS network with Class of Service • ITC Deltacom Acquisition - Southeast Fiber Network - deep fiber network, better economics • One Communications Acquisition - Northeast Fiber Network 6 |
|
|
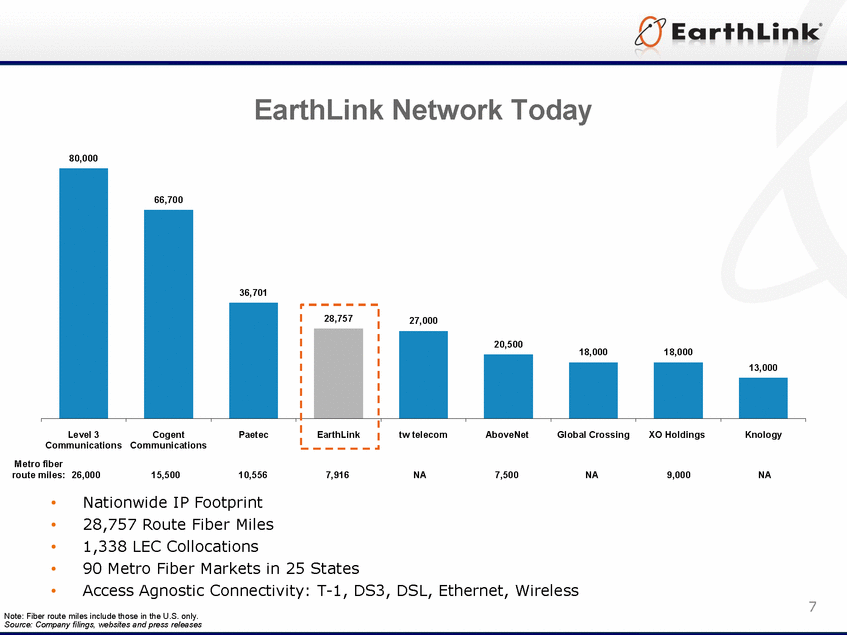
EarthLink Network Today Level 3 Cogent Paetec EarthLink tw telecom AboveNet Global Crossing XO Holdings Knology Communications Communications Metro fiber route miles: 26,000 15,500 10,556 7,916 NA 7,500 NA 9,000 NA • Nationwide IP Footprint • 28,757 Route Fiber Miles • 1,338 LEC Collocations • 90 Metro Fiber Markets in 25 States • Access Agnostic Connectivity: T-1, DS3, DSL, Ethernet, Wireless 7 Note: Fiber route miles include those in the U.S. only. Source: Company filings, websites and press releases 80,000 66,700 36,701 28,757 27,000 20,500 18,000 18,000 13,000 |
|
|
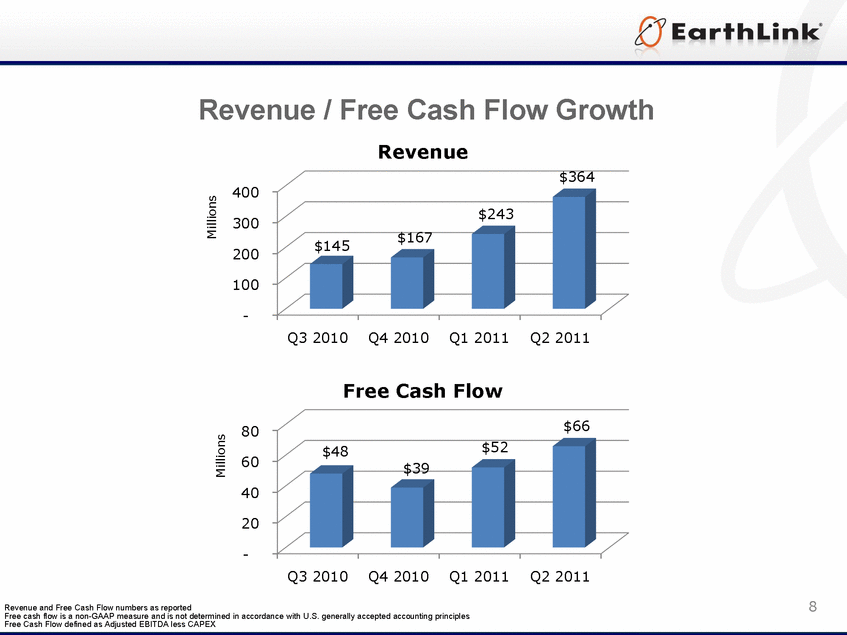
Revenue / Free Cash Flow Growth Revenue $364 400 Millions $243 300 $167 $145 200 100 - Q3 2010 Q4 2010 Q1 2011 Q2 2011 Free Cash Flow 80 $66 Millions $48 $52 60 $39 40 20 - Q3 2010 Q4 2010 Q1 2011 Q2 2011 Revenue and Free Cash Flow numbers as reported 8 Free cash flow is a non-GAAP measure and is not determined in accordance with U.S. generally accepted accounting principles Free Cash Flow defined as Adjusted EBITDA less CAPEX |
|
|
Industry Trends |
|
|
IP data traffic growing exponentially • The North American market remains the largest market in the world, and is projected to maintain a robust growth profile • projected to remain the largest market in 2014 with 30% of the global market share • 2009 - 2014 CAGR of 30% vs. 34% globally Strong continued growth expectations for VPN services Global Traffic and Connections Global IP Traffic North American IP Traffic (Petabytes per month) (Petabytes per month) 19,019 63,904 16,136 49,919 12,988 38,242 10,051 28,491 7,091 20,396 5,115 14,686 2009 2010 2011 2012 2013 2014 2009 2010 2011 2012 2013 2014 North American VPN Connections North American VPN Revenue (connections in 000's) 3,637 ($ in billions) 3,262 $26 $24 2,849 $21 2,448 $19 2,082 $16 $14 1,174 2009 2010 2011 2012 2013 2014 2009 2010 2011 2012 2013 2014 10 Source: Cisco Visual Networking Index - Forecast and Methodology 2009 - 2014, Gartner 2011, Wall Street research |
|
|
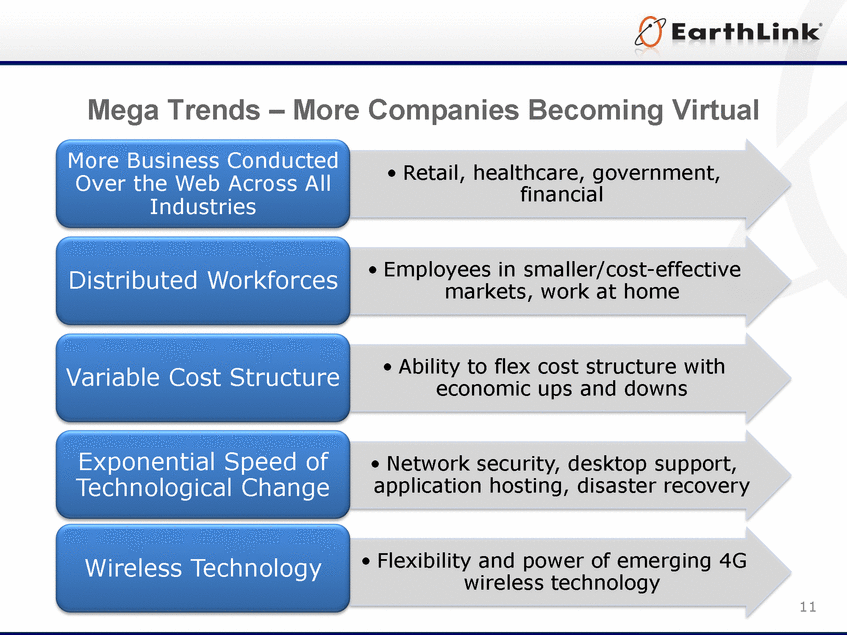
Mega Trends - More Companies Becoming Virtual More Business Conducted Retail, healthcare, government, Over the Web Across All financial Industries Distributed Workforces Employees in smaller/cost-effective markets, work at home Variable Cost Structure Ability to flex cost structure with economic ups and downs Exponential Speed of Network security, desktop support, Technological Change application hosting, disaster recovery Wireless Technology Flexibility and power of emerging 4G wireless technology 11 |
|
|
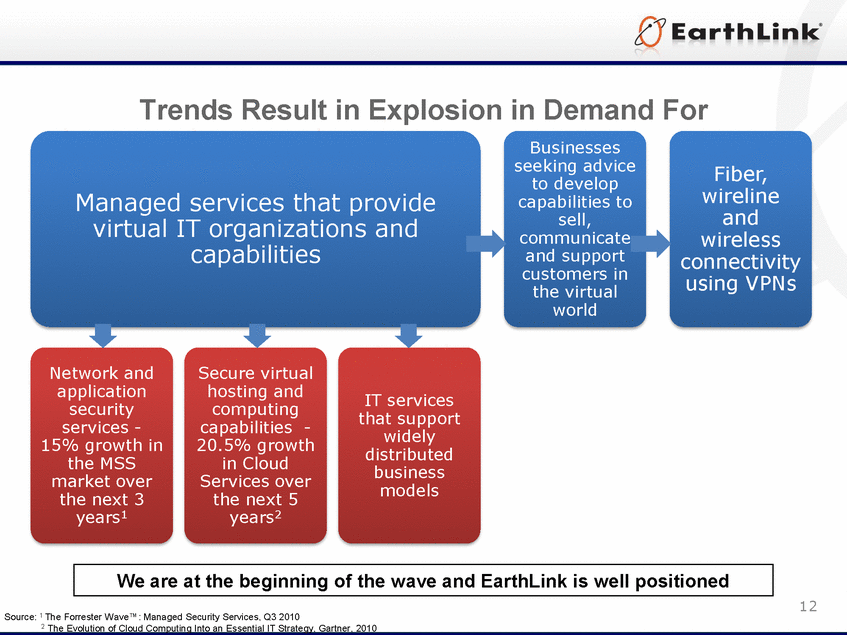
Trends Result in Explosion in Demand For Businesses seeking advice Fiber, to develop Managed services that provide capabilities to wireline virtual IT organizations and sell, and communicate wireless capabilities and support connectivity customers in using VPNs the virtual world Network and Secure virtual application hosting and IT services security computing that support services - capabilities -widely 15% growth in 20.5% growth distributed the MSS in Cloud business market over Services over models the next 3 the next 5 years1 years2 We are at the beginning of the wave and EarthLink is well positioned 12 Source: 1 The Forrester Wave TM: Managed Security Services, Q3 2010 2 The Evolution of Cloud Computing Into an Essential IT Strategy, Gartner, 2010 |
|
|
EarthLink Managed Services Outsource Your Technology Risk EarthLink is a trusted IT partner that provides on-demand security, hosting and managed IT services • Leverages robust nationwide IP network, strategically positioned data centers, security devices, and access devices to enable customers to reduce their budgets and improve their IT service offerings Why EarthLink Business Managed Services? Comprehensive portfolio of proven IT products & services Regional on-net data center facilities Full Time, Certified Security, Audit & Engineering Staff Provides businesses predictable IT operational expenses with lower or zero IT capital expenditures Enabled by a high-capacity secure nationwide IP network with fully-redundant architecture Diverse industry expertise & recognizable client references (Including EarthLink Consumer) Technology Risk Reduction Best in class support organization-Certified Network, Computing, Security & Engineering 13 |
|
|
Managed Services Capability Potential Security Services • Compliance and Audits • Vulnerability Scanning • External Penetration Testing • Threat Management • Network Firewall • VPN Management • Application Firewall • Information Management • E-Mail Security Managed IT Data Center Operations and Services Services Support • Manage and Monitor • Updates and Patches • End Device Support • Backup and Recovery • Virtual Help Desk • Anywhere Access • Targeted Application Support • Virtual Services • Virtual Desktops • ¼ rack, ½ rack, full rack COLLO • Managed Hosting • Disaster Recovery • Business Continuity • Regional "On Net" Data Centers • Certified Engineers • Security Operations Center (SOC) • IT Solutions Center • Customer Advocate • Solutions Sales Support and Training • Scale • MSP OSS • Automated Online Portals and Service 14 |
|
|
Financial Strength |
|
|
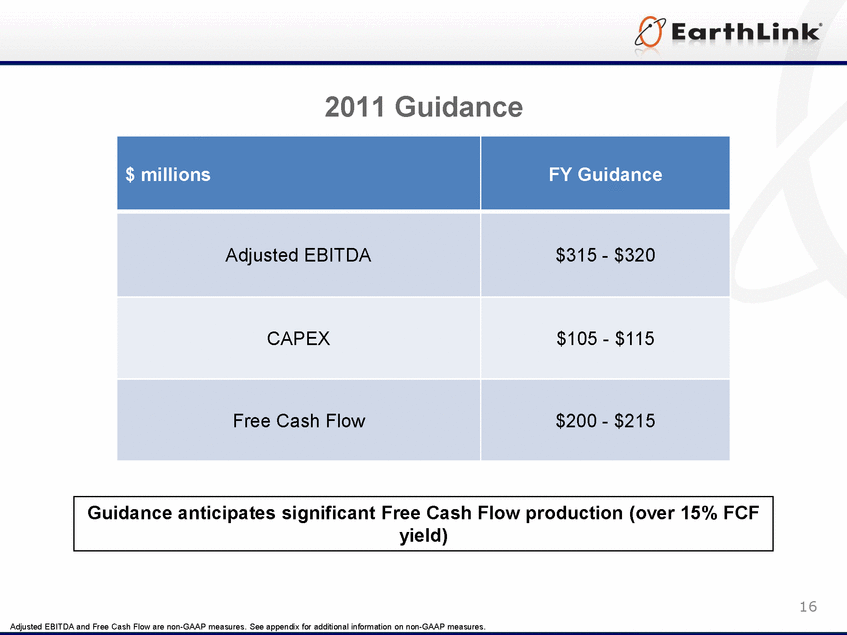
2011 Guidance $ millions FY Guidance Adjusted EBITDA $315 - $320 CAPEX $105 - $115 Free Cash Flow $200 - $215 Guidance anticipates significant Free Cash Flow production (over 15% FCF yield) 16 Adjusted EBITDA and Free Cash Flow are non-GAAP measures. See appendix for additional information on non-GAAP measures. |
|
|
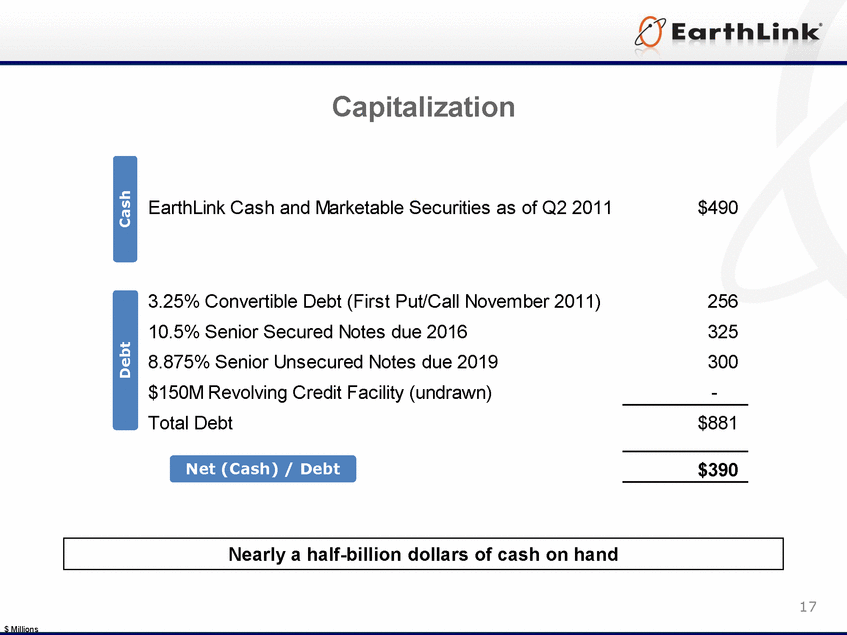
10.5% Capitalization Senior 8.875% Senior Cash $150M Revolving Total Debt Debt Net (Cash) / Debt Nearly a half-billion dollars of cash on hand 17 $ Millions EarthLink Cash and Marketable Securities as of Q2 2011 $490 3.25% Convertible Debt (First Put/Call November 2011) 256 Secured Notes due 2016 325 Unsecured Notes due 2019 300 Credit Facility (undrawn) - $881 $390 |
|
|
Leverage Ratios EarthLink as a potential industry consolidation leader 1Other than for EarthLink all data above is sourced from Thomson Reuters and is trailing twelve months as of 3/31/2011. EarthLink information above is pro-forma for Deltacom and OneComm transactions • EarthLink Gross Debt includes $300M Senior Notes + $256M Convertible Notes + $325M Deltacom Senior Secured Notes. EarthLink data reflects Convertible Debt Discount and Deltacom Senior Notes Premium reflected on Balance Sheet • EarthLink Net Debt reflects $552M Q1 '11 Ending Cash and Marketable Securities balance minus approximately $337M Net Cash paid for One Comm acquisition and pro-forma impact of May 2011 notes offering - EarthLink leverage ratio denominator is legacy EarthLink standalone TTM through 3/31/2011 plus pro forma TTM results for Deltacom , OneComm, and STS 18 2Denominator for Debt Leverage Ratios is Adjusted EBITDA, which for EarthLink is defined as income (loss) from continuing operations before interest expense and other, net, income taxes, depreciation and amortization, net losses of equity affiliate, gain (loss) on investments, net, impairment of goodwill and intangible assets, and restructuring and acquisition-related costs. |
|
|
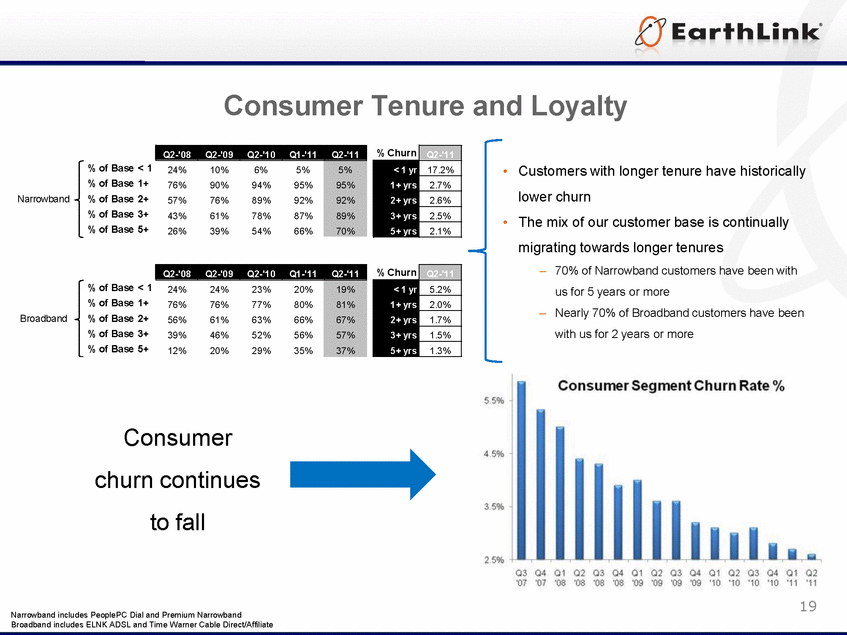
Consumer churn continues to fall Narrowband includes PeoplePC Dial and Premium Narrowband Broadband includes ELNK ADSL and Time Warner Cable Direct/Affiliate 19 Consumer Tenure and Loyalty % of Base < % of Base 1+ Broadband % of Base 2+ % of Base 3+ % of Base 5+ •Customers with longer tenure have historically lower churn •The mix of our customer base is continually migrating towards longer tenures–70% of Narrowband customers have been with us for 5 years or more–Nearly 70% of Broadband customers have been with us for 2 years or more consumer segment churn Rate % Narrowband |
|
|
Appendix |
|
|
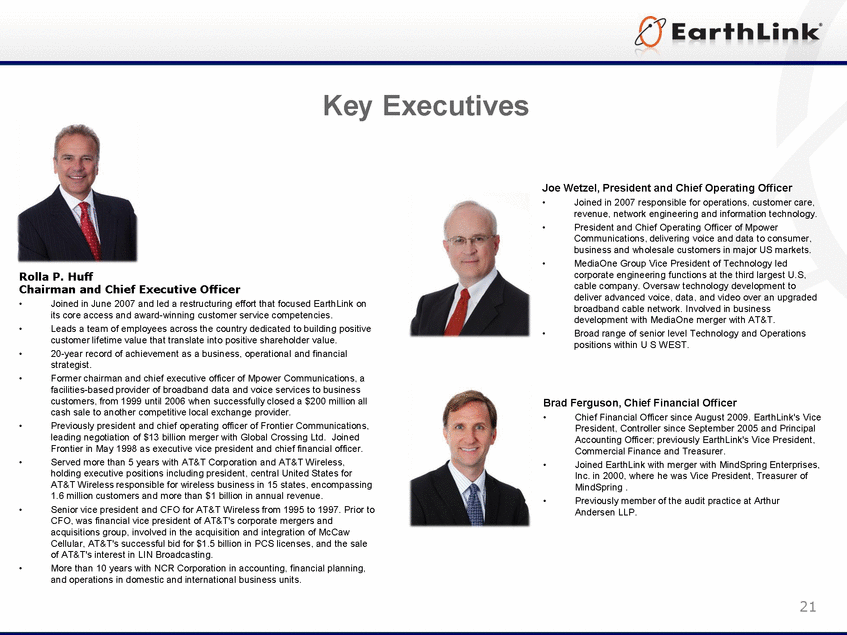
Key Executives Rolla P. Huff Chairman and Chief Executive Officer • Joined in June 2007 and led a restructuring effort that focused EarthLink on its core access and award-winning customer service competencies. • Leads a team of employees across the country dedicated to building positive customer lifetime value that translate into positive shareholder value. • 20-year record of achievement as a business, operational and financial strategist. • Former chairman and chief executive officer of Mpower Communications, a facilities-based provider of broadband data and voice services to business customers, from 1999 until 2006 when successfully closed a $200 million all cash sale to another competitive local exchange provider. • Previously president and chief operating officer of Frontier Communications, leading negotiation of $13 billion merger with Global Crossing Ltd. Joined Frontier in May 1998 as executive vice president and chief financial officer. • Served more than 5 years with AT&T Corporation and AT&T Wireless, holding executive positions including president, central United States for AT&T Wireless responsible for wireless business in 15 states, encompassing 1.6 million customers and more than $1 billion in annual revenue. • Senior vice president and CFO for AT&T Wireless from 1995 to 1997. Prior to CFO, was financial vice president of AT&T's corporate mergers and acquisitions group, involved in the acquisition and integration of McCaw Cellular, AT&T's successful bid for $1.5 billion in PCS licenses, and the sale of AT&T's interest in LIN Broadcasting. • More than 10 years with NCR Corporation in accounting, financial planning, and operations in domestic and international business units. Joe Wetzel, President and Chief Operating Officer • Joined in 2007 responsible for operations, customer care, revenue, network engineering and information technology. • President and Chief Operating Officer of Mpower Communications, delivering voice and data to consumer, business and wholesale customers in major US markets. • MediaOne Group Vice President of Technology led corporate engineering functions at the third largest U.S, cable company. Oversaw technology development to deliver advanced voice, data, and video over an upgraded broadband cable network. Involved in business development with MediaOne merger with AT&T. • Broad range of senior level Technology and Operations positions within U S WEST. Brad Ferguson, Chief Financial Officer • Chief Financial Officer since August 2009. EarthLink's Vice President, Controller since September 2005 and Principal Accounting Officer; previously EarthLink's Vice President, Commercial Finance and Treasurer. • Joined EarthLink with merger with MindSpring Enterprises, Inc. in 2000, where he was Vice President, Treasurer of MindSpring . • Previously member of the audit practice at Arthur Andersen LLP. 21 |
|
|
Sales and Marketing Leadership Cardi Prinzi, Executive Vice President, Sales and Marketing • Joined EarthLink in 2009 as President of New Edge Networks where he led this managed services business to optimize growth and profitability, while further developing its competitive positioning in the marketplace. • Senior Vice President of Marketing for TelePacific Comm., responsible for sales, product development and management, marketing, regulatory and external affairs. • More than 25 years of industry experience in sales and marketing leadership, as well as data operations management with companies such as Pihana Pacific, Inc. (Equinix, Inc.), WorldCom/MFS and Sprint. Brian Fink, Executive Vice President, Managed Services • Joined EarthLink in January 2011 responsible for Strategic Planning and Program Delivery. • Responsible for leveraging the core capabilities of EarthLink Cloud TM to position EarthLink as a national Managed Services Provider offering a full set of secure IT solutions for small, mid market and national customers. • Over 20 years of IT and telecommunications executive leadership in both entrepreneurial and large growth companies, he brings extensive IP and managed services experience and a track record for delivering innovative technology driven solutions. Mae Squier-Dow, President of Premier Business Solutions • Joined EarthLink in 2011 responsible for EarthLink Business mid-market sales and account management teams. • Experienced technology executive with a 27-year track record of engaging customers and producing results in value-added service businesses. • Senior Vice President of Business Development at Current Group, and previously held leadership positions at Choice One Communications as Senior Vice President of Sales and Service, President of Network Services and Chief Operating Officer. Vikram Desai, President of National Accounts • Joined EarthLink in 2011 responsible for management and growth of the company's largest and most complex customers and opportunities. • Recognized senior executive leader with enterprise data center solution expertise and in-depth knowledge of the managed services space. He has held CEO level positions with entrepreneurial data center IT, web application and security companies. • Chief Operating Officer of application networking company Radware, where he guided the company through a period of record growth. • President of Global Accounts for Global Crossing, as well as business unit and National Accounts sales leadership positions with Worldcom and MCI. 22 |
|
|
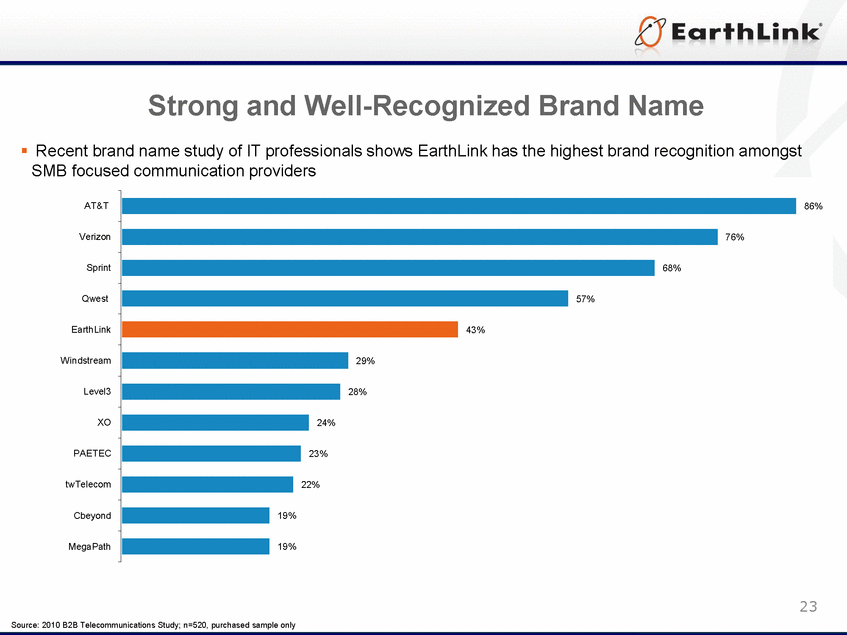
Strong and Well-Recognized Brand Name • Recent brand name study of IT professionals shows EarthLink has the highest brand recognition amongst SMB focused communication providers AT&T 86 % Verizon 76 % Sprint 68 % Qwest 57 % EarthLink 43 % Windstream 29 % Level3 28 % XO 24 % PAETEC 23 % twTelecom 22 % Cbeyond 19 % MegaPath 19 % 23 Source: 2010 B2B Telecommunications Study; n=520, purchased sample only 23 |
|
|
Non GAAP Information EarthLink Non-GAAP Measures Adjusted EBITDA is defined by EarthLink as income (loss) from continuing operations before interest expense and other, net, income taxes, depreciation and amortization, stock-based compensation expense, net losses of equity affiliate, gain (loss) on investments, net, impairment of goodwill and intangible assets, and restructuring and acquisition-related costs. Free cash flow is defined by EarthLink as income from continuing operations before interest expense and other, net, income taxes, depreciation and amortization, stock-based compensation expense, gain (loss) on investments, net, impairment of goodwill and intangible assets, and restructuring and acquisition-related costs, less cash used for purchases of property and equipment and purchases of subscriber bases. Adjusted EBITDA and free cash flow are non-GAAP measures and are not determined in accordance with U.S. generally accepted accounting principles. These financial performance measures are not indicative of cash provided or used by operating activities and may differ from comparable information provided by other companies, and they should not be considered in isolation, as an alternative to, or more meaningful than measures of financial performance determined in accordance with U.S. generally accepted accounting principles. These financial performance measures are commonly used in the industry and are presented because EarthLink believes they provide relevant and useful information to investors. EarthLink utilizes these financial performance measures to assess its ability to meet future capital expenditures and working capital requirements. EarthLink also uses these financial performance measures to evaluate the performance of its business, for budget planning purposes and as factors in its employee compensation programs. 24 |
|
|
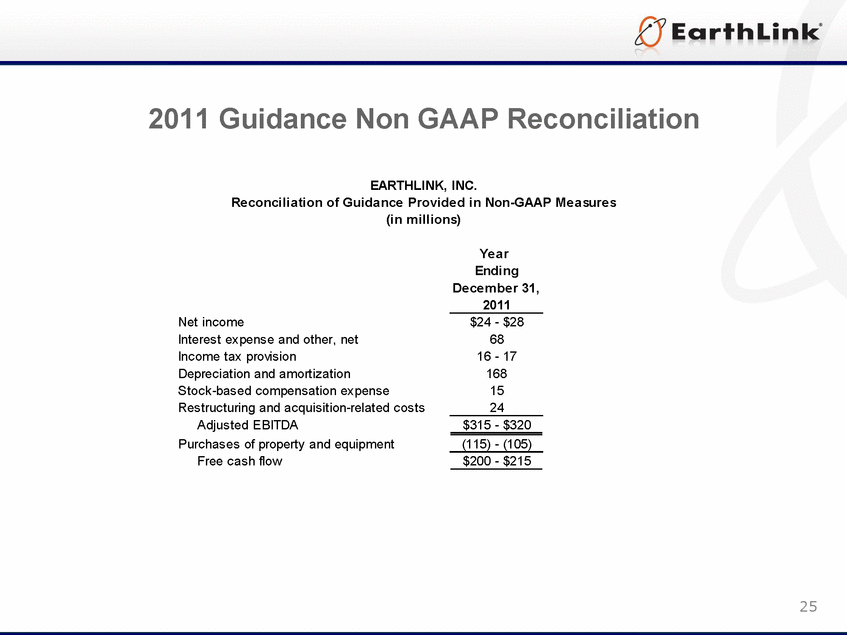
2011 Guidance Non GAAP Reconciliation EARTHLINK, INC. Reconciliation of Guidance Provided in Non-GAAP Measures (in millions) Year Ending December 31, 2011 Net income $24 - $28 Interest expense and other, net 68 Income tax provision 16 - 17 Depreciation and amortization 168 Stock-based compensation expense 15 Restructuring and acquisition-related costs 24 Adjusted EBITDA $315 - $320 Purchases of property and equipment (115) - (105) Free cash flow $200 - $215 25 |
|
|
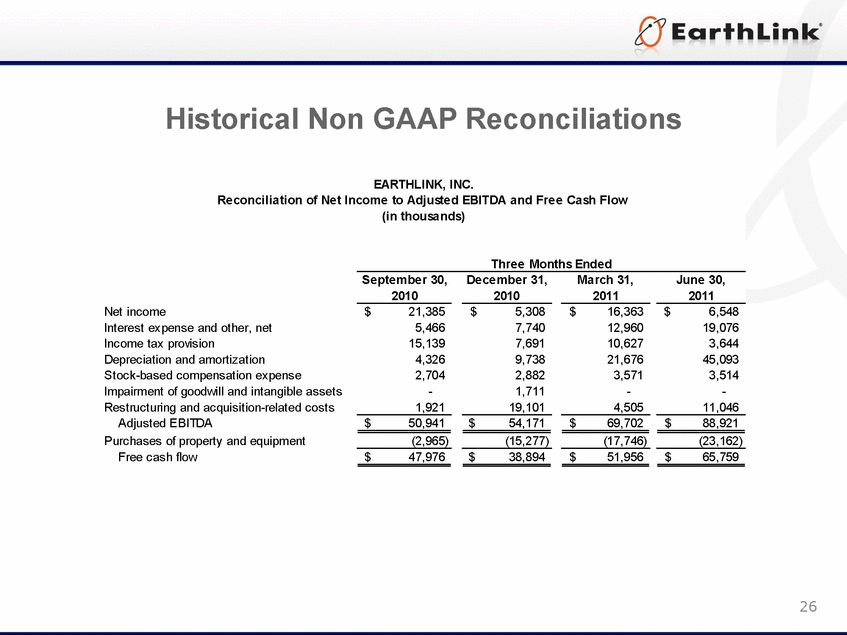
Historical Non GAAP Reconciliations EARTHLINK, INC. Reconciliation of Net Income to Adjusted EBITDA and Free Cash Flow (in thousands) Three Months Ended September 30, December 31, March 31, June 30, 2010 2010 2011 2011 Net income $ 21,385 $ 5,308 $ 16,363 $ 6,548 Interest expense and other, net 5,466 7,740 12,960 19,076 Income tax provision 15,139 7,691 10,627 3,644 Depreciation and amortization 4,326 9,738 21,676 45,093 Stock-based compensation expense 2,704 2,882 3,571 3,514 Impairment of goodwill and intangible assets - 1,711 - - Restructuring and acquisition-related costs 1,921 19,101 4,505 11,046 Adjusted EBITDA $ 50,941 $ 54,171 $ 69,702 $ 88,921 Purchases of property and equipment (2,965) (15,277) (17,746) (23,162) Free cash flow $ 47,976 $ 38,894 $ 51,956 $ 65,759 |

