Attached files
| file | filename |
|---|---|
| 8-K - FORM 8-K - SONIC AUTOMOTIVE INC | d8k.htm |
| EX-99.3 - PRESS RELEASE - SONIC AUTOMOTIVE INC | dex993.htm |
| EX-99.1 - PRESS RELEASE - SONIC AUTOMOTIVE INC | dex991.htm |
 1
Q2 Earnings Review
July 26, 2011
Exhibit 99.2 |
 2
Cautionary Notice: Forward-Looking Statements
This
presentation
contains
“forward-looking
statements”
within
the
meaning
of
the
Private
Securities Litigation Reform Act of 1995. These statements relate
to future events, are not historical facts and are based on our
current expectations and assumptions regarding our business, the economy
and other future conditions. These statements can generally be
identified by lead-in words such as
“believe”,
“expect”,
“anticipate”,
“intend”,
“plan”,
“foresee”,
“may”,
”will”
and
other
similar
words.
Statements that describe our Company’s objectives, plans or goals
are also forward-looking statements. Examples of such
forward-looking information we may be discussing in this presentation
include, without limitation, further implementation of our operational
strategies and playbooks, future debt retirement, capital
expenditures, operating margins and revenues, inventory levels and new
vehicle industry sales volume.
You are cautioned that these forward-looking statements are not
guarantees of future performance, involve risks and
uncertainties and actual results may differ materially from those projected in the
forward-looking statements as a result of various factors.
These risks and uncertainties include, among other things, (a)
economic conditions in the markets in which we operate, (b) the success of
our operational strategies, (c) our relationships with the automobile
manufacturers and (d) new and used vehicle sales volume. These
risks and uncertainties, as well as additional factors that could affect
our forward-looking statements, are described in our Form 10-K
for the year ending December 31, 2010 and our Form 10-Q for
period ended March 31, 2011. These forward-looking
statements, risks, uncertainties and additional factors speak only as of the
date
of
this
presentation.
We
undertake
no
obligation
to
update
any
such
statements. |
 3
Sonic Automotive Q2 2011
o
Quarter in Review
o
Financial Results
o
Operations Recap
o
Summary and Outlook |
 4
Overall Results
Grow the base business
Revenues up 14%
New vehicle revenue up 16.0%; Volume exceeds industry growth
Used revenue up 15%
F&I revenue up 22%
Fixed Operations up 6.0%
SG&A to Gross declined to 77.6%
Income from continuing operations up 59.1% *
Q2 2011 diluted EPS from continuing operations was $0.37 per share, an
increase of 54.2% from Q2 2010 *
Completed extension of floor plan and revolving credit facilities
* Calculated excluding the $7.3M debt
extinguishment charge recorded in Q2 2010 |
 (dollars in millions, except per share)
B / (W) than Q2 2010
Q2 2011
$
%
Revenue
1,968
$
246
$
14%
Gross Profit
310
27
10%
Operating Profit
59
11
23%
Non-Floor Plan Interest
18
2
10%
Continuing Operations
-Profit After Tax
22
$
13
$
(1)
131%
-Diluted EPS
0.37
$
0.19
$
(1)
106%
Discops EPS
(0.02)
$
-
$
Memo: SGA % of Gross
77.6%
230
bps
Second Quarter Results
(1)
Prior year includes an after-tax charge of $4.3 million, or $0.06
per diluted share, from loss on debt repurchases.
5 |
   (dollars in millions)
Q1 2010
Q2 2010
Q3 2010
Q4 2010
Q1 2011
Q2 2011
Revenue
1,544
$
1,722
$
1,770
$
1,845
$
1,839
$
1,968
$
Gross Profit
266
282
282
285
291
310
SG&A Expense
221
$
226
$
226
$
224
$
233
$
240
$
SG&A as % of Gross Profit
83.0%
79.9%
80.3%
78.8%
79.9%
77.6%
SG&A
Leveraging
SG&A Expenses
6 |
 Capital Spending
7
Actual
1st Half
2011
Expected
2nd Half
2011
Expected
FY 2011
Facility Improvement
26.6
$
7.0
$
33.6
$
Real Estate Acquisitions
75.2
5.0
80.2
Less: Mortgage Funding
(54.0)
(15.0)
(69.0)
Net Cash Used - Facility Related
47.8
$
(3.0)
$
44.8
$
IT Capital Spending
3.9
5.8
9.7
Maintenance Cap Ex
7.0
3.0
10.0
Total Cash Used - Cap Ex
58.7
$
5.8
$
64.5
$
(amounts in millions) |
 Credit Facility
•
Extended term:
August 15, 2016 maturity (was August 2012)
•
Increased size:
Revolving Credit Facility -
$175.0 million ($25.0 million increase)
New Vehicle Floorplan Facility -
$500.0 million ($179.0 million increase)
Used Vehicle Floorplan Facility -
$80.0 million ($30.0 million increase)
•
Improved flexibility to focus on our strategic priorities of
reducing non-mortgage debt and owning our property
8
Note:
On
July
15,
2011,
we
issued
a
redemption
notice
to
holders
of
our
8.625%
Notes
to
redeem
$42.9M in aggregate principal of the 8.625% Notes on August 16,
2011. |
 New Retail Vehicles
Q2
Q2
(dollars in thousands, except GPU)
2011
2010
B / (W)
New Retail Volume
28,367
(1)
24,647
15.1%
New Gross Margin
6.8%
6.9%
(10)
bps
New GPU
2,351
$
2,364
$
(0.6%)
New Gross Profit
66,680
$
58,273
$
F&I Gross Profit - New
34,774
$
27,913
$
Industry SAAR (millions)
12.1
11.3
7.1%
9
Up 18%
Overall:
Expect
J3
inventory
allocations
to
improve
as
summer
progresses.
Incentives:
Expect J3 incentives to increase as production resumes.
Domestics:
Wait and see attitude toward incentives and market share.
Demand:
Expect SAAR levels to return to pre-disaster levels in late
Q3. (1) Sonic new retail volume was 0.9% of U.S. auto unit
sales – Source: Bloomberg Financial Markets |
 10
Used Retail Vehicles
Q2
Q2
(dollars in thousands, except GPU)
2011
2010
B / (W) %
Used Retail Volume
27,141
24,382
11.3%
CPO Volume
7,843
8,342
(6.0%)
Used GPU
1,458
$
1,542
$
(5.4%)
Used Gross Profit
39,560
$
37,586
$
5.3%
Used to New Ratio
0.96
0.99
F&I Gross Profit - Used
21,007
$
17,701
$
18.7%
Total Fixed Ops
147,785
$
141,804
$
4.2%
All-
Time
Record |
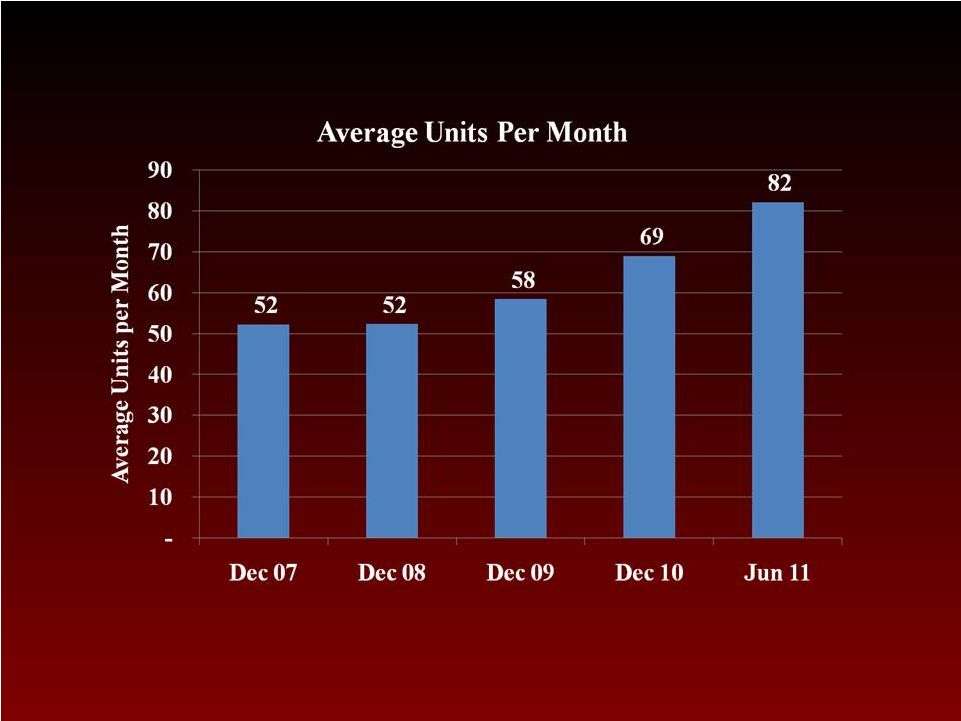 Used Volume –
Tracking 100 per Store
# Stores Averaging 100+ per Month:
9
7
17
21 25
11 |
 Fixed Operations
YOY Sales
Increase of
$15.7M, or
5.5%
Gross
Margin was
49.3% and
Fixed Abs
was 88% in
Q2 2011
12
$141.8
$140.6
$141.1
$143.9
$147.8
$136
$138
$140
$142
$144
$146
$148
$150
Q2 2010
Q3 2010
Q4 2010
Q1 2011
Q2 2011
Gross
$283.8
$283.7
$285.4
$291.8
$299.5
$275
$280
$285
$290
$295
$300
$305
Q2 2010
Q3 2010
Q4 2010
Q1 2011
Q2 2011
Sales
All-
Time
Record
All-
Time
Record |
 13
Summary
Base business continues to grow
New vehicle market share continues to increase
Used retail vehicle volume continues to grow at double-digit
rate
F&I benefiting from growth in new and used volume
Leveraging SG&A as gross profit grows
Automotive retail industry continues its steady recovery
Still forecasting a 12.5 million SAAR
Expect Japanese brands to improve in 2H of Q3
Maintain
continuing
operations
earnings
guidance
of
$1.18
-
$1.28
for FY 2011 |