Attached files
 Regions Financial
2
nd
Quarter Earnings Conference Call
July 26, 2011 |
 Continued Progress; Core PPNR* reaches $500MM
›
3
rd
consecutive
quarter
of
profitability,
highest
level
since
third
quarter
2008
›
Continued solid core business performance, core PPNR increased 9%* linked
quarter ›
Credit costs** negatively impacted EPS ($0.22) per share
›
Reached settlement with SEC, FINRA and state regulators; review of strategic
alternatives for Morgan Keegan underway
›
Announced formation of new Wealth Management Line of Business
›
Profitably gaining market share, growing customer base and expanding existing
relationships ›
Re-entry
into
credit
card
business
--
repurchased
$1.2B
in
customer
balances
›
Focused on improving productivity and efficiencies
($ in millions)
2Q10
1Q11
2Q11
Net Income (Loss)
($335)
$17
$55
EPS
($0.28)
$0.01
$0.04
Net Interest Margin
2.87%
3.07%
3.05%
Loan Loss Provision
$651
$482
$398
Earnings
Highlights
* See appendix for non-GAAP reconciliation
** Includes loan loss provision, other real estate expense and net loss / (gain) on
HFS sales 1 |
 Solid
Core Performance 2
Improvement
›
Key credit metrics continue to improve
›
Formation of non-performing loans declined for the 3rd consecutive
quarter ›
Non-performing loans, excluding loans held for sale, declined for the 5th
consecutive quarter or 10%
›
Total loan loss provision declined 17% linked quarter or $84MM
›
Criticized and classified loans continued to decline
Business
Performance
Improvement
›
Targeting a more diversified and balanced loan mix
›
Consumer loan production increased 14% year-to-date and 8% linked
quarter ›
Growth
in
indirect
lending
–
expected
to
sign
1,200
auto
dealerships
by
year
end
›
Purchase of credit card portfolio allows us to better serve our customers
›
Product innovation will contribute to fee revenue and further diversify revenue
streams ›
Business services loan production increased 14% over prior year
›
Commercial and industrial commitments increased 7% year to date
›
Small
business
remains
a
priority
--
providing
loans,
fee
income
and
deposits
›
Average low-cost deposits increased 4% versus prior year, deposit costs
declined 26 bps ›
Despite
legislative
and
regulatory
rule
changes,
service
charges
revenue
grew
7%
over
prior quarter
Asset
Quality |
 2Q11
Earnings Highlights 3
›
Adjusted PPNR reaches highest level since third quarter 2008
›
Loan
loss
provision
declined
$84MM
impacted
by
loan
loss
reserve
reduction
of
$150MM
related
primarily to asset dispositions
›
$44 million tax benefit related to a portion of the regulatory settlement
* See appendix for non-GAAP reconciliation
($ in millions, except EPS)
2Q10
1Q11
2Q11
$
%
$
%
Net Interest Income
$ 856
$ 863
$ 864
$ 1
0%
$ 8
1%
Adjusted Non-Interest Revenue*
756
764
757
(7)
-1%
1
0%
Adjusted Non-Interest Expense*
1,126
1,167
1,121
(46)
-4%
(5)
0%
Adjusted PPNR*
486
460
500
40
9%
14
3%
Net Charge-Offs
651
481
548
67
14%
(103)
-16%
Loan Loss Reserve Build / (Reduction)
-
1
(150)
(151)
NM
(150)
NM
Loan Loss Provision
651
482
398
(84)
-17%
(253)
-39%
Net Income (Loss) Available to
Common Shareholders
$ (135)
$ 17
$ 55
$ 38
224%
$ 190
141%
EPS
($0.28)
$0.01
$0.04
$0.03
337%
$0.32
116%
Adjusted EPS*
($0.11)
($0.03)
$0.04
$0.06
-221%
$0.15
131%
2Q11 vs. 1Q11
2Q11 vs. 2Q10 |
 Non-Performing Loan Inflows Declined 24%
Ending Balances
4
NPL Inflows by Type
Business Services Gross NPLs |
 Non-Performing Loans* Declined 10%
5
›
Non-performing loans, excluding loans
held for sale, declined $303 million or
10%
›
$620 million of criticized loans were
sold or moved to held for sale
›
Non-performing assets declined $331
million or 8%
›
Delinquencies improved for the 5th
straight quarter
›
Business Services criticized loans
declined approximately $1.2 billion or
14%
* Excluding non-performing loans held for sale
Non-Performing Assets |
 Allowance Coverage of Non-Performing Loans
Increases 9 bps
Sales/
HFS
(1)
(1) Loan charge-offs related to Sales and Transfer to Held for Sale
(2) Excludes loans held for sale
6
Loan Loss Provision
Allowance and Coverage |
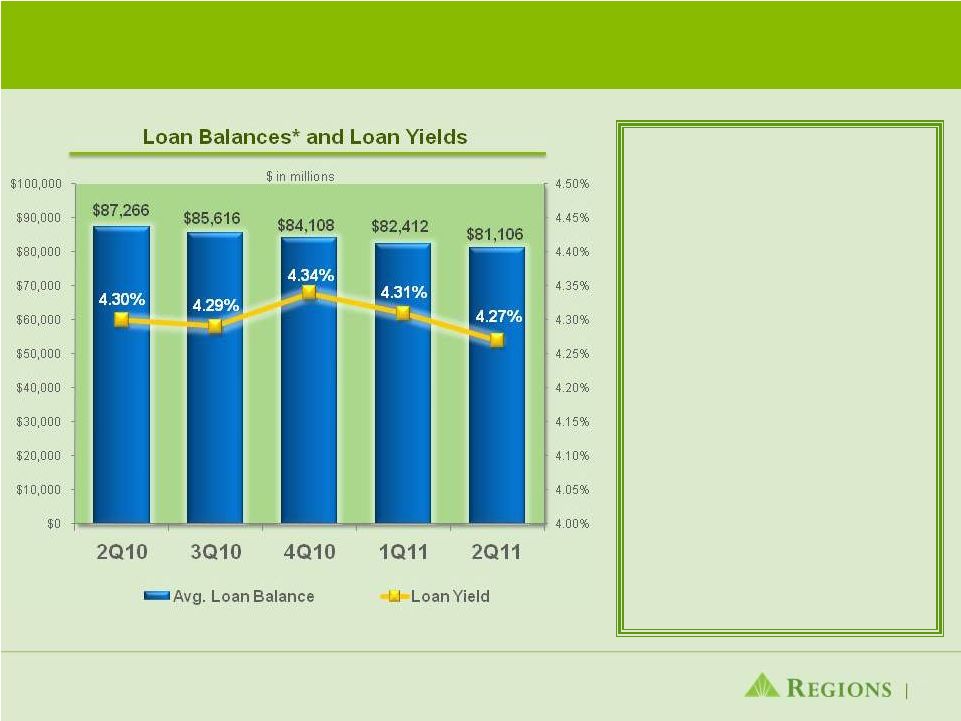 Loan
Balances Reflect Commercial Growth offset by Continued Decline in Investor Real
Estate ›
Commercial loan balances on
an ending basis increased 7%
from one year ago reflecting
strength in our middle market
segment
›
Commercial & industrial
commitments increased 4%
linked quarter to $28 billion
›
Investor Real Estate declined
$1.4 billion from prior quarter on
an ending balance and now
totals $13.4 billion
›
Purchased $1.2 billion credit
card portfolio
›
Decrease in loan yield due to
loans resetting to declining 30-
day LIBOR
7
* Average Balances |
 ›
Our improved deposit mix is
resulting in lower deposit costs
›
Low cost deposits as a % of
total deposits increased to
76.6% in 2Q11 from 72.5% in
2Q10
›
Repricing opportunities remain
with over $6.1 billion of CD’s
maturing in the next 6 months
at an average rate of 1.48%
›
Deposit costs declined 6 bps
linked quarter; down 26 bps
year-over-year
8
* Average Balances
Deposit Balances* and Deposit Costs
Deposit Costs Decline 6 bps; Driven by Improving
Deposit Mix |
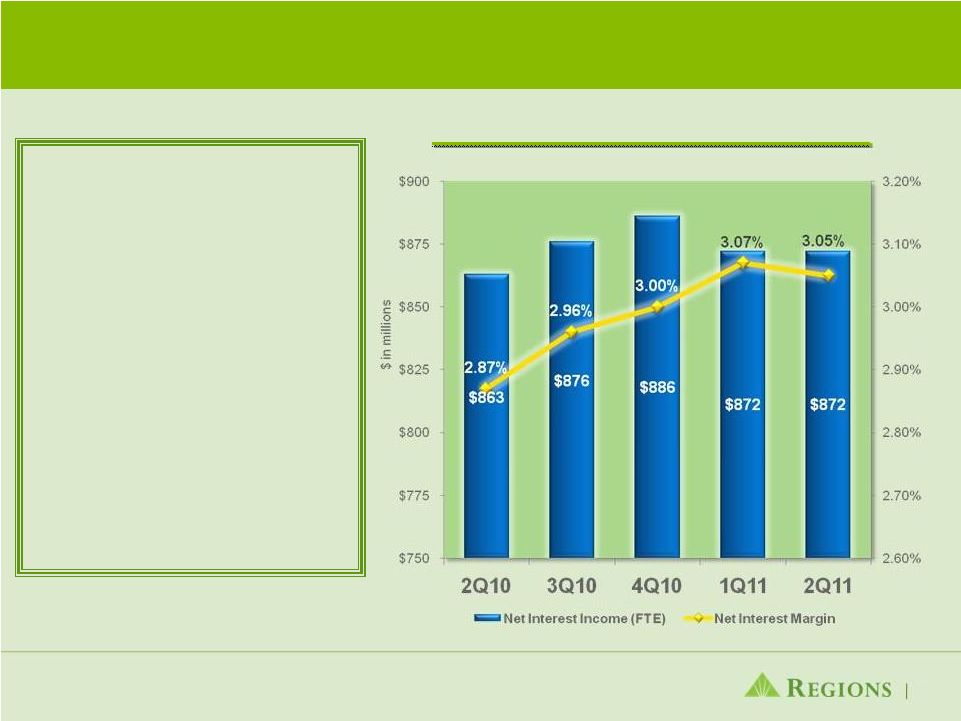 Net
Interest Income Steadied ›
Net Interest Margin Up 18
bps versus prior year
›
Net interest margin decline
impacted by excess liquidity
›
Repositioned securities
portfolio, shortened duration
resulting in $24 million of
securities gains
9
Net Income and Net Interest Margin |
 Non-Interest Revenues Reflect Lower Brokerage
Income Offset by Solid Service Charges Growth
›
Adjusted non-interest revenue* 1%
lower than prior quarter
›
Morgan Keegan’s revenues down
due to lower private client and
capital markets revenue in 2Q11
›
Service charges increase reflects
ongoing restructure of our accounts
to fee-eligible. Interchange income
benefited from increased
transaction volume
›
Launch of new products and
ongoing restructuring of checking
accounts to fee-eligible
›
Mortgage revenue increased 11%
due to improved MSR and related
hedging performance
10
* Non –
GAAP; Refer to Appendix
Adjusted Non-Interest Revenue* |
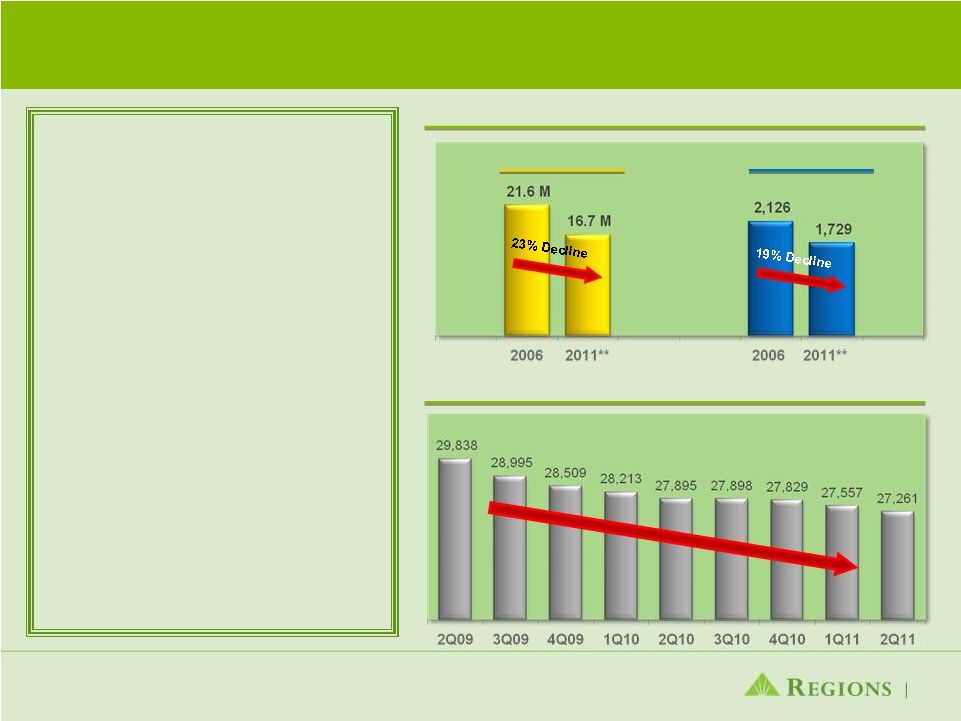 Focused Expense Management Leads to 4% Decline
in Expenses
›
Adjusted non-interest expenses* 4%
lower versus prior quarter
›
Salaries and benefits declined 6%
linked quarter and professional and
legal fees declined $20 million linked
quarter
›
FDIC premium expenses increased
38% or $20 million versus 1Q11
›
Credit-related expenses declined
modestly and represent 8% of
second quarter’s adjusted
expenses*
›
Recorded $77 million of charges
related to consolidation of
approximately 40 branches and
property and equipment
›
Headcount down 568 positions
during 2011
11
* Non –
GAAP; Refer to Appendix
** Proforma to include 40 branch consolidations
Occupancy Detail
Headcount Trends
Square Footage
Branch Count |
 Capital Ratios Remain Strong;
Liquidity Profile Solid
* Current Quarter ratios are estimated
** Non-GAAP -
Subject to change as interpretation of Basel III rules is ongoing and dependent on
guidance from ›
Well-positioned with respect to the Liquidity Coverage Ratio prescribed under
Basel III ›
Solid liquidity at both the bank and holding company
›
Loan-to-deposit ratio of 84.3%
12
Capital Ratios
Favorable Liquidity Position
Basel
and
regulators;
see
appendix
for
reconciliation |
 |
 ›Forward-
Looking Statements
14
This presentation may include forward-looking statements which reflect Regions’ current views
with respect to future events and financial performance. The Private Securities Litigation Reform Act of 1995
(“the Act”) provides a “safe harbor” for forward-looking statements which are
identified as such and are accompanied by the identification of important factors that could cause actual results to differ materially from the
forward-looking statements. For these statements, we, together with our subsidiaries, claim
the protection afforded by the safe harbor in the Act. Forward-looking statements are not based on historical information,
but rather are related to future operations, strategies, financial results or other developments.
Forward-looking statements are based on management’s expectations as well as certain assumptions and estimates
made by, and information available to, management at the time the statements are made. Those
statements are based on general assumptions and are subject to various risks, uncertainties and other factors that
may cause actual results to differ materially from the views, beliefs and projections expressed in such
statements. These risks, uncertainties and other factors include, but are not limited to, those described below:
The Dodd-Frank Wall Street Reform and Consumer Protection Act became law on July 21, 2010, and a
number of legislative, regulatory and tax proposals remain pending. Additionally, the U.S. Treasury
and federal banking regulators continue to implement, but are also beginning to wind down, a number of
programs to address capital and liquidity in the banking system. Proposed rules, including those that
are part of the Basel III process, could require banking institutions to increase levels of capital.
All of the foregoing may have significant effects on Regions and the financial services industry, the exact
nature of which cannot be determined at this time.
The impact of compensation and other restrictions imposed under the Troubled Asset Relief Program
(“TARP”) until Regions repays the outstanding preferred stock and warrant issued under the TARP,
including restrictions on Regions’ ability to attract and retain talented executives and
associates. Possible additional loan losses, impairment of goodwill and other intangibles, and
adjustment of valuation allowances on deferred tax assets and the impact on earnings and capital.
Possible changes in interest rates may increase funding costs and reduce earning asset yields, thus
reducing margins. Increases in benchmark interest rates would also increase debt service requirements
for customers whose terms include a variable interest rate, which may negatively impact the ability of
borrowers to pay as contractually obligated. Possible changes in general economic and business
conditions in the United States in general and in the communities Regions serves in particular, including any prolonging or worsening of the current
unfavorable economic conditions including unemployment levels.
Possible changes in the creditworthiness of customers and the possible impairment of the
collectability of loans. Possible changes in trade, monetary and fiscal policies, laws and
regulations and other activities of governments, agencies, and similar organizations, may have an adverse effect on business.
The current stresses in the financial and real estate markets, including possible continued
deterioration in property values. Regions' ability to manage fluctuations in the value of
assets and liabilities and off-balance sheet exposure so as to maintain sufficient capital and liquidity to support Regions' business.
Regions' ability to expand into new markets and to maintain profit margins in the face of competitive
pressures. Regions' ability to develop competitive new products and services in a timely manner
and the acceptance of such products and services by Regions' customers and potential customers.
Regions' ability to keep pace with technological changes.
Regions' ability to effectively manage credit risk, interest rate risk, market risk, operational risk,
legal risk, liquidity risk, and regulatory and compliance risk. Regions’ ability to ensure
adequate capitalization which is impacted by inherent uncertainties in forecasting credit losses.
The cost and other effects of material contingencies, including litigation contingencies, and any
adverse judicial, administrative or arbitral rulings or proceedings. The effects of increased
competition from both banks and non-banks. The effects of geopolitical instability and
risks such as terrorist attacks. Possible changes in consumer and business spending and saving
habits could affect Regions' ability to increase assets and to attract deposits. The effects of
weather and natural disasters such as floods, droughts, wind, tornados and hurricanes, and the effects of man-made disasters.
Possible downgrades in ratings issued by rating agencies.
Potential dilution of holders of shares of Regions’ common stock resulting from the U.S.
Treasury’s investment in TARP. Possible changes in the speed of loan prepayments by
Regions’ customers and loan origination or sales volumes. Possible acceleration of
prepayments on mortgage-backed securities due to low interest rates and the related acceleration of premium amortization on those securities.
The effects of problems encountered by larger or similar financial institutions that adversely affect
Regions or the banking industry generally. Regions’ ability to receive dividends from its
subsidiaries. The effects of the failure of any component of Regions’ business
infrastructure which is provided by a third party. Changes in accounting policies or procedures
as may be required by the Financial Accounting Standards Board or other regulatory agencies.
The effects of any damage to Regions’ reputation resulting from developments related to any of
the items identified above. The foregoing list of factors is not exhaustive. For discussion of these and other factors that may
cause actual results to differ from expectations, look under the captions “Forward-Looking Statements” and “Risk
Factors” in Regions’ Annual Report on Form 10-K for the year ended December 31, 2010 and
quarterly report on Form 10-Q for the quarter ended March 31, 2011, as on file with the Securities and Exchange
Commission.
The words "believe," "expect," "anticipate," "project," and similar
expressions often signify forward-looking statements. You should not place undue reliance on any forward-looking statements, which speak only as of
the date made. We assume no obligation to update or revise any forward-looking statements that are
made from time to time. |
 Non-GAAP Reconciliation: PPNR
15
($ in millions)
2Q10
3Q10
4Q10
1Q11
2Q11
Net interest income (GAAP)
856
$
868
$
877
$
863
$
864
$
Non-interest income (GAAP)
756
750
1,213
843
781
Adjustments:
Securities (gains) losses, net
-
(2)
(333)
(82)
(24)
Leveraged lease termination gains
-
-
(59)
-
-
Loss (gain) on sale of mortgage loans
-
-
(26)
3
-
Adjusted non-interest income (non-GAAP)
756
748
795
764
757
Adjusted total revenue (non-GAAP)
1,612
$
1,616
$
1,672
$
1,627
$
1,621
$
Non-interest expense (GAAP)
1,326
$
1,163
$
1,266
$
1,167
$
1,198
$
Adjustments:
Regulatory charge
(200)
-
-
-
-
Loss on extinguishment of debt
-
-
(55)
-
-
Securities impairment, net
-
(1)
-
-
-
Branch consolidation and property and equipment charges
-
-
-
-
(77)
Adjusted non-interest expense (non-GAAP)
1,126
$
1,162
$
1,211
$
1,167
$
1,121
$
Adjusted pre-tax pre-provision net revenue
486
$
454
$
461
$
460
$
500
$ |
 Non-GAAP Reconciliation: EPS
16
2Q10
1Q11
2Q11
EPS as reported (GAAP)
(0.28)
$
0.01
$
0.04
$
Significant Items:
Regulatory charge and related tax benefit
0.17
-
(0.03)
Securities (gains) losses, net
-
(0.04)
(0.01)
Branch consolidation and property and equipment charges
-
-
0.04
Adjusted EPS (Non-GAAP)
(0.11)
$
(0.03)
$
0.04
$ |
 Non-GAAP Reconciliation: Capital
17
($ amounts in millions)
06/30/11
Stockholders' equity (GAAP)
16,888
Non-qualifying goodwill and intangibles
(1)
(5,754)
Adjustments, including other comprehensive income related to cash flow hedges,
disallowed deferred tax assets, threshold deductions and other
adjustments (877)
10,257
Qualifying non-controlling interests
4
Basel III Tier 1 Capital (non-GAAP)
10,261
Basel III Tier 1 Capital (non-GAAP)
10,261
Preferred Stock
(3,398)
Qualifying non-controlling interests
(4)
Basel III Tier 1 Common (non-GAAP)
6,859
Basel I risk-weighted assets
93,855
Basel III risk-weighted assets
(2)
95,363
Minimum
Basel III Tier 1 Capital Ratio
10.8%
8.5%
Basel III Tier 1 Common Ratio
7.2%
7.0%
(1)
Under Basel III, regulatory capital must be reduced by purchased credit card
relationship intangible assets. These assets are partially allowed in
Basel I capital.
(2)
Regions continues to develop systems and internal controls to precisely calculate risk-weighted
assets as required by Basel III. The amount included above is a reasonable approximation, based
on our understanding of the requirements. |