Attached files
| file | filename |
|---|---|
| 8-K - FORM 8-K - DOVER Corp | form8k-072211.htm |
| EX-99.2 - EXHIBIT 99.2 - DOVER Corp | form8k-072211ex992.htm |
| EX-99.1 - EXHIBIT 99.1 - DOVER Corp | form8k-072211ex991.htm |
Exhibit 99.3

Dover Corporation
Second Quarter 2011
Conference Call
Second Quarter 2011
Conference Call
July 22, 2011
10:30 am ET

2
Forward Looking Statements
We want to remind everyone that our comments
may contain forward-looking statements that are
inherently subject to uncertainties. We caution
everyone to be guided in their analysis of Dover
Corporation by referring to our Form 10-K for a list
of factors that could cause our results to differ from
those anticipated in any such forward-looking
statements.
We would also direct your attention to our internet
site, www.dovercorporation.com, where
considerably more information can be found.
site, www.dovercorporation.com, where
considerably more information can be found.
|
Revenue
|
$ 2.2B
|
↑ 21%
|
$ 4.1B
|
↑ 22%
|
|
EPS (cont.)
|
$1.31
|
↑ 44%
|
$2.28
|
↑ 47%
|
|
Bookings
|
$2.2B
|
↑ 15%
|
$4.5B
|
↑ 21%
|
|
Seg. Margins
|
17.4%
|
↑ 50 bps
|
16.5%
|
↑ 50 bps
|
|
Organic Rev.
|
|
↑ 14%
|
|
↑ 16%
|
|
Acq. Growth
|
|
↑ 4%
|
|
↑ 4%
|
|
FCF (a)
|
$136M
|
↓ 26%
|
$215M
|
↓ 7%
|
3
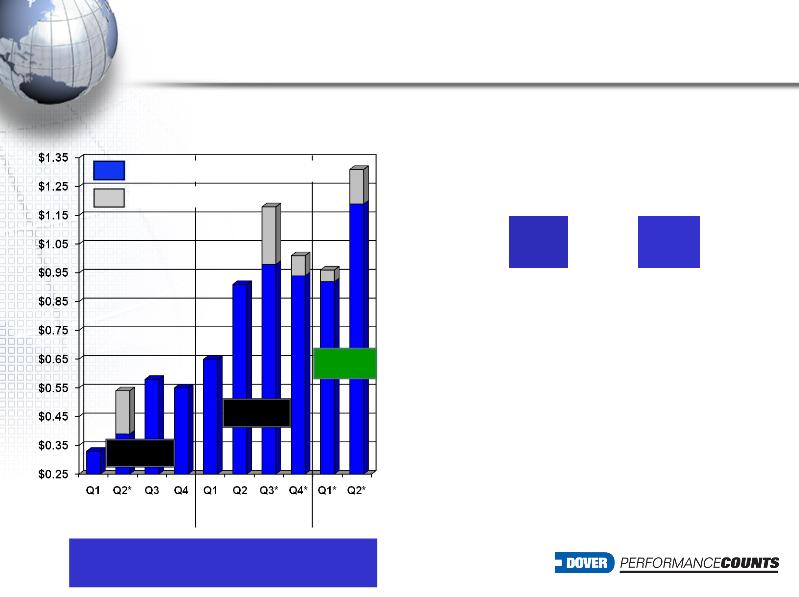
Dover’s Q2 2011 Performance
Continuing Earnings Per Share
2009
FY $3.74
• Strong results are broad-based, as all segments
achieved double-digit growth in revenue and
earnings
achieved double-digit growth in revenue and
earnings
•Solid organic revenue growth, with Fluid
Management, Industrial Products and Electronic
Technologies all over 15%
Management, Industrial Products and Electronic
Technologies all over 15%
•Segment operating margin of 17.4% is Dover’s
best ever
best ever
• Bookings strength is primarily driven by oil & gas
and global infrastructure resulting in a book-to-bill
of 1.03
and global infrastructure resulting in a book-to-bill
of 1.03
Q2
Q2/Q2
2010
FY $1.99
2011
* Includes discrete tax benefits of $0.15 EPS in
Q2 2009, $0.20 EPS in Q3 2010, $0.07 in Q4 2010, $0.04
in Q1 2011 and $0.12 in Q2 2011
Q2 2009, $0.20 EPS in Q3 2010, $0.07 in Q4 2010, $0.04
in Q1 2011 and $0.12 in Q2 2011
YTD $2.28
1H
1H/1H
Adjusted continuing earnings per share
Discrete tax benefits
(a) See Form 10-Q for free cash flow reconciliation
4
Revenue
|
Q2 2011
|
Industrial
Products |
Engineered
Systems |
Fluid
Management |
Electronic
Technologies |
Total
Dover
|
|
Organic
|
20%
|
8%
|
16%
|
17%
|
14%
|
|
Net Acquisitions
|
2%
|
-
|
14%
|
-
|
4%
|
|
Currency
|
1%
|
4%
|
2%
|
2%
|
3%
|
|
Total
|
23%
|
12%
|
32%
|
19%
|
21%
|
|
1H 2011
|
Industrial
Products |
Engineered
Systems |
Fluid
Management |
Electronic
Technologies |
Total
Dover
|
|
Organic
|
20%
|
11%
|
18%
|
21%
|
16%
|
|
Net Acquisitions
|
1%
|
-
|
14%
|
-
|
4%
|
|
Currency
|
1%
|
3%
|
1%
|
2%
|
2%
|
|
Total
|
22%
|
14%
|
33%
|
23%
|
22%
|
5
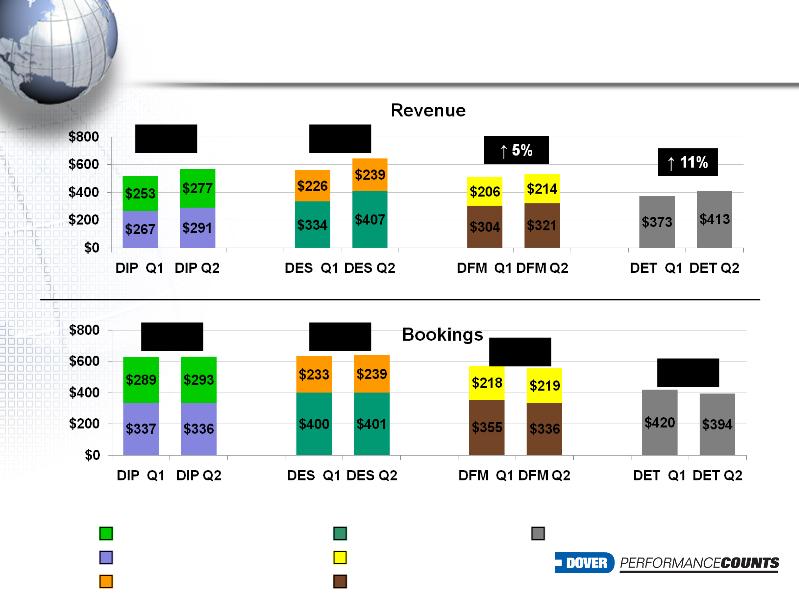
Sequential Results - Q1 11 / Q2 11
Material Handling
Fluid Solutions
Mobile Equipment
Energy
Product Identification
Engineered Products
↑ 9%
↑ 15%
Electronic Technologies
↑ 1%
↑ 1%
↓ 3%
↓ 6%
$ in millions

6
Industrial Products
•Revenue and bookings growth
was broad-based, led by strong
downstream energy activity and
solid infrastructure markets
was broad-based, led by strong
downstream energy activity and
solid infrastructure markets
•Margin impacted by product
mix, increased investment in
sales and marketing, and the
one-time gain on a property sale
in Q2 2010
mix, increased investment in
sales and marketing, and the
one-time gain on a property sale
in Q2 2010
•Book-to-bill at 1.11
•Backlog grew 40% to $702
million
million
$ in millions
|
|
Q2
2011
|
Q2
2010
|
%
Change
|
|
Revenue
|
$567
|
$462
|
+23%
|
|
Earnings
|
$ 73
|
$ 62
|
+19%
|
|
Margin
|
12.9%
|
13.3%
|
↓ 40 bps
|
|
Bookings
|
$628
|
$512
|
+23%
|
Quarterly Comments
|
|
1H
2011
|
1H
2010
|
%
Change
|
|
Revenue
|
$1,086
|
$891
|
+22%
|
|
Earnings
|
$ 138
|
$113
|
+22%
|
|
Margin
|
12.7%
|
12.6%
|
↑ 10 bps
|
|
Bookings
|
$1,254
|
$947
|
+32%
|

7
Engineered Systems
•All companies posted revenue
gains with retail refrigeration
having the largest positive impact
gains with retail refrigeration
having the largest positive impact
• Strong earnings leverage and
operating margin performance at
Engineered Products were offset
by new product launch related
costs at Product ID
operating margin performance at
Engineered Products were offset
by new product launch related
costs at Product ID
•Product ID’s results improve
sequentially within the quarter on
increased sales activities
sequentially within the quarter on
increased sales activities
•Bookings up 6%, led by strong
activity at SWEP, partially offset by
a moderating refrigeration case
market; book-to-bill is 0.99
activity at SWEP, partially offset by
a moderating refrigeration case
market; book-to-bill is 0.99
$ in millions
Quarterly Comments
|
|
Q2
2011
|
Q2
2010
|
%
Change
|
|
Revenue
|
$646
|
$577
|
+12%
|
|
Earnings
|
$ 94
|
$ 85
|
+11%
|
|
Margin
|
14.6%
|
14.7%
|
↓ 10 bps
|
|
Bookings
|
$640
|
$602
|
+6%
|
|
|
1H
2011
|
1H
2010
|
%
Change
|
|
Revenue
|
$1,206
|
$1,061
|
+14%
|
|
Earnings
|
$ 161
|
$ 139
|
+16%
|
|
Margin
|
13.4%
|
13.1%
|
↑ 30 bps
|
|
Bookings
|
$1,273
|
$1,191
|
+7%
|

8
Fluid Management
•Revenue growth was broad-
based, especially at our
businesses serving the oil & gas
markets
based, especially at our
businesses serving the oil & gas
markets
•Operating margin improvement
driven by volume; especially
strong revenue growth in Energy
driven by volume; especially
strong revenue growth in Energy
•Fluid Solutions continues to
perform at a high level with strong
activity in their petro-chemical and
energy markets
perform at a high level with strong
activity in their petro-chemical and
energy markets
•Book-to-bill of 1.04
$ in millions
Quarterly Comments
|
|
Q2
2011
|
Q2
2010
|
%
Change
|
|
Revenue
|
$535
|
$404
|
+32%
|
|
Earnings
|
$131
|
$ 96
|
+37%
|
|
Margin
|
24.6%
|
23.8%
|
↑ 80 bps
|
|
Bookings
|
$555
|
$418
|
+33%
|
|
|
1H
2011
|
1H
2010
|
%
Change
|
|
Revenue
|
$1,043
|
$784
|
+33%
|
|
Earnings
|
$ 245
|
$183
|
+34%
|
|
Margin
|
23.5%
|
23.3%
|
↑ 20 bps
|
|
Bookings
|
$1,127
|
$806
|
+40%
|

9
Electronic Technologies
•Revenue growth was driven by
strong solar equipment deliveries,
and continued strong demand for
MEMS microphones; telecom end
-markets were soft
strong solar equipment deliveries,
and continued strong demand for
MEMS microphones; telecom end
-markets were soft
•Operating margin increase was
driven by good leverage on higher
volume
driven by good leverage on higher
volume
•Sound Solutions acquisition
closed in early July and will
operate as Knowles Sound
Solutions
closed in early July and will
operate as Knowles Sound
Solutions
•Strong bookings gains at
Knowles were offset by weaker
electronic equipment orders,
especially solar equipment,
resulting in book-to-bill of 0.95
Knowles were offset by weaker
electronic equipment orders,
especially solar equipment,
resulting in book-to-bill of 0.95
$ in millions
Quarterly Comments
|
|
Q2
2011
|
Q2
2010
|
%
Change
|
|
Revenue
|
$413
|
$346
|
+19%
|
|
Earnings
|
$ 77
|
$ 60
|
+29%
|
|
Margin
|
18.6%
|
17.2%
|
↑ 140 bps
|
|
Bookings
|
$394
|
$394
|
Flat
|
|
|
1H
2011
|
1H
2010
|
%
Change
|
|
Revenue
|
$786
|
$637
|
+23%
|
|
Earnings
|
$137
|
$104
|
+31%
|
|
Margin
|
17.4%
|
16.4%
|
↑ 100 bps
|
|
Bookings
|
$814
|
$753
|
+8%
|
Q2 2011 Overview
|
|
Q2 2011
|
|
Net Interest Expense
|
$28.1 million, up $1 million from last year, due
to higher outstanding debt |
|
Corporate Expense
|
$35.3 million, up $3 million from last year, and
in-line with expectations |
|
Effective Tax Rate (ETR)
|
Q2 rate was 20.2%. Rate reflects $0.12 EPS
benefit on resolution of certain domestic tax matters. Adjusting for this benefit, the normalized rate would have been 27.4% |
10

11
FY 2011 Guidance - Update
• Revenue:
– Core revenue: ≈ 12.0% - 14.0%
– Acquisitions: ≈ 6.0%
– Total revenue: ≈ 18.0% - 20.0%
• Corporate expense: ≈ $135 million (unchanged)
• Interest expense: ≈ $116 million (unchanged)
• Full-Year Tax Rate: ≈ 27% - 27.5%*
• Capital expenditures: ≈ 2.8% - 3.0% of rev. (unchanged)
• Free cash flow for full year: ≈ 10% - 11% of rev. (unchanged)
* Excludes Q1 & Q2 discrete tax benefits of $0.16 EPS
(Sound Solutions = 3%)
• 2010 EPS - Continuing Ops $3.74
– Less 2010 tax benefits: ($0.27)
• 2010 Adjusted EPS - Continuing Ops $3.47
– Volume, mix, price (inc. FX): $0.67 - $0.76
– Net benefits of productivity: $0.26 - $0.30
– Acquisitions: $0.06 - $0.07
– Investment / Compensation: ($0.16 - $0.20)
– Corporate expense: -
– Interest: ($0.03)
– Tax (including discrete tax benefits(1) and lower rate): $0.23
• 2011 EPS - Continuing Ops $4.50 - $4.60
12
2011 EPS Guidance Bridge - Cont. Ops
(inc. Sound Solutions: -$0.03 to -$0.05)
(1) $0.04 in Q1 2011 and $0.12 in Q2 2011

2011 & 2012 Knowles Sound Solutions
13
|
|
2H 2011
|
FY 2012
|
|
Revenue
|
$190M - $200M
|
$400M - $410M
|
|
EPS
|
-$0.03 to -$0.05 (a)
|
+$0.18 to +$0.22
|
Q3 2011 EPS dilution is expected to be -$0.06 to -$0.08; Q4
2011 EPS accretion is expected to be $0.03
2011 EPS accretion is expected to be $0.03
(a)
Marginal tax rate for Knowles Sound Solutions is expected
to be ≈ 15% - 20%
to be ≈ 15% - 20%
Note: