Attached files
| file | filename |
|---|---|
| 8-K - FORM 8-K - ManpowerGroup Inc. | form_8-k.htm |
| EX-99.1 - PRESS RELEASE DATED JULY 21, 2011 - ManpowerGroup Inc. | exhibit_99-1.htm |
Exhibit 99.2

ManpowerGroup 2011 2nd Quarter Results July 2011
ManpowerGroup
2nd Quarter
July 21, 2011

ManpowerGroup 2011 2nd Quarter Results July
2011
2011
Forward-Looking Statement
This presentation includes forward-looking statements,
including earnings projections which are subject to risks and
uncertainties. Actual results might differ materially from those
projected in the forward-looking statements. Additional
information concerning factors that could cause actual results
to materially differ from those in the forward-looking statements
is contained in the Manpower Inc. Annual Report on Form 10-K
dated December 31, 2010, which information is incorporated
herein by reference, and such other factors as may be
described from time to time in the Company’s SEC filings.

ManpowerGroup 2011 2nd Quarter Results July
2011
2011
|
|
Q2 Financial Highlights
|
|
24%
|
Revenue $5.7B
|
|
12% CC
|
|
|
40 bps
|
Gross Margin 17.0%
|
|
91%
|
Operating Profit $151M
|
|
67% CC
|
|
|
100 bps
|
OP Margin 2.7%
|
|
118%
|
EPS $0.87
|
|
90% CC
|
Throughout this presentation, the difference between reported variances and Constant Currency (CC) variances
represents the impact of currency on our financial results. Constant Currency is further explained on our Web site.
represents the impact of currency on our financial results. Constant Currency is further explained on our Web site.
Consolidated Financial Highlights
3
ManpowerGroup 2011 2nd Quarter Results July
2011
2011
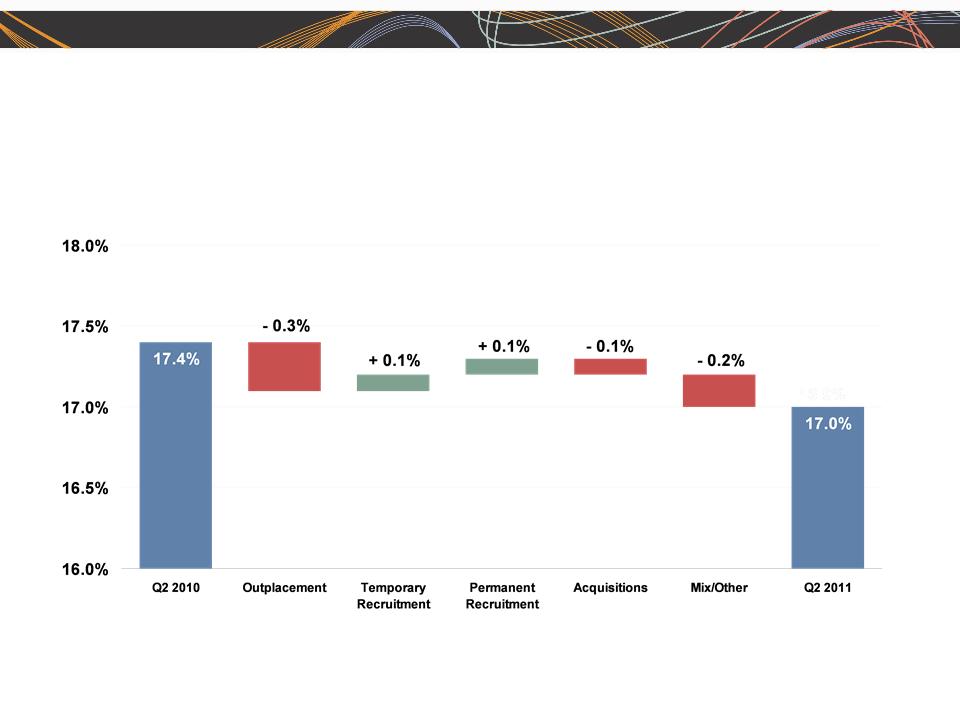
Consolidated Gross Margin Change
4

ManpowerGroup 2011 2nd Quarter Results July
2011
2011
|
|
Q2 Financial Highlights
|
|
13%
|
Revenue $1.2B
|
|
12% CC
|
|
|
69%
|
OUP $40M
|
|
67% CC
|
|
|
110 bps
|
OUP Margin 3.4%
|
Americas Segment
(21% of Revenue)
(1) Included in these amounts is the US, which had revenue of $792M (+9%) and OUP of $27M (+85%).
Operating Unit Profit (OUP) is the measure that we use to evaluate segment performance.
OUP is equal to segment revenues less direct costs and branch and national
headquarters operating costs.
OUP is equal to segment revenues less direct costs and branch and national
headquarters operating costs.
(1)
5

ManpowerGroup 2011 2nd Quarter Results July
2011
2011
Americas - Q2 Revenue Growth YoY
Revenue Growth - CC
Revenue Growth
% of Segment
Revenue
68%
12%
6%
14%
6

ManpowerGroup 2011 2nd Quarter Results July
2011
2011
7
|
111
|
Q2 Financial Highlights
|
|
30%
|
Revenue $2.2B
|
|
15% CC
|
|
|
95%
|
OUP $50M
|
|
72% CC
|
|
|
80 bps
|
OUP Margin 2.3%
|
Southern Europe Segment
(38% of Revenue)
(1)
(1) Included in these amounts is France, which had revenue of $1.6B (+15% CC) and OUP of $25M (+118% CC).

ManpowerGroup 2011 2nd Quarter Results July
2011
2011
Southern Europe - Q2 Revenue Growth YoY
Revenue Growth - CC
Revenue Growth
% of Segment
Revenue
75%
16%
5%
4%
8

ManpowerGroup 2011 2nd Quarter Results July
2011
2011
|
|
Q2 Financial Highlights
|
|
24%
|
Revenue $1.6B
|
|
9% CC
|
|
|
97%
|
OUP $56M
|
|
72% CC
|
|
|
130 bps
|
OUP Margin 3.6%
|
Northern Europe Segment
(28% of Revenue)
9

ManpowerGroup 2011 2nd Quarter Results July
2011
2011
Northern Europe - Q2 Revenue Growth YoY
Revenue Growth - CC
Revenue Growth
10

ManpowerGroup 2011 2nd Quarter Results July
2011
2011
|
|
Q2 Financial Highlights
|
|
31%
|
Revenue $663M
|
|
16% CC
|
|
|
59%
|
OUP $19M
|
|
43% CC
|
|
|
50 bps
|
OUP Margin 2.8%
|
APME Segment
(12% of Revenue)
11
ManpowerGroup 2011 2nd Quarter Results July
2011
2011
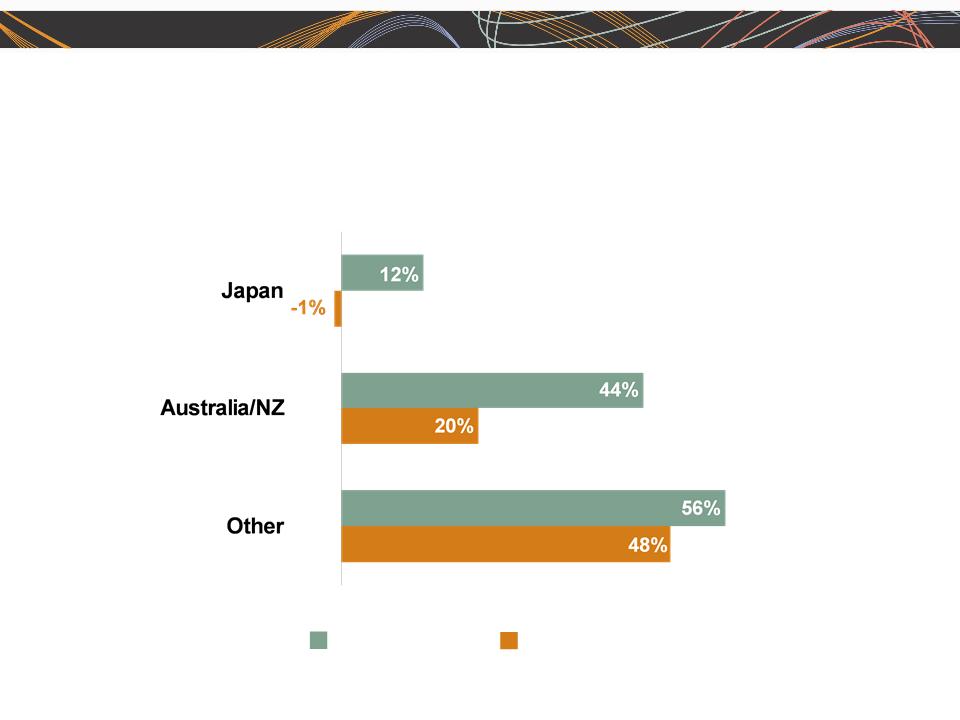
APME - Q2 Revenue Growth YoY
Revenue Growth - CC
Revenue Growth
% of Segment
Revenue
43%
28%
29%
12
(1) On an organic basis, Other revenue growth was 23% (+16% CC).
(1)

ManpowerGroup 2011 2nd Quarter Results July
2011
2011
|
|
Q2 Financial Highlights
|
|
14%
|
Revenue $85M
|
|
20% CC
|
|
|
64%
|
OUP $3M
|
|
64% CC
|
|
|
460 bps
|
OUP Margin 3.3%
|
Right Management Segment
(1% of Revenue)
13

ManpowerGroup 2011 2nd Quarter Results July
2011
2011
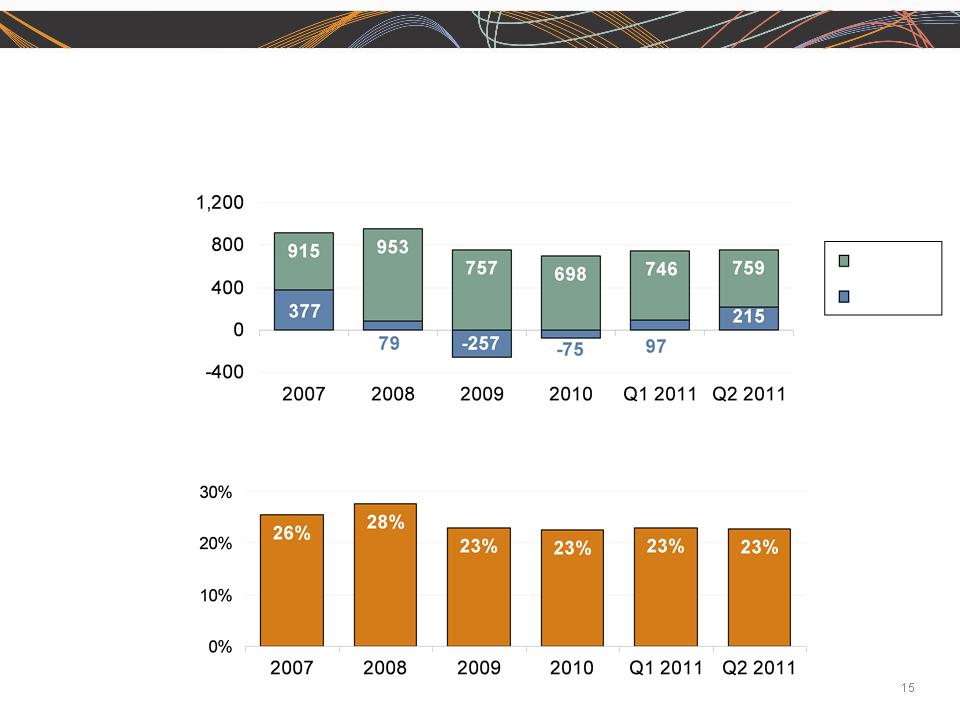
Cash Flow Summary - First Half
|
($ in millions)
|
2011
|
|
2010
|
|
Cash from Operations
|
(192)
|
|
(66)
|
|
Capital Expenditures
|
(28)
|
|
(28)
|
|
Free Cash Flow
|
(220)
|
|
(94)
|
|
Change in Debt
|
4
|
|
(5)
|
|
Share Repurchases
|
(19)
|
|
-
|
|
Acquisitions of Business
net of cash acquired
|
(15)
|
|
(259)
|
|
Effect of Exchange Rate Changes
|
31
|
|
(92)
|
|
Other
|
(10)
|
|
(12)
|
|
Change in Cash
|
(229)
|
|
(462)
|
|
|
|
|
|
|
|
|
|
|
14
ManpowerGroup 2011 2nd Quarter Results July
2011
2011
Balance Sheet Highlights
Total Debt
($ in millions)
Total Debt to
Total Capitalization
Total Debt
Net Debt

ManpowerGroup 2011 2nd Quarter Results July
2011
2011
(b)
Credit Facilities as of June 30, 2011
($ in millions)
($ in millions)
(a)
(a)
This $400M agreement requires, as of June 30, that we comply with a Debt-to-EBITDA ratio of less than 3.75 to 1 and a fixed charge coverage
ratio of greater than 1.35 to 1. As defined in the agreement, we had a Debt-to-EBITDA ratio of 1.35 and a fixed charge coverage ratio of 2.84
as of June 30, 2011. As of June 30, there were $2.2M of standby letters of credit issued under the agreement.
ratio of greater than 1.35 to 1. As defined in the agreement, we had a Debt-to-EBITDA ratio of 1.35 and a fixed charge coverage ratio of 2.84
as of June 30, 2011. As of June 30, there were $2.2M of standby letters of credit issued under the agreement.
Interest
Rate
Maturity
Date
Total
Outstanding
Remaining
Available
Euro Notes:
- Euro 200M
4.86%
June 2013
290
-
- Euro 300M
4.58%
June 2012
435
-
Revolving Credit Agreement
2.74%
Nov 2012
-
398
387
Uncommitted lines and Other
Various
Various
34
Total Debt
759
785
(b)
Represents subsidiary uncommitted lines of credit & overdraft facilities, which total $419.8M. Total subsidiary borrowing are limited to $300M
due to restrictions in our Revolving Credit Facility, with the exception of Q3 when subsidiary borrowings are limited to $600M.
due to restrictions in our Revolving Credit Facility, with the exception of Q3 when subsidiary borrowings are limited to $600M.
16

ManpowerGroup 2011 2nd Quarter Results July
2011
2011
Third Quarter Outlook
|
Revenue
|
Total
|
Up 16-18% (Up 8-10% CC)
|
|
|
Americas
|
Up 8-10% (Up 6-8% CC)
|
|
|
Southern Europe
|
Up 19-21% (Up 9-11% CC)
|
|
|
Northern Europe
|
Up 17-19% (Up 7-9% CC)
|
|
|
APME
|
Up 25-27% (Up 14-16% CC)
|
|
Right Management
|
Down 4-6% (Down 9-11% CC)
|
|
|
Gross Profit Margin
|
16.5 - 16.7%
|
|
|
Operating Profit Margin
|
2.6 - 2.8%
|
|
|
Tax Rate
|
46.5%
|
|
|
EPS
|
$0.90-$1.00 (Favorable $.10 Currency)
|
|
17

ManpowerGroup 2011 2nd Quarter Results July
2011
2011
Our brand and messages are resonating worldwide
“Prepare to play part in a new era: 20 epic shifts to
the Human Age”
the Human Age”
— South African newspaper, The Star
“Do changes as subtle
as those exemplified
by Manpower's
renaming matter?
Absolutely, said
Columbia University
business professor
Bernd Schmitt - right
down to the single-
word styling and the
replacement of ‘Inc.’
with ‘Group.’”
as those exemplified
by Manpower's
renaming matter?
Absolutely, said
Columbia University
business professor
Bernd Schmitt - right
down to the single-
word styling and the
replacement of ‘Inc.’
with ‘Group.’”
— Milwaukee Journal-
Sentinel
Sentinel
“Group is more
contemporary”
contemporary”
— Deborah Mitchell,
marketing professor,
University Wisconsin-
Madison
University Wisconsin-
Madison
“The Human Age
marks the pinnacle
marks the pinnacle
of a journey, when the
raw potential of
raw potential of
individuals ultimately
takes center stage.”
takes center stage.”
— HR Asia magazine
“Inc. sounds like a
faceless corporation,
where ‘group’ sounds
more human, more in
touch”
faceless corporation,
where ‘group’ sounds
more human, more in
touch”
— Jonathan Schroeder,
communications professor,
Rochester Institute of
Technology
communications professor,
Rochester Institute of
Technology
“[Manpower] used this
experience to identify a
new era, what it calls
experience to identify a
new era, what it calls
the human age.
It’s changing its name
and logo to fit a world
and logo to fit a world
where it says talent
replaces capital as the
key driver of economic
growth.”
replaces capital as the
key driver of economic
growth.”
— Bloomberg TV
a rebranding…
in a bid to improve
the marketing of its
services.”
the marketing of its
services.”
“Talent is the new
capital”
capital”
— Swedish newspaper
Sundsvalls Tidning
Sundsvalls Tidning
18
ManpowerGroup 2011 2nd Quarter Results July
2011
2011
19
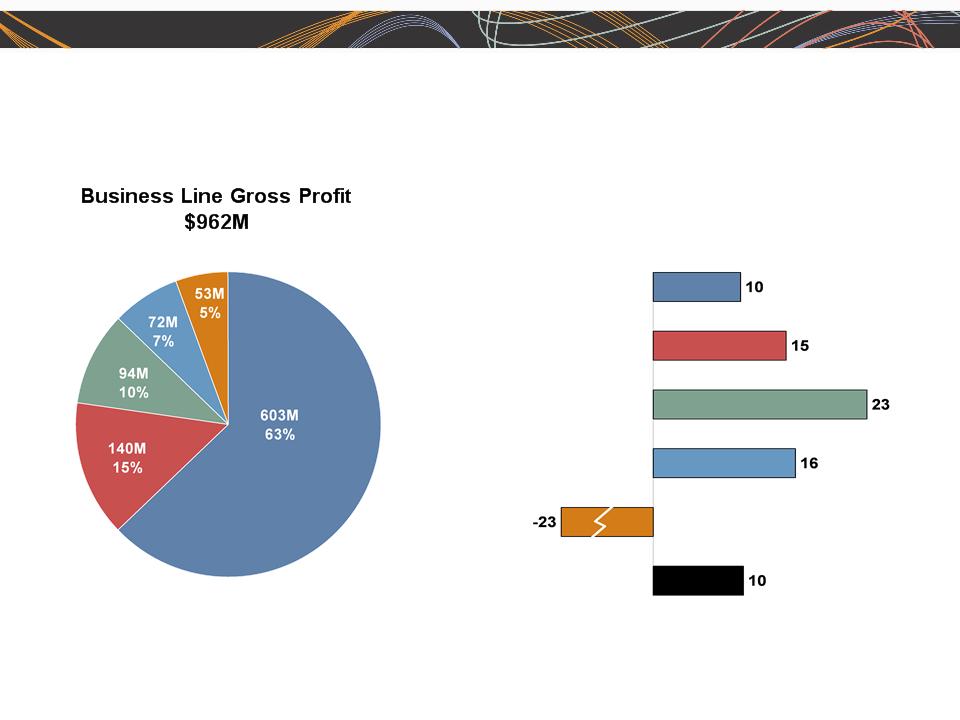
Gross Profit Growth
in CC %
Gross Profit Development - Q2 2011
█ Staffing █ Professional Resourcing █ Permanent Recruitment (excluding RPO)
█ ManpowerGroup Solutions █ Talent & Career Management █ ManpowerGroup - Total
ManpowerGroup 2011 2nd Quarter Results July
2011
2011
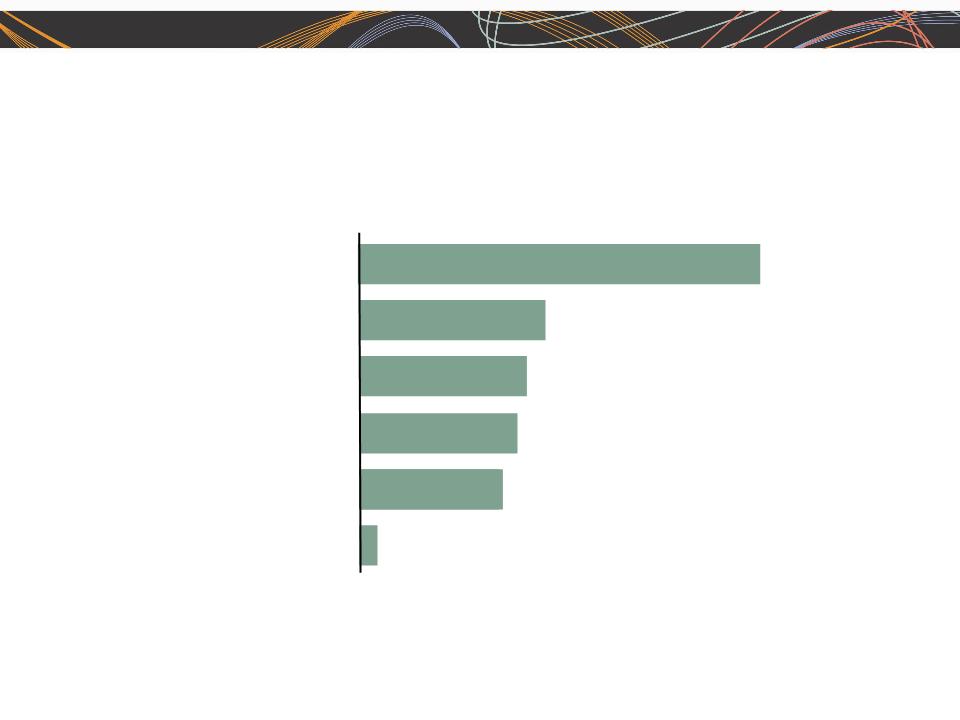
Employers foresee a more flexible and virtual
labor force
labor force
How will your company’s workforce change over the next 5 years?
% of respondents (n = 2,000)
Source: McKinsey Global Institute US Jobs Survey, 2011; McKinsey Global Institute analysis
More telecommuting
More offshored or
outsourced workers
outsourced workers
More older workers
(aged 55+)
Don’t know
Other types of changes
to the nature of work
to the nature of work
21.5%
25.5%
57.8%
19.9%
16.8%
2.9%
More part-time, temporary,
or contract workers
or contract workers
20

Questions