Attached files
Table of Contents
UNITED STATES
SECURITIES AND EXCHANGE COMMISSION
Washington, D.C. 20549
FORM 10-Q
| x | QUARTERLY REPORT PURSUANT TO SECTION 13 OR 15(d) OF THE SECURITIES EXCHANGE ACT OF 1934 |
For the quarterly period ended May 31, 2011
| ¨ | TRANSITION REPORT PURSUANT TO SECTION 13 OR 15(d) OF THE EXCHANGE ACT |
For the transition period from to
Commission File Number: 333-138512
FNDS3000 CORP
(Exact name of registrant as specified in its charter)
| DELAWARE | 51-0571588 | |
| (State or other jurisdiction of incorporation or organization) |
(IRS Employer Identification No.) |
4651 Salisbury Road Suite 533, Jacksonville, Florida 32256
(Address of principal executive offices) (Zip Code)
904-273-2702
(Registrant’s telephone number, including area code)
Indicate by check mark whether the registrant (1) has filed all reports required to be filed by Section 13 or 15(d) of the Securities Exchange Act of 1934 during the preceding 12 months (or for such shorter period that the registrant was required to file such reports), and (2) has been subject to such filing requirements for the past 90 days. Yes x No ¨
Indicate by check mark whether the registrant has submitted electronically and posted on its corporate Web site, if any, every Interactive Data File required to be submitted and posted pursuant to Rule 405 of Regulation S-T (§232.405 of this chapter) during the preceding 12 months (or for such shorter period that the registrant was required to submit and post such files). Yes ¨ No ¨
Indicate by check mark whether the registrant is a large accelerated filer, an accelerated filer, a non-accelerated filer, or a smaller reporting company.
| Large accelerated filer | ¨ | Accelerated filer | ¨ | |||
| Non-accelerated filer | ¨ | Smaller reporting company | x | |||
Indicate by check mark whether the registrant is a shell company (as defined in Rule 12b-2 of the Exchange Act). Yes ¨ No x
As of July 15, 2011, the Company had outstanding 86,073,662 shares of its common stock, par value $0.001.
Table of Contents
FNDS3000 CORP AND SUBSIDIARIES
FORM 10-Q
For the Quarterly Period Ended May 31, 2011
INDEX
| PART I |
3 | |||||
| Item 1. |
3 | |||||
| Item 2. |
Management’s Discussion and Analysis of Financial Condition and Results of Operations |
26 | ||||
| Item 3. |
45 | |||||
| Item 4. |
45 | |||||
| PART II |
45 | |||||
| Item 1. |
45 | |||||
| Item 1A. |
45 | |||||
| Item 2. |
46 | |||||
| Item 3. |
47 | |||||
| Item 4. |
47 | |||||
| Item 5. |
47 | |||||
| Item 6. |
47 | |||||
| 49 | ||||||
Table of Contents
PART 1 - FINANCIAL INFORMATION
| Item 1. | Financial Statements |
FNDS3000 CORP AND SUBSIDIARIES
CONDENSED CONSOLIDATED BALANCE SHEETS
| May 31, 2011 | August 31, 2010 | |||||||
| (Unaudited) | ||||||||
| ASSETS | ||||||||
| Current assets: |
||||||||
| Cash |
$ | 641,211 | $ | 332,399 | ||||
| Accounts receivable, net |
6,795 | 32,512 | ||||||
| Prepaid expenses and other current assets |
180,475 | 126,252 | ||||||
| Total current assets |
828,481 | 491,163 | ||||||
| Deposits |
33,547 | 29,701 | ||||||
| Restricted cash |
120,380 | 35,022 | ||||||
| Property and equipment, net |
81,948 | 77,004 | ||||||
| Software license, net |
1,059,601 | 1,236,199 | ||||||
| Total assets |
$ | 2,123,957 | $ | 1,869,089 | ||||
| LIABILITIES AND STOCKHOLDERS’ EQUITY | ||||||||
| Current liabilities: |
||||||||
| Accounts payable |
$ | 209,560 | $ | 164,032 | ||||
| Accrued payroll and benefits |
88,882 | 95,975 | ||||||
| Other accrued liabilities |
108,180 | 26,149 | ||||||
| Due to related parties |
44,322 | 203,902 | ||||||
| Total current liabilities |
450,944 | 490,058 | ||||||
| Total liabilities |
450,944 | 490,058 | ||||||
| Commitments and contingencies |
||||||||
| Stockholders’ equity: |
||||||||
| Preferred stock; $0.001 par value; 5,000,000 shares authorized; no shares issued and outstanding |
— | — | ||||||
| Common stock; $0.001 par value; 200,000,000 shares authorized; 85,906,995 issued and outstanding, May 31, 2011; 68,959,019 issued and outstanding, August 31, 2010; |
85,907 | 68,959 | ||||||
| Additional paid-in capital |
20,483,101 | 17,789,805 | ||||||
| Accumulated deficit |
(18,895,995 | ) | (16,479,733 | ) | ||||
| Total stockholders’ equity |
1,673,013 | 1,379,031 | ||||||
| Total liabilities and stockholders’ equity |
$ | 2,123,957 | $ | 1,869,089 | ||||
The accompanying notes are an integral part of these condensed consolidated financial statements.
3
Table of Contents
FNDS3000 CORP AND SUBSIDIARIES
CONDENSED CONSOLIDATED STATEMENTS OF OPERATIONS
(Unaudited)
| For the Three Months Ended May 31, |
For the Nine Months Ended May 31, |
|||||||||||||||
| 2011 | 2010 | 2011 | 2010 | |||||||||||||
| Revenue, net |
$ | 695,300 | $ | 110,274 | $ | 1,605,930 | $ | 277,383 | ||||||||
| Cost of revenue |
439,094 | 71,047 | 1,008,226 | 153,918 | ||||||||||||
| Gross margin |
256,206 | 39,227 | 597,704 | 123,465 | ||||||||||||
| Operating expenses: |
||||||||||||||||
| Processing, technical and financial expense |
251,683 | 204,163 | 1,015,858 | 569,327 | ||||||||||||
| Salaries and benefits expense |
365,804 | 406,489 | 1,105,161 | 1,320,668 | ||||||||||||
| Travel expense |
15,264 | 50,793 | 116,258 | 206,958 | ||||||||||||
| Professional and consultant expense |
32,429 | 174,479 | 321,892 | 523,658 | ||||||||||||
| Depreciation and amortization expense |
71,564 | 74,960 | 214,878 | 214,682 | ||||||||||||
| Other selling, general and administrative expense |
85,246 | 62,307 | 238,312 | 216,644 | ||||||||||||
| Total operating expense from operations |
821,990 | 973,191 | 3,012,359 | 3,051,937 | ||||||||||||
| Loss from operations |
(565,784 | ) | (933,964 | ) | (2,414,655 | ) | (2,928,472 | ) | ||||||||
| Other income (expense): |
||||||||||||||||
| Interest and other income |
2,393 | 873 | 10,674 | 4,803 | ||||||||||||
| Beneficial conversion expense |
— | — | — | (166,667 | ) | |||||||||||
| Interest and other expense |
(469 | ) | (111,844 | ) | (634 | ) | (162,725 | ) | ||||||||
| Loss from foreign currency remeasurement |
(8,354 | ) | (5,197 | ) | (9,580 | ) | (16,301 | ) | ||||||||
| Loss from asset disposal |
— | — | (2,067 | ) | — | |||||||||||
| Total other income (expense) from operations |
(6,430 | ) | (116,168 | ) | (1,607 | ) | (340,890 | ) | ||||||||
| Loss from operations before income taxes |
(572,214 | ) | (1,050,132 | ) | (2,416,262 | ) | (3,269,362 | ) | ||||||||
| Provision for income taxes |
— | — | — | — | ||||||||||||
| Loss from operations |
(572,214 | ) | (1,050,132 | ) | (2,416,262 | ) | (3,269,362 | ) | ||||||||
| Stock price indemnity |
— | — | — | (26,431 | ) | |||||||||||
| Loss from discontinued operations |
— | — | — | (26,431 | ) | |||||||||||
| Net loss |
$ | (572,214 | ) | $ | (1,050,132 | ) | $ | (2,416,262 | ) | $ | (3,295,793 | ) | ||||
| Net loss per common share: |
||||||||||||||||
| Basic and diluted loss per share: |
||||||||||||||||
| Loss from continuing operations |
$ | (0.01 | ) | $ | (0.02 | ) | $ | (0.03 | ) | $ | (0.07 | ) | ||||
| Loss from discontinued operations |
(0.00 | ) | (0.00 | ) | (0.00 | ) | (0.00 | ) | ||||||||
| Net loss |
$ | (0.01 | ) | $ | (0.02 | ) | $ | (0.03 | ) | $ | (0.07 | ) | ||||
| Weighted average common shares: |
||||||||||||||||
| Basic and diluted |
78,796,683 | 47,314,185 | 76,950,520 | 47,314,185 | ||||||||||||
The accompanying notes are an integral part of these condensed consolidated financial statements.
4
Table of Contents
FNDS3000 CORP AND SUBSIDIARIES
CONDENSED CONSOLIDATED STATEMENTS OF CASH FLOWS
(Unaudited)
| For the Nine Months Ended May 31, |
||||||||
| 2011 | 2010 | |||||||
| CASH FLOWS FROM OPERATING ACTIVITIES |
||||||||
| Net loss |
$ | (2,416,262 | ) | $ | (3,295,793 | ) | ||
| Adjustments to reconcile net loss to net cash used in operating activities: |
||||||||
| Depreciation and amortization |
214,878 | 214,682 | ||||||
| Contributed services |
72,000 | — | ||||||
| Equity-based compensation |
182,674 | 321,175 | ||||||
| Loss on asset disposal |
2,067 | — | ||||||
| Accretion of non-cash beneficial conversion feature on convertible note payable - related party |
— | 166,667 | ||||||
| Accretion of discount on convertible notes payable - related parties, with warrants |
— | 78,546 | ||||||
| Bad debt allowance |
19,823 | 28,215 | ||||||
| Reserve for chargebacks/fraud |
29,856 | — | ||||||
| Non-cash interest expense |
— | 83,334 | ||||||
| Stock price indemnity expense |
— | (111,429 | ) | |||||
| Change in operating assets and liabilities: |
||||||||
| Accounts receivable |
5,896 | (49,527 | ) | |||||
| Prepaid expenses and other assets |
(54,223 | ) | (24,331 | ) | ||||
| Deposits |
(3,846 | ) | 353 | |||||
| Restricted cash |
(85,358 | ) | (1,000 | ) | ||||
| Accounts payable and other accrued liabilities |
97,704 | 63,938 | ||||||
| Accrued payroll and benefits |
(7,095 | ) | 35,845 | |||||
| Due to related parties |
(155,880 | ) | (3,090 | ) | ||||
| Net cash used in operating activities |
(2,097,766 | ) | (2,492,415 | ) | ||||
| CASH FLOWS FROM INVESTING ACTIVITIES |
||||||||
| Purchase of property and equipment |
(45,292 | ) | (6,607 | ) | ||||
| Net cash used in investing activities |
(45,292 | ) | (6,607 | ) | ||||
| CASH FLOWS FROM FINANCING ACTIVITIES |
||||||||
| Proceeds from private placements |
2,500,000 | 1,800,000 | ||||||
| Offering costs |
(48,130 | ) | (29,757 | ) | ||||
| Borrowings on notes payable - related parties |
— | 500,000 | ||||||
| Net cash provided by financing activities |
2,451,870 | 2,270,243 | ||||||
| Net increase (decrease) in cash |
308,812 | (228,779 | ) | |||||
| Cash at beginning of year, net of restricted cash |
332,399 | 371,644 | ||||||
| CASH AT END OF PERIOD, net of restricted cash |
$ | 641,211 | $ | 142,865 | ||||
| SUPPLEMENTAL CASH FLOW DISCLOSURE |
||||||||
| Cash paid for interest |
$ | 634 | $ | 845 | ||||
| Cash paid for income taxes |
$ | — | $ | — | ||||
| Consulting services provided as additional consideration for shares issued |
$ | — | $ | 250,000 | ||||
| Beneficial conversion feature on convertible note payable - related party |
$ | — | $ | 166,667 | ||||
| Discount on convertible notes payable- related parties, with warrants |
$ | — | $ | 235,639 | ||||
| Conversion of convertible notes payable principal and accrued interest |
$ | — | $ | 1,664,927 | ||||
| Issuance of common stock in satisfaction of Release and Settlement Agreements |
$ | 3,700 | $ | — | ||||
The accompanying notes are an integral part of these condensed consolidated financial statements.
5
Table of Contents
FNDS3000 CORP AND SUBSIDIARIES
NOTES TO CONDENSED CONSOLIDATED FINANCIAL STATEMENTS
(Unaudited)
Note 1 – Basis of Presentation
The accompanying unaudited condensed consolidated financial statements of FNDS3000 Corp (the “Company,” “FNDS3000,” “we,” “our,” “its” or “us”) and subsidiaries have been prepared in accordance with United States generally accepted accounting principles (“GAAP”) for interim financial statements. Therefore, they include all of the information and footnotes required by accounting principles generally accepted in the United States of America for complete financial statements. These unaudited condensed consolidated financial statements should be read in conjunction with the Form 10-K for the year ended August 31, 2010 of FNDS3000 which was filed with the Securities and Exchange Commission on November 29, 2010.
These interim condensed consolidated financial statements of FNDS3000 and its subsidiaries present the audited consolidated balance sheet as of August 31, 2010, the unaudited condensed consolidated balance sheet as of May 31, 2011 and the unaudited condensed consolidated statements of operations for the three and nine months ended May 31, 2011 and 2010 and statements of cash flows for the nine months ended May 31, 2011 and 2010. In the opinion of management, all adjustments necessary to present fairly the financial position as of May 31, 2011 and the results of operations and cash flows presented herein have been included in the unaudited condensed consolidated financial statements. Interim results are not necessarily indicative of results of operations for the full year.
All references to fiscal periods apply to our fiscal quarters, which end on the last day of the months of November, February, May and August, with August 31 being our fiscal year end.
The preparation of these financial statements requires us to make estimates and judgments that affect the reported amounts of assets, liabilities, revenue and expenses. We base our estimates on historical experience and on various other assumptions that we believe to be reasonable under the circumstances, the results of which form the basis for making judgments about the carrying values of assets and liabilities that are not readily apparent from other sources. Actual results may differ from these estimates under different assumptions or conditions.
Note 2 – Going Concern
Our financial statements are prepared in accordance with United States generally accepted accounting principles applicable to a going concern, which contemplate the realization of assets and liquidation of liabilities in the normal course of business. As of May 31, 2011, our working capital was approximately $377,500. As we have incurred approximately $18.9 million in losses since our inception, our ability to continue as a going concern must be considered in light of the problems, expenses and complications frequently encountered by entrance into established markets and the competitive environment in which we operate.
Since inception, our operations have primarily been funded through privately placed equity financings, and we will continue to seek additional funding through private or public equity and debt financings. However, due to the current economic environment and the Company’s current financial condition, there can be no assurance that our plans will materialize and/or that we will be successful in funding our estimated cash shortfalls through additional debt or equity capital. Additionally, we expect, but cannot provide assurance that operating revenue from the sales of our products and other related revenue will continue to increase.
These factors, among others, indicate that there is doubt about our ability to continue as a going concern for a reasonable length of time. These consolidated financial statements do not include any adjustments that might result from the outcome of this uncertainty nor do they include any adjustments relating to the recoverability and classification of recorded asset amounts, or amounts and classification of liabilities that might be necessary should the Company be unable to continue as a going concern.
6
Table of Contents
Note 3 – Formation, Background and Operations of the Company
Corporate History
FNDS3000 was formed to take advantage of the dynamic growth occurring in the global prepaid card market. Our focus is on pursuing compelling, high growth business opportunities specifically in developing international prepaid markets. We established our base of operations in Johannesburg, South Africa, which will ultimately serve to support an anticipated global client base concentrated in Africa, the Middle East and Southern Europe.
FNDS3000 was incorporated on January 24, 2006 in the State of Delaware and is headquartered in Jacksonville, Florida. Our fiscal year end is August 31. On March 28, 2008, we changed the Company’s name to FNDS3000 Corp from FundsTech Corp.
On June 17, 2008, the Company was approved as an issuing third-party processor in South Africa. This approval allowed FNDS3000 to operate and process cards in cooperation with financial institutions in South Africa.
In September 2008, we launched our first payroll card program in South Africa after having completed all necessary certifications.
On December 2, 2008, FNDS3000 announced that it had earned the distinction of being the first non-South African company to receive MasterCard certification in that country, which was a fundamental objective for advancing our business plan.
During December 2008 and January 2009, a change of executive management occurred and Sherington Holdings, LLC (“Sherington”) became a major investor. Raymond Goldsmith, our CEO and Chairman, is the sole member of Sherington.
In May 2009, we sold the Atlas subsidiary, which was purchased in July of 2008.
During July and August 2009, we had our South African processing procedures and electronic funds transfer system reviewed and validated by our sponsor bank and by an international auditing firm.
In August 2009, we completed a pilot test phase of our processing platform in South Africa, during which time we implemented further product enhancements, together with comprehensive client service operations and advanced our fraud prevention protocols.
In September 2009, we began our market test phase. During October and November 2009, our distributors and corporate clients encountered logistical and procedural delays in distributing cards to cardholders. We found the process significantly slower than expected, which adversely influenced the speed and rate of card activation. As a result, the Company refocused staff on supporting and assisting distributors and corporate clients in meeting this challenge.
During the fall of 2009, we integrated a mobile banking solution into our processing platform and further developed our plans and programs for micro financing, which we believe offers particular attractions in high-volume potential repeat business without the challenges of distribution, as the cardholder is present at the time funds are loaded to a card.
In late December 2009, as our comprehensive testing during the market test phase demonstrated stability and validated the processes and systems required to handle the higher volume of prepaid cards to be processed, we concluded the market test phase and initiated a production rollout phase.
During the latter part of 2009, one of our distributors encountered internal difficulties. These difficulties continued to increase through February 28, 2010 and ultimately, in March 2010, the Company and the distributor agreed to terminate the agreement between the companies. Thereafter, we entered into direct contractual relationships with the former clients of this distributor and we will continue to develop this sales avenue. Clients with whom we have a direct contractual relationship are not serviced by a distributor, and therefore, we incur no revenue sharing expense. FNDS3000 is solely responsible for managing all facets of a direct account.
7
Table of Contents
However, we do have one client that came to us from this distributor, for which we agreed to continue the revenue sharing agreement it had with the distributor. This client is currently the Company’s leading revenue producer (Refer to Note 11 – Significant Revenue Concentrations for additional information).
In July 2010, the decision was made to appoint Robert Klein, a Sherington consultant who had been working with the Company since October 2009, as President and Chief Executive Officer–South Africa to lead the day-to-day operations of FNDS3000 and to further enhance and strengthen our operations team, our marketing and our contract management expertise, thereby positioning us for our next critical growth phase.
On September 29, 2010, shareholders of the Company holding a majority of the issued and outstanding shares of common stock of the Company voted to reduce the size of our board of directors to five and therefore removed, without cause, David Fann, John Hancock, Don Headlund, Ernst Schoenbaechler and John Watson from their positions as directors.
On September 30, 2010, several changes occurred to the composition of our executive management. The board removed John Hancock, President and CEO, and John Watson, Executive Vice President, from their positions as executive officers of the Company and David Fann resigned from his position as Corporate Secretary. In conjunction with these changes, the board appointed Raymond Goldsmith as President and CEO, Riva Smith as Corporate Secretary and Derek Mitchell as a director of the Company. Mr. Mitchell has served as Director of Business Affairs of International Sports Multimedia, Ltd. (“ISM”) since January 2000. Raymond Goldsmith, our CEO and Chairman, is the founder, Chairman and CEO of ISM. Since 1998, Ms. Smith has served as Executive Assistant to Mr. Goldsmith in his capacity as Chairman and CEO of ISM.
On October 23, 2010, Victoria Vaksman resigned her position as Executive Vice President, EMEA (Europe, Middle East and Africa).
On November 23, 2010, the board of directors amended the Bylaws to provide that the annual meeting may be set by the board of directors at its discretion. At the December 15, 2010 annual shareholders meeting, the majority of shareholders voted to further reduce the size of the board to four members.
The card distribution and activation processes have grown at a pace slower than originally expected would be possible and, therefore, we have not yet achieved our goal of becoming cash flow positive. As the period during which funds must be expended without having significant revenue lengthened, the Company needed to raise additional capital. As of May 31, 2011, approximately $13.3 million from sales of our common stock and warrants, along with convertible notes totaling $1.5 million, have provided the required financing.
Because we cannot anticipate when significant revenue will be generated, and because our current monthly net cash outflow is approximately $150,000, we will need to raise additional funds to continue to execute our business plan, respond to competitive pressures and to react to unanticipated requirements or expenses.
During the nine months ended May 31, 2011, we have raised $2.5 million in non-brokered private placement transactions. In conjunction with these capital raises, the shareholders holding a majority of our outstanding shares approved an increase in the number of authorized common shares from 150 million to 200 million common shares.
Funds raised during the nine months ended May 31, 2011 are expected to be sufficient to support operations through August 31, 2011 at which point we estimate that an additional $1 million to $1.25 million will be needed to carry out our business plan for the next fiscal year beginning September 1, 2011. These funds will provide us with necessary working capital to support our business operations while we work toward achieving positive cash flow, as well as to finance planned growth initiatives in that market to support our anticipated growth. We will require additional funds to provide for strategic expansion of our business into other targeted developing prepaid markets.
8
Table of Contents
We plan to raise any such additional capital primarily through additional sales of our equity securities or the issuance of debt instruments. The issuance of additional equity securities could result in a significant dilution in the equity interests of our current stockholders. However, there is no assurance that we will be able to obtain further funds required for our continued operations or that additional financing will be available to us when needed or, if available, that it can be obtained on commercially reasonable terms. If we are not able to obtain the additional financing on a timely basis, we will not be able to meet our other obligations as they become due and we will be forced to scale down or perhaps even cease our operations.
Note 4 – Summary of Significant Accounting Policies
Basis of Presentation/Going Concern
The accompanying financial statements have been prepared in accordance with accounting principles generally accepted in the United States of America, which contemplate continuation of the Company as a going concern.
Since inception, our losses total approximately $18.9 million and our working capital deficit as of May 31, 2011 is approximately $377,500. These conditions raise doubt as to our ability to continue as a going concern. These consolidated financial statements do not include any adjustments that might result from the outcome of this uncertainty nor do they include any adjustments relating to the recoverability and classification of recorded asset amounts, or amounts and classification of liabilities that might be necessary should we be unable to continue as a going concern. The accompanying unaudited condensed consolidated financial statements have been prepared on the accrual basis of accounting in accordance with GAAP.
Principles of Consolidation
The accompanying condensed consolidated financial statements include the accounts of FNDS3000 Corp and our wholly owned subsidiaries: FndsTech Corp. SA. (Pty) Ltd. and Transaction Data Management, Inc., which is inactive. Significant inter-company accounts and transactions are eliminated in consolidation.
Reclassifications
Certain items in the May 31, 2010 condensed consolidated financial statements have been reclassified to conform to the May 31, 2011 presentation. Of particular note, for improved comparison of card- and transaction-related cost to revenue, certain non-transactional costs are now presented as “Processing, Technical and Financial Expense” and are included in Operating Expense rather than as Cost of Revenue. Due to this reclassification, the gross margin for the three months ended May 31, 2010 was revised to $39,227 rather than a loss of $60,943, an increase of $100,170. For the nine months ended May 31, 2010 gross margin was revised to $123,465 rather than a loss of $149,127, an increase of $272,592.
Additionally, as the amount of restricted cash on deposit as required by our sponsor bank has increased from $35,022 as of August 31, 2010 to approximately $120,400 as of May 31, 2011, restricted cash is now presented separately as a long-term asset. Therefore, the cash balance of $367,421 as of August 31, 2010 has been reduced to $332,399 and $35,022, the balance of our deposit as of August 31, 2010, is presented as a long-term asset, Restricted Cash.
These reclassifications did not affect our consolidated net loss for any period.
Use of Estimates
The preparation of financial statements in conformity with GAAP requires us to make certain estimates and assumptions that affect the reported amounts of assets and liabilities and disclosure of contingent assets and liabilities at the date of the financial statements. The reported amounts of revenue and expenses during the reporting period may be affected by the estimates and assumptions we are required to make. In particular, depreciation, amortization and the valuation of stock option grants are significant estimates. Estimates that are critical to the accompanying financial statements arise from our belief that we will secure an adequate amount of cash to continue as a going concern, that our allowance for doubtful accounts is adequate to cover potential losses and that all long-lived assets are recoverable.
9
Table of Contents
The markets for our products are characterized by intense competition, rapid technological development, evolving standards, short product life cycles and price competition, all of which could influence the future realization of our assets. Estimates and assumptions are reviewed periodically and the effects of revisions are reflected in the period that they are determined to be necessary. It is at least reasonably possible that our estimates could change in the near term with respect to these matters.
Financial Instruments
The Company’s financial instruments consist of cash, accounts receivable and accounts payable. These financial instruments are stated at their respective carrying values, which approximate their fair values.
Cash and Cash Equivalents
We consider all highly liquid investments with an original maturity of three months or less to be cash equivalents. Restricted cash on deposit with our sponsor bank is considered to be a long-term asset.
Concentration of Credit Risk
Financial instruments that potentially subject us to concentrations of credit risk consist principally of temporary cash investments and trade accounts receivable. We maintain cash balances at two national financial institutions in Jacksonville, Florida. Accounts at these institutions are secured by the Federal Deposit Insurance Corporation up to $250,000. At times, balances may exceed federally insured limits.
We also maintain cash balances at two financial institutions in Bryanston, South Africa.
We have not experienced any losses due to balances in excess of insured limits and we believe that we are not exposed to any significant credit risk with respect to cash and cash equivalents.
Revenue Recognition and Deferred Revenue
Revenue consists primarily of fees generated through the electronic processing of payment transactions and related services, and are recognized as revenue in the period the transactions are processed or when the related services are performed.
Our revenue is derived from the following:
| • | Initiation fees from sales of our prepaid cards. |
| • | Transaction fees from the use and loading of funds for the prepaid cards. |
| • | Maintenance fees for continued activation. |
| • | Financial float fees, which arise from the balance of funds available prior to the use of the funds. |
Revenue derived from electronic processing of the prepaid card transactions are recognized immediately as revenue and are reported gross of amounts paid to sponsor banks as well as interchange and assessments paid to credit card associations such as MasterCard. Our receivables arise from the initial sale of the plastic card and the security tokens, which are invoiced with net 30-day terms.
Our revenue recognition policy for fees and services arising from our products is that we recognize revenue when, (1) persuasive evidence of an arrangement exists; (2) delivery has occurred; (3) our price to the buyer is fixed or determinable; and (4) collectability of the receivables is reasonably assured. More specifically, issuance fee revenue for our prepaid cards is recognized when shipped, transaction fee revenue is recognized when the transaction occurs and posts, and maintenance and financial float fee revenue are recognized when the products are used. Consulting fees are recognized as services are performed and per contractual terms with the client. Costs of revenue, including the cost of printing the cards, are recorded at the time revenue is recognized.
10
Table of Contents
Accounts Receivable and Allowance for Doubtful Accounts
Our accounts receivable arise from the sale of cards and security tokens and for application and set-up fees. Our invoice terms are net 30 days and accounts are determined to be past due if payment is not made in accordance with the terms of our contracts. Receivables are written off when they are determined to be uncollectible. Ongoing credit evaluations are performed for all of our clients.
We evaluate the allowance for doubtful accounts on a regular basis for adequacy. The level of the allowance account and related bad debts are based upon our review of the collectability of our receivables in light of historical experience, adverse situations that may affect our clients’ ability to repay, estimated value of any underlying collateral and prevailing economic conditions. We use the direct write-off method for accounts receivable that are determined to be uncollectable and believe there is no material difference in this method from the allowance method. This evaluation is inherently subjective, as it requires estimates that are susceptible to significant revision as more information becomes available.
As of May 31, 2011, our net accounts receivable was $6,795. Our gross receivables totaled $26,618 and we have recognized an allowance of $19,823 for overdrawn cardholder accounts.
Cash Reserves for Uncollectible Overdrawn Accounts, Chargebacks and Fraudulent Transactions
Cardholder accounts may become overdrawn if service fees or other charges exceed the available funds in a cardholder’s account, merchants may issue chargebacks or fraudulent transactions may occur. Due to this exposure, we have established a cash reserve, which is a component of restricted cash.
As of May 31, 2011, we have reserved approximately $20,000 for overdrawn cardholder accounts and approximately $50,000 for potential chargebacks and the risk of fraudulent activity.
Property and Equipment
Equipment and improvements are stated at cost less accumulated depreciation and amortization. Depreciation and amortization of equipment and improvements are provided over the estimated useful lives of the assets, or the related lease terms if shorter, by the straight-line method. Useful lives range as follows:
| Category |
Useful Lives | |
| Computers and networks | 3 years | |
| Machinery and equipment | 5-7 years | |
| Furniture and fixtures | 5-7 years | |
| Office equipment | 3-10 years | |
| Leasehold improvements | Lesser of lease term or useful life of asset |
Major additions will be capitalized, while minor additions, maintenance and repairs, which do not extend the useful life of an asset, will be expensed as incurred. Upon disposition, the cost and related accumulated depreciation are removed from the accounts and the resulting gain or loss is reflected in current operations.
Long-Lived Assets and Impairment
The Company reviews long-lived assets for impairment whenever events or changes in circumstances indicate that the carrying value of a long-lived asset may not be recoverable. The Company periodically evaluates whether events and circumstances have occurred that may warrant revision of the estimated useful lives of its long-lived assets or whether the remaining balance of long-lived assets should be evaluated for possible impairment.
Intangible assets that are determined to have definite lives are amortized over their useful lives and are measured for impairment only when events or circumstances indicate the carrying value may be impaired. Intangible assets with indefinite lives are not amortized but instead are measured for impairment at least annually in our fourth fiscal quarter, or when events indicate that impairment exists.
11
Table of Contents
We have a capitalized intangible asset, which is the software license from World Processing, Ltd., the parent company of Global Cash Card (“GCC”), and associated fees relative to its modification to meet our needs. In recognition of the right to receive future cash flows related to transactions of the asset, we are amortizing this value over seven years, as it is anticipated that the software would continue to evolve with our needs.
We review intangibles at least annually for impairment as events or changes in circumstances indicate that the carrying amount of such assets may not be recoverable. If the carrying amounts of the assets exceed their respective fair values, additional impairment tests are performed to measure the amount of the impairment loss, if any. If an asset is deemed impaired, the impairment loss is recognized in current earnings. No impairment loss was recognized for the GCC software license for the fiscal years ended August 31, 2010 and 2009 or for the nine months ended May 31, 2011.
Purchased and Developed Software
We account for software development costs which consist of costs to develop software programs to be used solely to meet the Company’s internal needs in accordance with Statement of Position (“SOP”) No. 98-1, Accounting for Costs of Computer Software Developed or Obtained for Internal Use. Costs incurred during the application development stage for software programs to be used solely to meet our internal needs are capitalized. Capitalized software costs are included in the value of our intangibles, net and are amortized over the estimated useful life of the software.
Purchases of “off-the-shelf” software may be capitalized depending on the value. If capitalized, the costs are amortized over the expected economic life, generally three years.
Net Earnings or (Loss) Per Share
Basic net earnings or loss per share is computed by dividing the net earnings or loss available to common stockholders for the period by the weighted average number of common shares outstanding during the period. Diluted net earnings/(loss) per share is computed by dividing the net earnings or loss for the period by the number of common and common equivalent shares outstanding during the period.
Basic net loss per common share has been computed based upon the weighted average number of shares of common stock outstanding during the periods. All potential diluted shares have been excluded from the calculation of diluted earnings/(loss) per share for the three and nine months ended May 31, 2011 and 2010 as the effect of conversion is anti-dilutive.
Equity-Based Compensation
The Company has equity-based compensation plans, which are designed to retain directors, executives and selected employees and consultants and to reward them for making major contributions to the success of the Company.
SEC Staff Accounting Bulletin No. 110, “Share Based Payment,” allows companies to continue to use the simplified method to estimate the expected term of stock options under certain circumstances. The simplified method for estimating the expected life uses the mid-point between the vesting term and the contractual term of the stock option. The Company has analyzed the circumstances in which the simplified method is allowed and has determined that utilizing the simplified method for stock options granted is appropriate.
Fair value of the stock options is estimated using a Black-Scholes option pricing formula. The variables used in the option pricing formula for each grant are determined at the time of grant as follows: (1) volatility is based on the weekly closing price of the Company’s stock over a look-back period of time that approximates the expected option life; (2) risk-free interest rates are based on the yield of U.S. Treasury Strips as published in the Wall Street Journal or provided by a third-party on the date of the grant for the expected option life; and (3) expected option life represents the period of time the options are expected to be outstanding. Periodically the factors influencing the expected life of option grants are reviewed and may be modified.
12
Table of Contents
Equity instruments issued for services are based on the fair value of the consideration received or the fair value of the equity instruments, whichever is more reliably measurable. Prior to February 2009, the quoted market price was a basis for the fair value of the common stock. Beginning in February 2009, significant amounts of common stock were issued in exchange for cash, the value of which was used to determine the fair value of the shares issued for services at or near the time of these issuances for cash. However, as per the terms of the October 2010 Commitment Agreement between the Company and Sherington, sales of our common stock for the final three tranches of this agreement were to be valued at the lesser of (a) USD $0.175 or (b) the average trading price of the stock for the 10 trading days prior to the closing date of the applicable tranche closing. Based on these terms, the price per share of our common stock for the January 2011 tranche was $0.154, the price per share for the March tranche was $0.139 and for the fourth and final tranche in May 2011, the price per share was $0.15.
Determining the appropriate fair value model and calculating the fair value of share-based payment awards requires the input of highly subjective assumptions, including the expected life of the share-based payment awards and stock price volatility. The assumptions used in calculating the fair value of share-based payment awards represent management’s best estimates, but these estimates involve inherent uncertainties and the application of management judgment. As a result, if factors change and we use different assumptions, our stock-based compensation expense could be materially different in the future. In addition, we are required to estimate the expected forfeiture rate and only recognize expense for those shares expected to vest. If our actual forfeiture rate is materially different from our estimate, the stock-based compensation expense could be significantly different from what we have recognized in the current period.
Derivative Financial Instruments
We have adopted certain disclosure requirements under FASB Accounting Standards Codification (“ASC”) 815, “Derivatives and Hedging” which requires that objectives for using derivative financial instruments be disclosed in terms of the underlying risk and accounting designation. Additionally, ASC 815 requires that the fair value of derivative financial instruments and their gains and losses be presented in tabular format in order to present a more complete picture of the effects of using derivative financial instruments. ASC 815 establishes accounting and reporting standards for derivative instruments, including certain derivative instruments embedded in other contracts, (collectively referred to as derivatives) and for hedging activities. It requires that an entity recognize all derivatives as either assets or liabilities in the statement of financial position and measure those instruments at fair value. If certain conditions are met, a derivative may be specifically designated as (a) a hedge of the exposure to changes in the fair value of a recognized asset or liability or an unrecognized firm commitment, (b) a hedge of the exposure to variable cash flows of a forecasted transaction, or (c) a hedge of the foreign currency exposure of a net investment in a foreign operation, an unrecognized firm commitment, an available-for-sale security, or a foreign-currency-denominated forecasted transaction.
On November 2, 2010, the Company entered into an Agreement and Release with Mr. Michael Dodak (the “Dodak Release”), a former director and executive officer of the Company and an existing shareholder of the Company, relating to Mr. Dodak’s contractual relationship as a consultant with the Company. As part of the agreement, we agreed to issue at various future dates a total of $100,000 of our common stock. In January 2011, the first of four $25,000 tranches was closed and 142,857 shares were issued at a share price of $0.175 as per the agreement. The terms of this agreement stipulate that the number of shares to be issued for the remaining $75,000 would be determined based upon a per share price of (i) the lesser of $0.175 or (ii) the average trading price of the stock for the 10 trading days prior to the issuance date.
The second tranche of 162,338 shares was issued February 1, 2011 at $0.154 per share; the third tranche of 179,856 shares was issued March 7, 2011 at $0.139 per share and the fourth and final tranche of 166,667 shares will be issued at $0.15 per share.
The accounting for changes in the fair value of a derivative (that is, gains and losses) depends on the intended use of the derivative and the resulting designation. As the Dodak Release meets the requirements of a derivative instrument, at November 30, 2010, a non-cash discount expense of $6,400 and a liability were recognized due to the average closing price of our common stock for the ten days prior to and including November 30, 2010 of $0.19 as compared to a maximum value of $0.175 to be utilized when calculating the remaining shares to be issued to Mr. Dodak.
13
Table of Contents
At February 28, 2011, the Company owed $50,000 in shares to Mr. Dodak. As the average trading price of the stock for the 10 trading days prior to February 28, 2011 was less than the maximum price of $0.175, the $6,400 non-cash interest expense for the discounted stock price recognized at November 30, 2010 was reversed.
At May 31, 2011, no discount or premium was recognized on the fourth and final tranche and the Company has no other derivative financial instruments.
See “Consulting Agreements” in Note 13 – Commitments and Obligations for additional information.
Foreign Currency Transactions, Translation and Remeasurement
The financial position and results of operations of the FNDS3000 operations are measured using the parent’s currency, the U.S. dollar, as the functional currency; however, the original books and records are maintained in the South African Rand. Therefore, exchange rate gains and losses are considered to be “transaction” gains and losses.
Transaction gains and losses are a result of the effect of exchange rate changes on transactions denominated in currencies other than the functional currency. Gains and losses on those foreign currency transactions are generally included in determining net income/(loss) for the period in which exchange rates change unless the transaction hedges a foreign currency commitment or a net investment in a foreign entity. Inter-company transactions of a long-term investment nature are considered part of a parent’s net investment and hence do not give rise to gains or losses.
Assets and liabilities of these operations are translated at the exchange rate in effect at the end of the reporting period. Statement of operations accounts, with the exception of amortized assets or liabilities are translated at the average exchange rate during the year.
Fluctuations from the beginning to the end of any given reporting period result in the remeasurement of our foreign currency-denominated cash, receivables and payables, and generate currency transaction gains or losses that impact our non-operating income and expense levels in the respective period are reported in other income/(expense), net, in our condensed consolidated financial statements.
The Company has recognized a translation and remeasurement loss of $8,354 and $9,580, respectively, for the three and nine months ended May 31, 2011.
Income Taxes
We account for income taxes under the asset and liability method, which requires the recognition of deferred tax assets and liabilities for the expected future tax consequences of events that have been included in the financial statements. Under this method, deferred tax assets and liabilities are determined based on the differences between the financial statements and tax basis of assets and liabilities using enacted tax rates in effect for the year in which the differences are expected to reverse. The effect of a change in tax rates on deferred tax assets and liabilities is recognized in income in the period that includes the enactment date.
We record net deferred tax assets to the extent we believe these assets will more likely than not be realized. In making such determination, all available positive and negative evidence will be considered, including future reversals of existing taxable temporary differences, projected future taxable income, tax planning strategies and recent financial operations. A valuation allowance is established against deferred tax assets that do not meet the criteria for recognition. In the event the we determine that it would be able to realize deferred income tax assets in the future in excess of their net recorded amount, we would make an adjustment to the valuation allowance which would reduce the provision for income taxes.
We follow the accounting guidance which provides that a tax benefit from an uncertain tax position may be recognized when it is more likely than not that the position will be sustained upon examination, including resolutions of any related appeals or litigation processes, based on the technical merits. Income tax positions must meet a more-likely-than-not recognition threshold at the effective date to be recognized initially and in subsequent periods. Also included is guidance on measurement, de-recognition, classification, interest and penalties, accounting in interim periods, disclosure and transition.
14
Table of Contents
For the period from January 24, 2006 (inception) to May 31, 2011, we have incurred net operating losses. However, no benefit for income taxes has been recorded due to the uncertainty of the realization of this deferred tax asset. As of May 31, 2011, we have in excess of $18 million of federal and state net operating losses (“NOL”) allocated to continuing operations available as a carry-forward for the calculation of income tax. The net operating loss carry forward, if not utilized, will begin to expire in 2024.
For financial reporting purposes based upon continuing operations, we have incurred a loss in each fiscal quarter since inception.
Note 5 – Recent Accounting Pronouncements
In May 2011, the Financial Accounting Standards Board (FASB) issued Accounting Standards Update No. 2011-04 (ASU 2011-04), Fair Value Measurement (Topic 820) Amendments to Achieve Common Fair Value Measurement and Disclosure Requirements in U.S. GAAP and IFRSs. The amendments in this Update apply to all reporting entities that are required or permitted to measure or disclose the fair value of an asset, a liability, or an instrument classified in a reporting entity’s shareholders’ equity in the financial statements. Consequently, the amendments change the wording used to describe many of the requirements in U.S. GAAP for measuring fair value and for disclosing information about fair value measurements. For many of the requirements, the FASB does not intend for the amendments in this Update to result in a change in the application of the requirements in Topic 820. Some of the amendments clarify the FASB’s intent about the application of existing fair value measurement requirements. Other amendments change a particular principle or requirement for measuring fair value or for disclosing information about fair value measurements. The amendments in this Update are to be applied prospectively. For public entities, the amendments are effective during interim and annual periods beginning after December 15, 2011. Early application by public entities is not permitted. The Company does not expect the provisions of ASU 2011-04 to have a material effect on our consolidated financial statements.
In April 2011, the FASB issued Accounting Standards Update No. 2011-03 (ASU 2011-03), Transfers and Servicing (Topic 860) Reconsideration of Effective Control for Repurchase Agreements. The amendments in this Update apply to all entities, both public and nonpublic. The amendments affect all entities that enter into agreements to transfer financial assets that both entitle and obligate the transferor to repurchase or redeem the financial assets before their maturity. The amendments do not affect other transfers of financial assets. The amendments in this Update remove from the assessment of effective control (1) the criterion requiring the transferor to have the ability to repurchase or redeem the financial assets on substantially the agreed terms, even in the event of default by the transferee, and (2) the collateral maintenance implementation guidance related to that criterion. The guidance in this Update is effective for the first interim or annual period beginning on or after December 15, 2011. The guidance should be applied prospectively to transactions or modifications of existing transactions that occur on or after the effective date. Early adoption is not permitted. The Company does not expect the provisions of ASU 2011-03 to have a material effect on our consolidated financial statements.
In April 2011, the issued Accounting Standards Update No. 2011-02 (ASU 2011-02), Receivables (Topic 310) A Creditor’s Determination of Whether a Restructuring Is a Troubled Debt Restructuring. The amendments in this Update apply to all creditors, both public and nonpublic, that restructure receivables that fall within the scope of Subtopic 310-40, Receivables-Troubled Debt Restructurings by Creditors. The amendments to Topic 310 clarify the guidance on a creditor’s evaluation of (a) whether it has granted a concession and (b) whether a debtor is experiencing financial difficulties. There is currently diversity in practice in identifying restructurings of receivables that constitute troubled debt restructurings for a creditor. The clarifying guidance in this Update should result in more consistent application of U.S. GAAP for debt restructurings. The amendments in this Update are effective for the first interim or annual period beginning on or after June 15, 2011, and should be applied retrospectively to the beginning of the annual period of adoption. The Company does not expect the provisions of ASU 2011-02 to have a material effect on its consolidated financial statements.
In January 2011, the FASB issued Accounting Standards Update 2011-01 (ASU 2011-01), Receivables (Topic 310) Deferral of the Effective Date of Disclosures about Troubled Debt Restructurings in Update No. 2010-20. The amendments in this Update apply to all public-entity creditors that modify financing receivables within the scope of the disclosure requirements about troubled debt restructurings in Update 2010-20. The amendments in this Update temporarily delay the effective date of the disclosures about troubled debt restructurings in Update 2010-20 for public entities. The delay is intended to allow the board time to complete its deliberations on what constitutes a troubled debt restructuring. The effective date of the new disclosures about troubled debt restructurings for public entities and the guidance for determining what constitutes a troubled debt restructuring will then be coordinated. Currently, that guidance is anticipated to be effective for interim and annual periods ending after June 15, 2011. The Company does not expect the provisions of ASU 2011-01 to have a material effect on its consolidated financial statements.
15
Table of Contents
In December 2010, the FASB issued Accounting Standards Update 2010-29 (ASU 2010-29), Business Combinations (Topic 805) - Disclosure of Supplementary Pro Forma Information for Business Combinations. The amendments in this Update specify that if a public entity presents comparative financial statements, the entity should disclose revenue and earnings of the combined entity as though the business combination(s) that occurred during the current year had occurred as of the beginning of the comparable prior annual reporting period only. The amendments in this Update also expand the supplemental pro forma disclosures under Topic 805 to include a description of the nature and amount of material, nonrecurring pro forma adjustments directly attributable to the business combination included in the reported pro forma revenue and earnings. The amendments in this Update are effective prospectively for business combinations for which the acquisition date is on or after the beginning of the first annual reporting period beginning on or after December 15, 2010. Early adoption is permitted. The Company does not expect the provisions of ASU 2010-29 to have a material effect on its consolidated financial statements.
In December 2010, the FASB issued Accounting Standards Update No. 2010-28, When to Perform Step 2 of the Goodwill Impairment Test for Reporting Units with Zero or Negative Carrying Amounts (Topic 350)—Intangibles—Goodwill and Other (ASU 2010-28). ASU 2010-28 amends the criteria for performing Step 2 of the goodwill impairment test for reporting units with zero or negative carrying amounts and requires performing Step 2 if qualitative factors indicate that it is more likely than not that a goodwill impairment exists. Any impairment to be recorded upon adoption will be recognized as an adjustment to our beginning retained earnings. We are currently evaluating the impact of the pending adoption of ASU 2010-28 on our consolidated financial statements.
In August 2010, the FASB issued Accounting Standard Update (“ASU”) No. 2010-22 regarding “Accounting for Various Topics – Technical Corrections to SEC Paragraphs.” This ASU amends various SEC paragraphs based on external comments received and the issuance of FASB’s Staff Accounting Bulletin (“SAB”) 112, which amends or rescinds portions of certain SAB topics.
In August 2010, the FASB issued ASU No. 2010-21 regarding “Accounting for Technical Amendments to Various SEC Rules and Schedules.” This ASU amends various SEC paragraphs pursuant to the issuance of Release No. 33-9026: “Technical Amendments to Rules, Forms, Schedules and Codification of Financial Reporting Policies,” which amends various SEC paragraphs based on external comments received and the issuance of SAB 112, which amends or rescinds portions of certain SAB topics.
In April 2010, the FASB issued ASU No. 2010-18 regarding improving comparability by eliminating diversity in practice about the treatment of modifications of loans accounted for within pools under Subtopic 310-30–Receivable–Loans and Debt Securities Acquired with Deteriorated Credit Quality (“Subtopic 310-30”). Furthermore, the amendments clarify guidance about maintaining the integrity of a pool as the unit of accounting for acquired loans with credit deterioration. Loans accounted for individually under Subtopic 310-30 continue to be subject to the troubled debt restructuring accounting provisions within Subtopic 310-40, “Receivables—Troubled Debt Restructurings by Creditors.” The amendments in this update are effective for modifications of loans accounted for within pools under Subtopic 310-30 occurring in the first interim or annual fiscal period ending on or after July 15, 2010. The amendments are to be applied prospectively. Early adoption is permitted. We are currently evaluating the impact of this ASU; however, we do not expect the adoption of this ASU to have a material impact on our consolidated financial statements.
In April 2010, the FASB issued ASU No. 2010-13 regarding the classification of an employee share-based payment award with an exercise price denominated in the currency of a market in which the underlying equity security trades. FASB Accounting Standards Codification™ Topic 718, “Compensation—Stock Compensation,” provides guidance on the classification of a share-based payment award as either equity or a liability. A share-based payment award that contains a condition that is not a market, performance or service condition is required to be classified as a liability. Under Topic 718, awards of equity share options granted to an employee of an entity’s foreign operation that provide a fixed exercise price denominated in (1) the foreign operation’s functional currency or (2) the currency in which the employee’s pay is denominated should not be considered to contain a condition that is not a market, performance, or service condition. However, GAAP does not specify whether a share-based payment award with an exercise price denominated in the currency of a market in which the underlying equity security trades has a market, performance or service condition. Diversity in practice has developed on the interpretation of whether such an award should be classified as a liability when the exercise price is not denominated in either the foreign operation’s functional currency or the currency in which the employee’s pay is denominated. This update provides amendments to Topic 718 to clarify that an employee share-based payment award with an exercise price denominated in the currency of a market in which a substantial portion of the entity’s equity securities trades should not be considered to contain a condition that is not a market, performance, or service condition. Therefore, an entity would not classify such an award as a liability if it otherwise qualifies as equity. We are currently evaluating the impact of this ASU; however, we do not expect the adoption of this ASU to have a material impact on our consolidated financial statements.
16
Table of Contents
In February 2010, the FASB issued ASU No. 2010-09 regarding subsequent events and amendments to certain recognition and disclosure requirements. Under this ASU, a public company that is a SEC filer, as defined, is not required to disclose the date through which subsequent events have been evaluated. This ASU is effective upon the issuance of this ASU. The adoption of this ASU did not have a material impact on our consolidated financial statements.
In January 2010, the FASB issued ASU 2010-6, which amends existing disclosure requirements about fair value measurements by adding required disclosures about items transferring into and out of levels 1 and 2 in the fair value hierarchy; adding separate disclosures about purchase, sales, issuances, and settlements relative to level 3 measurements; and clarifying, among other things, the existing fair value disclosures about the level of disaggregation. ASU 2010-6 is effective for fiscal years beginning after December 15, 2009. The adoption of this ASU has not had an impact on our consolidated financial statements.
In September 2009, the FASB issued ASU No. 2009-12 – Fair Value Measurements and Disclosures (Topic 820) – Investments in Certain Entities That Calculate Net Asset Value per Share (or its equivalent). This ASU permits use of a practical expedient, with appropriate disclosures, when measuring the fair value of an alternative investment that does not have a readily determinable fair value. ASU No. 2009-12 is effective for interim and annual fiscal periods ending after December 15, 2009, with early application permitted. Since the Company does not currently have any such investments, it does not anticipate any impact on its financial statements upon adoption.
Note 6 – Accounts Receivable, net
We have accounts receivable from distributors and clients for application and set up fees and for sales of security tokens, blank cards and other miscellaneous transactions. As of May 31, 2011, our net accounts receivable was $6,795. Our gross receivables totaled $26,618, which is offset by an allowance of $19,823 for overdrawn cardholder accounts.
As of August 31, 2010, the Company’s net accounts receivable was $32,512.
Note 7 – Property and Equipment
Property and equipment consisted of the following as of May 31, 2011 and August 31, 2010:
| May 31, 2011 | August 31, 2010 | |||||||
| Category |
||||||||
| Computers and other equipment |
$ | 94,927 | $ | 92,276 | ||||
| Software |
58,336 | 57,834 | ||||||
| Furniture |
11,884 | 10,397 | ||||||
| Leasehold improvement |
16,680 | 16,680 | ||||||
| Vehicle |
38,584 | — | ||||||
| 220,411 | 177,187 | |||||||
| Less accumulated depreciation |
(138,463 | ) | (100,183 | ) | ||||
| Fixed assets, net |
$ | 81,948 | $ | 77,004 | ||||
17
Table of Contents
During the three months ended May 31, 2011 and 2010, we recognized depreciation expense of $12,698 and $16,094, respectively.
During the nine months ended May 31, 2011 and 2010, we recognized depreciation expense of $38,280 and $38,086, respectively.
Note 8 – Intangible Asset
The Company has the following intangible asset as of May 31, 2011:
| Intangible Asset | Estimated Useful Lives (Years) |
Cost | Accumulated Amortization |
Net Value | ||||||||||||
| Software license |
7 | $ | 1,648,263 | $ | 588,662 | $ | 1,059,601 | |||||||||
As we began generating revenue in December 2008, we also began amortizing the license over its expected life of seven years. Estimated annual amortization expense for the license for the next five years is as follows:
| Year Ending August 31, |
Amount | |||
| 2011 |
$ | 235,464 | ||
| 2012 |
235,464 | |||
| 2013 |
235,464 | |||
| 2014 |
235,464 | |||
| 2015 |
58,879 | |||
The Company’s intangible asset as of August 31, 2010 was as follows:
| Intangible Asset |
Estimated Useful Lives (Years) |
Cost | Accumulated Amortization |
Net Value | ||||||||||||
| Software license |
7 | $ | 1,648,263 | $ | 412,064 | $ | 1,236,199 | |||||||||
Amortization expense of $58,866 was recognized during both of the three-month periods ended May 31, 2011 and 2010.
Amortization expense of $176,598 and $176,596 was recognized during the nine months ended May 31, 2011 and 2010, respectively.
Note 9 – Deposits
As of May 31, 2011, approximately $33,500 is held by various third parties for security deposits on our offices and certain utilities. As these deposits are not due to be returned to us within the next twelve months, they are presented as a long-term asset.
Note 10 – Restricted Cash
Pursuant to agreements with Mercantile Bank Ltd., our sponsor bank, we maintain a deposit of restricted cash on account. This amount is expected to increase as our volume increases. Additionally, we maintain a reserve of restricted cash for potential chargebacks, overdrawn account balances and other adjustments. Restricted cash is presented as a non-current asset on the condensed consolidated balance sheets. Restricted cash was $120,380 at May 31, 2011 and $35,022 at August 31, 2010.
18
Table of Contents
Note 11 – Significant Revenue Concentrations
Currently, the Company has a significant concentration of revenue attributable to one client, which is a leading provider of diversified employment services in South Africa. We began providing services to this client when it was a customer with a former distributor. As part of the dissolution of the distributor agreement between the Company and the distributor, we entered into has a direct service agreement with this client as of March 1, 2010.
For the three months ended May 31, 2011 and 2010, revenue from this client was approximately $504,000 (or 72.5%) and $26,000 (or 23.6%), respectively, of total revenue. For the nine months ended May 31, 2011 and 2010, revenue from this client was approximately $1.1 million (or 68.5%) and $28,000 (or 10.1%), respectively, of total revenue.
Additionally, the agreement between this client and the distributor included a 20% revenue share payable to the client. When the client became a direct client of FNDS3000, we agreed to the continuance of the revenue sharing agreement. The revenue share is based upon the monthly gross revenue minus certain expenses attributable to services provided to and transactions by its cardholders. As per the agreement, as of May 1, 2011, the revenue share percentage increased to 30% as the client met and sustained for three sequential months a threshold of 15,001 active cards.
For the three and nine months ended May 31, 2011, revenue share expense was approximately $25,000 and $44,000, respectively.
Note 12 – Related Party Transactions
During the nine months ended May 31, 2011, we sold shares of our common stock and warrants to purchase shares of our common stock to Sherington Holdings, LLC. Raymond Goldsmith, our Chairman and Chief Executive Officer, is the sole member of Sherington Holdings, LLC.
Details of the sales and related agreements are more fully described in Note 14 – Equity Transactions.
Other Expenses
As of May 31, 2011, we owe approximately $44,000 to related parties of which approximately $32,000 relates to prepaid travel for a July 2011 board of directors meeting and approximately $11,000 relates to travel and other miscellaneous expenses for a February 2011 board meeting that we incurred and owe to Sherington. We also accrued approximately $1,000 for unreimbursed employee travel and other miscellaneous expenses.
As of May 31, 2010, the Company owed approximately $56,000 to related parties for travel expenses of which approximately $43,000 was owed to Sherington for travel-related expenses incurred by the Company as of November 30, 2009. Additionally, the Company had accrued approximately $13,000 for employees and members of management for reimbursement of travel expenses not yet submitted.
As of August 31, 2010, we owed approximately $204,000 to related parties. We had accrued approximately $110,000 for consulting fees payable to Mr. Michael Dodak, a former FNDS3000 CEO, and Mr. David Fann, a former President of the Company, $42,000 for travel, legal and other miscellaneous expenses we incurred, and owed to Sherington, $16,000 payable to a director and $36,000 payable to employees for unreimbursed travel and miscellaneous expenses.
Note 13 – Commitments and Obligations
Consulting Services
As a condition to the October 2008 Sherington Agreement closing, Mr. Michael Dodak, a former FNDS3000 CEO, and Mr. David Fann, a former President of the Company, agreed that their employment agreements would be converted to Consulting Agreements effective December 5, 2008 for Mr. Dodak and February 1, 2009 for Mr. Fann. Each agreement was for a monthly fee of $10,000. However, in conjunction with other cost-cutting measures initiated by the Company during the last fiscal year, September 1, 2009 through August 31, 2010, and to contribute toward improving cash flow, Mr. Dodak and Mr. Fann agreed to defer a portion of their fees through September 30, 2010.
19
Table of Contents
During September 2010, the Company paid a total of $8,500 toward the deferred amount. In early November 2010, the Company entered into settlement agreements with both Mr. Dodak and Mr. Fann. The agreements stipulated an immediate payment of $30,000 to each, with a remaining value of $100,000 due to both to be paid in common stock of the Company. The Company recognized $200,000 of equity-based consulting expense and reduced the related combined liability reflected on its balance sheet of $301,000 to $200,000.
In November 2010, both consultants were issued the required cash payments of $30,000.
In December 2010, pursuant to the agreement, Mr. Fann was issued 571,429 shares of stock valued at $100,000.
Mr. Dodak agreed to the receipt of the $100,000 of stock in four tranches of $25,000. Per the terms of the agreement, the share price for the four tranches was to be calculated based on the lesser of $0.175 or the average trading price of the Company’s shares of common stock for the ten trading days prior to the date of the issuance.
The first tranche of 142,857 shares, valued at $0.175 per share, was issued January 4, 2011; the second tranche of 162,338 shares, valued at $0.154 per share, was issued February 1, 2011; the third tranche of 179,856 shares, valued at $0.139 per share, was issued March 7, 2011; and the fourth and final tranche of 166,667 shares will be valued at $0.15 per share when issued.
Leases
We currently have the following lease arrangements:
| • | For our office in Jacksonville, Florida, on August 1, 2009, we paid a deposit of $5,770 and entered into an 18-month lease agreement with a monthly expense of approximately $2,800. This rate was extended one month for January 2011. On February 1, 2011, we renewed the lease for one year at a monthly expense of $2,000 and will receive the 13th month at no cost. At February 1, 2011, because the amount of leased space was reduced, the deposit was also reduced by $1,590 to $4,180. For the nine months ended May 31, 2011, we recognized approximately $20,000 for lease expense for the corporate office. The remaining expense for this lease is approximately $18,000. |
| • | For our office in Johannesburg, South Africa, on April 1, 2009, we paid a deposit of approximately $17,500 and entered into a five-year lease agreement with a current monthly expense of approximately $7,200. The lease and other costs increase annually. For the nine months ended May 31, 2011, we recognized approximately $60,400 for lease and utilities expense. The remaining expense for this lease is approximately $258,000. |
| • | For our dedicated data hosting solution, which is located in a fully secured data center in South Africa, in October 2008, we entered into a three-year lease with a monthly expense of approximately $7,200. For the nine months ended May 31, 2011, we recognized approximately $130,000 for lease expense for the hosting facilities. The remaining expense for this lease is approximately $66,000. |
| • | We lease a house in South Africa. On October 1, 2010, we paid a deposit of approximately $4,350 and entered into a one-year lease with a monthly expense of approximately $4,700. For the nine months ended May 31, 2011, we recognized approximately $38,400 lease expense for the house. The remaining expense for this lease is approximately $19,000. |
Our approximate remaining expense for lease obligations under the current leases is as follows:
| Fiscal 2011 |
$ | 92,000 | ||
| Fiscal 2012 |
121,000 | |||
| Fiscal 2013 |
96,000 | |||
| Fiscal 2014 |
52,000 | |||
| Total |
$ | 361,000 | ||
20
Table of Contents
Royalties
As part of the GCC Software License Agreement (the “License”) with World Processing, Ltd., royalties are to be paid at varying rates as various threshold quantities of transactions are achieved. These thresholds are to be considered in the aggregate with respect to all financial transactions that utilize the GCC software and will not be deemed an annual threshold or a threshold calculated on a per location basis. Accordingly, once royalties of $20,000 have been paid on the first million financial transactions, the Company will pay royalties of $60,000 for the next four million financial transactions; $50,000 for the next five million financial transactions; $200,000 for the next forty million transactions; and $2,500 for each million transactions thereafter. For the nine months ended May 31, 2011, the Company expensed approximately $16,000 for royalty expense. Since inception, the total royalty expense incurred is approximately $22,600.
Employment Agreements
On July 14, 2010, the Company and Joseph McGuire, its Chief Accounting Officer, entered into a revised employment agreement for a one-year term with a salary of $120,250.
On August 30, 2010, the Company and Robert Klein entered into a Contract of Employment whereby Mr. Klein agreed to serve as the Chief Executive Officer, South Africa commencing September 1, 2010 through December 31, 2011. The Company agreed to pay Mr. Klein an annual salary of $200,000 as well as to provide Mr. Klein with standard benefits.
Note 14 – Equity Transactions
Anti-Dilutive Warrant
On December 1, 2008, the Company and Sherington entered into a securities purchase agreement for the sale and purchase of 8 million shares of the Company’s common stock for proceeds of $2 million. As part of the agreement, the Company also issued a warrant to purchase 30% of the issued and outstanding shares on a fully diluted basis at $0.35 per share. On July 1, 2009, the warrant was amended such that this warrant could only be exercised so that Sherington may maintain its percentage interest in the Company and is only exercisable if or when there has occurred a full or partial exercise of any securities of the Company outstanding as of July 1, 2009 (but excluding the securities held by Sherington and the July 2009 Sherington Warrant). The exercise price is subject to full ratchet and anti-dilution adjustments for subsequent lower price issuances by the Company.
As of May 31, 2011, this warrant cannot be readily liquidated. As the Company issues additional shares at various lower prices, this anti-dilutive warrant has been amended as required.
As of May 31, 2011, the securities, which would allow these warrants to become exercisable, have an exercise price that is greater than the fair market value of the common stock. At the time of this filing, no events have occurred which would allow these warrants to become exercisable.
Increase to Authorized Shares
On May 12, 2011, the Company amended its certificate of incorporation to increase its authorized shares of common stock from 150 million to 200 million. The increase was approved by the board of directors as well as the shareholders holding a majority of the issued and outstanding shares of common stock pursuant to a written consent dated May 12, 2011.
Issuances of Stock for Services
During the three and nine months ended May 31, 2011, the Company issued 179,856 and 1,054,680, respectively, shares of common stock. For additional details, refer to “Consulting Services” in Note 13 – Commitments and Obligations.
21
Table of Contents
Contributed Services
During the three and nine months ended May 31, 2011, the Company recognized compensation expense of $27,000 and $72,000, respectively, for services contributed by certain officers and/or directors. The value of the contributed services is recognized as additional paid-in-capital. We believe that our estimate of this value is reasonable.
Sales of Unregistered Common Stock
October 2010 Financing with Sherington - On October 19, 2010, to obtain funding for the development of the business, the Company entered into a private placement subscription agreement (the “Sherington October 2010 Subscription Agreement”) with Sherington Holdings, LLC pursuant to which Sherington purchased 5,638,890 shares of common stock (the “Sherington October 2010 Shares”) at a purchase price of $0.175 per share and a warrant to purchase 5,638,890 shares of common stock (the “Sherington October 2010 Warrant”) for aggregate gross proceeds of $986,806.
The Sherington October 2010 Warrant is exercisable for a period of two years from the date of issuance (the “Exercise Period”) at an initial exercise price of $0.175 per share. The exercise price of the Sherington October 2010 Warrant is subject to full ratchet and anti-dilution adjustment for subsequent lower price issuances by the Company, as well as customary adjustments provisions for stock splits, stock dividends, recapitalizations, etc.
Also on October 19, 2009, the Company issued to Sherington a Fifth Amended and Restated Warrant (the “Fifth Warrant”), amending the number of shares that Sherington is entitled to from 12,412,427 shares to 9,254,360 shares and recognizing an increased fully diluted interest in the Company from 49.98% to 55.21%. The Fifth Warrant provides that Sherington is entitled to purchase from the Company an aggregate of 9,254,360 shares of common stock of the Company at a price equal to $0.175 per share through December 31, 2013. Notwithstanding the foregoing, the Fifth Warrant shall only be exercisable so that Sherington may maintain its fully-diluted percentage interest in the Company of 55.21% and is only exercisable by Sherington if and when there has occurred a full or partial exercise of any derivative securities of the Company outstanding as of July 1, 2009 (but excluding the securities held by Sherington), the 4,000,000 warrants issued to Bank Julius Baer & Co. Ltd. and the 1,000,000 warrants issued to Mr. Besuchet. The exercise price of the Fifth Warrant is subject to full ratchet and anti-dilution adjustment for subsequent lower price issuances by the Company, as well as customary adjustments, provisions for stock splits, stock dividends, recapitalizations, etc.
Contemporaneously with the execution and delivery of the Sherington October 2010 Subscription Agreement, the Company and Sherington entered into Amendment No. 6 to the Registration Rights Agreement dated January 6, 2009 (the “Sixth Amendment”) whereby the Company expanded the definition of Shares (as defined in the Sixth Amendment) to include, among other things, the Sherington October 2010 Shares and the shares issuable upon the exercise of the Sherington October 2010 Warrant.
Furthermore, with the execution and delivery of the Sherington October 2010 Subscription Agreement, the Company and Sherington entered into a Commitment Agreement (the “Commitment Agreement”) dated October 19, 2010. Pursuant to the Commitment Agreement, the Company agreed to sell and Sherington agreed to commit to purchase a prescribed pro rata portion of common stock of the Company in a private placement. The Company plans to offer shares of the Company’s common stock in four tranches, the first tranche (“Tranche 1”) closed on October 19, 2010 and three additional tranches to generate proceeds of $500,000 each are to close in January 2011, April 2011 and July 2011. In addition, in the event that the aggregate funds received from accepted subscriptions of any tranche is less than the applicable tranche cap, Sherington agreed to purchase shares in an aggregate principal amount equal to, and for an aggregate purchase price of, Sherington’s call amount, as defined in the Commitment Agreement.
October 2010 Financing with Accredited Investors – Also on October 19, 2010, the Company entered into a private placement subscription agreement (the “October 2010 Subscription Agreement”) with accredited investors (the “October 2010 Investors”) pursuant to which the October 2010 Investors purchased, in the aggregate, 75,396 shares (the “Purchased Shares”) of the Company’s common stock at a purchase price of $0.175 per share and a warrant, to purchase, in the aggregate, 75,396 shares of common stock (the “October 2010 Warrant”) for aggregate gross proceeds of $13,194. The October 2010 Investors included Raymond Goldsmith, our Chairman and Chief Executive Officer.
22
Table of Contents
The October 2010 Warrant is exercisable for a period of two years from the date of issuance at an initial exercise price of $0.175 per share. The exercise price of the October 2010 Warrant is subject to full ratchet and anti-dilution adjustment for subsequent lower price issuances by the Company, as well as customary adjustments provisions for stock splits, stock dividends, recapitalizations, etc.
January 2011 Financing with Sherington - On January 24, 2011, to obtain funding for the development of the business, we sold to Sherington Holdings, LLC, at a $0.154 per share purchase price, 3,246,754 shares of common stock, $0.001 par value (the “Sherington January 2011 Shares”) and related common stock purchase warrants to acquire 3,246,754 shares of common stock (the “Sherington 2011 Warrants”) at an exercise price of $0.308 representing gross proceeds of $500,000 as more fully detailed below. This funding was provided pursuant to the Commitment Agreement dated October 19, 2010 whereby we agreed to sell and Sherington agreed to commit to purchase a prescribed pro rata portion of our common stock in a private placement. We expect to offer shares of our common stock in four tranches. The first tranche closed on October 19, 2010, the second tranche closed on January 24, 2011 and two additional tranches to generate proceeds of $500,000 each closed in March and May 2011.
The Sherington January 2011 Warrant is exercisable for a period of two years from the date of issuance at an initial exercise price of $0.308 per share. The exercise price of the Sherington January 2011 Warrant is subject to full ratchet and anti-dilution adjustment for subsequent lower price issuances by the Company, as well as customary adjustments, provisions for stock splits, stock dividends, recapitalizations, etc.
The Company also issued to Sherington a Sixth Amended and Restated Warrant (the “Sixth Warrant”), amending the number of shares that Sherington is entitled to from 9,254,360 shares to 13,156,920 shares and also recognizing an increased interest in the Company from 55.21% to 57.42%. The Sixth Warrant provides that Sherington is entitled to purchase from the Company an aggregate of 13,156,920 shares of common stock of the Company at a price equal to $0.154 per share through December 31, 2013. Notwithstanding the foregoing, the Sixth Warrant shall only be exercisable so that Sherington may maintain its percentage interest in the Company of approximately 57.42% and is only exercisable by Sherington if and when there has occurred a full or partial exercise of any derivative securities of the Company outstanding as of July 1, 2009 (but excluding the securities held by Sherington), the 4,000,000 warrants issued to Bank Julius Baer & Co. Ltd. and the 1,000,000 warrants issued to Mr. Besuchet. The exercise price of the Sixth Warrant is subject to full ratchet and anti-dilution adjustment for subsequent lower price issuances by the Company, as well as customary adjustments, provisions for stock splits, stock dividends, recapitalizations, etc.
The Company and Sherington also entered into Amendment No. 7 to the Registration Rights Agreement dated January 24, 2011 (the “Seventh Amendment”) whereby the definition of Shares (as defined in the Sixth Amendment) was expanded to include, among other things, the Sherington January 2011 Shares and the shares issuable upon the exercise of the Sherington January 2011 Warrant.
These securities were offered and sold to Sherington in a private placement transaction made in reliance upon exemptions from registration pursuant to Section 4(2) under the Securities Act of 1933 and Rule 506 promulgated under Regulation D thereunder. Sherington is an accredited investor as defined in Rule 501 of Regulation D promulgated under the Securities Act of 1933.
March 2011 Financing with Sherington - On March 7, 2011, we sold 3,592,843 shares of Common Stock, $0.001 par value (the “Sherington March 2011 Shares”) and related common stock purchase warrants to acquire 3,592,843 shares of common stock (the “Sherington March 2011 Warrants”) at an exercise price of $0.278 to Sherington Holdings, LLC at a per share purchase price of $0.139 representing gross proceeds of approximately $500,000 as more fully detailed below. This funding was provided pursuant to the Commitment Agreement dated October 19, 2010 whereby the Company agreed to sell and Sherington agreed to commit to purchase a prescribed pro rata portion of common stock of the Company in a private placement. The Company expects to offer shares of the Company’s Common Stock in four tranches, the first tranche closed on October 19, 2010, the second tranche closed on January 24, 2011, and the third closed on March 7, 2011 and one additional tranche to generate proceeds of $500,000 is to close in July 2011. Raymond Goldsmith, the Chairman, Chief Executive Officer and President of the Company, is also the Chairman and CEO of Sherington Holdings, LLC, which is a private investment company and the principal shareholder of the Company.
23
Table of Contents
The Sherington March 2011 Warrant is exercisable for a period of two years from the date of issuance at an initial exercise price of $0.278 per share. The exercise price of the Sherington March 2011 Warrant is subject to full ratchet and anti-dilution adjustment for subsequent lower price issuances by the Company, as well as customary adjustments, provisions for stock splits, stock dividends, recapitalizations and the like.
In conjunction with the March financing, the Company sold an additional 4,279 shares of common stock and 4,279 common stock purchase warrants with an exercise price of $0.278 to one other investor at a purchase price of $0.139 for gross proceeds of $595.
Additionally, we issued to Sherington a Seventh Amended and Restated Warrant (the “Seventh Warrant”), amending the number of shares that Sherington is entitled to from 13,156,920 shares to 14,553,891 shares and also recognizing an increased interest in the Company from 57.42% to 59.87%. The Seventh Warrant provides that Sherington is entitled to purchase from the Company an aggregate of 14,553,891 shares of Common Stock of the Company at a price equal to $0.139 per share through December 31, 2013. Notwithstanding the foregoing, the Seventh Warrant shall only be exercisable so that Sherington may maintain its percentage interest in the Company of approximately 59.87% and is only exercisable by Sherington if and when there has occurred a full or partial exercise of any derivative securities of the Company outstanding as of July 1, 2009 (but excluding the securities held by Sherington), the 4,000,000 warrants issued to Bank Julius Baer & Co. Ltd. and the 1,000,000 warrants issued to Mr. Besuchet. The exercise price of the Seventh Warrant is subject to full ratchet and anti-dilution adjustment for subsequent lower price issuances by the Company, as well as customary adjustments, provisions for stock splits, stock dividends, recapitalizations and the like.
On March 7, 2011, the Company and Sherington entered into Amendment No. 8 (the “Eighth Amendment”) to the certain Registration Rights Agreement whereby the Company expanded the definition of Shares (as defined in the Sixth Amendment) to include, among other things, the Sherington March 2011 Shares and the shares issuable upon the exercise of the Sherington March 2011 Warrant.
May 2011 Financing with Sherington - On May 12, 2011, FNDS3000 sold 3,333,334 shares of Common Stock, $0.001 par value (the “Sherington May 2011 Shares”) and related common stock purchase warrants to acquire 3,333,334 shares of common stock (the “Sherington May 2011 Warrants”) at an exercise price of $0.30 to Sherington at a per share purchase price of $0.15 representing gross proceeds of $500,000 as more fully detailed below. This funding was provided pursuant to the Commitment Agreement dated October 19, 2010 whereby the Company agreed to sell and Sherington agreed to commit to purchase a prescribed pro rata portion of common stock of the Company in a private placement. The Company offered shares of the Company’s Common Stock in four tranches, the first tranche closed on October 19, 2010, the second tranche closed on January 24, 2011, and the third closed on March 7, 2011. The fourth and final tranche for $500,000 closed on May 12, 2011. Raymond Goldsmith, the Chairman, Chief Executive Officer and President of the Company, is also the Chairman and CEO of Sherington Holdings, LLC, which is a private investment company and the principal shareholder of the Company.
The Sherington May 2011 Warrant is exercisable for a period of two years from the date of issuance at an initial exercise price of $0.30 per share. The exercise price of the Sherington May 2011 Warrant is subject to full ratchet and anti-dilution adjustment for subsequent lower price issuances by the Company, as well as customary adjustments, provisions for stock splits, stock dividends, recapitalizations and the like.
Further, the Company issued to Sherington a Eighth Amended and Restated Warrant (the “Eighth Warrant”), amending the number of shares that Sherington is entitled to from 14,553,891 shares to 15,838,768 shares. The Eighth Warrant provides that Sherington is entitled to purchase from the Company an aggregate of 15,838,768 shares of Common Stock of the Company at a price equal to $0.139 per share through December 31, 2013. Notwithstanding the foregoing, the Eighth Warrant is only exercisable by Sherington if and when there has occurred a full or partial exercise of any derivative securities of the Company outstanding as of July 1, 2009 (but excluding the securities held by Sherington), the 4,000,000 warrants issued to Bank Julius Baer & Co. Ltd. and the 1,000,000 warrants issued to Mr. Besuchet (collectively, the “Limited Derivative Securities”). Following the full or partial exercise of the Limited Derivative Securities, Sherington may only exercise the Eight Warrant so that Sherington may maintain a percentage ownership in the Company’s shares of common stock of approximately 61%. The exercise price of the Eighth Warrant is subject to full ratchet and anti-dilution adjustment for subsequent lower price issuances by the Company, as well as customary adjustments, provisions for stock splits, stock dividends, recapitalizations and the like.
24
Table of Contents
On May 12, 2011, the Company and Sherington entered into Amendment No. 9 (the “Ninth Amendment”) to the certain Registration Rights Agreement whereby the Company expanded the definition of Shares (as defined in the Sixth Amendment) to include, among other things, the Sherington May 2011 Shares and the shares issuable upon the exercise of the Sherington May 2011 Warrant.
All securities were offered and sold in private placement transactions made in reliance upon exemptions from registration pursuant to Section 4(2) under the Securities Act of 1933 and Rule 506 promulgated under Regulation D thereunder. Sherington is an accredited investor as defined in Rule 501 of Regulation D promulgated under the Securities Act of 1933.
Stock Options
During the three and nine months ended May 31, 2011, no options were granted, exercised or expired, however, during the three months ended May 31, 2011, 85,159 stock options with a strike price of $0.44 were forfeited. The net effect of the cost allocation of outstanding options and the forfeited options during the three months ended May 31, 2011 was a credit of approximately $1,600. During the nine months ended May 31, 2011, option expense was approximately $11,400. At May 31, 2011, the Company has 5,670,000 outstanding options as detailed below:
| Quantity |
% Vested | Exercise Price/Range | Expiration Date/Range | |||||||||
| 3,500,000 | 100 | % | $ | 0.26 | June 2014 | |||||||
| 500,000 | 100 | % | $ | 0.20 | July 2015 | |||||||
| 500,000 | 100 | % | $ | 0.29 | July 2014 | |||||||
| 500,000 | 100 | % | $ | 0.39 | July 2013 | |||||||
| 500,000 | 100 | % | $ | 0.40 | October 2013 | |||||||
| 90,000 | 66 | % | $ | 0.40 | January 2014 | |||||||
| 35,000 | 66 | % | $ | 0.44 | September 2013 | |||||||
| 45,000 | 100 | % | $ | 0.745 | October 2013 | |||||||
| 5,670,000 | ||||||||||||
Stock Warrants
During the three months ended May 31, 2011, no warrants expired or were exercised, however, in conjunction with private placements of equity; the following two-year warrants were issued:
| Quantity Issued |
Exercise Price | Expiration Date | ||||||
| 3,592,843 | $ | 0.278 | March 7, 2013 | |||||
| 3,333,334 | $ | 0.300 | May 12, 2013 | |||||
During the nine months ended May 31, 2011, 52,630 warrants with an exercise price of $0.70 and 52,000 warrants with an exercise price of $0.25 expired; no warrants were exercised. Additionally, in conjunction with the sale of equity for proceeds of $2.5 million, the Company issued a total of 15,891,496 two-year warrants, as follows (See “Sales of Unregistered Stock” in Note 14 – Equity Transactions for additional details):
| Quantity Issued |
Exercise Price | Expiration Date | ||||||
| 5,638,890 | $ | 0.175 | October 19, 2012 | |||||
| 3,246,754 | $ | 0.308 | January 24, 2013 | |||||
| 3,592,843 | $ | 0.278 | March 7, 2013 | |||||
| 3,333,334 | $ | 0.300 | May 12, 2013 | |||||
25
Table of Contents
As of May 31, 2011, the Company has 46,964,361 outstanding warrants and 15,838,768 potential anti-dilutive warrants
| Quantity Outstanding |
Exercise Price/Range | Expiration Date Range | ||||||
| 5,714,286 | $ | 0.20 | July 2011 | |||||
| 11,791,428 | $ | 0.175 | October 2011 to November 2011 | |||||
| 18,285,716 | $ | 0.175 to $0.25 | April 2012 to Oct 2012 | |||||
| 11,177,210 | $ | 0.20 to $0.308 | January 2013 to June 2013 | |||||
| 46,968,640 | Sub-total of outstanding warrants | |||||||
| 15,838,768 | $ | 0.139 | Potential anti-dilutive Sherington warrant | |||||
| 62,807,428 | Total outstanding and potential warrants | |||||||
Note 15 – Subsequent Events
On July 1, 2011, 5,714,286 warrants with an exercise price of $0.20 expired unexercised.
On July 15, 2011, the Company and Joseph McGuire, its Chief Accounting Officer, entered into a revised employment agreement with an annual salary of $120,250.
| ITEM 2. | MANAGEMENT’S DISCUSSION AND ANALYSIS OF FINANCIAL CONDITION AND RESULTS OF OPERATIONS |
Our Management Discussion and Analysis (“MD&A”) is provided as a supplement to our audited financial statements to help provide an understanding of our financial condition, changes in financial condition and results of operations.
The following discussion should be read in conjunction with the financial statements and notes thereto included elsewhere in this Form 10-Q and the financial statements in the annual report on Form 10-K filed on November 29, 2010. Historical results and percentage relationships set forth in the statement of operations, including trends that might appear, are not necessarily indicative of future operations.
Future Uncertainties and Forward-Looking Statements
In addition to historical information, this Quarterly Report on Form 10-Q contains forward-looking statements that involve risks and uncertainties that could cause actual results to differ materially. Factors that might cause or contribute to such differences include, but are not limited to, those discussed in the section entitled “Management’s Discussion and Analysis of Financial Condition and Results of Operation.” You should carefully review the risks described in other documents we file from time to time with the Securities and Exchange Commission (“SEC”), including the Quarterly Reports on Form 10-Q and the Annual Reports on Form 10-K. When used in this report, the words “expects,” “anticipates,” “intends,” “plans,” “believes,” “seeks,” “targets,” “estimates,” and similar expressions are generally intended to identify forward-looking statements. You should not place undue reliance on the forward-looking statements, which speak only as of the date of this Quarterly Report on Form 10-Q. We undertake no obligation to publicly release any revisions to the forward-looking statements or reflect events or circumstances after the date of this document. Estimates of future financial results are inherently unreliable.
From time to time, representatives of FNDS3000 Corp (the “Company,” “FNDS3000,” “we,” “our,” “its” or “us”) may make public predictions or forecasts regarding the Company’s future results, including estimates regarding future revenue, expense levels, earnings or earnings from operations. Any forecast regarding the Company’s future performance reflects various assumptions. These assumptions are subject to significant uncertainties, and, as a matter of course, many of them will prove to be incorrect. Further, the achievement of any forecast depends on numerous factors (including those described in this discussion), many of which are beyond the Company’s control. As a result, there can be no assurance that the Company’s performance will be consistent with any of management’s forecasts or that the variation from such forecasts will not be material and adverse. Investors are cautioned not to base their entire analysis of the Company’s business and prospects upon isolated predictions, but instead are encouraged to utilize the entire available mix of historical and forward-looking information made available by the Company, and other information affecting the Company and its products, when evaluating the Company’s prospective results of operations.
26
Table of Contents
In addition, representatives of the Company may occasionally comment publicly on the perceived reasonableness of published reports by independent analysts regarding the Company’s projected future performance. Such comments should not be interpreted as an endorsement or adoption of any given estimate or range of estimates or the assumptions and methodologies upon which such estimates are based. Undue reliance should not be placed on any comments regarding the conformity, or lack thereof, of any independent estimates with the Company’s own present expectations regarding its future results of operations. The methodologies employed by the Company in arriving at its own internal projections and the approaches taken by independent analysts in making their estimates are likely different in many significant respects. Although the Company may presently perceive a given estimate to be reasonable, changes in the Company’s business, market conditions or the general economic climate may have varying effects on the results obtained using differing analyses and assumptions. The Company expressly disclaims any continuing responsibility to advice analysts or the public markets of its view regarding the current accuracy of the published estimates of outside analysts. Persons relying on such estimates should pursue their own independent investigation and analysis of their accuracy and the reasonableness of the assumptions on which they are based.
BUSINESS
Process of Issuance
There are several steps in the process of getting prepaid cards productively in the hands of cardholders, and care must be taken in understanding the terminology used to describe the numbers of cards at the different steps. In the majority of our programs, the sequence of steps is as follows:
| • | Cards ordered. The first step is an order by the corporate client for a number of blank cards. This may be made several months before the date of issuance. The corporate client pays the initial costs at this stage. |
| • | Cards distributed. Upon manufacture and receipt of the cards, they are distributed to the corporate client and/or the custodian designated by them according to the client’s timing schedule. |
| • | Cards issued. Upon direction from the client, individualized cards are prepared for issuance to the cardholder. |
| • | Cards activated. Activation occurs when the cardholder sets a personal identification number (“PIN”). |
| • | Cards loaded. This final step occurs when the corporate client loads funds into the personal record of the cardholder, making the card usable. |
Progress from September 1, 2010 to May 31, 2011
Effective late September 2010, the Company implemented several strategic reorganizational initiatives specifically designed to streamline its senior management structure, reduce corporate overhead and strengthen its overall operating platform.
Key restructuring initiatives include:
| • | changes to the composition of the board of directors, which now has four members; |
| • | expansion of the leadership role of current Chairman Raymond Goldsmith through his appointment to the additional posts of President and Chief Executive Officer, replacing our former President and CEO John Hancock; |
| • | increased working capital of approximately $1 million through the elimination of annual corporate overhead cash expenses through U.S. corporate staff reductions and distribution of equity in lieu of cash for certain consulting fees; and |
| • | utilization of savings to be recognized from the reduction of corporate overhead expenses to support growth in our operations and expansion into other emerging markets. |
27
Table of Contents
On October 19, 2010, to obtain funding for the further development of the business, we closed a non-brokered private placement. In conjunction with the closing of the October 2010 financing, the Company and Sherington entered into a Commitment Agreement in which, Sherington agreed to commit to purchase a prescribed pro rata portion of common stock of the Company in a private placement. The Company plans to offer shares of the Company’s common stock in four tranches.
The first tranche of $1 million was the October 19, 2010 private placement. The three additional tranches are to generate proceeds of $500,000 each.
The second tranche was closed on January 24, 2011, in a non-brokered private placement with Sherington for the purchase of 3,246,754 shares of our common stock at a purchase price of $0.154 per share and warrants to purchase 3,246,754 shares exercisable at $0.308 per share for gross proceeds of $500,000.
The third tranche was closed on March 7, 2011, in a non-brokered private placement with Sherington for the purchase of 3,592,843 shares of our common stock at a purchase price of $0.139 per share and warrants to purchase 3,592,843 shares exercisable at $0.278 per share for gross proceeds of $499,405. One other investor purchased 4,279 shares of our common stock at a purchase price of $0.139 per share and warrants to purchase 4,279 shares exercisable at $0.278 per share for gross proceeds of $595.
The fourth tranche was closed on May 12, 2011, in a non-brokered private placement with Sherington for the purchase of 3,333,334 shares of our common stock at a purchase price of $0.150 per share and warrants to purchase 3,333,334 shares exercisable at $0.30 per share for gross proceeds of $500,000.
Results of Operations
This discussion should be read in conjunction with our consolidated financial statements included in this Quarterly Report on Form 10-Q and the notes thereto, as well as the other sections of this Report on Form 10-Q. This discussion contains a number of forward-looking statements, all of which are based on our current expectations and could be affected by the uncertainties and risk factors described throughout this Quarterly Report. Our actual results may differ materially.
Metrics
Described below are certain metrics that we use, among other metrics and measures, to monitor and evaluate our operating performance and our success in building our business and driving future growth.
We monitor the number of active cards by month rather than by quarter. Thus, the active card data, which is the first metric addressed below, represents the total number of revenue-producing cards that were active during the third month of our last seven fiscal quarters. The remaining metric data reflects the total quarterly activity, also for the last seven fiscal quarters.
Number of Active Cards - represents the total number of revenue-producing cards during the third month of our fiscal quarters. We had approximately 32,200 active cards during May 2011, which represents an increase of 25.3% as compared to approximately 25,700 active cards during the month of February 2011. Active cards during the months of May and February 2010 were approximately 4,700 and 2,600, respectively. It is anticipated that this upward trend will continue.
Since inception through May 31, 2011, approximately 70,800 cards have been activated. For various reasons, not all cards may be active during the third month of our fiscal quarter. Such reasons can include, but are not limited to, the purpose of the card, card cancellations, the timing of card activation by the cardholder or the cardholder’s use of the card.
28
Table of Contents
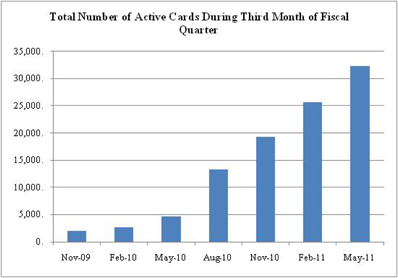
Gross Volume of South African Rands Loaded to Cards.
The total volume of Rands loaded to cards during our last seven fiscal quarters, which is a key indicator of our growth, has continued to increase. The gross volume of Rands loaded to cards was approximately 184.6 million Rands and 415.3 million Rands, respectively, for the three and nine months ended May 31, 2011. The gross volume of Rands loaded to cards during the quarter ended May 31, 2011 represents an increase of 31.6% as compared to the gross volume of Rands loaded to cards during the previous three months ended February 28, 2011. For the three and nine months ended May 31, 2010, the gross volume of Rands loaded to cards was approximately 22.7 million Rands and 45.4 million Rands, respectively. It is anticipated that this upward trend will continue.
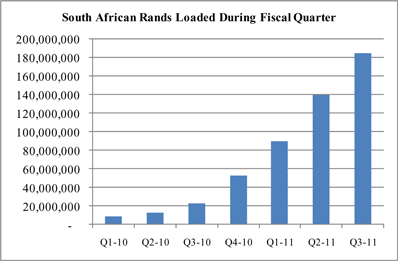
Revenue by Quarter.
As the volume of Rands loaded to cards has increased, so has our revenue. As illustrated in the graph below, we have successfully increased our revenue over the last seven fiscal quarters. Although our growth was limited in the early months of our production rollout, during the three months ended August 31, 2010 we began to see improvement in our revenue. It is anticipated that this upward trend will continue.
29
Table of Contents
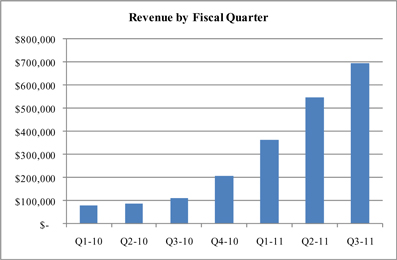
Comparison of Quarter-Over-Quarter Results of Operations for the Three Months Ended May 31, and February 28, 2011.
In addition to providing comparative results of operations for the three months ended May 31, 2011 and 2010, we have also included data relating to our comparative results on a subsequent quarter-over-quarter basis for the three months ended May 31 and February 28, 2011 so that we may provide greater perspective on our short-term progress and prevailing growth trends.
The following table provides the statements of the operations data for the fiscal quarters ended May 31, 2011 and February 28, 2011 as a percentage of revenue. The trends suggested by this table may not be indicative of future operating results:
| Quarter-to-Quarter Comparative Results for the Three Months Ended |
||||||||||||||||||||||||
| May 31, 2011 |
% of Revenue |
February 28, 2011 |
% of Revenue |
Variance $ | Variance % | |||||||||||||||||||
| Revenue, net |
$ | 695,300 | $ | 545,951 | $ | 149,349 | 27.4 | % | ||||||||||||||||
| Cost of revenue |
439,094 | 63.2 | % | 341,729 | 62.6 | % | 97,365 | 28.5 | % | |||||||||||||||
| Gross margin |
256,206 | 36.8 | % | 204,222 | 37.4 | % | 51,984 | 25.5 | % | |||||||||||||||
| Operating expenses: |
||||||||||||||||||||||||
| Processing, technical and financial expense |
251,683 | 36.2 | % | 384,438 | 70.4 | % | (132,755 | ) | -34.5 | % | ||||||||||||||
| Salaries and benefits expense |
365,804 | 52.6 | % | 382,278 | 70.0 | % | (16,474 | ) | -4.3 | % | ||||||||||||||
| Travel expense |
15,264 | 2.2 | % | 28,576 | 5.2 | % | (13,312 | ) | -46.6 | % | ||||||||||||||
| Professional and consultant expense |
32,429 | 4.7 | % | 53,460 | 9.8 | % | (21,031 | ) | -39.3 | % | ||||||||||||||
| Depreciation and amortization expense |
71,564 | 10.3 | % | 72,171 | 13.2 | % | (607 | ) | -0.8 | % | ||||||||||||||
| Other selling, general and administrative expense |
85,246 | 12.3 | % | 88,006 | 16.1 | % | (2,760 | ) | -3.1 | % | ||||||||||||||
| Total operating expense from operations |
821,990 | 118.2 | % | 1,008,929 | 184.8 | % | (186,939 | ) | -18.5 | % | ||||||||||||||
| Loss from operations |
(565,784 | ) | -81.4 | % | (804,707 | ) | -147.4 | % | 238,923 | -29.7 | % | |||||||||||||
| Other income (expense) |
(6,430 | ) | -0.9 | % | 14,877 | 2.7 | % | (21,307 | ) | -143.2 | % | |||||||||||||
| Net loss |
$ | (572,214 | ) | -82.3 | % | $ | (789,830 | ) | -144.7 | % | $ | 217,616 | -27.6 | % | ||||||||||
| Financial Condition and Liquidity Data: |
||||||||||||||||||||||||
| Cash (period end), net of restricted cash |
$ | 641,211 | $ | 289,392 | ||||||||||||||||||||
| Net cash used in operating activities |
$ | 616,541 | 88.7 | % | $ | 633,794 | 116.1 | % | ||||||||||||||||
| Non-cash expenses |
$ | 98,829 | 14.2 | % | $ | 134,877 | 24.7 | % | ||||||||||||||||
Revenue
For the three months ended May 31, 2011, revenue increased $149,349, or 27.4%, as compared to the previous three months ended February 28, 2011. Revenue from fees increased approximately $145,000 and $23,000 from service charges. Offsetting these increases, were decreases of approximately $14,000 from sales of cards and $5,000 from other miscellaneous revenue. Key to the increases is the increased number of active cards and the volume of transactions and funds loaded. As we continue to see increases in all three of these factors, we expect our revenue to continue to increase accordingly.
30
Table of Contents
Cost of Revenue
Costs of revenue increased approximately $97,000 and costs as a percentage of revenue increased 0.6%. During this fiscal year, costs of revenue have ranged between approximately 62% and 63% of revenue quarterly. We are not aware, at this time, of any factors that would cause this rate to materially change.
Operating Expense
For the fiscal quarter ended May 31, 2011, processing, technical and financial expense decreased approximately $133,000 as compared the fiscal quarter ended February 28, 2011. Fees for information technology consultants decreased approximately $140,000 as certain improvements and revisions to the processing platform were scaled back until our operations are producing sufficient revenue to maintain a positive cash flow. Additionally, effective April 1, 2011, the Company is no longer incurring $7,500 for monthly maintenance of the platform by GCC. This decreased our expense this fiscal quarter as compared to the prior fiscal quarter by $15,000 but this was offset by an increase of approximately $15,000 for revenue sharing expense. Various other increases and decreases netted to an increase of approximately $7,000. Due to the nature of the decrease in total expense, we do not expect a similar decrease in expense between our subsequent fiscal quarters.
For the three months ended May 31, 2011 as compared to the previous fiscal quarter ended February 28, 2011, all other operating expenses combined netted to a decrease of approximately $54,000.
Salaries and benefits expense decreased a total of approximately $16,000 due to a decrease of $18,000 for contributed services expense, $17,000 for a pension benefit that was paid in February, $14,000 for relocation expense, $8,000 for equity-based compensation as we adjusted the expense for a forfeited stock option, and $4,000 for temporary labor. Offsetting these decreases is an increase in salaries and payroll taxes of approximately $39,000 as in March we offered a staff position to an IT consultant who had previously worked with us for several months in South Africa and for approximately $6,000 for accrued paid time off.
Professional and consultant expense decreased a total of approximately $21,000 due to a decrease of $38,000 for fees related to business development consultants and $4,000 for accounting and other fees. However, these decreases were offset by an increase of approximately $21,000 for legal fees. Due to the nature of the decrease in professional and consulting expense, we do not expect a similar decrease in expense between our subsequent fiscal quarters.
Travel expense decreased approximately $13,000 due to costs incurred during our second fiscal quarter for a February board of directors meeting.
Other selling, general and administrative expense decreased approximately $11,000 for bad debt expense but increased $3,000 for rent expense and $4,000 for various investor relations expenses.
Due to the nature and timing of some of the variable expenses, these expenses are anticipated to fluctuate between fiscal periods.
Comparison of Results of Operations for the Three Months Ended May 31, 2011 and 2010.
The trends suggested by this fiscal quarter’s results may not be indicative of future operating results.
The following table provides the revenue, cost of revenue and gross margin for the fiscal quarters ended May 31, 2011 and 2010 as a percentage of revenue.
31
Table of Contents
| For the Three Months Ended May 31, | ||||||||||||||||||||||||
| 2011 | 2010 | Variance | ||||||||||||||||||||||
| Amount | % of Revenue |
Amount | % of Revenue |
Amount | % | |||||||||||||||||||
| Revenue |
$ | 695,300 | $ | 110,274 | $ | 585,026 | 530.5 | % | ||||||||||||||||
| Cost of revenue |
439,094 | 63.2 | % | 71,047 | 64.4 | % | 368,047 | 518.0 | % | |||||||||||||||
| Gross margin |
$ | 256,206 | 36.8 | % | $ | 39,227 | 35.6 | % | $ | 216,979 | 553.1 | % | ||||||||||||
Revenue
For the three months ended May 31, 2011, revenue was $695,300, an increase of $585,026, or 530.5%, as compared to $110,274 for the three months ended May 31, 2010. Components of revenue include approximately $525,000 from transaction fees, $93,000 from service charges, $57,000 from the sale of cards and security tokens and $20,000 of other revenue. The increase is due to the increased volume of active cards, transactions and funds loaded to cards. However, as we continue to see increases in all three of these factors, we expect our revenue to continue to increase accordingly.
Our gross U.S. dollar volume loaded to cards was approximately $26.8 million and $3.3 million, respectively, for the three months ended May 31, 2011 and 2010. These values are estimates using the average currency exchange rate for each applicable fiscal quarter. The gross volume of funds loaded to cards during the quarter ended May 31, 2011 represents an increase of 800.0% as compared to the gross volume of funds loaded to cards during the three months ended May 31, 2010.
Currently, the Company has a significant concentration of revenue attributable to one direct client, which is a leading provider of diversified employment services in South Africa. We began providing services to this client when it was a customer with a former distributor. As part of the dissolution of the distributor agreement between the Company and the distributor, we entered into has a direct service agreement with this client as of March 1, 2010. For the three months ended May 31, 2011 and 2010, revenue from this client accounted for approximately $504,000 (or 72.5%) and $26,000 (or 23.6%), respectively, of total revenue.
For the three months ended May 31, 2010, revenue of $110,274 consisted of approximately $65,000 from transaction fees, $25,000 from service charges, $10,000 from the sale of cards and security tokens and $10,000 of other revenue.
Cost of Revenue
For improved comparison of card- and transaction-related cost to revenue, certain costs are now classified as “Processing, Technical and Financial Expense” and are included in Operating Expense rather than as Cost of Revenue.
The cost of revenue will generally correspond with changes in revenue.
| For the Three Months Ended May 31, | ||||||||||||||||||||||||
| 2011 | 2010 | Variance | ||||||||||||||||||||||
| Amount | % of Revenue |
Amount | % of Revenue |
Amount | % | |||||||||||||||||||
| Cost of revenue: |
||||||||||||||||||||||||
| Fees |
$ | 347,991 | 50.0 | % | $ | 40,072 | 36.3 | % | $ | 307,919 | 768.4 | % | ||||||||||||
| Service charges |
57,186 | 8.3 | % | 21,428 | 19.4 | % | 35,758 | 166.9 | % | |||||||||||||||
| Cards, tokens and other costs |
33,917 | 4.9 | % | 9,547 | 8.7 | % | 24,370 | 255.3 | % | |||||||||||||||
| Total cost of revenue |
$ | 439,094 | 63.2 | % | $ | 71,047 | 64.4 | % | $ | 368,047 | 518.0 | % | ||||||||||||
For the three months ended May 31, 2011, the cost of revenue was $439,094, an increase of $368,047, or 518.0%, as compared to $71,047 for the three months ended May 31, 2010. The cost of revenue as a percentage of revenue was 63.2% for the three months ended May 31, 2011 as compared to 64.4% for the three months ended May 31, 2010, a decrease of 1.2%. We are not aware, at this time, of any factors that would cause the ratio of total costs of revenue as compared to total revenue to materially change.
32
Table of Contents
Key to these increases is the number of issued and active cards, the quantity of transaction and the volume of funds loaded to the cards during the three months ended May 31, 2011 as compared to the three months ended May 31, 2010.
Gross Margin
The gross margin for the three months ended May 31, 2011 and 2010 was $256,206, or 36.8% of revenue, and $39,227, or 35.6% of revenue, respectively, an increase of $216,979, or 553.1%. The gross margin for the three months ended May 31, 2010 has been revised from a loss of $60,943 due to a reclassification of certain expenses from cost of revenue to operating expenses.
Operating Expenses
For the three months ended May 31, 2011, total operating expense was $821,990, a decrease of $151,201, or 15.5%, as compared to $973,191 for the three months ended May 31, 2010.
Costs associated with professional services, depreciation and amortization of our property and equipment, and rent and utilities vary based upon our investment in infrastructure, risk management and internal controls and are generally not correlated with our operating revenues or other transaction metrics.
The following table presents a breakdown of our operating expenses:
| For the Three Months Ended May 31, | ||||||||||||||||||||||||
| 2011 | 2010 | Variance | ||||||||||||||||||||||
| Amount | % of Revenue |
Amount | % of Revenue |
Amount | % | |||||||||||||||||||
| Operating expenses: |
||||||||||||||||||||||||
| Processing, technical/financial |
$ | 251,683 | 36.2 | % | $ | 204,163 | 185.1 | % | $ | 47,520 | 23.3 | % | ||||||||||||
| Salaries and benefits |
365,804 | 52.6 | % | 406,489 | 368.6 | % | (40,685 | ) | -10.0 | % | ||||||||||||||
| Travel |
15,264 | 2.2 | % | 50,793 | 46.1 | % | (35,529 | ) | -69.9 | % | ||||||||||||||
| Consultants |
32,429 | 4.7 | % | 174,479 | 158.2 | % | (142,050 | ) | -81.4 | % | ||||||||||||||
| Depreciation/amortization |
71,564 | 10.3 | % | 74,960 | 68.0 | % | (3,396 | ) | -4.5 | % | ||||||||||||||
| Other general/administrative |
85,246 | 12.2 | % | 62,307 | 56.5 | % | 22,939 | 36.8 | % | |||||||||||||||
| Total operating expenses |
$ | 821,990 | 118.2 | % | $ | 973,191 | 882.5 | % | $ | (151,201 | ) | -15.5 | % | |||||||||||
Our operating expenses are classified in the following six categories:
Processing, Technical and Financial Expense – Processing, technical and financial expense consist primarily of costs related to the infrastructure needed process the card transactions, such as information technology consultants, the lease of the computer hosting facility, intrusion and fraud detection programs, fees charged by our sponsor bank and MasterCard and revenue sharing.
For the three months ended May 31, 2011, processing, technical and financial expense was $251,683, an increase of $47,520, or 23.3%, as compared to $204,163 for the three months ended May 31, 2010.
The increase of approximately $48,000 for the three months ended May 31, 2011 as compared to the three months ended May 31, 2010 was primarily the result of increases of approximately $59,000 for revenue sharing expense, $26,000 for call center and hosting facility expense and $11,000 for MasterCard and sponsor bank fee expense. These increases are offset by decreases of approximately $33,000 for computer consultant expense as we have limited our platform enhancements until we are closer to becoming cash flow positive and $15,000 for GCC maintenance fee expense. We expect that certain of these expenses will increase as revenue increases, whereas other expenses may not.
For the three months ended May 31, 2011, approximately $25,000 of the total revenue share expense of $60,000 was attributed to one direct client, which is also our leading revenue producer.
Salaries and Benefits Expense – Salaries and benefits expense includes costs related to employee salaries, health insurance and payroll taxes. Also included are certain non-cash expenses such as equity compensation and the value of services contributed (no compensation of any manner) by certain officers and/or directors.
33
Table of Contents
For the three months ended May 31, 2011, salaries and benefits expense was $365,804, a decrease of $40,685, or 10.0%, as compared to $406,489 for the three months ended May 31, 2010.
We recognized a decrease of approximately $36,000 for equity-based compensation expense as during May 31, 2010, we recognized expense related to the granting of two fully vested stock option agreements. Temporary labor expense decreased $14,000 and employee relocation expense decreased $10,000. Additionally, as we have fewer employees during this third fiscal quarter as compared to the prior year’s third fiscal quarter, our expenses decreased approximately $9,000 for employee insurance and other benefits and $6,000 for paid time off. Salaries expense, however, did not significantly change as, in October 2010, we hired our CEO of South Africa, which offset the decrease in salaries from the personnel reduction.
Offsetting the decrease is an expense of $27,000 for contributed services as compared to no expense for contributed services during the three months ended May 31, 2010 and an increase of approximately $7,000 for employer payroll taxes.
Travel Expense – Travel expense is primarily comprised of the cost of airfare for international travel along with associated lodging, vehicle rentals, meals and entertainment costs. For the three months ended May 31, 2011, travel expense was $15,264, a decrease of $35,529, or 69.9%, as compared to $50,793 for the three months ended May 31, 2010.
The decrease of $35,529 for the three months ended May 31, 2011 as compared to the three months ended May 31, 2010 was the result of fewer flights and related travel costs.
Professional and Consultant Expense – Professional and consultant expense consists primarily of legal fees, accounting fees and other consultant fees, as needed. For the three months ended May 31, 2011, professional and consultant expense was $32,429, a decrease of $142,050, or 81.4%, as compared to $174,479 for the three months ended May 31, 2010.
The decrease of $142,050 for the three months ended May 31, 2011 as compared to the three months ended May 31, 2010 was primarily due to a decrease of approximately $86,000 of equity-based consulting expense for the services of the Sherington consultant provided as part of a private placement agreement. Other consulting expense decreased approximately $67,000 as the result of the November 2010 settlement agreements with Mr. Michael Dodak and Mr. David Fann. Due to the nature of the decrease in professional and consulting expense, we do not expect a similar decrease in expense between our subsequent fiscal quarters. Offsetting the decreases is an increase of approximately $11,000 of legal and other professional fees.
Depreciation and Amortization Expense – Depreciation and amortization expense relates to the GCC software license and various fixed assets.
Other Selling, General and Administrative Expense – Other selling, general and administrative expense consists primarily of communication costs, rent and utilities, and insurance.
For the three months ended May 31, 2011, other selling, general and administrative expense was $85,246, an increase of $22,939, or 36.8%, as compared to $62,307 for the three months ended May 31, 2010. The increase was primarily due to approximately $19,000 of rent expense for the October 2010 lease of a house in South Africa, a $2,000 increase in bad debt expense and $2,000 for other office expense.
Other Income and Expense
Total other income and expense decreased $109,738, or 94.5%, for the three months ended May 31, 2011 as compared to the three months ended May 31, 2010.
34
Table of Contents
| For the Three Months Ended May 31, | ||||||||||||||||||||||||
| 2011 | 2010 | Variance | ||||||||||||||||||||||
| Amount | % of Revenue |
Amount | % of Revenue |
Amount | % | |||||||||||||||||||
| Other income (expense): |
||||||||||||||||||||||||
| Interest and other income |
$ | 2,393 | 0.3 | % | $ | 873 | 0.8 | % | $ | 1,520 | 174.1 | % | ||||||||||||
| Interest and other expense |
(469 | ) | -0.1 | % | (111,844 | ) | -101.4 | % | 111,375 | -99.6 | % | |||||||||||||
| Loss from foreign currency remeasurement |
(8,354 | ) | -1.1 | % | (5,197 | ) | -4.7 | % | (3,157 | ) | 60.7 | % | ||||||||||||
| Total other income (expense) |
$ | (6,430 | ) | -0.9 | % | $ | (116,168 | ) | -105.3 | % | $ | 109,738 | -94.5 | % | ||||||||||
Total other income and expense for the three months ended May 31, 2011 netted to an expense of $6,430, or 0.9% of revenue as compared to an expense of $116,168, or 105.3% of revenue, for the three months ended May 31, 2010. The primary reason for the decrease is the recognition during the three months ended May 31, 2010 of approximately $111,000 related to a discount on convertible notes issued with warrants and accrued non-cash interest on the convertible note payable.
In addition to interest income and expense, gains and losses on asset dispositions and other miscellaneous income and expense is the effect of the currency exchange rate between the U.S. dollar and the South African Rand.
Comparison of Results of Operations for the Nine Months Ended May 31, 2011 and 2010.
The following table provides the revenue, cost of revenue and gross margin for the nine months ended May 31, 2011 and 2010 as a percentage of revenue. The trends suggested by this table may not be indicative of future operating results:
| For the Nine Months Ended May 31, | ||||||||||||||||||||||||
| 2011 | 2010 | Variance | ||||||||||||||||||||||
| Amount | % of Revenue |
Amount | % of Revenue |
Amount | % | |||||||||||||||||||
| Revenue |
$ | 1,605,930 | $ | 277,383 | $ | 1,328,547 | 479.0 | % | ||||||||||||||||
| Cost of revenue |
1,008,226 | 62.8 | % | 153,918 | 55.5 | % | 854,308 | 555.0 | % | |||||||||||||||
| Gross margin |
$ | 597,704 | 37.2 | % | $ | 123,465 | 44.5 | % | $ | 474,239 | 384.1 | % | ||||||||||||
Revenue
For the nine months ended May 31, 2011, revenue was $1,605,930, an increase of $1,328,547, or 479.0%, as compared to $277,383 for the nine months ended May 31, 2010. Components of revenue include approximately $1,151,000 from transaction fees, $209,000 from service charges, $178,000 from the sale of cards and security tokens, and $68,000 from interest and other revenue. The increase is due to the increased volume of active cards, the quantity of transactions and the gross dollar volume loaded to cards.
Our gross U.S. dollar volume loaded to cards was approximately $60.2 million and $6.6 million, respectively, for the nine months ended May 31, 2011 and 2010. The gross volume of funds loaded to cards during the nine months ended May 31, 2011 represents an increase of 812.1% as compared to the gross volume of funds loaded to cards during the nine months ended May 31, 2010.
For the nine months ended May 31, 2011, revenue from one client accounted for approximately $1.1 million, or 68.5% of revenue.
For the nine months ended May 31, 2010, revenue of $277,383 was comprised of approximately $124,000 of transaction fees, $74,000 from the sale of plastic cards and tokens, $70,000 from services charges and $9,000 of interest on transaction funds.
Cost of Revenue
For improved comparison of card- and transaction-related cost to revenue, certain costs are now presented as “Processing, Technical and Financial Expense” and are included in Operating Expense rather than as Cost of Revenue.
35
Table of Contents
The cost of revenue will generally correspond with the change in revenue.
| For the Nine Months Ended May 31, | ||||||||||||||||||||||||
| 2011 | 2010 | Variance | ||||||||||||||||||||||
| Amount | % of Revenue |
Amount | % of Revenue |
Amount | % | |||||||||||||||||||
| Cost of revenue: |
||||||||||||||||||||||||
| Fees |
$ | 787,416 | 49.0 | % | $ | 74,512 | 26.9 | % | $ | 712,904 | 956.8 | % | ||||||||||||
| Service charges |
129,379 | 8.1 | % | 41,867 | 15.1 | % | 87,512 | 209.0 | % | |||||||||||||||
| Cards, tokens and other costs |
91,431 | 5.7 | % | 37,539 | 13.5 | % | 53,892 | 143.6 | % | |||||||||||||||
| Total cost of revenue |
$ | 1,008,226 | 62.8 | % | $ | 153,918 | 55.5 | % | $ | 854,308 | 555.0 | % | ||||||||||||
For the nine months ended May 31, 2011, the cost of revenue was $1,008,226, an increase of $854,308, or 555.0%, as compared to $153,918 for the nine months ended May 31, 2010. Cost of revenue as a percentage of revenue was 62.8% for the nine months ended May 31, 2011 as compared to 55.5% for the nine months ended May 31, 2010.
Key to these increases is the number of issued and active cards, the quantity of transactions and the volume of funds loaded to the cards during the nine months ended May 31, 2011 as compared to the nine months ended May 31, 2010.
Gross Margin
The gross margin for the nine months ended May 31, 2011 and 2010 was $597,704, or 37.2% of revenue, and $123,465, or 44.5% of revenue, respectively, an increase of $474,239, or 384.1%. The gross margin for the nine months ended May 31, 2010 has been revised from a loss of $123,465 due to a reclassification of certain expenses from cost of revenue to operating expenses.
Operating Expenses
The following table presents a breakdown of our operating expenses:
| For the Nine Months Ended May 31, | ||||||||||||||||||||||||
| 2011 | 2010 | Variance | ||||||||||||||||||||||
| Amount | % of Revenue |
Amount | % of Revenue |
Amount | % of Revenue |
|||||||||||||||||||
| Operating expenses: |
||||||||||||||||||||||||
| Technical/financial fees |
$ | 1,015,858 | 63.3 | % | $ | 569,327 | 56.5 | % | $ | 446,531 | 78.4 | % | ||||||||||||
| Salaries and benefits |
1,105,161 | 68.8 | % | 1,320,668 | 131.0 | % | (215,507 | ) | -16.3 | % | ||||||||||||||
| Travel |
116,258 | 7.2 | % | 206,958 | 20.5 | % | (90,700 | ) | -43.8 | % | ||||||||||||||
| Consultants |
321,892 | 20.0 | % | 523,658 | 51.9 | % | (201,766 | ) | -38.5 | % | ||||||||||||||
| Depreciation/amortization |
214,878 | 13.4 | % | 214,682 | 21.3 | % | 196 | 0.1 | % | |||||||||||||||
| Other general/administrative |
238,312 | 14.8 | % | 216,644 | 21.5 | % | 21,668 | 10.0 | % | |||||||||||||||
| Total operating expenses |
$ | 3,012,359 | 187.6 | % | $ | 3,051,937 | 302.7 | % | $ | (39,578 | ) | -1.3 | % | |||||||||||
For the nine months ended May 31, 2011, total operating expense was $3,012,359, a decrease of $39,578, or 1.3%, as compared to $3,051,937 for the nine months ended May 31, 2010. Costs as a percentage of revenue were 187.6% for the nine months ended May 31, 2011 as compared to 302.7% for the nine months ended May 31, 2010.
Our operating expenses are classified in the following six categories:
Processing, Technical and Financial Expense – Processing, technical and financial expense consists primarily of costs related to the infrastructure needed process the card transactions, such as information technology consultants, the lease of the computer hosting facility, intrusion and fraud detection programs, sponsor bank and MasterCard fees and revenue sharing.
For the nine months ended May 31, 2011, processing, technical and financial expense was $1,015,858, an increase of $446,531, or 78.4%, as compared to $569,327 for the nine months ended May 31, 2010.
The increase of approximately $447,000 was primarily the result of increases of approximately $213,000 for computer consulting expense as we focused on improvements to the functionality of our processing platform, $131,000 for revenue sharing expense, $59,000 for MasterCard and sponsor bank fees expense, $56,000 for call center and hosting facility expense, $14,000 for GCC royalty fees and $5,000 for other expenses. These increases are offset by decreases of approximately $19,000 for GCC maintenance fee expense and $12,000 for monitoring software expense. We expect that certain of these expenses will increase as revenue increases, whereas other expenses may not.
36
Table of Contents
Salaries and Benefits Expense – Salaries and benefits expense includes costs related to employee salaries, health insurance and payroll taxes. Also included are certain non-cash expenses such as equity compensation and the value of services contributed (no compensation of any manner) by certain officers and/or directors.
For the nine months ended May 31, 2011, salaries and benefits expense was $1,105,161, a decrease of $215,507, or 16.3%, as compared to $1,320,668 for the nine months ended May 31, 2010.
The decrease was primarily due to decreased management salaries expense of approximately $178,000, $93,000 for equity-based compensation expense for the allocation of vested stock options, $55,000 for paid time off expense and $16,000 for employee benefits. Offsetting the decrease is an expense of $72,000 for contributed services as compared to no expense for contributed services during the nine months ended May 31, 2010, $18,000 for employee relocation expense, $17,000 for a pension plan payment, $12,000 for employer payroll taxes and $8,000 for temporary labor expense.
Travel Expense – Travel expense is primarily comprised of the cost of airfare for international travel along with associated lodging, vehicle rentals, meals and entertainment costs. For the nine months ended May 31, 2011, travel expense was $116,258, a decrease of $90,700, or 43.8%, as compared to $206,958 for the nine months ended May 31, 2010. The decrease of approximately $91,000 was the result of fewer international flights and other travel-related costs.
Professional and Consultant Expense – Professional and consultant expense consists primarily of legal fees, accounting fees and other consultant fees, as needed. For the nine months ended May 31, 2011, professional and consultant expense was $321,892, a decrease of $201,766, or 38.5%, as compared to $523,658 for the nine months ended May 31, 2010.
The decrease was primarily due to a decrease of approximately $276,000 of other consultant expense, of which $46,000 was equity-based. The decreased equity based expense is the result of the November 2010 settlement agreements with Mr. Michael Dodak and Mr. David Fann as the final expense related to these agreements was recognized during the fiscal quarter ended November 30, 2010. Offsetting the decrease are increases of approximately $38,000 for technology and market consultants, $33,000 for an investor relations consultant and $3,000 for other fees.
Depreciation and Amortization Expense – Depreciation and amortization expense relates to the GCC software license and various fixed assets.
Other Selling, General and Administrative Expense – Other selling, general and administrative expense consists primarily of communication costs, rent and utilities, and insurance.
For the nine months ended May 31, 2011, other selling, general and administrative expense was $238,312, an increase of $21,668, or 10.0%, as compared to $216,644 for the nine months ended May 31, 2010.
The increase was primarily due approximately $38,000 of rent expense due to the October 2010 lease of a house in South Africa and $6,000 of other rent expense. Offsetting the increase are decreases of approximately $9,000 for insurance expense, $12,000 for reduced bad debt expense and $1,000 for other expenses.
Other Income and Expense
In addition to interest income and expense, gains and losses on asset dispositions and other miscellaneous income and expense is the effect of the currency exchange rate between the U.S. dollar and the South African Rand.
Total other income and expense for the nine months ended May 31, 2011 netted to an expense of $1,607, or 0.1% of revenue, as compared to an expense of $340,890, or 122.9% of revenue, for the three months ended May 31, 2010.
37
Table of Contents
| For the Nine Months Ended May 31, | ||||||||||||||||||||||||
| 2011 | 2010 | Variance | ||||||||||||||||||||||
| Amount | % of Revenue |
Amount | % of Revenue |
Amount | % | |||||||||||||||||||
| Other income (expense): |
||||||||||||||||||||||||
| Interest and other income |
$ | 10,674 | 0.7 | % | $ | 4,803 | 1.7 | % | $ | 5,871 | 122.2 | % | ||||||||||||
| Beneficial conversion expense |
— | 0.0 | % | (166,667 | ) | -60.1 | % | 166,667 | -100.0 | % | ||||||||||||||
| Interest and other expense |
(634 | ) | 0.0 | % | (162,725 | ) | -58.7 | % | 162,091 | -99.6 | % | |||||||||||||
| Loss from foreign currency remeasurement |
(9,580 | ) | -0.6 | % | (16,301 | ) | -5.9 | % | 6,721 | -41.2 | % | |||||||||||||
| Loss from asset disposal |
(2,067 | ) | -0.1 | % | — | 0.0 | % | (2,067 | ) | 100.0 | % | |||||||||||||
| Total other income (expense): |
$ | (1,607 | ) | -0.1 | % | $ | (340,890 | ) | -122.9 | % | $ | 339,283 | -99.5 | % | ||||||||||
The decrease of $339,283 was primarily the result of a decrease of approximately $328,000 of non-cash interest expense associated with the beneficial conversion feature of the convertible note payable, accrued non-cash interest expense on a convertible note payable and a discount on convertible notes issued with warrants. Additionally, interest and other income increased approximately $6,000 and the loss from remeasurement decreased approximately $7,000. We recognized a loss from an asset disposal of approximately $2,000.
Loss from Discontinued Operations
During the nine months ended May 31, 2010, we recognized an expense of approximately $26,000 for a stock price indemnity agreement associated with our Atlas discontinued operations.
Liquidity and Capital Resources
As of May 31, 2011, we had cash available for operations of $641,211, current assets of $828,481 and current liabilities of $450,944.
Additionally, due to the increased volume of funds and transactions being processed, as per our agreement with our sponsor bank, the amount of restricted cash on deposit has increased from $35,022 as of August 31, 2010 to approximately $120,400 as of May 31, 2011.
As of August 31, 2010, we had cash available for operations of $332,399, current assets of $491,163 and current liabilities of $490,058.
Operating Activities
For the nine months ended May 31, 2011 and 2010, our operating activities resulted in a net cash outflow of $2,097,766 and $2,492,415, respectively. The net operating cash outflow of $2,097,766 for the nine months ended May 31, 2011 reflects a loss of $2,416,262 as a result of the following significant components:
| • | depreciation and amortization expense of $214,878; |
| • | adjustment for contributed services of $72,000; |
| • | equity-based compensation of $182,674, of which $171,300 is attributable to the Dodak and Fann Settlement and Release agreements and $11,374 is related to vested options; |
| • | an increase of $19,823 for the bad debt allowance; |
| • | an increase of $29,856 for various card transaction-related reserves; |
| • | an increase of $85,358 for restricted cash as per agreements with Mercantile Bank; |
| • | an increase of $54,223 for prepaid expenses; |
| • | an increase of $97,704 in accounts payable and other accrued liabilities; and |
| • | a decrease of $155,880 in amounts due to related parties. |
The net operating cash outflow of $2,492,415 for the nine months ended May 31, 2010 reflects a loss of $3,295,793 as a result of the following significant components:
| • | depreciation and amortization expense of $214,682; |
| • | equity-based compensation of $321,175; |
38
Table of Contents
| • | accretion of a non-cash beneficial conversion feature of $166,667 on a convertible note payable; |
| • | accretion of a discount of $78,546 on convertible notes payable; |
| • | an increase in the allowance for bad debt of $28,215; |
| • | non-cash interest expense of $83,334; |
| • | an increase in accounts receivable of $49,527; |
| • | an increase in prepaid and other assets of $24,331; |
| • | an increase of $63,938 in accounts payable and other accrued liabilities; |
| • | an increase in accrued payroll and benefits of $35,845; and |
| • | a decrease of $111,429 for the accrual for the stock price indemnity agreement. |
Investing Activities
Our investing activities resulted in a net cash outflow of $45,292 for the nine months ended May 31, 2011 as compared to a net cash outflow of $6,607 for the nine months ended May 31, 2010.
During the nine months ended May 31, 2011, we purchased a vehicle for $38,584 and various computer hardware and software for $6,708.
During the nine months ended May 31, 2010, replaced two computers and purchased office furniture.
Financing Activities
Our financing activities resulted in the sale of a total of 15,891,496 shares of stock for a cash inflow of $2,451,870, net of cash offering costs of $48,130, for the nine months ended May 31, 2011.
For the nine months ended May 31, 2010, our financing activities resulted in a cash inflow of $2,270,243, net of cash offering costs of $29,757. The Company sold 11,791,428 shares of common stock for net proceeds of $1,757,118 and issued $500,000 of convertible debt.
Presently, our revenue is not sufficient to meet our operating and capital expenses. There is doubt about our ability to continue as a going concern, as the continuation of our business is dependent upon successful roll out of our products and maintaining a break even or profitable level of operations. We have incurred operating losses since inception, and this is likely to continue through the fiscal year ending August 31, 2011.
We require funds to enable us to address our minimum current and ongoing expenses, continue with marketing and promotion activity connected with the development and marketing of our products and increase market share. We anticipate that our cash on hand and the revenue that we anticipate generating going forward from our operations may not be sufficient to satisfy all of our cash requirements as we continue to progress and expand. We estimate that we will require approximately $1 million to $1.25 million to carry out our business plan for the next fiscal year beginning September 1, 2011. Because we cannot anticipate when we will be able to generate revenue to such an extent that our operations are cash flow positive, we will need to raise additional funds to continue to develop our business, respond to competitive pressures and to respond to unanticipated requirements or expenses. If we are not able to generate significant revenues from the sale of our products, we will not be able to maintain our operations or achieve a profitable level of operations. We anticipate our net cash outflow over the next several months to average approximately $150,000 monthly.
Due to the uncertainty of our ability to meet our current operating and capital expenses, in their report on our audited annual financial statements for the fiscal year ended August 31, 2010, our independent auditors included an explanatory paragraph regarding concerns about our ability to continue as a going concern. Our financial statements contain additional note disclosures describing the circumstances that led to this disclosure by our independent auditors. There is doubt about our ability to continue as a going concern as the continuation and expansion of our business is dependent upon successful and sufficient market acceptance of our products, and, finally, achieving a profitable level of operations. The issuance of additional equity securities by us could result in a significant dilution in the equity interests of our current stockholders. Obtaining commercial loans, assuming those loans would be available, will increase our liabilities and future cash commitments.
39
Table of Contents
The financial requirements of our Company may be dependent upon the financial support through additional sales of our equity securities or the issuance of debt instruments. The issuance of additional equity securities by us may result in a significant dilution in the equity interests of our current shareholders. Should additional financing be needed, there is no assurance that we will be able to obtain further funds required for our continued operations or that additional financing will be available to us when needed or, if available, that it can be obtained on commercially reasonable terms. If we are not able to obtain the additional financing on a timely basis, we will not be able to meet our other obligations as they become due and we will be forced to scale down or perhaps even cease our operations. We do not currently have any plans to merge with another company, and we have not entered into any agreements or understandings for any such merger.
We can give no assurance that we will be successful in implementing any phase, all phases of the proposed business plan, or that we will be able to continue as a going concern.
Off Balance Sheet Arrangements
The Company presently does not have any off balance sheet arrangements.
Client Relations
Client service is currently provided by a third-party supplier, which interfaces with our in-house support team. In this way, our client service functions are scalable, multi-lingual and can be managed to handle one or multiple programs. We maintain detailed records of every sales contact, including source of inquiry, client needs, employment and income, if available.
Commitments and Obligations
The Company has the following commitments and obligations:
Consulting Services
As a condition to the October 2008 Sherington Agreement closing, Mr. Michael Dodak, a former FNDS3000 CEO, and Mr. David Fann, a former President of the Company, agreed that their employment agreements would be converted to Consulting Agreements effective December 5, 2008 for Mr. Dodak and February 1, 2009 for Mr. Fann. Each agreement was for a monthly fee of $10,000. However, in conjunction with other cost-cutting measures initiated by the Company during the last fiscal year, September 1, 2009 through August 31, 2010, and to contribute toward improving cash flow, Mr. Dodak and Mr. Fann agreed to defer a portion of their fees through September 30, 2010.
During September 2010, the Company paid a total of $8,500 toward the deferred amount. In early November, the Company entered into settlement agreements with both Mr. Dodak and Mr. Fann. The agreements stipulated an immediate payment of $30,000 to each, with a remaining value of $100,000 due to both to be paid in common stock of the Company. The Company recognized $200,000 of equity-based consulting expense and reduced the related combined liability reflected on its balance sheet of $301,000 to $200,000.
In November 2010, both consultants were issued cash payments of $30,000.
In December 2010, pursuant to the agreement, Mr. Fann was issued 571,429 shares of stock valued at $100,000.
Mr. Dodak agreed to the receipt of the $100,000 of stock in four tranches of $25,000. Per the terms of the agreement, the share price for the four tranches is to be calculated based on the lesser of $0.175 or the average trading price of the Company’s shares of common stock for the ten trading days prior to the date of the issuance.
The first tranche of 142,857 shares, valued at $0.175 per share, was issued January 4, 2011; the second tranche of 162,338 shares, valued at $0.154 per share, was issued February 1, 2011; the third tranche of 179,856 shares, valued at $0.139 per share, was issued March 7, 2011; and the fourth and final tranche of 166,667 shares will be valued at $0.15 per when issued.
40
Table of Contents
Leases
We currently have the following lease arrangements:
| • | For our office in Jacksonville, Florida, on August 1, 2009, we paid a deposit of $5,770 and entered into an 18-month lease agreement with a monthly expense of approximately $2,800. This rate was extended one month for January 2011. On February 1, 2011, we renewed the lease for one year at a monthly expense of $2,000 and will receive the 13th month at no cost. As February 1, 2011, because the amount of leased space was reduced, the deposit was also reduced by $1,590 to $4,180. For the nine months ended May 31, 2011, we recognized approximately $20,000 for lease expense for the corporate office. The remaining expense for this lease is approximately $18,000. |
| • | For our office in Johannesburg, South Africa, on April 1, 2009, we paid a deposit of approximately $17,500 and entered into a five-year lease agreement with a current monthly expense of approximately $7,200. The lease and other costs increase annually. For the nine months ended May 31, 2011, we recognized approximately $60,400 for lease and utilities expense. The remaining expense for this lease is approximately $258,000. |
| • | For our dedicated data hosting solution, which is located in a fully secured data center in South Africa, in October 2008, we entered into a three-year lease with a monthly expense of approximately $7,200. For the nine months ended May 31, 2011, we recognized approximately $130,000 for lease expense for the hosting facilities. The remaining expense for this lease is approximately $66,000. |
| • | We lease a house in South Africa. On October 1, 2010, we paid a deposit of approximately $4,350 and entered into a one-year lease with a monthly expense of approximately $4,700. For the nine months ended May 31, 2011, we recognized approximately $38,400 lease expense for the house. The remaining expense for this lease is approximately $19,000. |
Our approximate remaining expense for lease obligations under the current leases is as follows:
| Fiscal 2011 |
$ | 92,000 | ||
| Fiscal 2012 |
121,000 | |||
| Fiscal 2013 |
96,000 | |||
| Fiscal 2014 |
52,000 | |||
| Total |
$ | 361,000 | ||
Royalties
As part of the GCC Software License Agreement (the “License”) with World Processing, Ltd., royalties are to be paid at varying rates as various threshold quantities of transactions are achieved. These thresholds are to be considered in the aggregate with respect to all financial transactions that utilize the GCC software and will not be deemed an annual threshold or a threshold calculated on a per location basis. Accordingly, once royalties of $20,000 have been paid on the first million financial transactions, the Company will pay royalties of $60,000 for the next four million financial transactions; $50,000 for the next five million financial transactions; $200,000 for the next forty million transactions; and $2,500 for each million transactions thereafter. For the nine months ended May 31, 2011, the Company accrued approximately $16,000 for royalty expense. Since inception, the total royalty expense incurred is approximately $22,600.
Employment Agreements
On July 14, 2010, the Company and Joseph McGuire, its Chief Accounting Officer, entered into a revised employment agreement for a one-year term with a salary of $120,250.
On August 30, 2010, the Company and Robert Klein entered into a Contract of Employment whereby Mr. Klein agreed to serve as the Chief Executive Officer, South Africa commencing September 1, 2010 through December 31, 2011. The Company agreed to pay Mr. Klein an annual salary of $200,000 as well as to provide Mr. Klein with standard benefits.
41
Table of Contents
CRITICAL ACCOUNTING POLICIES
Our financial statements have been prepared in accordance with accounting principles generally accepted in the United States of America. The preparation of these financial statements requires us to make significant estimates and judgments that affect the reported amounts of assets, liabilities, revenue, and expenses and related disclosure of contingent assets and liabilities. We evaluate estimates, including those related to stock based compensation and revenue recognition on an ongoing basis. We base our estimates on historical experience and on various other assumptions that are believed to be reasonable under the circumstances, the results of which form the basis for making judgments about the carrying values of assets, liabilities and equity, that are not readily apparent from other sources. Actual results may differ from these estimates under different assumptions or conditions.
We believe the following are the critical accounting policies used in the preparation of our financial statements:
Revenue Recognition and Deferred Revenue
Revenue consists primarily of fees generated through the electronic processing of payment transactions and related services, and are recognized as revenue in the period the transactions are processed or when the related services are performed.
Our revenue is derived from the following:
| • | Initiation fees from sales of our prepaid cards. |
| • | Transaction fees from the use and loading of funds for the prepaid cards. |
| • | Maintenance fees for continued activation. |
| • | Financial float fees, which arise from cash obtained with the instant load of cash and convenience of prepaid cards before the funds are used. |
Revenues derived from electronic processing of the prepaid card transactions are recognized immediately as revenue and are reported gross of amounts paid to sponsor banks as well as interchange and assessments paid to credit card associations such as MasterCard. Our receivables arise from the initial sale of the plastic card and the security tokens, which are invoiced with net 30-day terms.
Our revenue recognition policy for fees and services arising from our products is that we recognize revenue when, (1) persuasive evidence of an arrangement exists; (2) delivery has occurred; (3) our price to the buyer is fixed or determinable; and (4) collectability of the receivables is reasonably assured. More specifically, issuance fee revenue for our prepaid cards is recognized when shipped, transaction fee revenue is recognized when the transaction occurs and posts, and maintenance and financial float fee revenue are recognized when the products are used. Consulting fees are recognized as services are performed and per contractual terms with the client. Costs of revenue, including the cost of printing the cards, are recorded at the time revenue is recognized.
Accounts Receivable and Allowance for Doubtful Accounts
Our accounts receivable arise from the sale of cards and security tokens and for application and set-up fees. Our invoice terms are net 30 days and accounts are determined to be past due if payment is not made in accordance with the terms of our contracts. Receivables are written off when they are determined to be uncollectible. Ongoing credit evaluations are performed for all of our clients.
We evaluate the allowance for doubtful accounts on a regular basis for adequacy. The level of the allowance account and related bad debts are based upon our review of the collectability of our receivables in light of historical experience, adverse situations that may affect our clients’ ability to repay, estimated value of any underlying collateral and prevailing economic conditions. We use the direct write-off method for accounts receivable that are determined to be uncollectable and believe there is no material difference in this method from the allowance method. This evaluation is inherently subjective, as it requires estimates that are susceptible to significant revision as more information becomes available.
42
Table of Contents
As of May 31, 2011, our net accounts receivable was $6,795. Our gross receivables totaled $26,618 and we have recognized an allowance of $19,823 for overdrawn cardholder accounts.
Reserves for Uncollectible Overdrawn Accounts, Chargebacks and Fraudulent Transactions
Cardholder accounts may become overdrawn if service fees or other charges exceed the available funds in a cardholder’s account; merchants may issue chargebacks or fraudulent transactions may occur. Due to this exposure, we have established a cash reserve, which is a component of restricted cash.
As of May 31, 2011, we have reserved approximately $20,000 for overdrawn cardholder accounts and approximately $50,000 for potential chargebacks and the risk of fraudulent activity.
Property and Equipment
Equipment and improvements are stated at cost less accumulated depreciation and amortization. Depreciation and amortization of equipment and improvements are provided over the estimated useful lives of the assets, or the related lease terms if shorter, by the straight-line method. Useful lives range as follows:
| Category |
Useful Lives | |
| Computers and networks |
3 years | |
| Machinery and equipment |
5-7 years | |
| Furniture and fixtures |
5-7 years | |
| Office equipment |
3-10 years | |
| Leasehold improvements |
Lesser of lease term or useful life of asset |
Major additions will be capitalized, while minor additions, maintenance and repairs, which do not extend the useful life of an asset, will be expensed as incurred. Upon disposition, the cost and related accumulated depreciation are removed from the accounts and the resulting gain or loss is reflected in current operations.
Long-Lived Assets and Impairment
The Company reviews long-lived assets for impairment whenever events or changes in circumstances indicate that the carrying value of a long-lived asset may not be recoverable. The Company periodically evaluates whether events and circumstances have occurred that may warrant revision of the estimated useful lives of its long-lived assets or whether the remaining balance of long-lived assets should be evaluated for possible impairment.
Intangible assets that are determined to have definite lives are amortized over their useful lives and are measured for impairment only when events or circumstances indicate the carrying value may be impaired. Intangible assets with indefinite lives are not amortized but instead are measured for impairment at least annually in our fourth fiscal quarter, or when events indicate that impairment exists.
We have a capitalized intangible asset, which is the purchase of the software license from World Processing, Ltd., the parent company GCC, and associated fees relative to its modification to meet our needs. In recognition of the right to receive future cash flows related to transactions of the asset, we are amortizing this value over seven years, as it is anticipated that the software would continue to evolve with our needs.
We review intangibles at least annually for impairment as events or changes in circumstances indicate that the carrying amount of such assets may not be recoverable. If the carrying amounts of the assets exceed their respective fair values, additional impairment tests are performed to measure the amount of the impairment loss, if any. If an asset is deemed impaired, the impairment loss is recognized in current earnings. No impairment loss was recognized for the GCC software license for the years ended August 31, 2010 and 2009 or for the nine months ended May 31, 2011.
43
Table of Contents
Equity - Based Compensation
The Company has equity-based compensation plans, which are designed to retain directors, executives and selected employees and consultants and to reward them for making major contributions to the success of the Company.
SEC Staff Accounting Bulletin No. 110, “Share Based Payment,” allows companies to continue to use the simplified method to estimate the expected term of stock options under certain circumstances. The simplified method for estimating the expected life uses the mid-point between the vesting term and the contractual term of the stock option. The Company has analyzed the circumstances in which the simplified method is allowed and has determined that utilizing the simplified method for stock options granted is appropriate.
Fair value of the stock options is estimated using a Black-Scholes option pricing formula. The variables used in the option pricing formula for each grant are determined at the time of grant as follows: (1) volatility is based on the weekly closing price of the Company’s stock over a look-back period of time that approximates the expected option life; (2) risk-free interest rates are based on the yield of U.S. Treasury Strips as published in the Wall Street Journal or provided by a third-party on the date of the grant for the expected option life; and (3) expected option life represents the period of time the options are expected to be outstanding. Periodically the factors influencing the expected life of option grants are reviewed and may be modified.
Equity instruments issued for services are based on the fair value of the consideration received or the fair value of the equity instruments, whichever is more reliably measurable. Prior to February 2009, the quoted market price was a basis for the fair value of the common stock. Beginning in February 2009, significant amounts of common stock were issued in exchange for cash, the value of which was used to determine the fair value of the shares issued for services at or near the time of these issuances for cash. However, as per the terms of the October 2010 Commitment Agreement between the Company and Sherington, sales of our common stock for the final three tranches of this agreement were to be valued at the lesser of (a) USD $0.175 or (b) the average trading price of the stock for the 10 trading days prior to the closing date of the applicable tranche closing. Based on these terms, the price of our common stock for the January 2011 tranche was $0.154, the price for the March tranche was $0.139 and for the fourth and final tranche in May 2011, the price per share was $0.15.
Determining the appropriate fair value model and calculating the fair value of share-based payment awards requires the input of highly subjective assumptions, including the expected life of the share-based payment awards and stock price volatility. The assumptions used in calculating the fair value of share-based payment awards represent management’s best estimates, but these estimates involve inherent uncertainties and the application of management judgment. As a result, if factors change and we use different assumptions, our equity-based compensation expense could be materially different in the future. In addition, we are required to estimate the expected forfeiture rate and only recognize expense for those shares expected to vest. If our actual forfeiture rate is materially different from our estimate, the stock-based compensation expense could be significantly different from what we have recognized in the current period.
Foreign Currency Transactions, Translation and Remeasurement
The financial position and results of operations of the FNDS3000 operations are measured using the parent’s currency, the U.S. dollar, as the functional currency; however, the original books and records are maintained in the South African Rand. Therefore, exchange rate gains and losses are considered to be “transaction” gains and losses.
Transaction gains and losses are a result of the effect of exchange rate changes on transactions denominated in currencies other than the functional currency. Gains and losses on those foreign currency transactions are generally included in determining net income/(loss) for the period in which exchange rates change unless the transaction hedges a foreign currency commitment or a net investment in a foreign entity. Inter-company transactions of a long-term investment nature are considered part of a parent’s net investment and hence do not give rise to gains or losses. Assets and liabilities of these operations are translated at the exchange rate in effect at the end of the reporting period. Statement of operations accounts, with the exception of amortized assets or liabilities are translated at the average exchange rate during the year.
44
Table of Contents
Fluctuations from the beginning to the end of any given reporting period result in the re-measurement of our foreign currency-denominated cash, receivables and payables, and generate currency transaction gains or losses that impact our non-operating income and expense levels in the respective period are reported in other income/(expense), net, in our condensed consolidated financial statements.
The Company has recognized a translation and remeasurement loss of $8,354 and $9,580, respectively, for the three and nine months ended May 31, 2011.
Contractual Obligations and Commitments
| Payments due by Period | ||||||||||||||||||||
| Total | Less than 1 year |
1-3 years | 3-5 years | More than 5 years |
||||||||||||||||
| Capital Lease Obligations |
$ | — | $ | — | $ | — | $ | — | $ | — | ||||||||||
| Operating Leases |
$ | 361,134 | $ | 190,997 | $ | 170,137 | $ | — | $ | — | ||||||||||
| Purchase Obligations |
$ | — | $ | — | $ | — | $ | — | $ | — | ||||||||||
| Other Long-Term Liabilities Reflected on the Registrant’s |
||||||||||||||||||||
| Balance Sheet under GAAP |
$ | — | $ | — | $ | — | $ | — | $ | — | ||||||||||
| Total |
$ | 361,134 | $ | 190,997 | $ | 170,137 | $ | — | $ | — | ||||||||||
| ITEM 3. | QUANTITATIVE AND QUALITATIVE DISCLOSURES ABOUT MARKET RISK |
We are a smaller reporting company as defined by Rule 12b-2 of the Securities Exchange Act of 1934 and, as such, are not required to provide the information under this item.
| ITEM 4. | CONTROLS AND PROCEDURES |
(a) Evaluation of Disclosure Controls and Procedures
As of May 31, 2011, the Company’s management evaluated, with the participation of its principal executive officer and its principal financial officer, the effectiveness of the Company’s disclosure controls and procedures, as defined in Rules 13a-15(e) and 15d-15(e) of the Securities Exchange Act of 1934 (the “Exchange Act”). Based on that evaluation, the Company’s principal executive officer and its principal financial officer concluded that the Company’s disclosure controls and procedures were adequate as of May 31, 2011 to ensure that information required to be disclosed in reports filed or submitted by the Company under the Exchange Act is recorded, processed, summarized and reported, within the time periods specified in the SEC’s rules and forms.
(a) Changes in Internal Controls
There were no changes in the Company’s internal control over financial reporting that occurred during the Company’s most recent fiscal quarter ended May 31, 2011 that materially affected, or are reasonably likely to materially affect the Company’s internal control over financial reporting.
| ITEM 1. | LEGAL PROCEEDINGS |
As of May 31, 2011, we know of no material, existing or pending legal proceedings against our Company.
| ITEM 1A. | RISK FACTORS |
We are a smaller reporting company as defined by Rule 12b-2 of the Securities Exchange Act of 1934 and, as such, are not required to provide the information under this item, however, a detailed discussion of risk factors can be found within the Form 10-K for the year ended August 31, 2010 of FNDS3000 Corp which was filed with the SEC on November 29, 2010.
45
Table of Contents
| ITEM 2. | UNREGISTERED SALES OF EQUITY SECURITIES AND USE OF PROCEEDS |
March 2011 Financing - On March 7, 2011, to obtain funding for the development of the business, we sold 3,592,843 shares of Common Stock, $0.001 par value (the “Sherington March 2011 Shares”) and related common stock purchase warrants to acquire 3,592,843 shares of common stock (the “Sherington March 2011 Warrants”) at an exercise price of $0.278 to Sherington Holdings, LLC at a per share purchase price of $0.139 representing gross proceeds of approximately $500,000 as more fully detailed below. This funding was provided pursuant to the Commitment Agreement dated October 19, 2010 whereby the Company agreed to sell and Sherington agreed to commit to purchase a prescribed pro rata portion of common stock of the Company in a private placement. The Company expects to offer shares of the Company’s Common Stock in four tranches, the first tranche closed on October 19, 2010, the second tranche closed on January 24, 2011, and the third closed on March 7, 2011 and one additional tranche to generate proceeds of $500,000 is to close in July 2011. Raymond Goldsmith, the Chairman, Chief Executive Officer and President of the Company, is also the Chairman and CEO of Sherington Holdings, LLC, which is a private investment company and the principal shareholder of the Company.
The Sherington March 2011 Warrant is exercisable for a period of two years from the date of issuance at an initial exercise price of $0.278 per share. The exercise price of the Sherington March 2011 Warrant is subject to full ratchet and anti-dilution adjustment for subsequent lower price issuances by the Company, as well as customary adjustments, provisions for stock splits, stock dividends, recapitalizations and the like.
Additionally, we issued to Sherington a Seventh Amended and Restated Warrant (the “Seventh Warrant”), amending the number of shares that Sherington is entitled to from 13,156,920 shares to 14,553,891 shares and also recognizing an increased interest in the Company from 57.42% to 59.87%. The Seventh Warrant provides that Sherington is entitled to purchase from the Company an aggregate of 14,553,891 shares of Common Stock of the Company at a price equal to $0.139 per share through December 31, 2013. Notwithstanding the foregoing, the Seventh Warrant shall only be exercisable so that Sherington may maintain its percentage interest in the Company of approximately 59.87% and is only exercisable by Sherington if and when there has occurred a full or partial exercise of any derivative securities of the Company outstanding as of July 1, 2009 (but excluding the securities held by Sherington), the 4,000,000 warrants issued to Bank Julius Baer & Co. Ltd. and the 1,000,000 warrants issued to Mr. Besuchet. The exercise price of the Seventh Warrant is subject to full ratchet and anti-dilution adjustment for subsequent lower price issuances by the Company, as well as customary adjustments, provisions for stock splits, stock dividends, recapitalizations and the like.
On March 7, 2011, the Company and Sherington entered into Amendment No. 8 (the “Eighth Amendment”) to the certain Registration Rights Agreement whereby the Company expanded the definition of Shares (as defined in the Sixth Amendment) to include, among other things, the Sherington March 2011 Shares and the shares issuable upon the exercise of the Sherington March 2011 Warrant.
May 2011 Financing with Sherington - On May 12, 2011, FNDS3000 sold 3,333,334 shares of Common Stock, $0.001 par value (the “Sherington May 2011 Shares”) and related common stock purchase warrants to acquire 3,333,334 shares of common stock (the “Sherington May 2011 Warrants”) at an exercise price of $0.30 to Sherington at a per share purchase price of $0.15 representing gross proceeds of $500,000 as more fully detailed below. This funding was provided pursuant to the Commitment Agreement dated October 19, 2010 whereby the Company agreed to sell and Sherington agreed to commit to purchase a prescribed pro rata portion of common stock of the Company in a private placement. The Company offered shares of the Company’s Common Stock in four tranches, the first tranche closed on October 19, 2010, the second tranche closed on January 24, 2011, and the third closed on March 7, 2011. The fourth and final tranche for $500,000 closed on May 12, 2011. Raymond Goldsmith, the Chairman, Chief Executive Officer and President of the Company, is also the Chairman and CEO of Sherington Holdings, LLC, which is a private investment company and the principal shareholder of the Company.
The Sherington May 2011 Warrant is exercisable for a period of two years from the date of issuance at an initial exercise price of $0.30 per share. The exercise price of the Sherington May 2011 Warrant is subject to full ratchet and anti-dilution adjustment for subsequent lower price issuances by the Company, as well as customary adjustments, provisions for stock splits, stock dividends, recapitalizations and the like.
46
Table of Contents
Further, the Company issued to Sherington a Eighth Amended and Restated Warrant (the “Eighth Warrant”), amending the number of shares that Sherington is entitled to from 14,553,891 shares to 15,838,768 shares. The Eighth Warrant provides that Sherington is entitled to purchase from the Company an aggregate of 15,838,768 shares of Common Stock of the Company at a price equal to $0.139 per share through December 31, 2013. Notwithstanding the foregoing, the Eighth Warrant is only exercisable by Sherington if and when there has occurred a full or partial exercise of any derivative securities of the Company outstanding as of July 1, 2009 (but excluding the securities held by Sherington), the 4,000,000 warrants issued to Bank Julius Baer & Co. Ltd. and the 1,000,000 warrants issued to Mr. Besuchet (collectively, the “Limited Derivative Securities”). Following the full or partial exercise of the Limited Derivative Securities, Sherington may only exercise the Eight Warrant so that Sherington may maintain a percentage ownership in the Company’s shares of common stock of approximately 61%. The exercise price of the Eighth Warrant is subject to full ratchet and anti-dilution adjustment for subsequent lower price issuances by the Company, as well as customary adjustments, provisions for stock splits, stock dividends, recapitalizations and the like.
On May 12, 2011, the Company and Sherington entered into Amendment No. 9 (the “Ninth Amendment”) to the certain Registration Rights Agreement whereby the Company expanded the definition of Shares (as defined in the Sixth Amendment) to include, among other things, the Sherington May 2011 Shares and the shares issuable upon the exercise of the Sherington May 2011 Warrant.
The securities were offered and sold to Sherington in a private placement transaction made in reliance upon exemptions from registration pursuant to Section 4(2) under the Securities Act of 1933 and Rule 506 promulgated under Regulation D thereunder. Sherington is an accredited investor as defined in Rule 501 of Regulation D promulgated under the Securities Act of 1933.
| ITEM 3. | DEFAULTS UPON SENIOR SECURITIES |
None.
| ITEM 4. | (REMOVED AND RESERVED.) |
| ITEM 5. | OTHER INFORMATION |
None.
| ITEM 6. | EXHIBITS |
| Exhibit Number |
Exhibit Description | |
| 4.1 | Private Placement Subscription Agreement by and between FNDS3000 Corp and Sherington Holdings, LLC dated March 7, 2011 (1) | |
| 4.2 | Sixth Amended and Restated Warrant to Purchase Common Stock issued to Sherington Holdings, LLC dated March 7, 2011 (1) | |
| 4.3 | Form of Warrant issued on March 7, 2011 (1) | |
| 4.4 | Seventh Amendment to the Registration Rights Agreement, dated March 7, 2011, by and between FNDS3000 Corp and Sherington Holdings, LLC (1) | |
| 4.5 | Commitment Agreement by and between FNDS3000 Corp and Sherington Holdings, LLC, dated October 19, 2010 (1) | |
47
Table of Contents
| 4.6 | Private Placement Subscription Agreement by and between FNDS3000 Corp and Sherington Holdings, LLC dated May 12, 2011 (2) | |
| 4.7 | Seventh Amended and Restated Warrant to Purchase Common Stock issued to Sherington Holdings, LLC dated May 12, 2011 (2) | |
| 4.8 | Form of Warrant issued on May 12, 2011 (2) | |
| 4.9 | Eighth Amendment to the Registration Rights Agreement, dated May 12, 2011, by and between FNDS3000 Corp and Sherington Holdings, LLC (2) | |
| 10.1 | Contract of Employment entered into by and between FNDS3000 Corp and Joseph F. McGuire dated July 15, 2011 (filed herewith) | |
| 31.1 | Certification of the Chief Executive Officer of FNDS3000 Corp pursuant to Section 302 of the Sarbanes-Oxley Act of 2002 (filed herewith) | |
| 31.2 | Certification of the Chief Accounting Officer of FNDS3000 Corp pursuant to Section 302 of the Sarbanes-Oxley Act of 2002 (filed herewith) | |
| 32.1 | Certification of the Chief Executive Officer of FNDS3000 Corp pursuant to 18 U.S.C. Section 1350, As Adopted Pursuant to Section 906 of the Sarbanes-Oxley Act of 2002 (filed herewith) | |
| 32.2 | Certification of the Chief Accounting Officer of FNDS3000 Corp pursuant to 18 U.S.C. Section 1350, As Adopted Pursuant to Section 906 of the Sarbanes-Oxley Act of 2002 (filed herewith) | |
| (1) | Incorporated by reference to the Form 8K Current Report filed with the Securities and Exchange Commission on March 10, 2011 |
| (2) | Incorporated by reference to the Form 8K Current Report filed with the Securities and Exchange Commission on May 17, 2011 |
48
Table of Contents
Pursuant to the requirements of the Securities Exchange Act of 1934, the registrant has duly caused this report to be signed on its behalf by the undersigned thereunto duly authorized.
| By: | /s/ Raymond L. Goldsmith | |
| Name: | Raymond L. Goldsmith | |
| Title: | Chief Executive Officer (Principal Executive Officer) | |
| Date: | July 15, 2011 | |
| By: | /s/ Joseph F. McGuire | |
| Name: | Joseph F. McGuire | |
| Title: | Chief Accounting Officer (Principal Financial Officer) | |
| Date: | July 15, 2011 | |
49