Attached files
| file | filename |
|---|---|
| EX-99.1 - EX-99.1 - CONOCOPHILLIPS | h83473exv99w1.htm |
| 8-K - FORM 8-K - CONOCOPHILLIPS | h83473e8vk.htm |
Exhibit
99.2
| Creating Two Leading Energy Companies Analyst Meeting July 14, 2011 |
| 1 FOR THE PURPOSES OF THE "SAFE HARBOR" PROVISIONS OF THE PRIVATE SECURITIES LITIGATION REFORM ACT OF 1995 Cautionary Statement The following presentation includes forward-looking statements. These statements relate to future events, such as anticipated revenues, earnings, business strategies, competitive position or other aspects of our operations or operating results. Actual outcomes and results may differ materially from what is expressed or forecast in such forward-looking statements. These statements are not guarantees of future performance and involve certain risks, uncertainties and assumptions that are difficult to predict such as oil and gas prices; refining and marketing margins; operational hazards and drilling risks; potential failure to achieve, and potential delays in achieving expected reserves or production levels from existing and future oil and gas development projects; unsuccessful exploratory activities; unexpected cost increases or technical difficulties in constructing, maintaining or modifying company facilities; international monetary conditions and exchange controls; potential liability for remedial actions under existing or future environmental regulations or from pending or future litigation; limited access to capital or significantly higher cost of capital related to illiquidity or uncertainty in the domestic or international financial markets; general domestic and international economic and political conditions, as well as changes in tax, environmental and other laws applicable to ConocoPhillips' business and other economic, business, competitive and/or regulatory factors affecting ConocoPhillips' business generally as set forth in ConocoPhillips' filings with the Securities and Exchange Commission (SEC). |
| 2 Historical Strategy Key Premises Integration creates value Scale and scope needed to compete Growth in hydrocarbon demand Resource capture will be more difficult and expensive Execution Positioned each business line to compete effectively E&P, R&M, Midstream and Chemicals Quality assets - but portfolio optimization needed M&A integration and cost synergies captured Led to significant value creation |
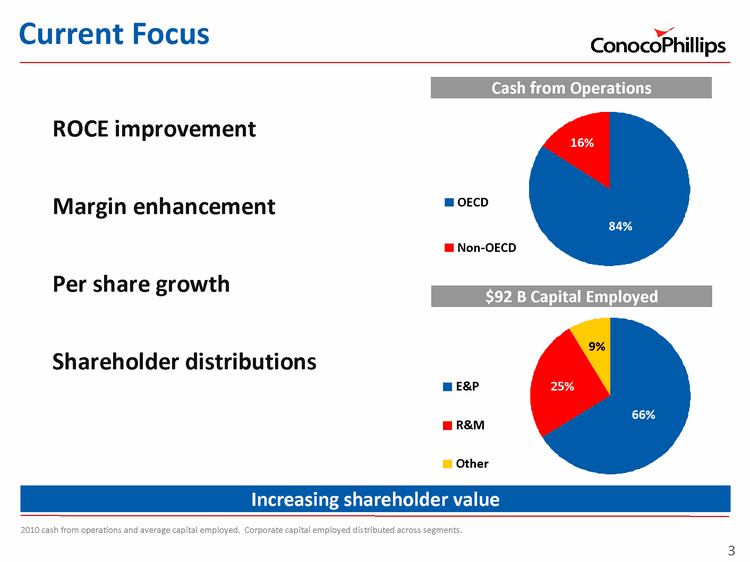
| 3 Cash from Operations $92 B Capital Employed ROCE improvement Margin enhancement Per share growth Shareholder distributions Current Focus Increasing shareholder value 2010 cash from operations and average capital employed. Corporate capital employed distributed across segments. 16% 84% OECD Non-OECD 66% 9% 25% E&P R&M Other |
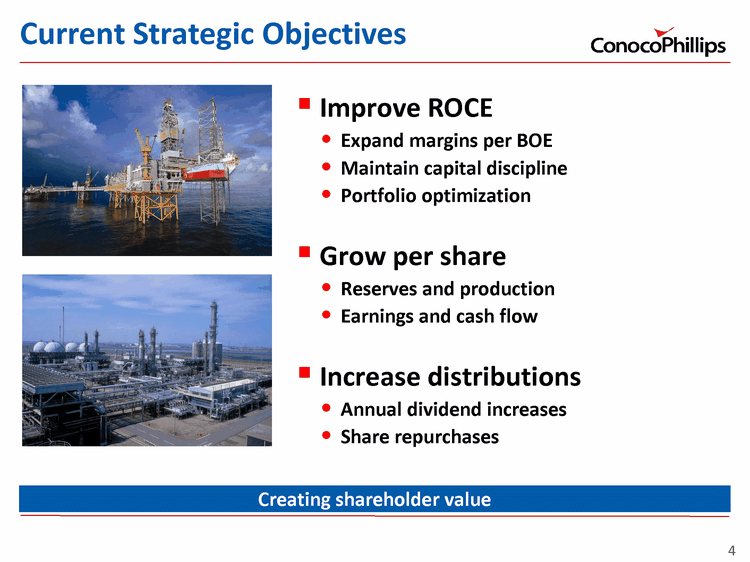
| 4 Current Strategic Objectives Improve ROCE Expand margins per BOE Maintain capital discipline Portfolio optimization Grow per share Reserves and production Earnings and cash flow Increase distributions Annual dividend increases Share repurchases Creating shareholder value |
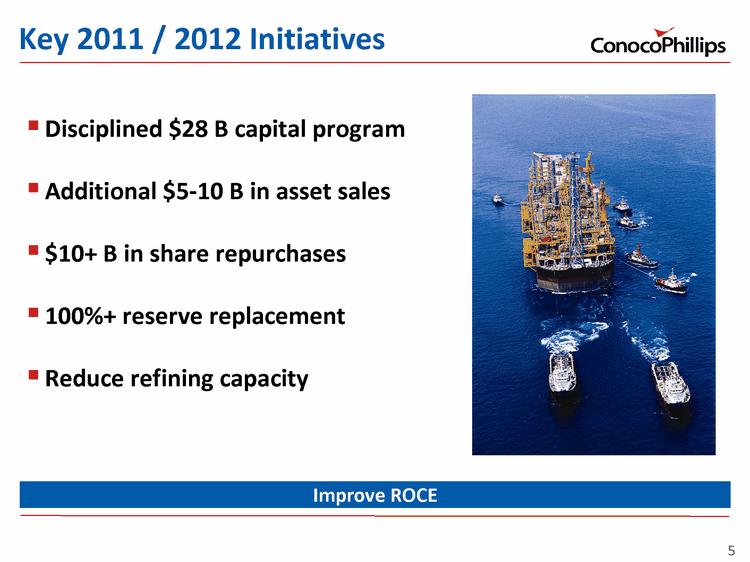
| 5 Key 2011 / 2012 Initiatives Disciplined $28 B capital program Additional $5-10 B in asset sales $10+ B in share repurchases 100%+ reserve replacement Reduce refining capacity Improve ROCE |
| 6 Strategy Assessment Integrated Strategy has been effective Increased reserves and production Generated competitive shareholder returns Environment has changed Downstream capability not key to resource access Resource Nationalism and NOC competition Movement to "service" agreements Value of IOC assets not reflected in equity value Transparency and potential of businesses not as clear as pure plays Increasingly difficult to create differential value to larger Integrateds Emphasis on additional volumes not always value creating Continually testing and assessing execution of strategy |
| 7 Transaction Summary Pursuing tax free spin of Downstream business New independent pure play publicly-held Downstream company ConocoPhillips becomes leading pure play E&P company Expect transaction completion in first half 2012 Creates two strong independent companies |
| 8 Strategic Rationale Create Two Profitable and Independent Companies E&P Strategy unchanged Downstream given opportunity to add value through portfolio optimization Greatest opportunity to create differential value Independent but consistent strategies Both companies continue to benefit from size and scale Both companies to have strong financial flexibility Transparency of pure play over integrated business model Management focus Ability to attract and retain talent |
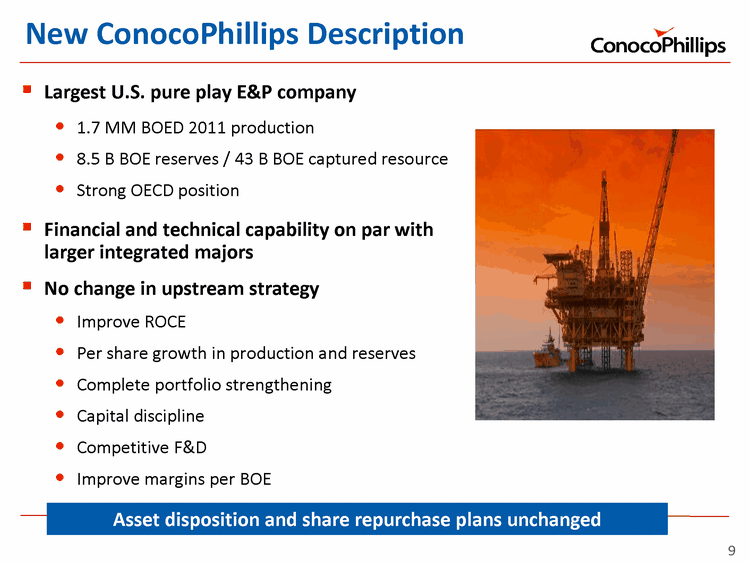
| 9 New ConocoPhillips Description Largest U.S. pure play E&P company 1.7 MM BOED 2011 production 8.5 B BOE reserves / 43 B BOE captured resource Strong OECD position Financial and technical capability on par with larger integrated majors No change in upstream strategy Improve ROCE Per share growth in production and reserves Complete portfolio strengthening Capital discipline Competitive F&D Improve margins per BOE Insert Upstream Picture Asset disposition and share repurchase plans unchanged |
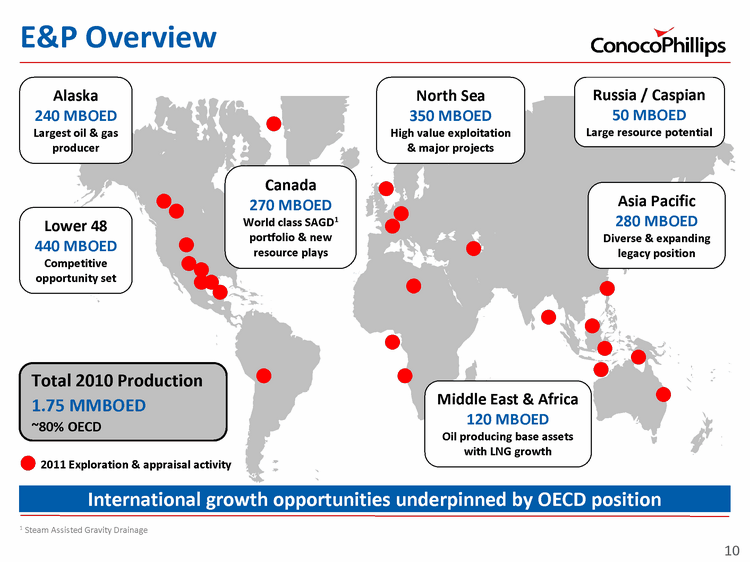
| 10 Total 2010 Production 1.75 MMBOED ~80% OECD E&P Overview Lower 48 440 MBOED Competitive opportunity set 2011 Exploration & appraisal activity International growth opportunities underpinned by OECD position Canada 270 MBOED World class SAGD1 portfolio & new resource plays North Sea 350 MBOED High value exploitation & major projects Alaska 240 MBOED Largest oil & gas producer Russia / Caspian 50 MBOED Large resource potential 1 Steam Assisted Gravity Drainage Middle East & Africa 120 MBOED Oil producing base assets with LNG growth Asia Pacific 280 MBOED Diverse & expanding legacy position |
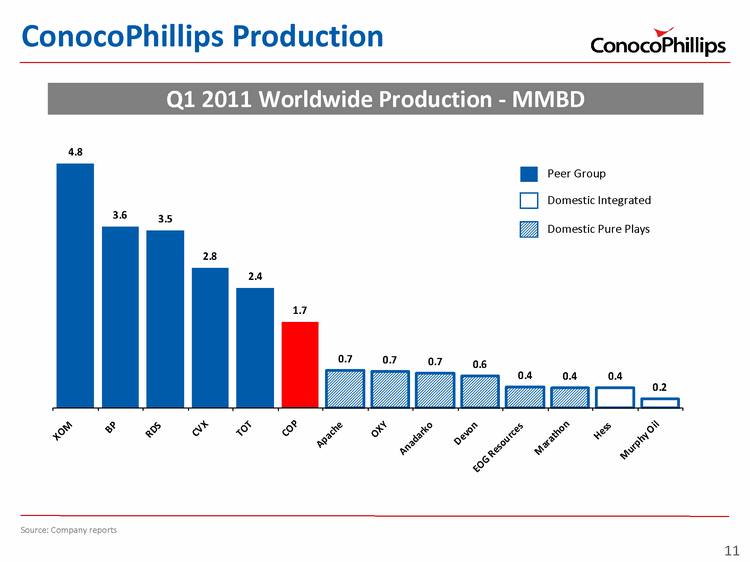
| 11 Peer Group XOM 4.82 BP 3.578 RDS 3.504 CVX 2.76 TOT 2.371 COP 1.702 Apache 0.732 OXY 0.73 Anadarko 0.69 Devon 0.63 EOG Resources 0.409 Marathon 0.4 Hess 0.399 Murphy Oil 0.182 ConocoPhillips Production Q1 2011 Worldwide Production - MMBD Peer Group Domestic Integrated Domestic Pure Plays Source: Company reports |
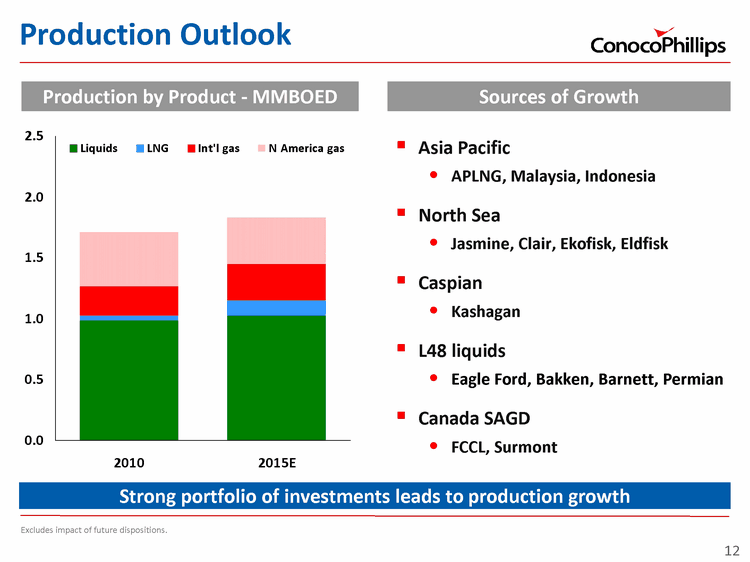
| 12 Production Outlook Production by Product - MMBOED Total - Prod 2010 2011E 2012E 2013E 2014E 2015E 2016E 2017E 2018E 2019E 2020E Sycrude 12 0 0 0 0 0 0 0 0 0 0 Bitumen 60 55 65 74 85 114 158 175 201 224 251 Crude 763 722 699 730 738 762 756 757 770 754 782 NGL 150 144 146 152 149 146 144 141 138 134 132 Liquids 984 922 910 956 971 1023 1058 1073 1109 1112 1166 LNG 42 89 92 90 93 126 184 209 205 182 184 Int'l gas 240 251 251 268 279 301 270 285 298 324 339 N America gas 447 417 393 400 391 380 374 372 362 385 395 Total 1751 1678 1646 1713 1734 1830 1886 1939 1974 2003 2084 Sources of Growth Excludes impact of future dispositions. Strong portfolio of investments leads to production growth Asia Pacific APLNG, Malaysia, Indonesia North Sea Jasmine, Clair, Ekofisk, Eldfisk Caspian Kashagan L48 liquids Eagle Ford, Bakken, Barnett, Permian Canada SAGD FCCL, Surmont |
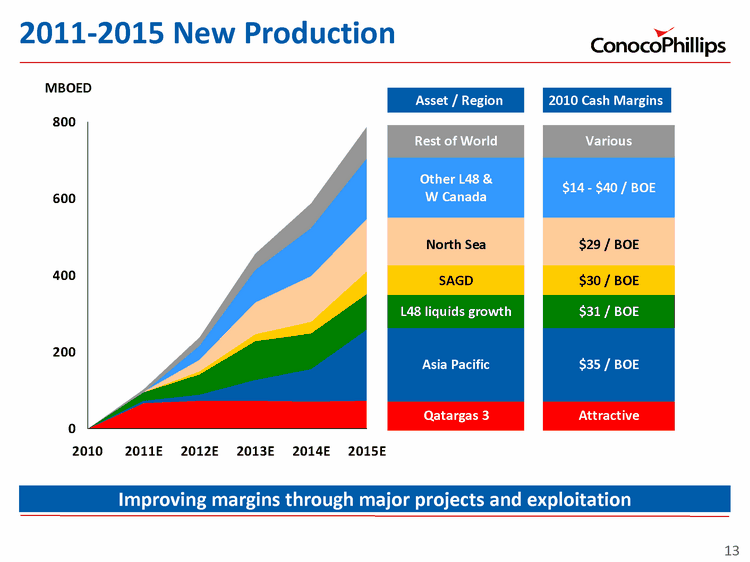
| 13 2011-2015 New Production MBOED Improving margins through major projects and exploitation Exploitation and Major Projects - MBOED 2010 2011E 2012E 2013E 2014E 2015E Qatargas 3 0 67 72 72 71 73 Asia Pacific 0 6 16 55 85 185 L48 shale 0 21 54 101 93 94 SAGD 0 1 8 18 29 58 North Sea 0 1 30 84 120 137 L48/WCG 0 -1 37 85 126 158 Other 0 8 22 42 64 82 Exploration 0 0 0 3 4 7 Total 0 103 238 460 592 793 Rest of World Other L48 & W Canada North Sea SAGD L48 liquids growth Asia Pacific Qatargas 3 Attractive $35 / BOE $31 / BOE $30 / BOE $29 / BOE $14 - $40 / BOE Various Asset / Region 2010 Cash Margins |
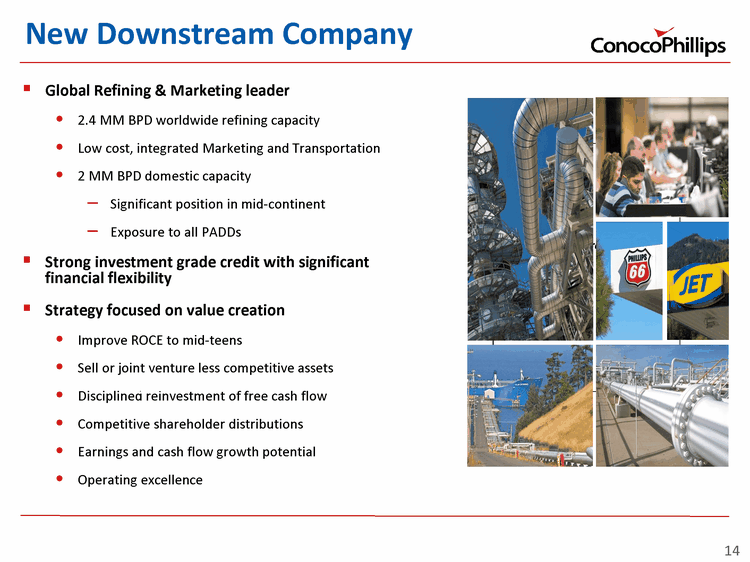
| 14 New Downstream Company Global Refining & Marketing leader 2.4 MM BPD worldwide refining capacity Low cost, integrated Marketing and Transportation 2 MM BPD domestic capacity Significant position in mid-continent Exposure to all PADDs Strong investment grade credit with significant financial flexibility Strategy focused on value creation Improve ROCE to mid-teens Sell or joint venture less competitive assets Disciplined reinvestment of free cash flow Competitive shareholder distributions Earnings and cash flow growth potential Operating excellence LT Assets Insert Downstream Picture |
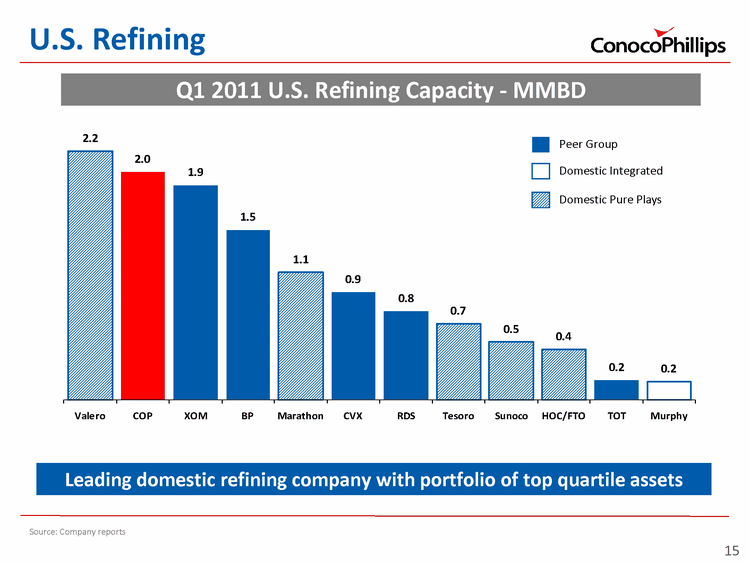
| 15 Peer Group Peer Average Valero 2.17 COP 1.986 XOM 1.873 BP 1.478 Marathon 1.114 CVX 0.941 RDS 0.773 Tesoro 0.665 Sunoco 0.505 HOC/FTO 0.443 TOT 0.174 Murphy 0.16 Q1 2011 U.S. Refining Capacity - MMBD U.S. Refining Leading domestic refining company with portfolio of top quartile assets Peer Group Domestic Integrated Domestic Pure Plays Source: Company reports |
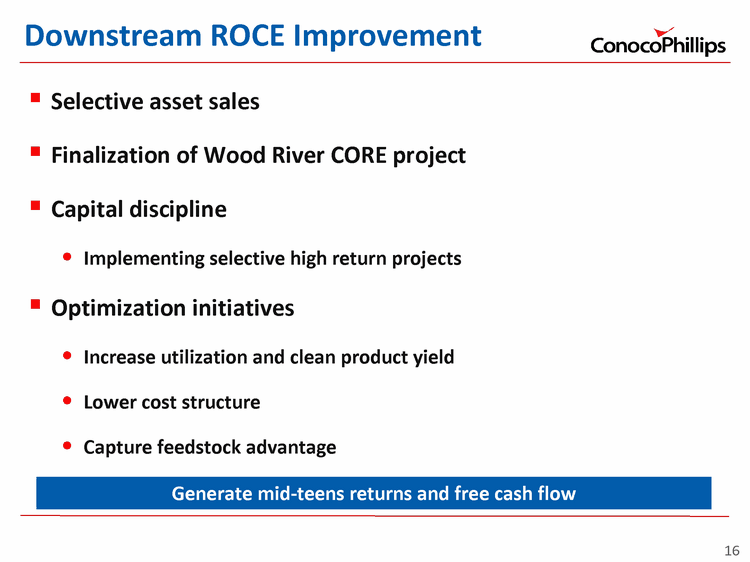
| 16 Downstream ROCE Improvement Selective asset sales Finalization of Wood River CORE project Capital discipline Implementing selective high return projects Optimization initiatives Increase utilization and clean product yield Lower cost structure Capture feedstock advantage Generate mid-teens returns and free cash flow |
| 17 Key Milestones Detailed separation planning followed by IRS tax ruling request Announcement of new board and leadership teams Favorable IRS ruling Final COP Board approval Expected closing 1st half of 2012 |
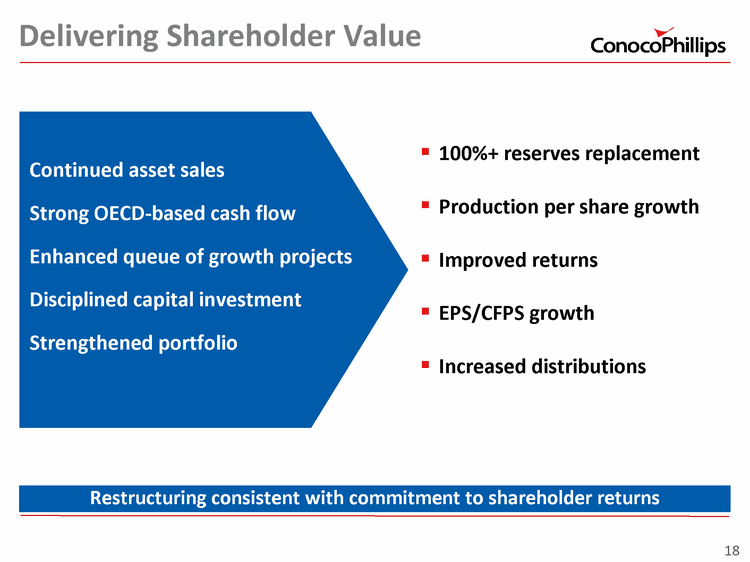
| 18 Delivering Shareholder Value 100%+ reserves replacement Production per share growth Improved returns EPS/CFPS growth Increased distributions Continued asset sales Strong OECD-based cash flow Enhanced queue of growth projects Disciplined capital investment Strengthened portfolio Restructuring consistent with commitment to shareholder returns |
