Attached files
| file | filename |
|---|---|
| EX-32 - EX-32 - CONOCOPHILLIPS | d84505dex32.htm |
| EX-31.1 - EX-31.1 - CONOCOPHILLIPS | d84505dex311.htm |
| EX-10.1 - EX-10.1 - CONOCOPHILLIPS | d84505dex101.htm |
| EX-12 - EX-12 - CONOCOPHILLIPS | d84505dex12.htm |
| EX-31.2 - EX-31.2 - CONOCOPHILLIPS | d84505dex312.htm |
Table of Contents
UNITED STATES
SECURITIES AND EXCHANGE COMMISSION
Washington, D.C. 20549
FORM 10-Q
(Mark One)
| x | QUARTERLY REPORT PURSUANT TO SECTION 13 OR 15(d) OF THE SECURITIES EXCHANGE ACT OF 1934 |
For the quarterly period ended September 30, 2015
or
| ¨ | TRANSITION REPORT PURSUANT TO SECTION 13 OR 15(d) OF THE SECURITIES EXCHANGE ACT OF 1934 |
For the transition period from to
Commission file number: 001-32395
ConocoPhillips
(Exact name of registrant as specified in its charter)
| Delaware | 01-0562944 | |
| (State or other jurisdiction of incorporation or organization) |
(I.R.S. Employer Identification No.) |
600 North Dairy Ashford, Houston, TX 77079
(Address of principal executive offices) (Zip Code)
281-293-1000
(Registrant’s telephone number, including area code)
Indicate by check mark whether the registrant (1) has filed all reports required to be filed by Section 13 or 15(d) of the Securities Exchange Act of 1934 during the preceding 12 months (or for such shorter period that the registrant was required to file such reports), and (2) has been subject to such filing requirements for the past 90 days. Yes x No ¨
Indicate by check mark whether the registrant has submitted electronically and posted on its corporate Web site, if any, every Interactive Data File required to be submitted and posted pursuant to Rule 405 of Regulation S-T during the preceding 12 months (or for such shorter period that the registrant was required to submit and post such files). Yes x No ¨
Indicate by check mark whether the registrant is a large accelerated filer, an accelerated filer, a non-accelerated filer, or a smaller reporting company. See the definitions of “large accelerated filer,” “accelerated filer” and “smaller reporting company” in Rule 12b-2 of the Exchange Act.
| Large accelerated filer | x | Accelerated filer | ¨ | |||
| Non-accelerated filer | ¨ | Smaller reporting company | ¨ | |||
Indicate by check mark whether the registrant is a shell company (as defined in Rule 12b-2 of the Exchange Act). Yes ¨ No x
The registrant had 1,234,641,991 shares of common stock, $.01 par value, outstanding at September 30, 2015.
Table of Contents
CONOCOPHILLIPS
Table of Contents
| Consolidated Income Statement | ConocoPhillips |
| Millions of Dollars | ||||||||||||||||
| Three Months Ended September 30 |
Nine Months Ended September 30 |
|||||||||||||||
| 2015 | 2014 | 2015 | 2014 | |||||||||||||
|
|
|
|
|
|||||||||||||
| Revenues and Other Income |
||||||||||||||||
| Sales and other operating revenues |
$ | 7,262 | 12,080 | 23,271 | 41,316 | |||||||||||
| Equity in earnings of affiliates |
223 | 764 | 686 | 2,008 | ||||||||||||
| Gain on dispositions |
18 | 4 | 122 | 20 | ||||||||||||
| Other income |
4 | 69 | 90 | 322 | ||||||||||||
|
|
||||||||||||||||
| Total Revenues and Other Income |
7,507 | 12,917 | 24,169 | 43,666 | ||||||||||||
|
|
||||||||||||||||
| Costs and Expenses |
||||||||||||||||
| Purchased commodities |
3,269 | 4,703 | 9,736 | 17,325 | ||||||||||||
| Production and operating expenses |
1,834 | 2,041 | 5,434 | 5,966 | ||||||||||||
| Selling, general and administrative expenses |
293 | 203 | 670 | 603 | ||||||||||||
| Exploration expenses |
1,061 | 459 | 2,092 | 1,272 | ||||||||||||
| Depreciation, depletion and amortization |
2,271 | 2,096 | 6,731 | 6,058 | ||||||||||||
| Impairments |
24 | 108 | 118 | 126 | ||||||||||||
| Taxes other than income taxes |
206 | 493 | 655 | 1,756 | ||||||||||||
| Accretion on discounted liabilities |
122 | 120 | 365 | 357 | ||||||||||||
| Interest and debt expense |
240 | 149 | 652 | 475 | ||||||||||||
| Foreign currency transaction (gains) losses |
(72 | ) | (8 | ) | (96 | ) | 17 | |||||||||
|
|
||||||||||||||||
| Total Costs and Expenses |
9,248 | 10,364 | 26,357 | 33,955 | ||||||||||||
|
|
||||||||||||||||
| Income (loss) from continuing operations before income taxes |
(1,741 | ) | 2,553 | (2,188 | ) | 9,711 | ||||||||||
| Provision (benefit) for income taxes |
(685 | ) | 904 | (1,254 | ) | 3,880 | ||||||||||
|
|
||||||||||||||||
| Income (Loss) From Continuing Operations |
(1,056 | ) | 1,649 | (934 | ) | 5,831 | ||||||||||
| Income from discontinued operations* |
— | 1,078 | — | 1,131 | ||||||||||||
|
|
||||||||||||||||
| Net income (loss) |
(1,056 | ) | 2,727 | (934 | ) | 6,962 | ||||||||||
| Less: net income attributable to noncontrolling interests |
(15 | ) | (23 | ) | (44 | ) | (54 | ) | ||||||||
|
|
||||||||||||||||
| Net Income (Loss) Attributable to ConocoPhillips |
$ | (1,071 | ) | 2,704 | (978 | ) | 6,908 | |||||||||
|
|
||||||||||||||||
| Amounts Attributable to ConocoPhillips Common Shareholders: |
||||||||||||||||
| Income (loss) from continuing operations |
$ | (1,071 | ) | 1,626 | (978 | ) | 5,777 | |||||||||
| Income from discontinued operations |
— | 1,078 | — | 1,131 | ||||||||||||
|
|
||||||||||||||||
| Net income (loss) |
$ | (1,071 | ) | 2,704 | (978 | ) | 6,908 | |||||||||
|
|
||||||||||||||||
| Net Income (Loss) Attributable to ConocoPhillips Per Share of Common Stock (dollars) |
||||||||||||||||
| Basic |
||||||||||||||||
| Continuing operations |
$ | (0.87 | ) | 1.31 | (0.80 | ) | 4.67 | |||||||||
| Discontinued operations |
— | 0.87 | — | 0.91 | ||||||||||||
|
|
||||||||||||||||
| Net Income (Loss) Attributable to ConocoPhillips Per Share of Common Stock |
$ | (0.87 | ) | 2.18 | (0.80 | ) | 5.58 | |||||||||
|
|
||||||||||||||||
| Diluted |
||||||||||||||||
| Continuing operations |
$ | (0.87 | ) | 1.31 | (0.80 | ) | 4.63 | |||||||||
| Discontinued operations |
— | 0.86 | — | 0.91 | ||||||||||||
|
|
||||||||||||||||
| Net Income (Loss) Attributable to ConocoPhillips Per Share of Common Stock |
$ | (0.87 | ) | 2.17 | (0.80 | ) | 5.54 | |||||||||
|
|
||||||||||||||||
| Dividends Paid Per Share of Common Stock (dollars) |
$ | 0.74 | 0.73 | 2.20 | 2.11 | |||||||||||
|
|
||||||||||||||||
| Average Common Shares Outstanding (in thousands) |
||||||||||||||||
| Basic |
1,242,125 | 1,238,234 | 1,241,319 | 1,236,431 | ||||||||||||
| Diluted |
1,242,125 | 1,247,436 | 1,241,319 | 1,246,788 | ||||||||||||
|
|
||||||||||||||||
| *Net of provision (benefit) for income taxes on discontinued operations of: | $ | — | (6 | ) | — | 16 | ||||||||||
See Notes to Consolidated Financial Statements.
1
Table of Contents
| Consolidated Statement of Comprehensive Income | ConocoPhillips |
| Millions of Dollars | ||||||||||||||||
| Three Months Ended September 30 |
Nine Months Ended September 30 |
|||||||||||||||
| 2015 | 2014 | 2015 | 2014 | |||||||||||||
|
|
|
|
|
|||||||||||||
| Net Income (Loss) |
$ | (1,056 | ) | 2,727 | (934 | ) | 6,962 | |||||||||
| Other comprehensive income (loss) |
||||||||||||||||
| Defined benefit plans |
||||||||||||||||
| Prior service credit arising during the period |
163 | — | 303 | — | ||||||||||||
| Reclassification adjustment for amortization of prior service credit included in net income (loss) |
(5 | ) | (2 | ) | (9 | ) | (5 | ) | ||||||||
| Net actuarial loss arising during the period |
(231 | ) | — | (216 | ) | — | ||||||||||
| Reclassification adjustment for amortization of net actuarial losses included in net income (loss) |
126 | 32 | 278 | 98 | ||||||||||||
| Nonsponsored plans* |
— | — | — | 5 | ||||||||||||
| Income taxes on defined benefit plans |
(18 | ) | (11 | ) | (128 | ) | (34 | ) | ||||||||
|
|
||||||||||||||||
| Defined benefit plans, net of tax |
35 | 19 | 228 | 64 | ||||||||||||
|
|
||||||||||||||||
| Foreign currency translation adjustments |
(2,544 | ) | (1,947 | ) | (4,493 | ) | (1,501 | ) | ||||||||
| Income taxes on foreign currency translation adjustments |
25 | 15 | 42 | 20 | ||||||||||||
|
|
||||||||||||||||
| Foreign currency translation adjustments, net of tax |
(2,519 | ) | (1,932 | ) | (4,451 | ) | (1,481 | ) | ||||||||
|
|
||||||||||||||||
| Other Comprehensive Loss, Net of Tax |
(2,484 | ) | (1,913 | ) | (4,223 | ) | (1,417 | ) | ||||||||
|
|
||||||||||||||||
| Comprehensive Income (Loss) |
(3,540 | ) | 814 | (5,157 | ) | 5,545 | ||||||||||
| Less: comprehensive income attributable to noncontrolling interests |
(15 | ) | (23 | ) | (44 | ) | (54 | ) | ||||||||
|
|
||||||||||||||||
| Comprehensive Income (Loss) Attributable to ConocoPhillips |
$ | (3,555 | ) | 791 | (5,201 | ) | 5,491 | |||||||||
|
|
||||||||||||||||
*Plans for which ConocoPhillips is not the primary obligor—primarily those administered by equity affiliates.
See Notes to Consolidated Financial Statements.
2
Table of Contents
| Consolidated Balance Sheet | ConocoPhillips |
| Millions of Dollars | ||||||||
| September 30 | December 31 | |||||||
| 2015 | 2014 | |||||||
|
|
|
|||||||
| Assets |
||||||||
| Cash and cash equivalents |
$ | 2,413 | 5,062 | |||||
| Accounts and notes receivable (net of allowance of $7 million in 2015 and $5 million in 2014) |
4,332 | 6,675 | ||||||
| Accounts and notes receivable—related parties |
132 | 132 | ||||||
| Inventories |
1,143 | 1,331 | ||||||
| Prepaid expenses and other current assets |
1,644 | 1,868 | ||||||
|
|
||||||||
| Total Current Assets |
9,664 | 15,068 | ||||||
| Investments and long-term receivables |
22,806 | 24,335 | ||||||
| Loans and advances—related parties |
696 | 804 | ||||||
| Net properties, plants and equipment (net of accumulated depreciation, depletion and amortization of $74,420 million in 2015 and $70,786 million in 2014) |
71,828 | 75,444 | ||||||
| Other assets |
955 | 888 | ||||||
|
|
||||||||
| Total Assets |
$ | 105,949 | 116,539 | |||||
|
|
||||||||
| Liabilities |
||||||||
| Accounts payable |
$ | 5,173 | 7,982 | |||||
| Accounts payable—related parties |
38 | 44 | ||||||
| Short-term debt |
175 | 182 | ||||||
| Accrued income and other taxes |
659 | 1,051 | ||||||
| Employee benefit obligations |
861 | 878 | ||||||
| Other accruals |
1,381 | 1,400 | ||||||
|
|
||||||||
| Total Current Liabilities |
8,287 | 11,537 | ||||||
| Long-term debt |
24,716 | 22,383 | ||||||
| Asset retirement obligations and accrued environmental costs |
10,279 | 10,647 | ||||||
| Deferred income taxes |
13,317 | 15,070 | ||||||
| Employee benefit obligations |
2,864 | 2,964 | ||||||
| Other liabilities and deferred credits |
1,931 | 1,665 | ||||||
|
|
||||||||
| Total Liabilities |
61,394 | 64,266 | ||||||
|
|
||||||||
| Equity |
||||||||
| Common stock (2,500,000,000 shares authorized at $.01 par value) |
||||||||
| Issued (2015—1,776,872,664 shares; 2014—1,773,583,368 shares) |
||||||||
| Par value |
18 | 18 | ||||||
| Capital in excess of par |
46,311 | 46,071 | ||||||
| Treasury stock (at cost: 2015—542,230,673 shares; 2014—542,230,673 shares) |
(36,780 | ) | (36,780 | ) | ||||
| Accumulated other comprehensive loss |
(6,125 | ) | (1,902 | ) | ||||
| Retained earnings |
40,786 | 44,504 | ||||||
|
|
||||||||
| Total Common Stockholders’ Equity |
44,210 | 51,911 | ||||||
| Noncontrolling interests |
345 | 362 | ||||||
|
|
||||||||
| Total Equity |
44,555 | 52,273 | ||||||
|
|
||||||||
| Total Liabilities and Equity |
$ | 105,949 | 116,539 | |||||
|
|
||||||||
See Notes to Consolidated Financial Statements.
3
Table of Contents
| Consolidated Statement of Cash Flows | ConocoPhillips |
| Millions of Dollars | ||||||||
| Nine Months Ended September 30 |
||||||||
| 2015 | 2014* | |||||||
|
|
|
|||||||
| Cash Flows From Operating Activities |
||||||||
| Net income (loss) |
$ | (934 | ) | 6,962 | ||||
| Adjustments to reconcile net income to net cash provided by operating activities |
||||||||
| Depreciation, depletion and amortization |
6,731 | 6,058 | ||||||
| Impairments |
118 | 126 | ||||||
| Dry hole costs and leasehold impairments |
1,238 | 668 | ||||||
| Accretion on discounted liabilities |
365 | 357 | ||||||
| Deferred taxes |
(1,284 | ) | 1,024 | |||||
| Undistributed equity earnings |
(79 | ) | 334 | |||||
| Gain on dispositions |
(122 | ) | (20 | ) | ||||
| Income from discontinued operations |
— | (1,131 | ) | |||||
| Other |
(259 | ) | (536 | ) | ||||
| Working capital adjustments |
||||||||
| Decrease in accounts and notes receivable |
1,913 | 634 | ||||||
| Decrease (increase) in inventories |
159 | (162 | ) | |||||
| Decrease (increase) in prepaid expenses and other current assets |
255 | (189 | ) | |||||
| Decrease in accounts payable |
(1,618 | ) | (581 | ) | ||||
| Increase (decrease) in taxes and other accruals |
(507 | ) | 57 | |||||
|
|
||||||||
| Net cash provided by continuing operating activities |
5,976 | 13,601 | ||||||
| Net cash provided by discontinued operations |
— | 157 | ||||||
|
|
||||||||
| Net Cash Provided by Operating Activities |
5,976 | 13,758 | ||||||
|
|
||||||||
| Cash Flows From Investing Activities |
||||||||
| Capital expenditures and investments |
(7,913 | ) | (12,729 | ) | ||||
| Working capital changes associated with investing activities |
(842 | ) | 394 | |||||
| Proceeds from asset dispositions |
323 | 1,434 | ||||||
| Net purchases of short-term investments |
— | (109 | ) | |||||
| Collection of advances/loans—related parties |
105 | 143 | ||||||
| Other |
298 | (454 | ) | |||||
|
|
||||||||
| Net cash used in continuing investing activities |
(8,029 | ) | (11,321 | ) | ||||
| Net cash used in discontinued operations |
— | (73 | ) | |||||
|
|
||||||||
| Net Cash Used in Investing Activities |
(8,029 | ) | (11,394 | ) | ||||
|
|
||||||||
| Cash Flows From Financing Activities |
||||||||
| Issuance of debt |
2,498 | — | ||||||
| Repayment of debt |
(92 | ) | (505 | ) | ||||
| Issuance of company common stock |
(69 | ) | 27 | |||||
| Dividends paid |
(2,741 | ) | (2,618 | ) | ||||
| Other |
(50 | ) | (20 | ) | ||||
|
|
||||||||
| Net Cash Used in Financing Activities |
(454 | ) | (3,116 | ) | ||||
|
|
||||||||
| Effect of Exchange Rate Changes on Cash and Cash Equivalents |
(142 | ) | (86 | ) | ||||
|
|
||||||||
| Net Change in Cash and Cash Equivalents |
(2,649 | ) | (838 | ) | ||||
| Cash and cash equivalents at beginning of period |
5,062 | 6,246 | ||||||
|
|
||||||||
| Cash and Cash Equivalents at End of Period |
$ | 2,413 | 5,408 | |||||
|
|
||||||||
*Certain amounts have been reclassified to conform to current-period presentation. See Note 15–Cash Flow Information, in the Notes to the Consolidated Financial Statements.
See Notes to Consolidated Financial Statements.
4
Table of Contents
| Notes to Consolidated Financial Statements | ConocoPhillips |
Note 1—Basis of Presentation
The interim-period financial information presented in the financial statements included in this report is unaudited and, in the opinion of management, includes all known accruals and adjustments necessary for a fair presentation of the consolidated financial position of ConocoPhillips and its results of operations and cash flows for such periods. All such adjustments are of a normal and recurring nature unless otherwise disclosed. Certain notes and other information have been condensed or omitted from the interim financial statements included in this report. Therefore, these financial statements should be read in conjunction with the consolidated financial statements and notes included in our 2014 Annual Report on Form 10-K.
The results of operations for our former Nigeria business have been classified as discontinued operations for all periods presented. Unless indicated otherwise, the information in the Notes to Consolidated Financial Statements relates to our continuing operations.
Note 2—Variable Interest Entities (VIEs)
We hold variable interests in VIEs that have not been consolidated because we are not considered the primary beneficiary. Information on our significant VIE follows:
Australia Pacific LNG Pty Ltd (APLNG)
APLNG is considered a VIE, as it has entered into certain contractual arrangements that provide it with additional forms of subordinated financial support. We are not the primary beneficiary of APLNG because we share with Origin Energy and China Petrochemical Corporation (Sinopec) the power to direct the key activities of APLNG that most significantly impact its economic performance, which involve activities related to the production and commercialization of coalbed methane, as well as liquefied natural gas (LNG) processing and export marketing. As a result, we do not consolidate APLNG, and it is accounted for as an equity method investment.
As of September 30, 2015, we have not provided any financial support to APLNG other than amounts previously contractually required. Unless we elect otherwise, we have no requirement to provide liquidity or purchase the assets of APLNG. See Note 5—Investments, Loans and Long-Term Receivables, and Note 10—Guarantees, for additional information.
Note 3—Inventories
Inventories consisted of the following:
| Millions of Dollars | ||||||||
| September 30 2015 |
December 31 2014 |
|||||||
|
|
|
|||||||
| Crude oil and natural gas |
$ | 388 | 538 | |||||
| Materials and supplies |
755 | 793 | ||||||
|
|
||||||||
| $ | 1,143 | 1,331 | ||||||
|
|
||||||||
Inventories valued on the last-in, first-out (LIFO) basis totaled $270 million and $440 million at September 30, 2015 and December 31, 2014, respectively.
5
Table of Contents
Note 4—Assets Held for Sale
On October 5, 2015, we entered into a definitive agreement to sell certain western Canada proved and unproved properties. The transaction is expected to close in the fourth quarter of 2015. As of September 30, 2015, the net carrying value of these assets was approximately $129 million, which primarily included $375 million of properties, plants and equipment (PP&E) and $235 million of asset retirement obligations.
On October 30, 2015, we entered into a definitive agreement to sell certain gas producing properties and gathering facilities in Texas and Louisiana. The transaction is expected to close late fourth quarter 2015 or early 2016. As of September 30, 2015, the net carrying value of these assets was approximately $232 million, which primarily included $358 million of PP&E and $126 million of asset retirement obligations.
Note 5—Investments, Loans and Long-Term Receivables
APLNG
APLNG’s $8.5 billion project finance facility consists of financing agreements executed by APLNG with the Export-Import Bank of the United States for approximately $2.9 billion, the Export-Import Bank of China for approximately $2.7 billion, and a syndicate of Australian and international commercial banks for approximately $2.9 billion. At September 30, 2015, $8.4 billion had been drawn from the facility. In connection with the execution of the project financing, we provided a completion guarantee for our pro-rata share of the project finance facility until the project achieves financial completion. See Note 10—Guarantees, for additional information.
APLNG is considered a VIE, as it has entered into certain contractual arrangements that provide it with additional forms of subordinated financial support. See Note 2—Variable Interest Entities (VIEs), for additional information.
At September 30, 2015, the book value of our equity method investment in APLNG was $11,530 million, net of a $1,522 million reduction due to cumulative foreign currency translation effects. The balance is included in the “Investments and long-term receivables” line on our consolidated balance sheet.
FCCL
At September 30, 2015, the book value of our equity method investment in FCCL was $8,346 million, net of a $1,667 million reduction due to cumulative foreign currency translation effects. The balance is included in the “Investments and long-term receivables” line on our consolidated balance sheet. In the first quarter of 2014, we received a $1.3 billion distribution from FCCL, which is included in the “Undistributed equity earnings” line on our consolidated statement of cash flows.
Loans and Long-Term Receivables
As part of our normal ongoing business operations and consistent with industry practice, we enter into numerous agreements with other parties to pursue business opportunities. Included in such activity are loans made to certain affiliated and non-affiliated companies. At September 30, 2015, significant loans to affiliated companies included $804 million in project financing to Qatar Liquefied Gas Company Limited (3) (QG3).
The long-term portion of these loans is included in the “Loans and advances—related parties” line on our consolidated balance sheet, while the short-term portion is in “Accounts and notes receivable—related parties.”
6
Table of Contents
Note 6—Suspended Wells, Unproved Property Impairments and Other Exploration Expenses
The capitalized cost of suspended wells at September 30, 2015, was $1,466 million, an increase of $167 million from $1,299 million at year-end 2014. Three suspended wells in Malaysia totaling $45 million were charged to dry hole expense during the first nine months of 2015 relating to exploratory well costs capitalized for a period greater than one year as of December 31, 2014.
In the second quarter of 2015, we decided not to pursue further evaluation of our Lebork, Damnica and Karwia concessions in Poland and Block 37 lease in Angola. Accordingly, we recorded pre-tax impairments of $93 million and $116 million, respectively, for the associated carrying value of capitalized undeveloped leasehold cost.
In the third quarter of 2015, we decided not to conduct further activity on certain Gulf of Mexico leases and to relinquish our Palangkaraya Production Sharing Contract in Indonesia. Accordingly, we recorded pre-tax impairments of $240 million and $105 million, respectively, for the associated carrying value of capitalized undeveloped leasehold cost. Additionally, in line with our July 2015 announcement of plans to reduce future deepwater exploration spending, we have recognized cancellation costs of $335 million and written off $48 million of capitalized rig costs in relation to the termination of our Gulf of Mexico deepwater drillship contract with Ensco in the Lower 48 segment in the third quarter of 2015.
These charges are included in the “Exploration expenses” line on our consolidated income statement.
Note 7—Impairments
During the three- and nine-month periods ended September 30, 2015 and 2014, we recognized before-tax impairment charges within the following segments:
| Millions of Dollars | ||||||||||||||||
| Three Months Ended September 30 |
Nine Months Ended September 30 |
|||||||||||||||
| 2015 | 2014 | 2015 | 2014 | |||||||||||||
|
|
|
|
|
|||||||||||||
| Alaska |
$ | 2 | 3 | 9 | 3 | |||||||||||
| Lower 48 |
6 | 102 | 6 | 119 | ||||||||||||
| Europe |
9 | 1 | 96 | 1 | ||||||||||||
| Asia Pacific and Middle East |
6 | — | 6 | — | ||||||||||||
| Corporate and Other |
1 | 2 | 1 | 3 | ||||||||||||
|
|
||||||||||||||||
| $ | 24 | 108 | 118 | 126 | ||||||||||||
|
|
||||||||||||||||
The nine-month period of 2015 included impairments in our Europe segment of $96 million, primarily as a result of lower natural gas prices and reduced volume forecasts.
The three- and nine-month periods of 2014 included an impairment in our Lower 48 segment of $102 million, primarily as a result of reduced volume forecasts.
Unproved property impairments, included in the “Exploration expenses” line on our consolidated income statement, are further discussed in Note 6—Suspended Wells, Unproved Property Impairments and Other Exploration Expenses.
7
Table of Contents
Note 8—Debt
We have two commercial paper programs supported by our $7.0 billion revolving credit facility: the ConocoPhillips $6.1 billion program, primarily a funding source for short-term working capital needs, and the ConocoPhillips Qatar Funding Ltd. $900 million program, which is used to fund commitments relating to QG3. Commercial paper maturities are generally limited to 90 days.
At September 30, 2015 and December 31, 2014, we had no direct outstanding borrowings under the revolving credit facility, with no letters of credit as of September 30, 2015 or December 31, 2014. Under the ConocoPhillips Qatar Funding Ltd. commercial paper program, $803 million of commercial paper was outstanding at September 30, 2015, compared with $860 million at December 31, 2014. Since we had $803 million of commercial paper outstanding and had issued no letters of credit, we had access to $6.2 billion in borrowing capacity under our revolving credit facility at September 30, 2015.
At September 30, 2015, we classified $695 million of short-term debt as long-term debt, based on our ability and intent to refinance the obligation on a long-term basis under our revolving credit facility.
In May 2015, we issued notes consisting of:
| • | The $750 million of 1.50% Notes due 2018. |
| • | The $250 million of Floating Rate Notes due 2018 bearing interest at three-month LIBOR, plus 0.33%. |
| • | The $500 million of 2.20% Notes due 2020. |
| • | The $500 million of Floating Rate Notes due 2022 bearing interest at three-month LIBOR, plus 0.90%. |
| • | The $500 million of 3.35% Notes due 2025. |
The net proceeds were used for general corporate purposes.
Note 9—Noncontrolling Interests
Activity attributable to common stockholders’ equity and noncontrolling interests for the first nine months of 2015 and 2014 was as follows:
| Millions of Dollars | ||||||||||||||||||||||||
| 2015 | 2014 | |||||||||||||||||||||||
| Common Stockholders’ Equity |
Non- Controlling Interest |
Total Equity |
Common Stockholders’ Equity |
Non- Controlling Interest |
Total Equity |
|||||||||||||||||||
|
|
|
|
|
|||||||||||||||||||||
| Balance at January 1 |
$ | 51,911 | 362 | 52,273 | 52,090 | 402 | 52,492 | |||||||||||||||||
| Net income (loss) |
(978 | ) | 44 | (934 | ) | 6,908 | 54 | 6,962 | ||||||||||||||||
| Dividends |
(2,741 | ) | — | (2,741 | ) | (2,618 | ) | — | (2,618 | ) | ||||||||||||||
| Distributions to noncontrolling interests |
— | (62 | ) | (62 | ) | — | (69 | ) | (69 | ) | ||||||||||||||
| Other changes, net* |
(3,982 | ) | 1 | (3,981 | ) | (1,106 | ) | — | (1,106 | ) | ||||||||||||||
|
|
||||||||||||||||||||||||
| Balance at September 30 |
$ | 44,210 | 345 | 44,555 | 55,274 | 387 | 55,661 | |||||||||||||||||
|
|
||||||||||||||||||||||||
*Includes components of other comprehensive income, which are disclosed separately in the Consolidated Statement of Comprehensive Income.
8
Table of Contents
Note 10—Guarantees
At September 30, 2015, we were liable for certain contingent obligations under various contractual arrangements as described below. We recognize a liability, at inception, for the fair value of our obligation as a guarantor for newly issued or modified guarantees. Unless the carrying amount of the liability is noted below, we have not recognized a liability because the fair value of the obligation is immaterial. In addition, unless otherwise stated, we are not currently performing with any significance under the guarantee and expect future performance to be either immaterial or have only a remote chance of occurrence.
APLNG Guarantees
At September 30, 2015, we had outstanding multiple guarantees in connection with our 37.5 percent ownership interest in APLNG. The following is a description of the guarantees with values calculated utilizing September 2015 exchange rates:
| • | We have guaranteed APLNG’s performance with regard to a construction contract executed in connection with APLNG’s issuance of the Train 1 and Train 2 Notices to Proceed. We estimate the remaining term of this guarantee is two years. Our maximum potential amount of future payments related to this guarantee is approximately $90 million and would become payable if APLNG cancels the applicable construction contract and does not perform with respect to the amounts owed to the contractor. |
| • | We have issued a construction completion guarantee related to the third-party project financing secured by APLNG. Our maximum potential amount of future payments under the guarantee is estimated to be $3.2 billion, which could be payable if the full debt financing capacity is utilized and completion of the project is not achieved. Our guarantee of the project financing will be released upon meeting certain completion tests with milestones, which we estimate should occur beginning in 2016. Our maximum exposure at September 30, 2015, is $3.1 billion based upon our pro-rata share of the facility used at that date. At September 30, 2015, the carrying value of this guarantee is approximately $114 million. |
| • | In conjunction with our original purchase of an ownership interest in APLNG from Origin Energy in October 2008, we agreed to guarantee an existing obligation of APLNG to deliver natural gas under several sales agreements with remaining terms of 1 to 27 years. Our maximum potential amount of future payments, or cost of volume delivery, under these guarantees is estimated to be $1.1 billion ($1.9 billion in the event of intentional or reckless breach), and would become payable if APLNG fails to meet its obligations under these agreements and the obligations cannot otherwise be mitigated. Future payments are considered unlikely, as the payments, or cost of volume delivery, would only be triggered if APLNG does not have enough natural gas to meet these sales commitments and if the co-venturers do not make necessary equity contributions into APLNG. |
| • | We have guaranteed the performance of APLNG with regard to certain other contracts executed in connection with the project’s continued development. The guarantees have remaining terms of up to 30 years or the life of the venture. Our maximum potential amount of future payments related to these guarantees is approximately $160 million and would become payable if APLNG does not perform. |
Other Guarantees
We have other guarantees with maximum future potential payment amounts totaling approximately $370 million, which consist primarily of guarantees of the residual value of leased corporate aircraft, a guarantee for our portion of a joint venture’s project finance reserve accounts, a guarantee to fund the short-term cash liquidity deficit of a joint venture, and a guarantee of minimum charter revenue for an LNG vessel. These guarantees have remaining terms of up to nine years or the life of the venture and would become payable if, upon sale, certain asset values are lower than guaranteed amounts, business conditions decline at guaranteed entities, or as a result of non-performance of contractual terms by guaranteed parties.
9
Table of Contents
Indemnifications
Over the years, we have entered into agreements to sell ownership interests in certain corporations, joint ventures and assets that gave rise to qualifying indemnifications. In addition we have entered into agreements involving leased facilities that provided for certain indemnifications. These agreements include indemnifications for taxes, environmental liabilities, employee claims, property damage, costs, fees and litigation. The terms of these indemnifications vary greatly. The majority of these indemnifications are related to environmental issues, the term is generally indefinite and the maximum amount of future payments is generally unlimited. The carrying amount recorded for these indemnifications at September 30, 2015, was approximately $90 million. We amortize the indemnification liability over the relevant time period, if one exists, based on the facts and circumstances surrounding each type of indemnity. In cases where the indemnification term is indefinite, we will reverse the liability when we have information the liability is essentially relieved or amortize the liability over an appropriate time period as the fair value of our indemnification exposure declines. Although it is reasonably possible future payments may exceed amounts recorded, due to the nature of the indemnifications, it is not possible to make a reasonable estimate of the maximum potential amount of future payments. Included in the recorded carrying amount at September 30, 2015, were approximately $40 million of environmental accruals for known contamination that are included in the “Asset retirement obligations and accrued environmental costs” line on our consolidated balance sheet. For additional information about environmental liabilities, see Note 11—Contingencies and Commitments.
On April 30, 2012, the separation of our Downstream businesses was completed, creating two independent energy companies: ConocoPhillips and Phillips 66. In connection with the separation, we entered into an Indemnification and Release Agreement, which provides for cross-indemnities between Phillips 66 and us and established procedures for handling claims subject to indemnification and related matters. We evaluated the impact of the indemnifications given and the Phillips 66 indemnifications received as of the separation date and concluded those fair values were immaterial.
On March 1, 2015, a supplier to one of the refineries that was included in Phillips 66 as part of the separation of our Downstream businesses formally registered Phillips 66 as a party to the supply agreement, thereby triggering a guarantee we provided at the time of separation. Our maximum potential liability for future payments under this guarantee, which would become payable if Phillips 66 does not perform its contractual obligations under the supply agreement, is approximately $1.6 billion. At September 30, 2015, the carrying value of this guarantee is approximately $100 million and the remaining term is nine years. Because Phillips 66 has indemnified us for losses incurred under this guarantee, we have recorded an indemnification asset from Phillips 66 of approximately $100 million. The recorded indemnification asset amount represents the estimated fair value of the guarantee; however, if we are required to perform under the guarantee, we would expect to recover from Phillips 66 any amounts in excess of that value, provided Phillips 66 is a going concern.
Note 11—Contingencies and Commitments
A number of lawsuits involving a variety of claims arising in the ordinary course of business have been made against ConocoPhillips. We also may be required to remove or mitigate the effects on the environment of the placement, storage, disposal or release of certain chemical, mineral and petroleum substances at various active and inactive sites. We regularly assess the need for accounting recognition or disclosure of these contingencies. In the case of all known contingencies (other than those related to income taxes), we accrue a liability when the loss is probable and the amount is reasonably estimable. If a range of amounts can be reasonably estimated and no amount within the range is a better estimate than any other amount, then the minimum of the range is accrued. We do not reduce these liabilities for potential insurance or third-party recoveries. If applicable, we accrue receivables for probable insurance or other third-party recoveries. With respect to income-tax-related contingencies, we use a cumulative probability-weighted loss accrual in cases where sustaining a tax position is less than certain.
Based on currently available information, we believe it is remote that future costs related to known contingent liability exposures will exceed current accruals by an amount that would have a material adverse impact on our
10
Table of Contents
consolidated financial statements. As we learn new facts concerning contingencies, we reassess our position both with respect to accrued liabilities and other potential exposures. Estimates particularly sensitive to future changes include contingent liabilities recorded for environmental remediation, tax and legal matters. Estimated future environmental remediation costs are subject to change due to such factors as the uncertain magnitude of cleanup costs, the unknown time and extent of such remedial actions that may be required, and the determination of our liability in proportion to that of other responsible parties. Estimated future costs related to tax and legal matters are subject to change as events evolve and as additional information becomes available during the administrative and litigation processes.
Environmental
We are subject to international, federal, state and local environmental laws and regulations. When we prepare our consolidated financial statements, we record accruals for environmental liabilities based on management’s best estimates, using all information that is available at the time. We measure estimates and base liabilities on currently available facts, existing technology, and presently enacted laws and regulations, taking into account stakeholder and business considerations. When measuring environmental liabilities, we also consider our prior experience in remediation of contaminated sites, other companies’ cleanup experience, and data released by the U.S. Environmental Protection Agency (EPA) or other organizations. We consider unasserted claims in our determination of environmental liabilities, and we accrue them in the period they are both probable and reasonably estimable.
Although liability of those potentially responsible for environmental remediation costs is generally joint and several for federal sites and frequently so for other sites, we are usually only one of many companies cited at a particular site. Due to the joint and several liabilities, we could be responsible for all cleanup costs related to any site at which we have been designated as a potentially responsible party. We have been successful to date in sharing cleanup costs with other financially sound companies. Many of the sites at which we are potentially responsible are still under investigation by the EPA or the agency concerned. Prior to actual cleanup, those potentially responsible normally assess the site conditions, apportion responsibility and determine the appropriate remediation. In some instances, we may have no liability or may attain a settlement of liability. Where it appears that other potentially responsible parties may be financially unable to bear their proportional share, we consider this inability in estimating our potential liability, and we adjust our accruals accordingly. As a result of various acquisitions in the past, we assumed certain environmental obligations. Some of these environmental obligations are mitigated by indemnifications made by others for our benefit and some of the indemnifications are subject to dollar limits and time limits.
We are currently participating in environmental assessments and cleanups at numerous federal Superfund and comparable state and international sites. After an assessment of environmental exposures for cleanup and other costs, we make accruals on an undiscounted basis (except those acquired in a purchase business combination, which we record on a discounted basis) for planned investigation and remediation activities for sites where it is probable future costs will be incurred and these costs can be reasonably estimated. At September 30, 2015, our balance sheet included a total environmental accrual of $286 million, compared with $344 million at December 31, 2014, for remediation activities in the United States and Canada. We expect to incur a substantial amount of these expenditures within the next 30 years. We have not reduced these accruals for possible insurance recoveries. In the future, we may be involved in additional environmental assessments, cleanups and proceedings.
Legal Proceedings
We are subject to various lawsuits and claims including but not limited to matters involving oil and gas royalty and severance tax payments, gas measurement and valuation methods, contract disputes, environmental damages, personal injury, and property damage. Our primary exposures for such matters relate to alleged royalty underpayments on certain federal, state and privately owned properties and claims of alleged environmental contamination from historic operations. We will continue to defend ourselves vigorously in these matters.
Our legal organization applies its knowledge, experience and professional judgment to the specific characteristics of our cases, employing a litigation management process to manage and monitor the legal
11
Table of Contents
proceedings against us. Our process facilitates the early evaluation and quantification of potential exposures in individual cases. This process also enables us to track those cases that have been scheduled for trial and/or mediation. Based on professional judgment and experience in using these litigation management tools and available information about current developments in all our cases, our legal organization regularly assesses the adequacy of current accruals and determines if adjustment of existing accruals, or establishment of new accruals, is required.
Other Contingencies
We have contingent liabilities resulting from throughput agreements with pipeline and processing companies not associated with financing arrangements. Under these agreements, we may be required to provide any such company with additional funds through advances and penalties for fees related to throughput capacity not utilized. In addition, at September 30, 2015, we had performance obligations secured by letters of credit of $388 million (issued as direct bank letters of credit) related to various purchase commitments for materials, supplies, commercial activities and services incident to the ordinary conduct of business.
In 2007, we announced we had been unable to reach agreement with respect to our migration to an empresa mixta structure mandated by the Venezuelan government’s Nationalization Decree. As a result, Venezuela’s national oil company, Petróleos de Venezuela S.A. (PDVSA), or its affiliates, directly assumed control over ConocoPhillips’ interests in the Petrozuata and Hamaca heavy oil ventures and the offshore Corocoro development project. In response to this expropriation, we filed a request for international arbitration on November 2, 2007, with the World Bank’s International Centre for Settlement of Investment Disputes (ICSID). An arbitration hearing was held before an ICSID tribunal during the summer of 2010. On September 3, 2013, an ICSID arbitration tribunal held that Venezuela unlawfully expropriated ConocoPhillips’ significant oil investments in June 2007. A separate arbitration phase is currently proceeding to determine the damages owed to ConocoPhillips for Venezuela’s actions. On October 10, 2014, we filed a separate arbitration under the rules of the International Chamber of Commerce against PDVSA for contractual compensation related to the Petrozuata and Hamaca heavy crude oil projects.
In 2008, Burlington Resources, Inc., a wholly owned subsidiary of ConocoPhillips, initiated arbitration before ICSID against The Republic of Ecuador, as a result of the newly enacted Windfall Profits Tax Law and government-mandated renegotiation of our production sharing contracts. Despite a restraining order issued by the ICSID tribunal, Ecuador confiscated the crude oil production of Burlington and its co-venturer and sold the seized crude oil. In 2009, Ecuador took over operations in Blocks 7 and 21, fully expropriating our assets. In June 2010, the ICSID tribunal concluded it has jurisdiction to hear the expropriation claim. On April 24, 2012, Ecuador filed supplemental counterclaims asserting environmental damages, which we believe are not material. The ICSID tribunal issued a decision on liability on December 14, 2012, in favor of Burlington, finding that Ecuador’s seizure of Blocks 7 and 21 was an unlawful expropriation in violation of the Ecuador-U.S. Bilateral Investment Treaty. An additional arbitration phase is now proceeding to determine the damages owed to ConocoPhillips for Ecuador’s actions and to address Ecuador’s counterclaims.
ConocoPhillips served a Notice of Arbitration on the Timor-Leste Minister of Finance in October 2012 for outstanding disputes related to a series of tax assessments. As of September 30, 2015, ConocoPhillips has paid, under protest, tax assessments totaling approximately $237 million, which are primarily recorded in the “Investments and long-term receivables” line on our consolidated balance sheet. The arbitration hearing was conducted in Singapore in June 2014 under the United Nations Commission on International Trade Laws (UNCITRAL) arbitration rules, pursuant to the terms of the Tax Stability Agreement with the Timor-Leste government. Post-hearing briefs from both parties were filed in August 2014. We are now awaiting the Tribunal’s decision. Future impacts on our business are not known at this time.
12
Table of Contents
Note 12—Derivative and Financial Instruments
Derivative Instruments
We use futures, forwards, swaps and options in various markets to meet our customer needs and capture market opportunities. Our commodity business primarily consists of natural gas, crude oil, bitumen, LNG and natural gas liquids.
Our derivative instruments are held at fair value on our consolidated balance sheet. Where these balances have the right of setoff, they are presented on a net basis. Related cash flows are recorded as operating activities on the consolidated statement of cash flows. On our consolidated income statement, realized and unrealized gains and losses are recognized either on a gross basis if directly related to our physical business or a net basis if held for trading. Gains and losses related to contracts that meet and are designated with the normal purchase normal sale exception are recognized upon settlement. We generally apply this exception to eligible crude contracts. We do not use hedge accounting for our commodity derivatives.
The following table presents the gross fair values of our commodity derivatives, excluding collateral, and the line items where they appear on our consolidated balance sheet:
| Millions of Dollars | ||||||||
| September 30 2015 |
December 31 2014 |
|||||||
|
|
|
|||||||
| Assets |
||||||||
| Prepaid expenses and other current assets |
$ | 1,532 | 4,500 | |||||
| Other assets |
78 | 157 | ||||||
| Liabilities |
||||||||
| Other accruals |
1,553 | 4,426 | ||||||
| Other liabilities and deferred credits |
68 | 144 | ||||||
|
|
||||||||
The gains (losses) from commodity derivatives incurred, and the line items where they appear on our consolidated income statement were:
| Millions of Dollars | ||||||||||||||||
| Three Months Ended September 30 |
Nine Months Ended September 30 |
|||||||||||||||
| 2015 | 2014 | 2015 | 2014 | |||||||||||||
|
|
|
|
|
|||||||||||||
| Sales and other operating revenues |
$ | 89 | (185 | ) | 117 | 236 | ||||||||||
| Other income |
— | 1 | 1 | 3 | ||||||||||||
| Purchased commodities |
(85 | ) | 163 | (88 | ) | (221 | ) | |||||||||
|
|
||||||||||||||||
The table below summarizes our material net exposures resulting from outstanding commodity derivative contracts:
| Open Position Long/(Short) |
||||||||
| September 30 2015 |
December 31 2014 |
|||||||
|
|
|
|||||||
| Commodity |
||||||||
| Natural gas and power (billions of cubic feet equivalent) |
||||||||
| Fixed price |
(17 | ) | (11 | ) | ||||
| Basis |
(18 | ) | 18 | |||||
|
|
||||||||
13
Table of Contents
Foreign Currency Exchange Derivatives
We have foreign currency exchange rate risk resulting from international operations. Our foreign currency exchange derivative activity primarily relates to managing our cash-related and foreign currency exchange rate exposures, such as firm commitments for capital programs or local currency tax payments, dividends, and cash returns from net investments in foreign affiliates. We do not elect hedge accounting on our foreign currency exchange derivatives.
The following table presents the gross fair values of our foreign currency exchange derivatives, excluding collateral, and the line items where they appear on our consolidated balance sheet:
| Millions of Dollars | ||||||||
| September 30 2015 |
December 31 2014 |
|||||||
|
|
|
|||||||
| Assets |
||||||||
| Prepaid expenses and other current assets |
$ | 40 | 1 | |||||
| Liabilities |
||||||||
| Other accruals |
3 | 1 | ||||||
|
|
||||||||
The (gains) losses from foreign currency exchange derivatives incurred, and the line item where they appear on our consolidated income statement were:
| Millions of Dollars | ||||||||||||||||
| Three Months Ended September 30 |
Nine Months Ended September 30 |
|||||||||||||||
| 2015 | 2014 | 2015 | 2014 | |||||||||||||
|
|
|
|
|
|||||||||||||
| Foreign currency transaction (gains) losses |
$ | (17 | ) | 5 | (30 | ) | (2 | ) | ||||||||
|
|
||||||||||||||||
We had the following net notional position of outstanding foreign currency exchange derivatives:
| In Millions Notional Currency |
||||||||||
| September 30 2015 |
December 31 2014 |
|||||||||
|
|
||||||||||
| Sell U.S. dollar, buy other currencies* |
USD | — | 7 | |||||||
| Buy U.S. dollar, sell other currencies** |
USD | 18 | 44 | |||||||
| Buy British pound, sell other currencies*** |
GBP | 472 | 20 | |||||||
|
|
||||||||||
| * | Primarily Canadian dollar. |
| ** | Primarily Canadian dollar and Norwegian krone. |
| *** | Primarily Canadian dollar and euro. |
Financial Instruments
We have certain financial instruments on our consolidated balance sheet related to interest-bearing time deposits and commercial paper. These held-to-maturity financial instruments are included in “Cash and cash equivalents” on our consolidated balance sheet if the maturities at the time we made the investments were 90 days or less.
14
Table of Contents
| Millions of Dollars | ||||||||
| Carrying Amount | ||||||||
| Cash and Cash Equivalents | ||||||||
| September 30 2015 |
December 31 2014 |
|||||||
|
|
|
|||||||
| Cash |
$ | 546 | 946 | |||||
| Money Market Funds |
— | 50 | ||||||
| Time deposits |
||||||||
| Remaining maturities from 1 to 90 days |
1,867 | 3,726 | ||||||
| Commercial paper |
||||||||
| Remaining maturities from 1 to 90 days |
— | 340 | ||||||
|
|
||||||||
| $ | 2,413 | 5,062 | ||||||
|
|
||||||||
Credit Risk
Financial instruments potentially exposed to concentrations of credit risk consist primarily of cash equivalents, over-the-counter (OTC) derivative contracts and trade receivables. Our cash equivalents are placed in high-quality commercial paper, money market funds, government debt securities and time deposits with major international banks and financial institutions.
The credit risk from our OTC derivative contracts, such as forwards and swaps, derives from the counterparty to the transaction. Individual counterparty exposure is managed within predetermined credit limits and includes the use of cash-call margins when appropriate, thereby reducing the risk of significant nonperformance. We also use futures, swaps and option contracts that have a negligible credit risk because these trades are cleared with an exchange clearinghouse and subject to mandatory margin requirements until settled; however, we are exposed to the credit risk of those exchange brokers for receivables arising from daily margin cash calls, as well as for cash deposited to meet initial margin requirements.
Our trade receivables result primarily from our petroleum operations and reflect a broad national and international customer base, which limits our exposure to concentrations of credit risk. The majority of these receivables have payment terms of 30 days or less, and we continually monitor this exposure and the creditworthiness of the counterparties. We do not generally require collateral to limit the exposure to loss; however, we will sometimes use letters of credit, prepayments and master netting arrangements to mitigate credit risk with counterparties that both buy from and sell to us, as these agreements permit the amounts owed by us or owed to others to be offset against amounts due us.
Certain of our derivative instruments contain provisions that require us to post collateral if the derivative exposure exceeds a threshold amount. We have contracts with fixed threshold amounts and other contracts with variable threshold amounts that are contingent on our credit rating. The variable threshold amounts typically decline for lower credit ratings, while both the variable and fixed threshold amounts typically revert to zero if we fall below investment grade. Cash is the primary collateral in all contracts; however, many also permit us to post letters of credit as collateral, such as transactions administered through the New York Mercantile Exchange.
The aggregate fair value of all derivative instruments with such credit-risk-related contingent features that were in a liability position on September 30, 2015 and December 31, 2014, was $122 million and $150 million, respectively. For these instruments, no collateral was posted as of September 30, 2015 or December 31, 2014. If our credit rating had been lowered one level from its “A” rating (per Standard and Poor’s) on September 30, 2015, we would be required to post no additional collateral to our counterparties. If we had been downgraded below investment grade, we would be required to post $122 million of additional collateral, either with cash or letters of credit.
15
Table of Contents
Note 13—Fair Value Measurement
We carry a portion of our assets and liabilities at fair value that are measured at a reporting date using an exit price (i.e., the price that would be received to sell an asset or paid to transfer a liability) and disclosed according to the quality of valuation inputs under the following hierarchy:
| • | Level 1: Quoted prices (unadjusted) in an active market for identical assets or liabilities. |
| • | Level 2: Inputs other than quoted prices that are directly or indirectly observable. |
| • | Level 3: Unobservable inputs that are significant to the fair value of assets or liabilities. |
The classification of an asset or liability is based on the lowest level of input significant to its fair value. Those that are initially classified as Level 3 are subsequently reported as Level 2 when the fair value derived from unobservable inputs is inconsequential to the overall fair value, or if corroborated market data becomes available. Assets and liabilities that are initially reported as Level 2 are subsequently reported as Level 3 if corroborated market data is no longer available. Transfers occur at the end of the reporting period. There were no material transfers in or out of Level 1 during 2015 or 2014.
Recurring Fair Value Measurement
Financial assets and liabilities reported at fair value on a recurring basis primarily include commodity derivatives and certain investments to support nonqualified deferred compensation plans. The deferred compensation investments are measured at fair value using unadjusted prices available from national securities exchanges; therefore, these assets are categorized as Level 1 in the fair value hierarchy. Level 1 derivative assets and liabilities primarily represent exchange-traded futures and options that are valued using unadjusted prices available from the underlying exchange. Level 2 derivative assets and liabilities primarily represent OTC swaps, options and forward purchase and sale contracts that are valued using adjusted exchange prices, prices provided by brokers or pricing service companies that are all corroborated by market data. Level 3 derivative assets and liabilities consist of OTC swaps, options and forward purchase and sale contracts that are long term in nature and where a significant portion of fair value is calculated from underlying market data that is not readily available. The derived value uses industry standard methodologies that may consider the historical relationships among various commodities, modeled market prices, time value, volatility factors and other relevant economic measures. The use of these inputs results in management’s best estimate of fair value. Level 3 activity was not material for all periods presented.
The following table summarizes the fair value hierarchy for gross financial assets and liabilities (i.e., unadjusted where the right of setoff exists for commodity derivatives accounted for at fair value on a recurring basis):
| Millions of Dollars | ||||||||||||||||||||||||||||||||
| September 30, 2015 | December 31, 2014 | |||||||||||||||||||||||||||||||
| Level 1 | Level 2 | Level 3 | Total | Level 1 | Level 2 | Level 3 | Total | |||||||||||||||||||||||||
|
|
|
|
|
|||||||||||||||||||||||||||||
| Assets |
||||||||||||||||||||||||||||||||
| Deferred compensation investments |
$ | 22 | — | — | 22 | 297 | — | — | 297 | |||||||||||||||||||||||
| Commodity derivatives |
1,344 | 198 | 68 | 1,610 | 4,221 | 361 | 75 | 4,657 | ||||||||||||||||||||||||
|
|
||||||||||||||||||||||||||||||||
| Total assets |
$ | 1,366 | 198 | 68 | 1,632 | 4,518 | 361 | 75 | 4,954 | |||||||||||||||||||||||
|
|
||||||||||||||||||||||||||||||||
| Liabilities |
||||||||||||||||||||||||||||||||
| Commodity derivatives |
$ | 1,378 | 228 | 15 | 1,621 | 4,200 | 354 | 16 | 4,570 | |||||||||||||||||||||||
|
|
||||||||||||||||||||||||||||||||
| Total liabilities |
$ | 1,378 | 228 | 15 | 1,621 | 4,200 | 354 | 16 | 4,570 | |||||||||||||||||||||||
|
|
||||||||||||||||||||||||||||||||
16
Table of Contents
The following table summarizes those commodity derivative balances subject to the right of setoff as presented on our consolidated balance sheet. We have elected to offset the recognized fair value amounts for multiple derivative instruments executed with the same counterparty in our financial statements when a legal right of offset exists.
| Millions of Dollars | ||||||||||||||||||||||||
| Gross | Gross | Net | Gross Amounts | |||||||||||||||||||||
| Amounts | Amounts | Amounts | Cash | without | Net | |||||||||||||||||||
| Recognized | Offset | Presented | Collateral | Right of Setoff | Amounts | |||||||||||||||||||
|
|
|
|||||||||||||||||||||||
| September 30, 2015 |
||||||||||||||||||||||||
| Assets |
$ | 1,610 | 1,435 | 175 | — | 17 | 158 | |||||||||||||||||
| Liabilities |
1,621 | 1,435 | 186 | 32 | 9 | 145 | ||||||||||||||||||
|
|
||||||||||||||||||||||||
| December 31, 2014 |
||||||||||||||||||||||||
| Assets |
$ | 4,657 | 4,352 | 305 | 8 | 28 | 269 | |||||||||||||||||
| Liabilities |
4,570 | 4,352 | 218 | 4 | 22 | 192 | ||||||||||||||||||
|
|
||||||||||||||||||||||||
At September 30, 2015 and December 31, 2014, we did not present any amounts gross on our consolidated balance sheet where we had the right of setoff.
Non-Recurring Fair Value Measurement
The following table summarizes the fair value hierarchy by major category for assets accounted for at fair value on a non-recurring basis:
| Millions of Dollars | ||||||||||||
| Fair Value Measurements Using |
||||||||||||
| Fair Value * | Level 3 Inputs |
Before- Tax Loss |
||||||||||
|
|
|
|
|
|||||||||
| September 30, 2015 |
||||||||||||
| Net PP&E (held for use) |
$ | 42 | 42 | 86 | ||||||||
| Net PP&E (unproved property) |
104 | 104 | 240 | |||||||||
|
|
||||||||||||
*Represents the fair value at the time of the impairment.
Net PP&E held for use is comprised of various producing properties impaired to their individual fair values less costs to sell. The fair values were determined by internal discounted cash flow models using estimates of future production, prices from futures exchanges and pricing service companies, costs, and a discount rate believed to be consistent with those used by principal market participants.
Net PP&E unproved property is comprised of unproved leaseholds impaired to our best estimate of sales value less costs to sell.
Reported Fair Values of Financial Instruments
We used the following methods and assumptions to estimate the fair value of financial instruments:
| • | Cash and cash equivalents: The carrying amount reported on the balance sheet approximates fair value. |
| • | Accounts and notes receivable (including long-term and related parties): The carrying amount reported on the balance sheet approximates fair value. The valuation technique and methods used to estimate the fair value of the current portion of fixed-rate related party loans is consistent with Loans and advances—related parties. |
17
Table of Contents
| • | Loans and advances—related parties: The carrying amount of floating-rate loans approximates fair value. The fair value of fixed-rate loan activity is measured using market observable data and is categorized as Level 2 in the fair value hierarchy. See Note 5—Investments, Loans and Long-Term Receivables, for additional information. |
| • | Accounts payable (including related parties) and floating-rate debt: The carrying amount of accounts payable and floating-rate debt reported on the balance sheet approximates fair value. |
| • | Fixed-rate debt: The estimated fair value of fixed-rate debt is measured using prices available from a pricing service that is corroborated by market data; therefore, these liabilities are categorized as Level 2 in the fair value hierarchy. |
The following table summarizes the net fair value of financial instruments (i.e., adjusted where the right of setoff exists for commodity derivatives):
| Millions of Dollars | ||||||||||||||||
| Carrying Amount | Fair Value | |||||||||||||||
| September 30 | December 31 | September 30 | December 31 | |||||||||||||
| 2015 | 2014 | 2015 | 2014 | |||||||||||||
|
|
|
|
|
|||||||||||||
| Financial assets |
||||||||||||||||
| Deferred compensation investments |
$ | 22 | 297 | 22 | 297 | |||||||||||
| Commodity derivatives |
175 | 297 | 175 | 297 | ||||||||||||
| Total loans and advances—related parties |
805 | 913 | 805 | 913 | ||||||||||||
| Financial liabilities |
||||||||||||||||
| Total debt, excluding capital leases |
24,063 | 21,707 | 26,460 | 25,191 | ||||||||||||
| Commodity derivatives |
154 | 214 | 154 | 214 | ||||||||||||
|
|
||||||||||||||||
Deferred compensation investments
In May 2015, we liquidated certain deferred compensation investments for proceeds of $267 million, which is included in the “Other” line within “Cash Flows From Investing Activities” on our consolidated statement of cash flows.
Note 14—Accumulated Other Comprehensive Income
Accumulated other comprehensive income (loss) in the equity section of our consolidated balance sheet included:
| Millions of Dollars | ||||||||||||
| Defined Benefit Plans |
Foreign Currency Translation |
Accumulated Other Comprehensive Loss |
||||||||||
|
|
|
|||||||||||
| December 31, 2014 |
$ | (1,261 | ) | (641 | ) | (1,902 | ) | |||||
| Other comprehensive income (loss) |
228 | (4,451 | ) | (4,223 | ) | |||||||
|
|
||||||||||||
| September 30, 2015 |
$ | (1,033 | ) | (5,092 | ) | (6,125 | ) | |||||
|
|
||||||||||||
Foreign Currency Translation decreased due to the strengthening of the U.S. dollar relative to the Canadian dollar, Australian dollar and Norwegian krone.
There were no items within accumulated other comprehensive income (loss) related to noncontrolling interests.
18
Table of Contents
The following table summarizes reclassifications out of accumulated other comprehensive income:
| Millions of Dollars | ||||||||||||||||
| Three Months Ended September 30 |
Nine Months Ended September 30 |
|||||||||||||||
| 2015 | 2014 | 2015 | 2014 | |||||||||||||
|
|
|
|
|
|||||||||||||
| Defined benefit plans |
$ | 77 | 19 | 173 | 59 | |||||||||||
|
|
||||||||||||||||
| Above amounts are included in the computation of net periodic benefit cost and are presented net of tax expense of: | $ | 44 | 11 | 96 | 34 | |||||||||||
See Note 16—Employee Benefit Plans, for additional information.
Note 15—Cash Flow Information
| Millions of Dollars | ||||||||
| Nine Months Ended September 30 |
||||||||
| 2015 | 2014 | |||||||
|
|
|
|||||||
| Cash Payments |
||||||||
| Interest |
$ | 633 | 491 | |||||
| Income taxes* |
376 | 3,359 | ||||||
|
|
||||||||
| Net Purchases of Short-Term Investments |
||||||||
| Short-term investments purchased |
$ | — | (876 | ) | ||||
| Short-term investments sold |
— | 767 | ||||||
|
|
||||||||
| $ | — | (109 | ) | |||||
|
|
||||||||
*Net of $556 million in 2015 related to a refund received from the Internal Revenue Service for 2014 overpaid taxes.
In relation to certain working capital changes associated with investing activities, we reclassified $394 million of the “Decrease in accounts payable” line within “Cash Flows From Operating Activities” to the “Working capital changes associated with investing activities” line within “Cash Flows From Investing Activities” for the nine months ended September 30, 2014. There was no impact to “Cash and Cash Equivalents at End of Period.”
19
Table of Contents
Note 16—Employee Benefit Plans
Pension and Postretirement Plans
| Millions of Dollars | ||||||||||||||||||||||||
| Pension Benefits | Other Benefits | |||||||||||||||||||||||
| 2015 | 2014 | 2015 | 2014 | |||||||||||||||||||||
|
|
|
|
|
|
|
|||||||||||||||||||
| U.S. | Int’l. | U.S. | Int’l. | |||||||||||||||||||||
|
|
|
|||||||||||||||||||||||
| Components of Net Periodic Benefit Cost |
||||||||||||||||||||||||
| Three Months Ended September 30 |
||||||||||||||||||||||||
| Service cost |
$ | 36 | 31 | 31 | 27 | 2 | 1 | |||||||||||||||||
| Interest cost |
41 | 34 | 42 | 42 | 5 | 8 | ||||||||||||||||||
| Expected return on plan assets |
(50 | ) | (44 | ) | (53 | ) | (45 | ) | — | — | ||||||||||||||
| Amortization of prior service cost (credit) |
1 | (1 | ) | 1 | (2 | ) | (6 | ) | (1 | ) | ||||||||||||||
| Recognized net actuarial loss (gain) |
27 | 20 | 19 | 14 | — | (1 | ) | |||||||||||||||||
| Settlements |
79 | — | — | — | — | — | ||||||||||||||||||
| Curtailment loss |
35 | — | — | — | — | — | ||||||||||||||||||
|
|
||||||||||||||||||||||||
| Net periodic benefit cost |
$ | 169 | 40 | 40 | 36 | 1 | 7 | |||||||||||||||||
|
|
||||||||||||||||||||||||
| Nine Months Ended September 30 |
||||||||||||||||||||||||
| Service cost |
$ | 108 | 94 | 93 | 83 | 3 | 2 | |||||||||||||||||
| Interest cost |
120 | 102 | 124 | 126 | 19 | 22 | ||||||||||||||||||
| Expected return on plan assets |
(157 | ) | (131 | ) | (159 | ) | (137 | ) | — | — | ||||||||||||||
| Amortization of prior service cost (credit) |
4 | (5 | ) | 4 | (6 | ) | (9 | ) | (3 | ) | ||||||||||||||
| Recognized net actuarial loss (gain) |
84 | 62 | 57 | 43 | 1 | (2 | ) | |||||||||||||||||
| Settlements |
131 | — | — | — | — | — | ||||||||||||||||||
| Curtailment loss |
35 | — | — | — | — | — | ||||||||||||||||||
|
|
||||||||||||||||||||||||
| Net periodic benefit cost |
$ | 325 | 122 | 119 | 109 | 14 | 19 | |||||||||||||||||
|
|
||||||||||||||||||||||||
During the first nine months of 2015, we contributed $65 million to our domestic benefit plans and $83 million to our international benefit plans. In 2015, we expect to contribute approximately $100 million to our domestic qualified and nonqualified pension and postretirement benefit plans and $120 million to our international qualified and nonqualified pension and postretirement benefit plans.
We recognized a proportionate share of prior actuarial losses from other comprehensive income as pension settlement expense of $79 million and $131 million for the three- and nine-month periods ended September 30, 2015, respectively, related to the U.S. qualified pension plan and certain U.S. nonqualified supplemental retirement plans.
As part of the ongoing restructuring program in the United States, we concluded that actions taken during the three-month period ended September 30, 2015, would result in a significant reduction of future services of active employees in the U.S. qualified pension plan and a U.S. nonqualified supplemental retirement plan. As a result, we recognized an increase in the benefit obligation and a proportionate share of prior service cost from other comprehensive income as a curtailment loss of $35 million on the U.S. qualified pension plan during the three-month period ended September 30, 2015.
In conjunction with the significant reduction of active employees, the net pension benefit obligation of the U.S. qualified pension plan was remeasured. At the measurement date, the net pension liability increased by $181 million to $876 million, resulting in a corresponding decrease to other comprehensive income. Additionally, the pension benefit obligation of a U.S. nonqualified supplemental retirement plan was remeasured. At the measurement date, the pension benefit obligation increased $53 million to $472 million, resulting in a corresponding decrease in other comprehensive income.
20
Table of Contents
During the three-month period ended September 30, 2015, there was an amendment to the U.S. other postretirement benefit plan. The benefit obligation decreased by $163 million for changes in the plan made to retiree medical benefits. The $163 million decrease consists of $149 million related to the discontinuation of all company premium cost-sharing contributions to the post-65 retiree medical plan after December 31, 2025, and $14 million associated with new participants in the post-65 retiree medical plan after December 31, 2015, no longer being eligible for any company premium cost-sharing contributions. In conjunction with the recognition of the changes in the amendment, the benefit obligation was remeasured but did not result in additional significant change.
During the nine-month period ended September 30, 2015, in addition to the amendment to the U.S. other postretirement benefit plan described above, there was an amendment made to retiree medical benefits that resulted in a decrease of the benefit obligation by $140 million. This decrease consists of $91 million related to cost sharing changes for retirees and $49 million associated with excluding employees and retirees of Phillips 66 who were not enrolled in a ConocoPhillips retiree medical plan as of July 1, 2015. The measurements of the accumulated postretirement benefit obligation for the post-65 retiree medical plan assumed a health care cost trend rate of 2 percent in 2015 that increases to 5 percent in 2018.
Due to an ongoing restructuring program in the Europe segment, we recognized additional expense of $15 million and $75 million, respectively, during the three- and nine-month periods ended September 30, 2015, associated with employee special termination benefits, of which approximately 62 percent is expected to be recovered from joint venture partners.
Severance Accrual
As a result of the current business environment’s impact on our operating and capital plans, a reduction in our overall employee workforce is ongoing during 2015. Severance accruals of $202 million and $290 million were recorded during the three- and nine-month periods ended September 30, 2015, respectively. The following table summarizes our severance accrual activity for the nine-month period ended September 30, 2015:
| Millions of Dollars | ||||
| Balance at December 31, 2014 |
$ | 61 | ||
| Accruals |
290 | |||
| Accrual reversals |
(2 | ) | ||
| Benefit payments |
(99 | ) | ||
| Foreign currency translation adjustments |
(6 | ) | ||
|
|
||||
| Balance at September 30, 2015 |
$ | 244 | ||
|
|
||||
Of the remaining balance at September 30, 2015, $201 million is classified as short-term.
21
Table of Contents
Note 17—Related Party Transactions
We consider our equity method investments to be related parties. Significant transactions with related parties were:
| Millions of Dollars | ||||||||||||||||
| Three Months Ended September 30 |
Nine Months Ended September 30 |
|||||||||||||||
| 2015 | 2014 | 2015 | 2014 | |||||||||||||
|
|
|
|
|
|
|
|
|
|||||||||
| Operating revenues and other income |
$ | 28 | 32 | 80 | 89 | |||||||||||
| Purchases |
25 | 47 | 72 | 147 | ||||||||||||
| Operating expenses and selling, general and administrative expenses |
18 | 21 | 53 | 53 | ||||||||||||
| Net interest income* |
(3 | ) | (12 | ) | (7 | ) | (36 | ) | ||||||||
|
|
||||||||||||||||
*We paid interest to, or received interest from, various affiliates. See Note 5—Investments, Loans and Long-Term Receivables, for additional information on loans to affiliated companies.
Note 18—Segment Disclosures and Related Information
We explore for, produce, transport and market crude oil, bitumen, natural gas, LNG and natural gas liquids on a worldwide basis. We manage our operations through six operating segments, which are primarily defined by geographic region: Alaska, Lower 48, Canada, Europe, Asia Pacific and Middle East, and Other International.
After agreeing to sell our Nigeria business in 2012, we completed the sale in the third quarter of 2014. Results for these operations have been reported as discontinued operations in all periods presented.
Corporate and Other represents costs not directly associated with an operating segment, such as most interest expense, corporate overhead and certain technology activities, including licensing revenues. Corporate assets include all cash and cash equivalents.
We evaluate performance and allocate resources based on net income attributable to ConocoPhillips. Intersegment sales are at prices that approximate market.
Effective November 1, 2015, the Other International and Europe segments will be restructured to align with changes to our internal organization structure. The Libya business will be moved from the Other International segment to the Europe segment, which will be renamed Europe and North Africa. Accordingly, results of operations for the Other International and Europe segments will be revised for current and prior periods beginning in the fourth quarter of 2015. There is no expected impact on our consolidated financial statements, and the impact on our segment presentation is expected to be immaterial.
22
Table of Contents
Analysis of Results by Operating Segment
| Millions of Dollars | ||||||||||||||||
| Three Months Ended September 30 |
Nine Months Ended September 30 |
|||||||||||||||
| 2015 | 2014 | 2015 | 2014 | |||||||||||||
|
|
|
|
|
|||||||||||||
| Sales and Other Operating Revenues |
||||||||||||||||
| Alaska |
$ | 1,067 | 2,094 | 3,455 | 6,687 | |||||||||||
|
|
||||||||||||||||
| Lower 48 |
3,106 | 5,082 | 9,421 | 17,196 | ||||||||||||
| Intersegment eliminations |
(15 | ) | (28 | ) | (50 | ) | (88 | ) | ||||||||
|
|
||||||||||||||||
| Lower 48 |
3,091 | 5,054 | 9,371 | 17,108 | ||||||||||||
|
|
||||||||||||||||
| Canada |
576 | 1,086 | 1,932 | 4,113 | ||||||||||||
| Intersegment eliminations |
(76 | ) | (128 | ) | (265 | ) | (618 | ) | ||||||||
|
|
||||||||||||||||
| Canada |
500 | 958 | 1,667 | 3,495 | ||||||||||||
|
|
||||||||||||||||
| Europe |
1,480 | 2,241 | 4,809 | 8,195 | ||||||||||||
| Intersegment eliminations |
(2 | ) | (3 | ) | (3 | ) | (47 | ) | ||||||||
|
|
||||||||||||||||
| Europe |
1,478 | 2,238 | 4,806 | 8,148 | ||||||||||||
|
|
||||||||||||||||
| Asia Pacific and Middle East |
1,074 | 1,658 | 3,748 | 5,758 | ||||||||||||
| Other International |
— | 60 | (5 | ) | 65 | |||||||||||
| Corporate and Other |
52 | 18 | 229 | 55 | ||||||||||||
|
|
||||||||||||||||
| Consolidated sales and other operating revenues |
$ | 7,262 | 12,080 | 23,271 | 41,316 | |||||||||||
|
|
||||||||||||||||
| Net Income (Loss) Attributable to ConocoPhillips |
||||||||||||||||
| Alaska |
$ | 53 | 473 | 393 | 1,698 | |||||||||||
| Lower 48 |
(852 | ) | 32 | (1,550 | ) | 621 | ||||||||||
| Canada |
(145 | ) | 307 | (469 | ) | 845 | ||||||||||
| Europe |
(4 | ) | 213 | 670 | 819 | |||||||||||
| Asia Pacific and Middle East |
258 | 749 | 981 | 2,336 | ||||||||||||
| Other International |
(43 | ) | (18 | ) | (284 | ) | 74 | |||||||||
| Corporate and Other |
(338 | ) | (130 | ) | (719 | ) | (616 | ) | ||||||||
| Discontinued operations |
— | 1,078 | — | 1,131 | ||||||||||||
|
|
||||||||||||||||
| Consolidated net income (loss) attributable to ConocoPhillips |
$ | (1,071 | ) | 2,704 | (978 | ) | 6,908 | |||||||||
|
|
||||||||||||||||
| Millions of Dollars | ||||||||
| September 30 2015 |
December 31 2014 |
|||||||
|
|
|
|
|
|||||
| Total Assets |
||||||||
| Alaska |
$ | 13,212 | 12,655 | |||||
| Lower 48 |
28,629 | 30,185 | ||||||
| Canada |
18,999 | 21,764 | ||||||
| Europe |
14,269 | 16,125 | ||||||
| Asia Pacific and Middle East |
24,114 | 25,976 | ||||||
| Other International |
1,674 | 1,961 | ||||||
| Corporate and Other |
5,052 | 7,815 | ||||||
| Discontinued operations |
— | 58 | ||||||
|
|
||||||||
| Consolidated total assets |
$ | 105,949 | 116,539 | |||||
|
|
||||||||
23
Table of Contents
Note 19—Income Taxes
Our effective tax rates from continuing operations for the third quarter and first nine months of 2015 were 39 percent and 57 percent, respectively, compared with 35 percent and 40 percent for the same periods of 2014. The increase in the effective tax rate for the third quarter of 2015 was primarily due to the absence of the effects of our election of the fair market value method of apportioning interest expense in the third quarter of 2014. The increase in the effective tax rate for the first nine months of 2015 was primarily due to our overall pre-tax loss position; the effect of the first quarter 2015 U.K. tax law change generating a tax benefit, discussed below; the absence of our election of the fair market value method of apportioning interest expense in the third quarter of 2014; and pre-tax losses in low tax jurisdictions. These items were partially offset by the second quarter 2015 Canadian tax law change, discussed below, and pre-tax income in high tax jurisdictions.
In the United Kingdom, legislation was enacted on March 26, 2015, to decrease the overall U.K. upstream corporation tax rate from 62 percent to 50 percent effective January 1, 2015. As a result, a $555 million net tax benefit for revaluing the U.K. deferred tax liability is reflected in the “Provision (benefit) for income taxes” line on our consolidated income statement.
In Canada, legislation was enacted on June 29, 2015, to increase the overall Canadian corporation tax rate from 25 percent to 27 percent effective July 1, 2015. As a result, a $129 million net tax expense for revaluing the Canadian deferred tax liability is reflected in the “Provision (benefit) for income taxes” line on our consolidated income statement.
Note 20—New Accounting Standards
In May 2014, the Financial Accounting Standards Board (FASB) issued Accounting Standards Update (ASU) No. 2014-09, “Revenue from Contracts with Customers” (ASU No. 2014-09), which outlines a single comprehensive model for entities to use in accounting for revenue arising from contracts with customers. This ASU supersedes the revenue recognition requirements in FASB Accounting Standards Codification Topic 605, “Revenue Recognition,” and most industry-specific guidance. This ASU sets forth a five-step model for determining when and how revenue is recognized. Under the model, an entity will be required to recognize revenue to depict the transfer of goods or services to a customer at an amount reflecting the consideration it expects to receive in exchange for those goods or services. Additional disclosures will be required to describe the nature, amount, timing and uncertainty of revenue and cash flows arising from customer contracts.
In August 2015, the FASB issued ASU No. 2015-14, “Deferral of the Effective Date,” which defers the effective date of ASU No. 2014-09. The ASU is now effective for interim and annual periods beginning after December 15, 2017. Early adoption is permitted for interim and annual periods beginning after December 15, 2016. Entities may choose to adopt the standard using either a full retrospective approach or a modified retrospective approach. We are currently evaluating the impact of the adoption of this ASU.
In February 2015, the FASB issued ASU No. 2015-02, “Amendments to the Consolidation Analysis,” which amends existing requirements applicable to reporting entities that are required to evaluate whether certain legal entities should be consolidated. The ASU is effective for interim and annual periods beginning after December 15, 2015. Early adoption is permitted. Entities may choose to adopt the standard using either a full retrospective approach or a modified retrospective approach. We do not expect the adoption of this ASU to have a material impact on our consolidated financial statements and disclosures.
24
Table of Contents
Supplementary Information—Condensed Consolidating Financial Information
We have various cross guarantees among ConocoPhillips, ConocoPhillips Company and ConocoPhillips Canada Funding Company I, with respect to publicly held debt securities. ConocoPhillips Company is 100 percent owned by ConocoPhillips. ConocoPhillips Canada Funding Company I is an indirect, 100 percent owned subsidiary of ConocoPhillips Company. ConocoPhillips and ConocoPhillips Company have fully and unconditionally guaranteed the payment obligations of ConocoPhillips Canada Funding Company I, with respect to its publicly held debt securities. Similarly, ConocoPhillips has fully and unconditionally guaranteed the payment obligations of ConocoPhillips Company with respect to its publicly held debt securities. In addition, ConocoPhillips Company has fully and unconditionally guaranteed the payment obligations of ConocoPhillips with respect to its publicly held debt securities. All guarantees are joint and several. The following condensed consolidating financial information presents the results of operations, financial position and cash flows for:
| • | ConocoPhillips, ConocoPhillips Company and ConocoPhillips Canada Funding Company I (in each case, reflecting investments in subsidiaries utilizing the equity method of accounting). |
| • | All other nonguarantor subsidiaries of ConocoPhillips. |
| • | The consolidating adjustments necessary to present ConocoPhillips’ results on a consolidated basis. |
This condensed consolidating financial information should be read in conjunction with the accompanying consolidated financial statements and notes.
In April 2015, ConocoPhillips received a $2 billion return of capital from ConocoPhillips Company to settle certain accumulated intercompany balances. The transaction had no impact on our consolidated financial statements.
25
Table of Contents
| Millions of Dollars | ||||||||||||||||||||||||
| Three Months Ended September 30, 2015 | ||||||||||||||||||||||||
| Income Statement | ConocoPhillips | ConocoPhillips Company |
ConocoPhillips Canada Funding Company I |
All Other Subsidiaries |
Consolidating Adjustments |
Total Consolidated |
||||||||||||||||||
| Revenues and Other Income |
||||||||||||||||||||||||
| Sales and other operating revenues |
$ | — | 2,954 | — | 4,308 | — | 7,262 | |||||||||||||||||
| Equity in earnings of affiliates |
(973 | ) | (19 | ) | — | 559 | 656 | 223 | ||||||||||||||||
| Gain on dispositions |
— | 5 | — | 13 | — | 18 | ||||||||||||||||||
| Other income (loss) |
(1 | ) | (8 | ) | — | 13 | — | 4 | ||||||||||||||||
| Intercompany revenues |
19 | 81 | 60 | 862 | (1,022 | ) | — | |||||||||||||||||
|
|
||||||||||||||||||||||||
| Total Revenues and Other Income |
(955 | ) | 3,013 | 60 | 5,755 | (366 | ) | 7,507 | ||||||||||||||||
|
|
||||||||||||||||||||||||
| Costs and Expenses |
||||||||||||||||||||||||
| Purchased commodities |
— | 2,623 | — | 1,501 | (855 | ) | 3,269 | |||||||||||||||||
| Production and operating expenses |
— | 390 | — | 1,447 | (3 | ) | 1,834 | |||||||||||||||||
| Selling, general and administrative expenses |
1 | 239 | — | 53 | — | 293 | ||||||||||||||||||
| Exploration expenses |
— | 761 | — | 300 | — | 1,061 | ||||||||||||||||||
| Depreciation, depletion and amortization |
— | 322 | — | 1,949 | — | 2,271 | ||||||||||||||||||
| Impairments |
— | 1 | — | 23 | — | 24 | ||||||||||||||||||
| Taxes other than income taxes |
— | 38 | — | 168 | — | 206 | ||||||||||||||||||
| Accretion on discounted liabilities |
— | 14 | — | 108 | — | 122 | ||||||||||||||||||
| Interest and debt expense |
121 | 113 | 57 | 113 | (164 | ) | 240 | |||||||||||||||||
| Foreign currency transaction (gains) losses |
47 | — | (359 | ) | 240 | — | (72 | ) | ||||||||||||||||
|
|
||||||||||||||||||||||||
| Total Costs and Expenses |
169 | 4,501 | (302 | ) | 5,902 | (1,022 | ) | 9,248 | ||||||||||||||||
|
|
||||||||||||||||||||||||
| Income (loss) from continuing operations before income taxes |
(1,124 | ) | (1,488 | ) | 362 | (147 | ) | 656 | (1,741 | ) | ||||||||||||||
| Provision (benefit) for income taxes |
(53 | ) | (515 | ) | 27 | (144 | ) | — | (685 | ) | ||||||||||||||
|
|
||||||||||||||||||||||||
| Net income (loss) |
(1,071 | ) | (973 | ) | 335 | (3 | ) | 656 | (1,056 | ) | ||||||||||||||
| Less: net income attributable to noncontrolling interests |
— | — | — | (15 | ) | — | (15 | ) | ||||||||||||||||
|
|
||||||||||||||||||||||||
| Net Income (Loss) Attributable to ConocoPhillips |
$ | (1,071 | ) | (973 | ) | 335 | (18 | ) | 656 | (1,071 | ) | |||||||||||||
|
|
||||||||||||||||||||||||
| Comprehensive Income (Loss) Attributable to ConocoPhillips |
$ | (3,555 | ) | (3,457 | ) | 70 | (2,507 | ) | 5,894 | (3,555 | ) | |||||||||||||
|
|
||||||||||||||||||||||||
| Income Statement | Three Months Ended September 30, 2014 | |||||||||||||||||||||||
| Revenues and Other Income |
||||||||||||||||||||||||
| Sales and other operating revenues |
$ | — | 4,672 | — | 7,408 | — | 12,080 | |||||||||||||||||
| Equity in earnings of affiliates |
1,722 | 2,098 | — | 975 | (4,031 | ) | 764 | |||||||||||||||||
| Gain on dispositions |
— | 2 | — | 2 | — | 4 | ||||||||||||||||||
| Other income |
1 | 15 | — | 53 | — | 69 | ||||||||||||||||||
| Intercompany revenues |
20 | 104 | 72 | 1,444 | (1,640 | ) | — | |||||||||||||||||
|
|
||||||||||||||||||||||||
| Total Revenues and Other Income |
1,743 | 6,891 | 72 | 9,882 | (5,671 | ) | 12,917 | |||||||||||||||||
|
|
||||||||||||||||||||||||
| Costs and Expenses |
||||||||||||||||||||||||
| Purchased commodities |
— | 4,036 | — | 2,139 | (1,472 | ) | 4,703 | |||||||||||||||||
| Production and operating expenses |
— | 414 | — | 1,617 | 10 | 2,041 | ||||||||||||||||||
| Selling, general and administrative expenses |
2 | 136 | 1 | 65 | (1 | ) | 203 | |||||||||||||||||
| Exploration expenses |
— | 331 | — | 128 | — | 459 | ||||||||||||||||||
| Depreciation, depletion and amortization |
— | 273 | — | 1,823 | — | 2,096 | ||||||||||||||||||
| Impairments |
— | 104 | — | 4 | — | 108 | ||||||||||||||||||
| Taxes other than income taxes |
— | 69 | — | 424 | — | 493 | ||||||||||||||||||
| Accretion on discounted liabilities |
— | 14 | — | 106 | — | 120 | ||||||||||||||||||
| Interest and debt expense |
134 | 77 | 58 | 57 | (177 | ) | 149 | |||||||||||||||||
| Foreign currency transaction (gains) losses |
33 | 3 | (208 | ) | 164 | — | (8 | ) | ||||||||||||||||
|
|
||||||||||||||||||||||||
| Total Costs and Expenses |
169 | 5,457 | (149 | ) | 6,527 | (1,640 | ) | 10,364 | ||||||||||||||||
|
|
||||||||||||||||||||||||
| Income from continuing operations before income taxes |
1,574 | 1,434 | 221 | 3,355 | (4,031 | ) | 2,553 | |||||||||||||||||
| Provision (benefit) for income taxes |
(52 | ) | (288 | ) | 9 | 1,235 | — | 904 | ||||||||||||||||
|
|
||||||||||||||||||||||||
| Income From Continuing Operations |
1,626 | 1,722 | 212 | 2,120 | (4,031 | ) | 1,649 | |||||||||||||||||
| Income from discontinued operations |
1,078 | 1,078 | — | 61 | (1,139 | ) | 1,078 | |||||||||||||||||
|
|
||||||||||||||||||||||||
| Net income |
2,704 | 2,800 | 212 | 2,181 | (5,170 | ) | 2,727 | |||||||||||||||||
| Less: net income attributable to noncontrolling interests |
— | — | — | (23 | ) | — | (23 | ) | ||||||||||||||||
|
|
||||||||||||||||||||||||
| Net Income Attributable to ConocoPhillips |
$ | 2,704 | 2,800 | 212 | 2,158 | (5,170 | ) | 2,704 | ||||||||||||||||
|
|
||||||||||||||||||||||||
| Comprehensive Income Attributable to ConocoPhillips |
$ | 791 | 887 | 29 | 255 | (1,171 | ) | 791 | ||||||||||||||||
|
|
||||||||||||||||||||||||
26
Table of Contents
| Millions of Dollars | ||||||||||||||||||||||||
| Nine Months Ended September 30, 2015 | ||||||||||||||||||||||||
| Income Statement | ConocoPhillips | ConocoPhillips Company |
ConocoPhillips Canada Funding Company I |
All Other Subsidiaries |
Consolidating Adjustments |
Total Consolidated |
||||||||||||||||||
| Revenues and Other Income |
||||||||||||||||||||||||
| Sales and other operating revenues |
$ | — | 8,989 | — | 14,282 | — | 23,271 | |||||||||||||||||
| Equity in earnings of affiliates |
(712 | ) | 1,009 | — | 1,275 | (886 | ) | 686 | ||||||||||||||||
| Gain on dispositions |
— | 38 | — | 84 | — | 122 | ||||||||||||||||||
| Other income (loss) |
(1 | ) | 9 | — | 82 | — | 90 | |||||||||||||||||
| Intercompany revenues |
56 | 261 | 187 | 2,657 | (3,161 | ) | — | |||||||||||||||||
|
|
||||||||||||||||||||||||
| Total Revenues and Other Income |
(657 | ) | 10,306 | 187 | 18,380 | (4,047 | ) | 24,169 | ||||||||||||||||
|
|
||||||||||||||||||||||||
| Costs and Expenses |
||||||||||||||||||||||||
| Purchased commodities |
— | 7,751 | — | 4,605 | (2,620 | ) | 9,736 | |||||||||||||||||
| Production and operating expenses |
— | 1,185 | — | 4,286 | (37 | ) | 5,434 | |||||||||||||||||
| Selling, general and administrative expenses |
7 | 521 | — | 151 | (9 | ) | 670 | |||||||||||||||||
| Exploration expenses |
— | 1,104 | — | 988 | — | 2,092 | ||||||||||||||||||
| Depreciation, depletion and amortization |
— | 882 | — | 5,849 | — | 6,731 | ||||||||||||||||||
| Impairments |
— | 1 | — | 117 | — | 118 | ||||||||||||||||||
| Taxes other than income taxes |
— | 157 | — | 498 | — | 655 | ||||||||||||||||||
| Accretion on discounted liabilities |
— | 43 | — | 322 | — | 365 | ||||||||||||||||||
| Interest and debt expense |
363 | 325 | 171 | 288 | (495 | ) | 652 | |||||||||||||||||
| Foreign currency transaction (gains) losses |
94 | — | (591 | ) | 401 | — | (96 | ) | ||||||||||||||||
|
|
||||||||||||||||||||||||
| Total Costs and Expenses |
464 | 11,969 | (420 | ) | 17,505 | (3,161 | ) | 26,357 | ||||||||||||||||
|
|
||||||||||||||||||||||||
| Income (loss) from continuing operations before income taxes |
(1,121 | ) | (1,663 | ) | 607 | 875 | (886 | ) | (2,188 | ) | ||||||||||||||
| Provision (benefit) for income taxes |
(143 | ) | (951 | ) | 18 | (178 | ) | — | (1,254 | ) | ||||||||||||||
|
|
||||||||||||||||||||||||
| Net income (loss) |
(978 | ) | (712 | ) | 589 | 1,053 | (886 | ) | (934 | ) | ||||||||||||||
| Less: net income attributable to noncontrolling interests |
— | — | — | (44 | ) | — | (44 | ) | ||||||||||||||||
|
|
||||||||||||||||||||||||
| Net Income (Loss) Attributable to ConocoPhillips |
$ | (978 | ) | (712 | ) | 589 | 1,009 | (886 | ) | (978 | ) | |||||||||||||
|
|
||||||||||||||||||||||||
| Comprehensive Income (Loss) Attributable to ConocoPhillips |
$ | (5,201 | ) | (4,935 | ) | 67 | (3,393 | ) | 8,261 | (5,201 | ) | |||||||||||||
|
|
||||||||||||||||||||||||
| Income Statement | Nine Months Ended September 30, 2014 | |||||||||||||||||||||||
| Revenues and Other Income |
||||||||||||||||||||||||
| Sales and other operating revenues |
$ | — | 15,920 | — | 25,396 | — | 41,316 | |||||||||||||||||
| Equity in earnings of affiliates |
6,053 | 7,063 | — | 2,235 | (13,343 | ) | 2,008 | |||||||||||||||||
| Gain on dispositions |
— | 3 | — | 17 | — | 20 | ||||||||||||||||||
| Other income |
1 | 60 | — | 261 | — | 322 | ||||||||||||||||||
| Intercompany revenues |
59 | 369 | 214 | 4,685 | (5,327 | ) | — | |||||||||||||||||
|
|
||||||||||||||||||||||||
| Total Revenues and Other Income |
6,113 | 23,415 | 214 | 32,594 | (18,670 | ) | 43,666 | |||||||||||||||||
|
|
||||||||||||||||||||||||
| Costs and Expenses |
||||||||||||||||||||||||
| Purchased commodities |
— | 13,984 | — | 8,060 | (4,719 | ) | 17,325 | |||||||||||||||||
| Production and operating expenses |
— | 1,255 | — | 4,751 | (40 | ) | 5,966 | |||||||||||||||||
| Selling, general and administrative expenses |
8 | 416 | 1 | 193 | (15 | ) | 603 | |||||||||||||||||
| Exploration expenses |
— | 713 | — | 559 | — | 1,272 | ||||||||||||||||||
| Depreciation, depletion and amortization |
— | 776 | — | 5,282 | — | 6,058 | ||||||||||||||||||
| Impairments |
— | 122 | — | 4 | — | 126 | ||||||||||||||||||
| Taxes other than income taxes |
— | 233 | — | 1,523 | — | 1,756 | ||||||||||||||||||
| Accretion on discounted liabilities |
— | 43 | — | 314 | — | 357 | ||||||||||||||||||
| Interest and debt expense |
441 | 209 | 174 | 204 | (553 | ) | 475 | |||||||||||||||||
| Foreign currency transaction (gains) losses |
36 | 5 | (196 | ) | 172 | — | 17 | |||||||||||||||||
|
|
||||||||||||||||||||||||
| Total Costs and Expenses |
485 | 17,756 | (21 | ) | 21,062 | (5,327 | ) | 33,955 | ||||||||||||||||
|
|
||||||||||||||||||||||||
| Income from continuing operations before income taxes |
5,628 | 5,659 | 235 | 11,532 | (13,343 | ) | 9,711 | |||||||||||||||||
| Provision (benefit) for income taxes |
(149 | ) | (394 | ) | 7 | 4,416 | — | 3,880 | ||||||||||||||||
|
|
||||||||||||||||||||||||
| Income From Continuing Operations |
5,777 | 6,053 | 228 | 7,116 | (13,343 | ) | 5,831 | |||||||||||||||||
| Income from discontinued operations |
1,131 | 1,131 | — | 114 | (1,245 | ) | 1,131 | |||||||||||||||||
|
|
||||||||||||||||||||||||
| Net income |
6,908 | 7,184 | 228 | 7,230 | (14,588 | ) | 6,962 | |||||||||||||||||
| Less: net income attributable to noncontrolling interests |
— | — | — | (54 | ) | — | (54 | ) | ||||||||||||||||
|
|
||||||||||||||||||||||||
| Net Income Attributable to ConocoPhillips |
$ | 6,908 | 7,184 | 228 | 7,176 | (14,588 | ) | 6,908 | ||||||||||||||||
|
|
||||||||||||||||||||||||
| Comprehensive Income Attributable to ConocoPhillips |
$ | 5,491 | 5,767 | 24 | 5,730 | (11,521 | ) | 5,491 | ||||||||||||||||
|
|
||||||||||||||||||||||||
27
Table of Contents
| Millions of Dollars | ||||||||||||||||||||||||
| September 30, 2015 | ||||||||||||||||||||||||
| Balance Sheet | ConocoPhillips | ConocoPhillips Company |
ConocoPhillips Canada Funding Company I |
All Other Subsidiaries |
Consolidating Adjustments |
Total Consolidated |
||||||||||||||||||
| Assets |
||||||||||||||||||||||||
| Cash and cash equivalents |
$ | — | 23 | 9 | 2,381 | — | 2,413 | |||||||||||||||||
| Accounts and notes receivable |
16 | 1,794 | 22 | 6,886 | (4,254 | ) | 4,464 | |||||||||||||||||
| Inventories |
— | 158 | — | 985 | — | 1,143 | ||||||||||||||||||
| Prepaid expenses and other current assets |
1 | 716 | 27 | 944 | (44 | ) | 1,644 | |||||||||||||||||
|
|
||||||||||||||||||||||||
| Total Current Assets |
17 | 2,691 | 58 | 11,196 | (4,298 | ) | 9,664 | |||||||||||||||||
| Investments, loans and long-term receivables* |
48,575 | 68,865 | 3,630 | 29,886 | (127,454 | ) | 23,502 | |||||||||||||||||
| Net properties, plants and equipment |
— | 9,558 | — | 62,270 | — | 71,828 | ||||||||||||||||||
| Other assets |
8 | 221 | 422 | 1,098 | (794 | ) | 955 | |||||||||||||||||
|
|
||||||||||||||||||||||||
| Total Assets |
$ | 48,600 | 81,335 | 4,110 | 104,450 | (132,546 | ) | 105,949 | ||||||||||||||||
|
|
||||||||||||||||||||||||
| Liabilities and Stockholders’ Equity |
||||||||||||||||||||||||
| Accounts payable |
$ | — | 5,021 | 16 | 4,428 | (4,254 | ) | 5,211 | ||||||||||||||||
| Short-term debt |
(9 | ) | 1 | 5 | 178 | — | 175 | |||||||||||||||||
| Accrued income and other taxes |
— | 118 | — | 541 | — | 659 | ||||||||||||||||||
| Employee benefit obligations |
— | 618 | — | 243 | — | 861 | ||||||||||||||||||
| Other accruals |
101 | 487 | 79 | 758 | (44 | ) | 1,381 | |||||||||||||||||
|
|
||||||||||||||||||||||||
| Total Current Liabilities |
92 | 6,245 | 100 | 6,148 | (4,298 | ) | 8,287 | |||||||||||||||||
| Long-term debt |
7,516 | 10,660 | 2,967 | 3,573 | — | 24,716 | ||||||||||||||||||
| Asset retirement obligations and accrued environmental costs |
— | 1,300 | — | 8,979 | — | 10,279 | ||||||||||||||||||
| Deferred income taxes |
— | — | — | 13,398 | (81 | ) | 13,317 | |||||||||||||||||
| Employee benefit obligations |
— | 2,058 | — | 806 | — | 2,864 | ||||||||||||||||||
| Other liabilities and deferred credits* |
3,342 | 7,409 | 964 | 16,115 | (25,899 | ) | 1,931 | |||||||||||||||||
|
|
||||||||||||||||||||||||
| Total Liabilities |
10,950 | 27,672 | 4,031 | 49,019 | (30,278 | ) | 61,394 | |||||||||||||||||
| Retained earnings |
34,265 | 20,734 | (506 | ) | 18,231 | (31,938 | ) | 40,786 | ||||||||||||||||
| Other common stockholders’ equity |
3,385 | 32,929 | 585 | 36,855 | (70,330 | ) | 3,424 | |||||||||||||||||
| Noncontrolling interests |
— | — | — | 345 | — | 345 | ||||||||||||||||||
|
|
||||||||||||||||||||||||
| Total Liabilities and Stockholders’ Equity |
$ | 48,600 | 81,335 | 4,110 | 104,450 | (132,546 | ) | 105,949 | ||||||||||||||||
|
|
||||||||||||||||||||||||
| *Includes intercompany loans. |
||||||||||||||||||||||||
| Balance Sheet | December 31, 2014 | |||||||||||||||||||||||
| Assets |
||||||||||||||||||||||||
| Cash and cash equivalents |
$ | — | 770 | 7 | 4,285 | — | 5,062 | |||||||||||||||||
| Accounts and notes receivable |
20 | 2,813 | 22 | 6,671 | (2,719 | ) | 6,807 | |||||||||||||||||
| Inventories |
— | 281 | — | 1,050 | — | 1,331 | ||||||||||||||||||
| Prepaid expenses and other current assets |
6 | 754 | 15 | 1,138 | (45 | ) | 1,868 | |||||||||||||||||
|
|
||||||||||||||||||||||||
| Total Current Assets |
26 | 4,618 | 44 | 13,144 | (2,764 | ) | 15,068 | |||||||||||||||||
| Investments, loans and long-term receivables* |
55,568 | 70,732 | 3,965 | 32,467 | (137,593 | ) | 25,139 | |||||||||||||||||
| Net properties, plants and equipment |
— | 9,730 | — | 65,714 | — | 75,444 | ||||||||||||||||||
| Other assets |
40 | 67 | 208 | 1,338 | (765 | ) | 888 | |||||||||||||||||
|
|
||||||||||||||||||||||||
| Total Assets |
55,634 | 85,147 | 4,217 | 112,663 | (141,122 | ) | 116,539 | |||||||||||||||||
|
|
||||||||||||||||||||||||
| Liabilities and Stockholders’ Equity |
||||||||||||||||||||||||
| Accounts payable |
1 | 4,149 | 14 | 6,581 | (2,719 | ) | 8,026 | |||||||||||||||||
| Short-term debt |
(5 | ) | 6 | 5 | 176 | — | 182 | |||||||||||||||||
| Accrued income and other taxes |
— | 117 | — | 934 | — | 1,051 | ||||||||||||||||||
| Employee benefit obligations |
— | 595 | — | 283 | — | 878 | ||||||||||||||||||
| Other accruals |
170 | 337 | 71 | 868 | (46 | ) | 1,400 | |||||||||||||||||
|
|
||||||||||||||||||||||||
| Total Current Liabilities |
166 | 5,204 | 90 | 8,842 | (2,765 | ) | 11,537 | |||||||||||||||||
| Long-term debt |
7,541 | 8,197 | 2,974 | 3,671 | — | 22,383 | ||||||||||||||||||
| Asset retirement obligations and accrued environmental costs |
— | 1,328 | — | 9,319 | — | 10,647 | ||||||||||||||||||
| Deferred income taxes |
— | 265 | — | 14,811 | (6 | ) | 15,070 | |||||||||||||||||
| Employee benefit obligations |
— | 2,162 | — | 802 | — | 2,964 | ||||||||||||||||||
| Other liabilities and deferred credits* |
2,577 | 7,391 | 1,142 | 17,218 | (26,663 | ) | 1,665 | |||||||||||||||||
|
|
||||||||||||||||||||||||
| Total Liabilities |
10,284 | 24,547 | 4,206 | 54,663 | (29,434 | ) | 64,266 | |||||||||||||||||
| Retained earnings |
37,983 | 21,448 | (1,096 | ) | 17,355 | (31,186 | ) | 44,504 | ||||||||||||||||
| Other common stockholders’ equity |
7,367 | 39,152 | 1,107 | 40,283 | (80,502 | ) | 7,407 | |||||||||||||||||
| Noncontrolling interests |
— | — | — | 362 | — | 362 | ||||||||||||||||||
|
|
||||||||||||||||||||||||
| Total Liabilities and Stockholders’ Equity |
$ | 55,634 | 85,147 | 4,217 | 112,663 | (141,122 | ) | 116,539 | ||||||||||||||||
|
|
||||||||||||||||||||||||
| *Includes intercompany loans. |
||||||||||||||||||||||||
28
Table of Contents
| Millions of Dollars | ||||||||||||||||||||||||
| Nine Months Ended September 30, 2015 | ||||||||||||||||||||||||
| Statement of Cash Flows | ConocoPhillips | ConocoPhillips Company |
ConocoPhillips Canada Funding Company I |
All Other Subsidiaries |
Consolidating Adjustments |
Total Consolidated |
||||||||||||||||||
| Cash Flows From Operating Activities |
||||||||||||||||||||||||
| Net Cash Provided by (Used in) Operating Activities |
(263 | ) | (110 | ) | 2 | 6,165 | 182 | 5,976 | ||||||||||||||||
|
|
||||||||||||||||||||||||
| Cash Flows From Investing Activities |
||||||||||||||||||||||||
| Capital expenditures and investments |
— | (2,346 | ) | — | (6,640 | ) | 1,073 | (7,913 | ) | |||||||||||||||
| Working capital changes associated with investing activities |
— | (15 | ) | — | (827 | ) | — | (842 | ) | |||||||||||||||
| Proceeds from asset dispositions |
2,000 | 190 | — | 232 | (2,099 | ) | 323 | |||||||||||||||||
| Long-term advances/loans—related parties |
— | (248 | ) | — | (1,973 | ) | 2,221 | — | ||||||||||||||||
| Collection of advances/loans—related parties |
— | — | — | 205 | (100 | ) | 105 | |||||||||||||||||
| Intercompany cash management |
764 | (892 | ) | — | 128 | — | — | |||||||||||||||||
| Other |
— | 297 | — | 1 | — | 298 | ||||||||||||||||||
|
|
||||||||||||||||||||||||
| Net Cash Provided by (Used in) Investing Activities |
2,764 | (3,014 | ) | — | (8,874 | ) | 1,095 | (8,029 | ) | |||||||||||||||
|
|
||||||||||||||||||||||||
| Cash Flows From Financing Activities |
||||||||||||||||||||||||
| Issuance of debt |
— | 4,471 | — | 248 | (2,221 | ) | 2,498 | |||||||||||||||||
| Repayment of debt |
— | (100 | ) | — | (92 | ) | 100 | (92 | ) | |||||||||||||||
| Issuance of company common stock |
237 | — | — | — | (306 | ) | (69 | ) | ||||||||||||||||
| Dividends paid |
(2,741 | ) | — | — | (124 | ) | 124 | (2,741 | ) | |||||||||||||||
| Other |
3 | (1,994 | ) | — | 915 | 1,026 | (50 | ) | ||||||||||||||||
|
|
||||||||||||||||||||||||
| Net Cash Provided by (Used in) Financing Activities |
(2,501 | ) | 2,377 | — | 947 | (1,277 | ) | (454 | ) | |||||||||||||||
|
|
||||||||||||||||||||||||
| Effect of Exchange Rate Changes on Cash and Cash Equivalents |
— | — | — | (142 | ) | — | (142 | ) | ||||||||||||||||
|
|
||||||||||||||||||||||||
| Net Change in Cash and Cash Equivalents |
— | (747 | ) | 2 | (1,904 | ) | — | (2,649 | ) | |||||||||||||||
| Cash and cash equivalents at beginning of period |
— | 770 | 7 | 4,285 | — | 5,062 | ||||||||||||||||||
|
|
||||||||||||||||||||||||
| Cash and Cash Equivalents at End of Period |
$ | — | 23 | 9 | 2,381 | — | 2,413 | |||||||||||||||||
|
|
||||||||||||||||||||||||
| Statement of Cash Flows | Nine Months Ended September 30, 2014* | |||||||||||||||||||||||
| Cash Flows From Operating Activities |
||||||||||||||||||||||||
| Net cash provided by (used in) continuing operating activities |
$ | 14,722 | (180 | ) | 10 | 14,063 | (15,014 | ) | 13,601 | |||||||||||||||
| Net cash provided by discontinued operations |
— | 202 | — | 408 | (453 | ) | 157 | |||||||||||||||||
|
|
||||||||||||||||||||||||
| Net Cash Provided by Operating Activities |
14,722 | 22 | 10 | 14,471 | (15,467 | ) | 13,758 | |||||||||||||||||
|
|
||||||||||||||||||||||||
| Cash Flows From Investing Activities |
||||||||||||||||||||||||
| Capital expenditures and investments |
— | (3,235 | ) | — | (11,132 | ) | 1,638 | (12,729 | ) | |||||||||||||||
| Working capital changes associated with investing activities |
— | 34 | — | 360 | — | 394 | ||||||||||||||||||
| Proceeds from asset dispositions |
16,912 | 1,386 | — | 105 | (16,969 | ) | 1,434 | |||||||||||||||||
| Net purchases of short-term investments |
— | — | — | (109 | ) | — | (109 | ) | ||||||||||||||||
| Long-term advances/loans—related parties |
— | (635 | ) | — | (7 | ) | 642 | — | ||||||||||||||||
| Collection of advances/loans—related parties |
— | 47 | — | 112 | (16 | ) | 143 | |||||||||||||||||
| Intercompany cash management |
(28,922 | ) | 33,392 | — | (4,470 | ) | — | — | ||||||||||||||||
| Other |
— | (429 | ) | — | (25 | ) | — | (454 | ) | |||||||||||||||
|
|
||||||||||||||||||||||||
| Net cash provided by (used in) continuing investing activities |
(12,010 | ) | 30,560 | — | (15,166 | ) | (14,705 | ) | (11,321 | ) | ||||||||||||||
| Net cash provided by (used in) discontinued operations |
— | 133 | — | (73 | ) | (133 | ) | (73 | ) | |||||||||||||||
|
|
||||||||||||||||||||||||
| Net Cash Provided by (Used in) Investing Activities |
(12,010 | ) | 30,693 | — | (15,239 | ) | (14,838 | ) | (11,394 | ) | ||||||||||||||
|
|
||||||||||||||||||||||||
| Cash Flows From Financing Activities |
||||||||||||||||||||||||
| Issuance of debt |
— | — | — | 642 | (642 | ) | — | |||||||||||||||||
| Repayment of debt |
(400 | ) | (16 | ) | — | (105 | ) | 16 | (505 | ) | ||||||||||||||
| Issuance of company common stock |
308 | — | — | — | (281 | ) | 27 | |||||||||||||||||
| Dividends paid |
(2,618 | ) | (15,088 | ) | — | (458 | ) | 15,546 | (2,618 | ) | ||||||||||||||
| Other |
(2 | ) | (16,863 | ) | — | 1,514 | 15,331 | (20 | ) | |||||||||||||||
|
|
||||||||||||||||||||||||
| Net cash provided by (used in) continuing financing activities |
(2,712 | ) | (31,967 | ) | — | 1,593 | 29,970 | (3,116 | ) | |||||||||||||||
| Net cash used in discontinued operations |
— | — | — | (335 | ) | 335 | — | |||||||||||||||||
|
|
||||||||||||||||||||||||
| Net Cash Provided by (Used in) Financing Activities |
(2,712 | ) | (31,967 | ) | — | 1,258 | 30,305 | (3,116 | ) | |||||||||||||||
|
|
||||||||||||||||||||||||
| Effect of Exchange Rate Changes on Cash and Cash Equivalents |
— | — | — | (86 | ) | — | (86 | ) | ||||||||||||||||
|
|
||||||||||||||||||||||||
| Net Change in Cash and Cash Equivalents |
— | (1,252 | ) | 10 | 404 | — | (838 | ) | ||||||||||||||||
| Cash and cash equivalents at beginning of period |
— | 2,434 | 229 | 3,583 | — | 6,246 | ||||||||||||||||||
|
|
||||||||||||||||||||||||
| Cash and Cash Equivalents at End of Period |
$ | — | 1,182 | 239 | 3,987 | — | 5,408 | |||||||||||||||||
|
|
||||||||||||||||||||||||
| *Certain amounts have been reclassified to conform to current-period presentation. See Note 15—Cash Flow Information, in the Notes to the Consolidated Financial Statements. |
| |||||||||||||||||||||||
29
Table of Contents
| Item 2. | MANAGEMENT’S DISCUSSION AND ANALYSIS OF FINANCIAL CONDITION AND RESULTS OF OPERATIONS |
Management’s Discussion and Analysis is the Company’s analysis of its financial performance and of significant trends that may affect future performance. It should be read in conjunction with the financial statements and notes. It contains forward-looking statements including, without limitation, statements relating to the Company’s plans, strategies, objectives, expectations and intentions that are made pursuant to the “safe harbor” provisions of the Private Securities Litigation Reform Act of 1995. The words “anticipate,” “estimate,” “believe,” “budget,” “continue,” “could,” “intend,” “may,” “plan,” “potential,” “predict,” “seek,” “should,” “will,” “would,” “expect,” “objective,” “projection,” “forecast,” “goal,” “guidance,” “outlook,” “effort,” “target” and similar expressions identify forward-looking statements. The Company does not undertake to update, revise or correct any of the forward-looking information unless required to do so under the federal securities laws. Readers are cautioned that such forward-looking statements should be read in conjunction with the Company’s disclosures under the heading: “CAUTIONARY STATEMENT FOR THE PURPOSES OF THE ‘SAFE HARBOR’ PROVISIONS OF THE PRIVATE SECURITIES LITIGATION REFORM ACT OF 1995,” beginning on page 50.
Due to discontinued operations reporting, income (loss) from continuing operations is more representative of ConocoPhillips’ earnings. The terms “earnings” and “loss” as used in Management’s Discussion and Analysis refer to income (loss) from continuing operations.
BUSINESS ENVIRONMENT AND EXECUTIVE OVERVIEW
ConocoPhillips is the world’s largest independent exploration and production (E&P) company, based on proved reserves and production of liquids and natural gas. Headquartered in Houston, Texas, we had operations and activities in 25 countries, approximately 17,800 employees worldwide and total assets of $106 billion as of September 30, 2015.
Basis of Presentation
Effective November 1, 2015, the Other International and Europe segments will be restructured to align with changes to our internal organization structure. The Libya business will be moved from the Other International segment to the Europe segment, which will be renamed Europe and North Africa. Accordingly, results of operations for the Other International and Europe segments will be revised for current and prior periods beginning in the fourth quarter of 2015. There is no expected impact on our consolidated financial statements, and the impact on our segment presentation is expected to be immaterial.
Overview
We are an independent E&P company focused on exploring for, developing and producing crude oil and natural gas globally. Our diverse portfolio primarily includes resource-rich North American unconventional assets; oil sands assets in Canada; lower-risk legacy assets in North America, Europe, Asia and Australia; several major international developments; and an inventory of global conventional and unconventional exploration prospects.
The energy landscape has changed dramatically in the past year. Increased supply and lower forecasted demand growth have caused crude oil and natural gas prices to decline substantially, with significant uncertainty around the timing of a rebound. Nevertheless, our value proposition to our shareholders remains unchanged. Our goal is to deliver a compelling dividend, affordable growth and maintain financial strength. We are taking aggressive actions to position the company for success in a low, more volatile price environment. We are focused on achieving cash flow neutrality (cash from continuing operations sufficient to fund our dividend and capital program) in 2017. Cash flow neutrality will be a function of price and capital flexibility. Consistent with our commitment to offer a compelling dividend, we modestly raised the quarterly dividend and paid dividends on our common stock of $0.9 billion, in the third quarter of 2015. We believe we can deliver on our value proposition and
30
Table of Contents
performance goals by safely executing the business, increasing our capital flexibility, optimizing our portfolio and lowering our cost structure with sustainable changes.
Safely executing the business
In the third quarter of 2015, we exceeded our production expectation due to efficient execution of turnarounds and strong well performance. We are on track to exceed our full-year 2015 volume target through investments in our conventional and unconventional assets. Through the nine-month period of 2015, our project startups include Eldfisk II, Brodgar H3 subsea tie-back, Enochdhu and Surmont 2. We achieved project startup at CD5 and Drill Site 2S, in Alaska, during October, and we are progressing toward first cargo in Australia Pacific LNG Pty Ltd (APLNG) by year end.
Increasing our capital flexibility
We participate in a commodity price-driven and capital-intensive industry, which requires significant investment in major projects across the globe. Given our view of greater price volatility, we see value in having a significant inventory of shorter cycle time and low-cost-of-supply opportunities in our resource base. As our major capital projects start up, we plan to direct a higher percentage of our capital to unconventionals, while maintaining the flexibility to respond to changing market conditions. We use a disciplined approach to set our capital plans and to allocate capital to the highest quality investment opportunities in our portfolio.
In response to a view that low commodity prices would modestly recover in 2015, we set our three-year operating plan for 2015 to 2017 at $11.5 billion of anticipated annual capital spending. We have reduced our 2015 capital guidance to $10.2 billion, as prices have remained low through the nine-month period of 2015, reflecting a slower recovery. Capital spending in 2016 and 2017 could be adjusted based on commodity prices.
Through the nine-month period of 2015, we incurred $7.9 billion of capital expenditures, or 77 percent of our updated capital guidance.
Portfolio optimization
In line with our focus on capital flexibility, we announced plans to reduce future capital spending in our deepwater exploration program in the third quarter of 2015. As a result of this decision, we have recognized cancellation costs and written off capitalized rig spend in relation to the termination of our Gulf of Mexico deepwater drillship contract with Ensco. We have also recorded an impairment for the associated carrying value of capitalized undeveloped leasehold cost on certain Gulf of Mexico leases where we have decided not to conduct further activity. We continue to market certain non-core assets, with an approach of exiting businesses that will not compete for funding in our portfolio.
Lowering our cost structure with sustainable changes
We are taking decisive actions to achieve sustainable operating cost reductions across the business. We have targeted a $1 billion reduction in operating costs in 2016, compared with 2014. Operating costs include production and operating expense; selling, general and administrative expense; and exploration expense excluding dry hole and leasehold impairment expense.
We believe these tenets, combined with our strong balance sheet, position us to successfully navigate the volatile price environment.
Business Environment
In the first half of 2014, strong crude oil prices were supported by geopolitical tensions impacting supplies, as well as global oil demand growth. This was followed by an abrupt decline in prices beginning in the third quarter of 2014, as surging production growth from U.S. tight oil and the decision by the Organization of Petroleum Exporting Countries (OPEC) to maintain production outweighed fears of supply disruptions. These developments, combined with lower forecasts for global oil demand growth, caused crude oil prices to plummet to near five-year lows at the end of 2014. Prices have remained significantly lower through the third quarter of 2015, relative to the same period in 2014.
31
Table of Contents
The energy industry has periodically experienced this type of extreme volatility due to fluctuating supply and demand conditions. Dramatic swings in commodity prices impact our profitability and cash flows, but are beyond our control. Commodity prices are the most significant factor impacting our profitability and the related reinvestment of operating cash flows into our business. Among other dynamics that could influence world energy markets and commodity prices are global economic health, supply disruptions or fears thereof caused by civil unrest or military conflicts, actions taken by OPEC, environmental laws, tax regulations, governmental policies and weather-related disruptions. North America’s energy landscape has been transformed from resource scarcity to an abundance of supply, primarily due to advances in technology responsible for the rapid growth of unconventional production, successful exploration and development in the deepwater Gulf of Mexico, and rising production from the Canadian oil sands. In order to navigate through a volatile market, our strategy is to maintain a strong balance sheet, sustainably lower cost structure, and a diverse low cost-of-supply portfolio that can provide the resilience to withstand challenging business cycles.
Our earnings generally correlate with industry price levels for crude oil and natural gas. These are commodity products, the prices of which are subject to factors external to the company and over which we have no control. The following graph depicts the trend in average benchmark prices for West Texas Intermediate (WTI) crude oil, Dated Brent crude oil and U.S. Henry Hub (HH) natural gas:
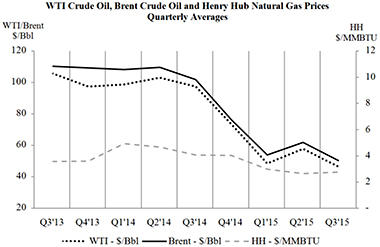
Brent crude oil prices averaged $50.26 per barrel in the third quarter of 2015, a decrease of 51 percent compared with $101.85 per barrel in the third quarter of 2014, and a decrease of 19 percent compared with $61.92 per barrel in the second quarter of 2015. Industry crude prices for WTI averaged $46.37 per barrel in the third quarter of 2015, a decrease of 52 percent compared with $97.48 per barrel in the third quarter of 2014, and a decrease of 20 percent compared with $57.84 per barrel in the second quarter of 2015. Crude oil prices have remained under pressure through the third quarter of 2015 due to continued growth in global production that has outpaced demand growth, as evidenced by a large observed inventory increase.
Henry Hub natural gas prices averaged $2.77 per million British thermal units (MMBTU) in the third quarter of 2015, a decrease of 32 percent compared with $4.07 per MMBTU in the third quarter of 2014, and an increase of 5 percent compared with $2.65 in the second quarter of 2015. Natural gas prices remained under pressure as production growth continued and U.S. underground gas storage inventories have risen toward the top of the five-year range over the past few months.
Bitumen prices remained low in the third quarter of 2015, mainly as a result of decreased global crude oil prices. Our realized bitumen price was $17.53 per barrel in the third quarter of 2015, a decrease of 72 percent compared with $62.49 in the third quarter of 2014. The third quarter realized price decreased 47 percent from
32
Table of Contents
$33.30 per barrel in the second quarter of 2015 as both WTI and light-to-heavy differentials weakened. Our total average realized price was $32.91 per barrel of oil equivalent (BOE) in the third quarter of 2015, a decrease of 49 percent compared with $64.78 per BOE in the third quarter of 2014. In the first nine months of 2015, our total realized price was $36.31 per BOE, a decrease of 47 percent compared with $68.71 in the first nine months of 2014. Both the quarterly and annual price decreases reflect lower average realized prices for crude oil, natural gas, bitumen and natural gas liquids.
Key Operating and Financial Highlights
Significant highlights during the third quarter of 2015 included the following:
| • | Increased quarterly dividend to $0.74 per share in July. |
| • | Accelerated capital reductions; further reduced 2015 capital expenditures guidance from $11.0 billion to $10.2 billion. |
| • | Achieved third-quarter production of 1,554 thousand barrels of oil equivalent per day (MBOED); on track to exceed 2015 production guidance. |
| • | Four percent year-over-year production growth from continuing operations, adjusted for Libya, downtime and dispositions. |
| • | Achieved first oil at Surmont 2 in Canada during the quarter, as well as CD5 and Drill Site 2S in Alaska in October; on track for first cargo at APLNG by year end. |
| • | Successfully completed major turnarounds in the Alaska, Europe, and Asia Pacific and Middle East segments. |
Outlook
Production and Capital Guidance
Fourth-quarter production guidance is 1,585 to 1,625 MBOED. Full-year 2015 production guidance is 1,585 to 1,595 MBOED, resulting in expected year-over-year growth of 3 to 4 percent from continuing operations excluding Libya.
We have further reduced our 2015 capital expenditures guidance to $10.2 billion compared with initial guidance of $11.5 billion. Approximately, half of these reductions are due to market factors, while the remainder are the result of discretionary actions.
We expect to release guidance on our 2016 capital and operating plan in December 2015.
Marketing Activities
In line with our objective to continuously optimize our portfolio, we are currently marketing certain non-core assets. We expect to generate between $1 billion and $2 billion in proceeds from asset sales in 2015.
Unproved Property Impairments
As we optimize our investments and exercise capital flexibility in response to low commodity prices, it is reasonably likely we will incur future unproved property impairments. It is not reasonably practicable to quantify the financial impact, but the impact could be material to our results of operations for the period in which the property impairments are incurred.
Reserve Replacement
Proved reserve estimates require economic production based on historical 12-month, first-of-month, average prices and current costs. Therefore, as prices and cost levels change from year to year, the estimate of proved reserves also changes. Generally, our proved reserves decrease as prices decline and increase as prices rise. The major decline in commodity prices during 2015 is expected to lead to a reduction of approximately 5 percent to our year-end 2014 proved reserves. We do not expect these price-related revisions and 2015
33
Table of Contents
production to be fully offset by reserve additions. As a result, we expect our 2015 organic reserve replacement ratio to be significantly below 100 percent. These reserve estimates are subject to change based on commodity prices for the remainder of 2015 as well as capital spending levels, timing of project approvals and other factors. We expect our proved reserves to fluctuate directionally with commodity prices over time.
Prior Year Tax Benefit
In the fourth quarter of 2015, we expect to file refund claims for prior years electing the fair market value method of apportioning interest expense in the United States. There is ongoing analysis required to complete and file the amended tax returns. Based on information currently available, this election is expected to generate a tax benefit between $150 million and $250 million, to be recorded in the fourth quarter of 2015.
RESULTS OF OPERATIONS
Unless otherwise indicated, discussion of results for the three- and nine-month periods ended September 30, 2015, is based on a comparison with the corresponding period of 2014.
Consolidated Results
A summary of the company’s income (loss) from continuing operations by business segment follows:
| Millions of Dollars | ||||||||||||||||
| Three Months Ended September 30 |
Nine Months Ended September 30 |
|||||||||||||||
| 2015 | 2014 | 2015 | 2014 | |||||||||||||
|
|
|
|
|
|||||||||||||
| Alaska |
$ | 53 | 473 | 393 | 1,698 | |||||||||||
| Lower 48 |
(852 | ) | 32 | (1,550 | ) | 621 | ||||||||||
| Canada |
(145 | ) | 307 | (469 | ) | 845 | ||||||||||
| Europe |
(4 | ) | 213 | 670 | 819 | |||||||||||
| Asia Pacific and Middle East |
273 | 772 | 1,025 | 2,390 | ||||||||||||
| Other International |
(43 | ) | (18 | ) | (284 | ) | 74 | |||||||||
| Corporate and Other |
(338 | ) | (130 | ) | (719 | ) | (616 | ) | ||||||||
|
|
||||||||||||||||
| Income (loss) from continuing operations |
$ | (1,056 | ) | 1,649 | (934 | ) | 5,831 | |||||||||
|
|
||||||||||||||||
Earnings for ConocoPhillips decreased 164 and 116 percent for the third quarter of 2015 and the nine-month period ended September 30, 2015, respectively. The decrease in both periods primarily resulted from lower commodity prices.
In addition, earnings were negatively impacted by:
| • | Higher exploration expense, primarily from the Gulf of Mexico deepwater drillship and related contract termination costs recognized in the third quarter of 2015, and increased unproved property impairments and dry hole expenses. |
| • | Higher depreciation, depletion and amortization (DD&A) mainly from increased production in both periods of 2015. |
| • | Restructuring charges of $227 million after-tax incurred in the nine-month period of 2015. |
| • | The absence of a $154 million after-tax benefit in the second quarter of 2014 associated with the favorable resolution of a contingent liability. |
| • | An adverse deferred tax charge of $129 million, from increased corporate tax rates in Canada in the second quarter of 2015. |
34
Table of Contents
These items were partially offset by:
| • | Lower production taxes due to reduced commodity prices. |
| • | Higher crude oil, bitumen, liquefied natural gas (LNG) and natural gas sales volumes. |
| • | A $555 million net deferred tax benefit resulting from a change in the U.K. tax rate in the first quarter of 2015. |
| • | Lower operating expense. |
| • | The absence of a $151 million after-tax impairment as a result of reduced volume forecasts on proved properties and associated undeveloped leasehold costs in the Lower 48 in the third quarter of 2014. |
| • | Higher licensing revenues. |
| • | The absence of a $109 million after-tax impairment of undeveloped leasehold costs associated with the offshore Canada Amauligak discovery, Arctic Islands and Beaufort properties in the second quarter of 2014. |
See the “Segment Results” section for additional information.
Income Statement Analysis
Sales and other operating revenues decreased 40 percent in the third quarter and 44 percent in the nine-month period of 2015, mainly as a result of lower prices across all commodities. Lower prices in both periods were partly offset by higher crude oil and LNG sales volumes.
Equity in earnings of affiliates decreased 71 percent in the third quarter and 66 percent in the nine-month period of 2015, primarily as a result of lower earnings from the FCCL Partnership and Qatar Liquefied Gas Company Limited (3) (QG3) due to lower commodity prices. The decrease in both periods of 2015 was also partly offset by benefits of foreign exchange-related impacts from APLNG.
Gain on dispositions increased $102 million in the nine-month period of 2015, primarily as a result of gains realized from unproved land swaps in Canada in the first and second quarters of 2015. Additional gains realized in the nine-month period of 2015 resulted from the first quarter disposition of our Ozona/Midland tight oil assets in the Lower 48.
Other income decreased 72 percent in the nine-month period of 2015. The decrease was mainly due to the absence of income from the second and third quarters of 2014 related to the resolution of a contingent liability in the Other International segment and a legal arbitration settlement in Asia Pacific and Middle East, respectively.
Purchased commodities decreased 30 percent in the third quarter and 44 percent in the nine-month period of 2015, largely as a result of lower natural gas prices and the absence of a $130 million loss in the Lower 48 related to transportation and storage capacity agreements recognized in the first quarter of 2014.
Production and operating expenses decreased 10 percent in the third quarter of 2015, primarily as a result of lower operating expense levels, including turnaround costs incurred in 2014 in the Asia Pacific and Middle East segment and favorable foreign exchange-related impacts, partially offset by $124 million of restructuring expenses.
Selling, general and administrative expenses increased 11 percent in the nine-month period of 2015, primarily due to $284 million in restructuring and pension settlement expenses incurred in 2015, partially offset by lower staff and compensation-plan costs.
35
Table of Contents
Exploration expenses increased 131 percent in the third quarter and 64 percent in the nine-month period of 2015, primarily due to $383 million, mainly recorded to other exploration expense, for the Gulf of Mexico deepwater drillship and related contract termination costs, and $240 million for the write-down of Gulf of Mexico leases for which we have no plans to conduct further activity. Exploration expenses in the third quarter of 2015 also increased due to unproved property impairments from our decision to relinquish our Palangkaraya Production Sharing Contract in Indonesia, dry hole expenses recorded for four wells in Malaysia, and rig storage costs for the Athena drilling rig in Angola.
For the nine-month period, exploration expense was also increased due to dry hole costs associated with the Vali-1 and Omosi-1 wells offshore Angola and the Harrier prospect in the Gulf of Mexico, along with undeveloped leasehold impairments in Angola and Poland. The increased expense was partly offset by the absence of a $145 million impairment of undeveloped leasehold costs associated with the offshore Canada Amauligak discovery, Arctic Islands and Beaufort properties in the second quarter of 2014.
DD&A increased 11 percent in the nine-month period of 2015. The increase was mainly associated with higher production volumes in the Lower 48 and Asia Pacific and Middle East. Additionally, a significant decline in the 12-month rolling-average price used to calculate proved reserves resulted in an increase through the third quarter of 2015 of approximately $178 million in the Lower 48 and Alaska combined. The increases were partly offset by reserve additions in the Lower 48.
Taxes other than income taxes decreased 58 percent in the third quarter and 63 percent in the nine-month period of 2015, mainly as a result of lower commodity prices in Alaska, Lower 48 and Asia Pacific and Middle East.
Interest and debt expense increased 37 percent for the nine-month period of 2015, mainly as a result of lower capitalized interest from projects completed and increased debt levels in 2015.
Foreign currency transaction losses decreased by $113 million for the nine-month period of 2015, mainly as a result of the weakening of the Malaysian ringgit to the U.S. dollar and the subsequent remeasurement of capital accruals and deferred tax balances. Foreign currency transaction losses also decreased due to the remeasurement of a pension liability in 2015 and the absence of value added tax receivable losses from 2014, both in Asia Pacific and Middle East.
See Note 19—Income Taxes, in the Notes to Consolidated Financial Statements, for information regarding our provision for income taxes and effective tax rate.
36
Table of Contents
Summary Operating Statistics
| Three Months Ended September 30 |
Nine Months Ended September 30 |
|||||||||||||||
| 2015 | 2014 | 2015 | 2014 | |||||||||||||
|
|
|
|
|
|||||||||||||
| Average Net Production |
||||||||||||||||
| Crude oil (MBD)* |
577 | 561 | 602 | 585 | ||||||||||||
| Natural gas liquids (MBD) |
156 | 157 | 157 | 161 | ||||||||||||
| Bitumen (MBD) |
157 | 124 | 150 | 125 | ||||||||||||
| Natural gas (MMCFD)** |
3,984 | 3,833 | 4,059 | 3,911 | ||||||||||||
|
|
||||||||||||||||
| Total Production (MBOED) |
1,554 | 1,481 | 1,586 | 1,523 | ||||||||||||
|
|
||||||||||||||||
| Dollars Per Unit | ||||||||||||||||
| Average Sales Prices |
||||||||||||||||
| Crude oil (per barrel) |
$ | 46.41 | 96.63 | 50.83 | 100.56 | |||||||||||
| Natural gas liquids (per barrel) |
15.54 | 37.83 | 18.24 | 41.46 | ||||||||||||
| Bitumen (per barrel) |
17.53 | 62.49 | 22.17 | 61.65 | ||||||||||||
| Natural gas (per thousand cubic feet) |
3.87 | 5.96 | 4.16 | 6.77 | ||||||||||||
|
|
||||||||||||||||
| Millions of Dollars | ||||||||||||||||
| Exploration Expenses |
||||||||||||||||
| General administrative, geological and geophysical, and |
||||||||||||||||
| lease rentals |
$ | 536 | 194 | 854 | 604 | |||||||||||
| Leasehold impairment |
377 | 179 | 662 | 414 | ||||||||||||
| Dry holes |
148 | 86 | 576 | 254 | ||||||||||||
|
|
||||||||||||||||
| $ | 1,061 | 459 | 2,092 | 1,272 | ||||||||||||
|
|
||||||||||||||||
Excludes discontinued operations.
*Thousands of barrels per day.
**Millions of cubic feet per day. Represents quantities available for sale and excludes gas equivalent of natural gas liquids included above.
We explore for, produce, transport and market crude oil, bitumen, natural gas, LNG and natural gas liquids on a worldwide basis. At September 30, 2015, our operations were producing in the United States, Norway, the United Kingdom, Canada, Australia, Timor-Leste, Indonesia, China, Malaysia, Qatar, Libya and Russia.
Total production from continuing operations, including Libya, increased 5 percent in the third quarter of 2015. Average liquids production increased 6 percent in the third quarter of 2015. Total production from continuing operations, including Libya, and average liquids production, both increased 4 percent in the nine-month period of 2015. The increase in total average production in both periods primarily resulted from additional production from major developments, including tight oil plays in the Lower 48; Gumusut in Malaysia; APLNG in Australia; Foster Creek Phase F in Canada; and the Jasmine Field and Greater Britannia projects in the U.K. Improved well performance, mostly in western Canada, the Lower 48 and Norway, and lower turnaround activity in 2015 also contributed to higher production in both periods. These increases were largely offset by normal field decline. In the third quarter of 2015, we achieved production of 1,554 MBOED. Adjusted for downtime and dispositions of 25 MBOED, our production from continuing operations, excluding Libya, increased by 56 MBOED, or 4 percent, compared with the third quarter of 2014.
37
Table of Contents
Segment Results
Alaska
| Three Months Ended September 30 |
Nine Months Ended September 30 |
|||||||||||||||
| 2015 | 2014 | 2015 | 2014 | |||||||||||||
|
|
|
|
|
|||||||||||||
| Income From Continuing Operations (millions of dollars) |
$ | 53 | 473 | 393 | 1,698 | |||||||||||
|
|
||||||||||||||||
| Average Net Production |
||||||||||||||||
| Crude oil (MBD) |
144 | 139 | 154 | 162 | ||||||||||||
| Natural gas liquids (MBD) |
10 | 8 | 12 | 13 | ||||||||||||
| Natural gas (MMCFD) |
34 | 48 | 42 | 50 | ||||||||||||
|
|
||||||||||||||||
| Total Production (MBOED) |
160 | 155 | 173 | 183 | ||||||||||||
|
|
||||||||||||||||
| Average Sales Prices |
||||||||||||||||
| Crude oil (dollars per barrel) |
$ | 50.48 | 102.36 | 54.18 | 106.06 | |||||||||||
| Natural gas (dollars per thousand cubic feet) |
4.26 | 5.47 | 4.35 | 5.55 | ||||||||||||
|
|
||||||||||||||||
The Alaska segment primarily explores for, produces, transports and markets crude oil, natural gas liquids, natural gas and LNG. As of September 30, 2015, Alaska contributed 18 percent of our worldwide liquids production and 1 percent of our worldwide natural gas production.
Earnings from Alaska decreased 89 percent in the third quarter and 77 percent for the nine-month period of 2015. The decrease in earnings in both periods was primarily due to lower crude oil prices, partly offset by lower production taxes. The earnings decrease in the third quarter of 2015 was partially offset by increased sales volumes.
Average production increased 3 percent in the third quarter of 2015 compared with the same period in 2014, primarily due to lower planned downtime activity. Average production decreased 5 percent for the nine-month period of 2015, mainly due to normal field decline and downtime.
Our plans to drill an exploration well in the Chukchi Sea continue to be evaluated in light of the uncertainties of evolving federal regulatory requirements, operational permitting standards and the current market environment. The total capitalized costs associated with the Chukchi leases were approximately $634 million as of September 30, 2015.
38
Table of Contents
Lower 48
| Three Months Ended September 30 |
Nine Months Ended September 30 |
|||||||||||||||
| 2015 | 2014 | 2015 | 2014 | |||||||||||||
|
|
|
|
|
|||||||||||||
| Income (Loss) From Continuing Operations (millions of dollars) |
$ | (852 | ) | 32 | (1,550 | ) | 621 | |||||||||
|
|
||||||||||||||||
| Average Net Production |
||||||||||||||||
| Crude oil (MBD) |
213 | 191 | 207 | 184 | ||||||||||||
| Natural gas liquids (MBD) |
95 | 104 | 95 | 99 | ||||||||||||
| Natural gas (MMCFD) |
1,457 | 1,485 | 1,487 | 1,482 | ||||||||||||
|
|
||||||||||||||||
| Total Production (MBOED) |
551 | 543 | 550 | 530 | ||||||||||||
|
|
||||||||||||||||
| Average Sales Prices |
||||||||||||||||
| Crude oil (dollars per barrel) |
$ | 41.56 | 87.91 | 44.84 | 91.02 | |||||||||||
| Natural gas liquids (dollars per barrel) |
12.55 | 30.67 | 14.45 | 32.51 | ||||||||||||
| Natural gas (dollars per thousand cubic feet) |
2.65 | 3.96 | 2.54 | 4.48 | ||||||||||||
|
|
||||||||||||||||
As of September 30, 2015, the Lower 48 contributed 33 percent of our worldwide liquids production and 37 percent of our worldwide natural gas production. The Lower 48 segment consists of operations located in the U.S. Lower 48 states and exploration activities in the Gulf of Mexico.
Lower 48 reported losses of $852 million in the third quarter and $1,550 million in the nine-month period of 2015, an $884 million and $2,171 million decrease compared with the same periods of 2014, respectively. Earnings decreases in both periods were primarily due to lower commodity prices and higher DD&A from increased production. These decreases were partly offset by higher production volumes; lower production taxes; and the absence of a $151 million after-tax impairment recognized in the third quarter of 2014 as a result of reduced volume forecasts on proved properties and the associated undeveloped leasehold costs. Additionally, earnings in the third quarter of 2015 decreased due to after-tax charges of $246 million related to the termination of our Gulf of Mexico deepwater drillship contract with Ensco and $154 million for a write-down of Gulf of Mexico leases for which we have no plans to conduct further activity.
In the third quarter of 2015, our average realized crude oil price of $41.56 per barrel was 10 percent less than WTI of $46.37 per barrel. The differential is driven primarily by local market dynamics in the Gulf Coast, Bakken and the Permian Basin, and may remain relatively wide in the near-term.
Total average production increased 1 percent in the third quarter and 4 percent for the nine-month period of 2015. Average crude oil production increased 12 percent and 13 percent over the same periods, respectively. The increases in both periods were mainly attributable to new production and well performance, primarily from Eagle Ford, Bakken and the Permian Basin, partially offset by normal field decline.
39
Table of Contents
Canada
| Three Months Ended September 30 |
Nine Months Ended September 30 |
|||||||||||||||
| 2015 | 2014 | 2015 | 2014 | |||||||||||||
|
|
|
|
|
|||||||||||||
| Income (Loss) From Continuing Operations (millions of dollars) |
$ | (145 | ) | 307 | (469 | ) | 845 | |||||||||
|
|
||||||||||||||||
| Average Net Production |
||||||||||||||||
| Crude oil (MBD) |
12 | 13 | 13 | 13 | ||||||||||||
| Natural gas liquids (MBD) |
27 | 21 | 26 | 24 | ||||||||||||
| Bitumen (MBD) |
||||||||||||||||
| Consolidated operations |
12 | 9 | 12 | 12 | ||||||||||||
| Equity affiliates |
145 | 115 | 138 | 113 | ||||||||||||
|
|
||||||||||||||||
| Total bitumen |
157 | 124 | 150 | 125 | ||||||||||||
| Natural gas (MMCFD) |
712 | 707 | 739 | 709 | ||||||||||||
|
|
||||||||||||||||
| Total Production (MBOED) |
315 | 276 | 312 | 280 | ||||||||||||
|
|
||||||||||||||||
| Average Sales Prices |
||||||||||||||||
| Crude oil (dollars per barrel) |
$ | 38.44 | 82.48 | 40.71 | 83.00 | |||||||||||
| Natural gas liquids (dollars per barrel) |
14.50 | 45.29 | 17.30 | 49.53 | ||||||||||||
| Bitumen (dollars per barrel) |
||||||||||||||||
| Consolidated operations |
22.67 | 64.95 | 29.13 | 64.95 | ||||||||||||
| Equity affiliates |
17.16 | 62.30 | 21.57 | 61.30 | ||||||||||||
| Total bitumen |
17.53 | 62.49 | 22.17 | 61.65 | ||||||||||||
| Natural gas (dollars per thousand cubic feet) |
1.94 | 3.50 | 2.01 | 4.47 | ||||||||||||
|
|
||||||||||||||||
Our Canadian operations mainly consist of natural gas fields in western Canada and oil sands developments in the Athabasca Region of northeastern Alberta. As of September 30, 2015, Canada contributed 21 percent of our worldwide liquids production and 18 percent of our worldwide natural gas production.
Canada operations reported losses of $145 million in the third quarter and $469 million for the nine-month period of 2015, a $452 million and $1,314 million decrease compared with the same periods of 2014, respectively. The decrease in earnings in both periods was primarily due to lower commodity prices, mainly bitumen and natural gas. The earnings decrease was partly offset by higher bitumen production volumes and lower operating expenses and DD&A, both primarily from favorable foreign currency impacts.
Earnings in the nine-month period were also reduced due to the $136 million impact of a 2 percent increase in Alberta corporate tax rates on deferred taxes, partly offset by the absence of a $109 million after-tax impairment of undeveloped leasehold costs in 2014, associated with the offshore Amauligak discovery, Arctic Islands and other Beaufort properties.
Total average production increased 14 percent in the third quarter and 11 percent for the nine-month period of 2015, while bitumen production increased 27 percent and 20 percent over the same periods, respectively. The increases in total production in both periods were mainly attributable to strong well performance in western Canada, reduced turnaround activity, the continued ramp-up of production from Foster Creek Phase F, lower royalty impacts, and strong plant performance at Foster Creek and Christina Lake. These increases were partly offset by normal field decline.
40
Table of Contents
Europe
| Three Months Ended September 30 |
Nine Months Ended September 30 |
|||||||||||||||
| 2015 | 2014 | 2015 | 2014 | |||||||||||||
|
|
|
|
|
|||||||||||||
| Income (Loss) From Continuing Operations (millions of dollars) |
$ | (4 | ) | 213 | 670 | 819 | ||||||||||
|
|
||||||||||||||||
| Average Net Production |
||||||||||||||||
| Crude oil (MBD) |
116 | 119 | 119 | 126 | ||||||||||||
| Natural gas liquids (MBD) |
7 | 8 | 7 | 8 | ||||||||||||
| Natural gas (MMCFD) |
415 | 404 | 463 | 452 | ||||||||||||
|
|
||||||||||||||||
| Total Production (MBOED) |
192 | 194 | 203 | 209 | ||||||||||||
|
|
||||||||||||||||
| Average Sales Prices |
||||||||||||||||
| Crude oil (dollars per barrel) |
$ | 49.86 | 103.17 | 55.65 | 107.79 | |||||||||||
| Natural gas liquids (dollars per barrel) |
24.74 | 54.47 | 28.20 | 57.62 | ||||||||||||
| Natural gas (dollars per thousand cubic feet) |
7.11 | 7.86 | 7.58 | 9.32 | ||||||||||||
|
|
||||||||||||||||
The Europe segment consists of operations principally located in the Norwegian and U.K. sectors of the North Sea, as well as exploration activities in the Barents Sea, offshore Norway. As of September 30, 2015, our Europe operations contributed 14 percent of our worldwide liquids production and 11 percent of our worldwide natural gas production.
Earnings for Europe operations decreased 102 percent in the third quarter and 18 percent for the nine-month period of 2015, respectively. Earnings in both periods were primarily impacted by lower crude oil prices as well as lower sales volumes in the U.K. For the nine-month period of 2015, earnings additionally decreased due to a $33 million after-tax property impairment given lower natural gas prices. The nine-month earnings decrease was partly offset by a $555 million net deferred tax benefit as a result of a change in the U.K. tax rate, effective at the beginning of 2015.
Average production decreased 1 percent in the third quarter and 3 percent for the nine-month period of 2015, compared to the same periods in 2014. The decrease in both periods was mostly due to normal field decline, partly offset by continued ramp-up of production from the Greater Britannia Area, the Jasmine Field and the Greater Ekofisk Area.
41
Table of Contents
Asia Pacific and Middle East
| Three Months Ended September 30 |
Nine Months Ended September 30 |
|||||||||||||||
| 2015 | 2014 | 2015 | 2014 | |||||||||||||
|
|
|
|
|
|||||||||||||
| Income From Continuing Operations (millions of dollars) |
$ | 273 | 772 | 1,025 | 2,390 | |||||||||||
|
|
||||||||||||||||
| Average Net Production |
||||||||||||||||
| Crude oil (MBD) |
||||||||||||||||
| Consolidated operations |
73 | 72 | 90 | 78 | ||||||||||||
| Equity affiliates |
15 | 15 | 15 | 15 | ||||||||||||
|
|
||||||||||||||||
| Total crude oil |
88 | 87 | 105 | 93 | ||||||||||||
|
|
||||||||||||||||
| Natural gas liquids (MBD) |
||||||||||||||||
| Consolidated operations |
9 | 8 | 9 | 10 | ||||||||||||
| Equity affiliates |
8 | 8 | 8 | 7 | ||||||||||||
|
|
||||||||||||||||
| Total natural gas liquids |
17 | 16 | 17 | 17 | ||||||||||||
|
|
||||||||||||||||
| Natural gas (MMCFD) |
||||||||||||||||
| Consolidated operations |
698 | 670 | 709 | 715 | ||||||||||||
| Equity affiliates |
668 | 518 | 618 | 501 | ||||||||||||
|
|
||||||||||||||||
| Total natural gas |
1,366 | 1,188 | 1,327 | 1,216 | ||||||||||||
|
|
||||||||||||||||
| Total Production (MBOED) |
332 | 301 | 344 | 314 | ||||||||||||
|
|
||||||||||||||||
| Average Sales Prices |
||||||||||||||||
| Crude oil (dollars per barrel) |
||||||||||||||||
| Consolidated operations |
$ | 46.81 | 99.07 | 52.88 | 103.28 | |||||||||||
| Equity affiliates |
50.68 | 104.09 | 55.66 | 106.57 | ||||||||||||
| Total crude oil |
47.38 | 99.92 | 53.26 | 103.82 | ||||||||||||
| Natural gas liquids (dollars per barrel) |
||||||||||||||||
| Consolidated operations |
32.26 | 69.69 | 38.12 | 73.97 | ||||||||||||
| Equity affiliates |
31.26 | 67.13 | 36.05 | 71.51 | ||||||||||||
| Total natural gas liquids |
31.79 | 68.48 | 37.20 | 72.96 | ||||||||||||
| Natural gas (dollars per thousand cubic feet) |
||||||||||||||||
| Consolidated operations |
5.97 | 9.39 | 6.56 | 10.03 | ||||||||||||
| Equity affiliates |
4.37 | 9.11 | 5.31 | 9.97 | ||||||||||||
| Total natural gas |
5.19 | 9.26 | 5.98 | 10.00 | ||||||||||||
|
|
||||||||||||||||
The Asia Pacific and Middle East segment has operations in China, Indonesia, Malaysia, Australia, Timor-Leste and Qatar, as well as exploration activities in Brunei and Myanmar. As of September 30, 2015, Asia Pacific and Middle East contributed 13 percent of our worldwide liquids production and 33 percent of our worldwide natural gas production.
Earnings for Asia Pacific and Middle East operations decreased 65 percent in the third quarter and 57 percent in the nine-month period of 2015. The decrease in earnings for both periods was mainly due to lower prices across all commodities. Earnings in the third quarter of 2015 were further decreased by $49 million after-tax dry hole costs associated with four wells in Malaysia and a $41 million after-tax unproved property impairment from our decision to relinquish our Palangkaraya Production Sharing Contract in Indonesia. Higher DD&A expense from increased volumes also decreased earnings in the nine-month period of 2015. The decrease in both periods was partially offset by lower production taxes, as a result of lower crude oil prices, increased crude oil and LNG volumes, and lower feedstock costs in Western Australia.
42
Table of Contents
Average production increased 10 percent in both the third quarter and nine-month period of 2015, compared with the same periods of 2014. The production increase in both periods was mainly attributable to new production from Gumusut, in Malaysia, which came online in the fourth quarter of 2014; the ramp-up of APLNG production due to additional gas processing facilities online; and improved drilling and well performance in China. Reduced turnaround activity in Western Australia also increased production in the third quarter of 2015. Production increases were partially offset by normal field decline and the Gumusut planned turnaround in June and July of 2015.
Other International
| Three Months Ended September 30 |
Nine Months Ended September 30 |
|||||||||||||||
| 2015 | 2014 | 2015 | 2014 | |||||||||||||
|
|
|
|
|
|||||||||||||
| Income (Loss) From Continuing Operations (millions of dollars) |
$ | (43 | ) | (18 | ) | (284 | ) | 74 | ||||||||
|
|
||||||||||||||||
| Average Net Production |
||||||||||||||||
| Crude oil (MBD) |
||||||||||||||||
| Consolidated operations |
— | 8 | — | 3 | ||||||||||||
| Equity affiliates |
4 | 4 | 4 | 4 | ||||||||||||
|
|
||||||||||||||||
| Total crude oil |
4 | 12 | 4 | 7 | ||||||||||||
|
|
||||||||||||||||
| Natural gas (MMCFD) |
— | 1 | 1 | 2 | ||||||||||||
|
|
||||||||||||||||
| Total Production (MBOED) |
4 | 12 | 4 | 7 | ||||||||||||
|
|
||||||||||||||||
| Average Sales Prices |
||||||||||||||||
| Crude oil (dollars per barrel) |
||||||||||||||||
| Consolidated operations |
$ | — | 95.22 | — | 95.82 | |||||||||||
| Equity affiliates |
35.11 | 66.47 | 38.78 | 68.96 | ||||||||||||
| Total crude oil |
35.11 | 83.22 | 38.78 | 77.62 | ||||||||||||
| Natural gas (dollars per thousand cubic feet) |
— | — | — | 6.44 | ||||||||||||
|
|
||||||||||||||||
The Other International segment includes operations in Libya and Russia, as well as exploration activities in Colombia, Angola, Senegal and Azerbaijan. As of September 30, 2015, Other International contributed less than 1 percent of our worldwide liquids production.
Other International operations reported a loss of $43 million in the third quarter and $284 million for the nine-month period of 2015, compared with a loss of $18 million and earnings of $74 million, respectively, in the same periods of 2014. The third quarter decrease in earnings was primarily due to rig storage costs for the Athena drilling rig in Angola. Additionally, the absence of a $154 million benefit from the favorable resolution of a contingent liability in 2014, dry hole expenses for the Omosi-1 and Vali-1 wells in Angola, and higher exploration expenses related to the Angola Block 37 and Poland leasehold impairments all drove the earnings decrease for the nine-month period of 2015.
Average production decreased by 8 MBOED and 3 MBOED in the third quarter and nine-month period of 2015, respectively, compared with the same periods in 2014, due to the current situation in Libya. Libya production remains shut in, as the Es Sider crude oil export terminal closure has continued throughout the third quarter of 2015. The near-term operating and drilling activity remains uncertain as a result of the ongoing civil unrest.
43
Table of Contents
Exploration Update
In April 2015, we plugged and abandoned the Omosi-1 exploration well, in Block 37 offshore Angola. As a result, we recorded an approximately $81 million after-tax charge to dry hole expense in the first quarter of 2015. In June 2015, we plugged and abandoned the Vali-1 exploration well at a $59 million after-tax charge to dry hole expense. Vali-1 was the third wildcat in our four-well exploration commitment in the Kwanza Basin.
In June 2015, due to lack of commerciality of wells drilled, the decision was made to impair Block 37 offshore Angola. We have a 50 percent participating interest in Block 36 offshore Angola with a leasehold and other asset net book value of $438 million.
The Athena drilling rig was stored in Angola from July 2015 and was mobilized to Senegal in October to commence the drilling program in the fourth quarter of 2015.
Corporate and Other
| Millions of Dollars | ||||||||||||||||
| Three Months Ended September 30 |
Nine Months Ended September 30 |
|||||||||||||||
| 2015 | 2014 | 2015 | 2014 | |||||||||||||
|
|
|
|
|
|||||||||||||
| Income (Loss) From Continuing Operations |
||||||||||||||||
| Net interest |
$ | (176 | ) | (36 | ) | (492 | ) | (357 | ) | |||||||
| Corporate general and administrative expenses |
(71 | ) | (51 | ) | (163 | ) | (133 | ) | ||||||||
| Technology |
3 | (26 | ) | 75 | (74 | ) | ||||||||||
| Other |
(94 | ) | (17 | ) | (139 | ) | (52 | ) | ||||||||
|
|
||||||||||||||||
| $ | (338 | ) | (130 | ) | (719 | ) | (616 | ) | ||||||||
|
|
||||||||||||||||
Net interest consists of interest and financing expense, net of interest income and capitalized interest, as well as premiums incurred on the early retirement of debt. Net interest increased by $140 million in the third quarter and $135 million in the nine-month period of 2015, compared with the same periods in 2014. Net interest in both periods increased primarily due to lower capitalized interest on projects and increased debt, in addition to the absence of a $61 million tax benefit associated with the election of the fair market value method of apportioning interest expense in the United States and the interest on favorable tax settlement of a 2006 foreign currency loss, both booked in 2014.
Corporate general and administrative expenses increased 39 percent in the third quarter and 23 percent in the nine-month period of 2015. The increase in both periods was mainly due to pension settlement expense incurred in 2015, partially offset by lower staff and compensation-plan costs.
Technology includes our investment in new technologies or businesses, as well as licensing revenues. Activities are focused on heavy oil and oil sands, unconventional reservoirs, LNG, and subsurface, arctic and deepwater technologies, with an underlying commitment to environmental responsibility. Earnings from Technology were $3 million in the third quarter and $75 million in the nine-month period of 2015, compared with losses of $26 million and $74 million in the same periods of 2014, respectively. The increase in earnings in both periods primarily resulted from higher licensing revenues.
The category “Other” includes certain foreign currency transaction gains and losses, environmental costs associated with sites no longer in operation and other costs not directly associated with an operating segment. “Other” expenses increased by $77 million in the third quarter of 2015 and $87 million for the nine-month period of 2015. “Other” expenses increased in both periods due to 2015 restructuring charges and higher foreign currency transaction losses. The “Other” expense increase in the nine-month period of 2015 was partially offset by lower environmental expenses.
44
Table of Contents
CAPITAL RESOURCES AND LIQUIDITY
Financial Indicators
| Millions of Dollars | ||||||||
| September 30 2015 |
December 31 2014 |
|||||||
|
|
|
|||||||
| Short-term debt |
$ | 175 | 182 | |||||
| Total debt |
24,891 | 22,565 | ||||||
| Total equity |
44,555 | 52,273 | ||||||
| Percent of total debt to capital* |
36 | % | 30 | |||||
| Percent of floating-rate debt to total debt |
7 | % | 5 | |||||
|
|
||||||||
*Capital includes total debt and total equity.
To meet our short- and long-term liquidity requirements, we look to a variety of funding sources. Cash generated from continuing operating activities is the primary source of funding. During the first nine months of 2015, the primary uses of our available cash were $7,913 million to support our ongoing capital expenditures and investments program, $2,741 million to pay dividends and $92 million to repay debt. During the first nine months of 2015, cash and cash equivalents decreased by $2,649 million to $2,413 million.
In addition to cash flows from operating activities and proceeds from asset sales, we rely on our commercial paper and credit facility programs and our shelf registration statement to support our short- and long-term liquidity requirements. We believe current cash balances and cash generated by operations, together with access to external sources of funds as described below in the “Significant Sources of Capital” section, will be sufficient to meet our funding requirements in the near- and long-term, including our capital spending program, dividend payments and required debt payments.
Significant Sources of Capital
Operating Activities
Cash provided by continuing operating activities was $5,976 million for the first nine months of 2015, compared with $13,601 million for the corresponding period of 2014, a 56 percent decrease. The decrease was primarily due to lower prices across all commodities and the absence of the $1.3 billion distribution from FCCL in the first quarter of 2014, partly offset by year-over-year production growth. The distribution from FCCL resulted from our $2.8 billion prepayment of the remaining joint venture acquisition obligation in 2013, which substantially increased the financial flexibility of our 50 percent owned FCCL Partnership. We do not expect this individually significant distribution to recur in the future under current economic conditions.
While the stability of our cash flows from operating activities benefits from geographic diversity, our short- and long-term operating cash flows are highly dependent upon prices for crude oil, bitumen, natural gas, LNG and natural gas liquids. Prices and margins in our industry have historically been volatile and are driven by market conditions over which we have no control. Absent other mitigating factors, as these prices and margins fluctuate, we would expect a corresponding change in our operating cash flows.
The level of absolute production volumes, as well as product and location mix, impacts our cash flows. Production levels are impacted by such factors as the volatile crude oil and natural gas price environment, which may impact investment decisions; the effects of price changes on production sharing and variable-royalty contracts; acquisition and disposition of fields; field production decline rates; new technologies; operating efficiencies; timing of startups and major turnarounds; political instability; weather-related disruptions; and the addition of proved reserves through exploratory success and their timely and cost-effective development. While we actively manage these factors, production levels can cause variability in cash flows, although generally this variability has not been as significant as that caused by commodity prices.
45
Table of Contents
To maintain or grow our production volumes, we must continue to add to our proved reserve base. For additional information regarding reserve replacement, see the Outlook section within Management’s Discussion and Analysis.
Investing Activities
Proceeds from asset sales for the first nine months of 2015 were $323 million, compared with $1,434 million for the corresponding period of 2014. We continue to optimize our asset portfolio by focusing on assets which offer the highest returns and growth potential, while selling non-core assets. For additional information regarding proceeds from asset sales, see the Outlook section within Management’s Discussion and Analysis.
In May 2015, we liquidated certain deferred compensation investments for proceeds of $267 million, which is included in the “Other” line within “Cash Flows From Investing Activities” on our consolidated statement of cash flows. We do not expect further material liquidations associated with deferred compensation investments. For additional information, see Note 13—Fair Value Measurement, in the Notes to Consolidated Financial Statements.
Commercial Paper and Credit Facilities
At September 30, 2015, we had a revolving credit facility totaling $7.0 billion expiring in June 2019. Our revolving credit facility may be used for direct bank borrowings, for the issuance of letters of credit totaling up to $500 million, or as support for our commercial paper programs. The revolving credit facility is broadly syndicated among financial institutions and does not contain any material adverse change provisions or any covenants requiring maintenance of specified financial ratios or credit ratings. The facility agreement contains a cross-default provision relating to the failure to pay principal or interest on other debt obligations of $200 million or more by ConocoPhillips, or any of its consolidated subsidiaries.
Credit facility borrowings may bear interest at a margin above rates offered by certain designated banks in the London interbank market or at a margin above the overnight federal funds rate or prime rates offered by certain designated banks in the United States. The agreement calls for commitment fees on available, but unused, amounts. The agreement also contains early termination rights if our current directors or their approved successors cease to be a majority of the Board of Directors.
Our primary funding source for short-term working capital needs is the ConocoPhillips $6.1 billion commercial paper program. Commercial paper maturities are generally limited to 90 days. We also have the ConocoPhillips Qatar Funding Ltd. $900 million commercial paper program, which is used to fund commitments relating to QG3. At both September 30, 2015 and December 31, 2014, we had no direct borrowings or letters of credit issued under the revolving credit facility. Under the ConocoPhillips Qatar Funding Ltd. commercial paper programs, $803 million of commercial paper was outstanding at September 30, 2015, compared with $860 million at December 31, 2014. Since we had $803 million of commercial paper outstanding and had issued no letters of credit, we had access to $6.2 billion in borrowing capacity under our revolving credit facility at September 30, 2015.
In August 2015, Moody’s Investors Service downgraded our senior long-term debt ratings to “A2” from “A1,” with a stable outlook. In October 2015, Standard and Poor’s affirmed our “A” rating with a negative outlook. We do not have any ratings triggers on any of our corporate debt that would cause an automatic default, and thereby impact our access to liquidity, in the event of a further downgrade of our credit rating. If our credit rating were to deteriorate to a level prohibiting us from accessing the commercial paper market, we would still be able to access funds under our revolving credit facility.
Certain of our project-related contracts and derivative instruments contain provisions requiring us to post collateral. Many of these contracts and instruments permit us to post either cash or letters of credit as collateral. At September 30, 2015 and December 31, 2014, we had direct bank letters of credit of $388 million and $802 million, respectively, which secured performance obligations related to various purchase commitments incident to the ordinary conduct of business.
46
Table of Contents
Shelf Registration
We have a universal shelf registration statement on file with the U.S. Securities and Exchange Commission (SEC) under which we, as a well-known seasoned issuer, have the ability to issue and sell an indeterminate amount of various types of debt and equity securities.
Off-Balance Sheet Arrangements
As part of our normal ongoing business operations and consistent with normal industry practice, we enter into numerous agreements with other parties to pursue business opportunities, which share costs and apportion risks among the parties as governed by the agreements.
For information about guarantees, see Note 10—Guarantees, in the Notes to Consolidated Financial Statements, which is incorporated herein by reference.
Capital Requirements
For information about our capital expenditures and investments, see the “Capital Spending” section.
Our debt balance at September 30, 2015, was $24.9 billion, an increase of $2.3 billion from the balance at December 31, 2014, primarily as a result of the May 2015 issuance of $2.5 billion in new fixed and floating rate notes. For more information, see Note 8—Debt, in the Notes to Consolidated Financial Statements.
In July 2015, we announced an increase in the quarterly dividend rate to 74 cents per share. The dividend was paid September 1, 2015, to stockholders of record at the close of business on July 27, 2015. In October 2015, we announced a dividend of 74 cents per share. The dividend will be paid December 1, 2015, to stockholders of record at the close of business on October 19, 2015.
Capital Spending
| Millions of Dollars | ||||||||
| Nine Months Ended September 30 |
||||||||
| 2015 | 2014 | |||||||
|
|
|
|||||||
| Alaska |
$ | 1,085 | 1,174 | |||||
| Lower 48 |
3,010 | 4,353 | ||||||
| Canada |
887 | 1,750 | ||||||
| Europe |
1,230 | 1,912 | ||||||
| Asia Pacific and Middle East |
1,471 | 3,019 | ||||||
| Other International |
139 | 403 | ||||||
| Corporate and Other |
91 | 118 | ||||||
|
|
||||||||
| Capital expenditures and investments from continuing operations |
$ | 7,913 | 12,729 | |||||
|
|
||||||||
| Discontinued operations in Nigeria: | $ | — | 59 | |||||
Working capital changes associated with investing activities increased cash used in investing activities by $842 million for the first nine months of 2015, compared with a decrease in cash used in investing activities of $394 million for the corresponding period of 2014. The increase in cash used in investing activities for the first nine months of 2015 is attributable to reduced capital accruals, as compared to December 31, 2014, from lower activity levels in 2015, primarily in the Lower 48 and Canada. We do not anticipate any further significant changes to working capital from activity levels in 2015.
47
Table of Contents
During the first nine months of 2015, capital expenditures and investments from continuing operations supported key exploration and development programs, primarily:
| • | Oil and natural gas development and exploration activities in the Lower 48, including Eagle Ford, Bakken, and the Permian Basin. |
| • | Major project expenditures associated with the APLNG joint venture in Australia. |
| • | Oil sands development, notably at Surmont 2, and ongoing liquids-rich plays in Canada. |
| • | Alaska activities related to development in the Greater Kuparuk Area, Greater Prudhoe Area and the Western North Slope. |
| • | In Europe, development activities in the Greater Ekofisk, Aasta Hansteen, Clair Ridge, Jasmine and Greater Britannia areas, and exploration and appraisal activities in the Jasmine and Greater Clair areas. |
| • | Exploration and appraisal drilling in deepwater Gulf of Mexico. |
| • | Continued development in Malaysia, Indonesia and China and exploration and appraisal activity in Malaysia, Indonesia, China and offshore Australia. |
| • | Exploration activities in Angola. |
We have further reduced our 2015 capital expenditures guidance to $10.2 billion compared with initial guidance of $11.5 billion. Approximately, half of these reductions are due to market factors, while the remainder are the result of discretionary actions.
Contingencies
A number of lawsuits involving a variety of claims arising in the ordinary course of business have been made against ConocoPhillips. We also may be required to remove or mitigate the effects on the environment of the placement, storage, disposal or release of certain chemical, mineral and petroleum substances at various active and inactive sites. We regularly assess the need for accounting recognition or disclosure of these contingencies. In the case of all known contingencies (other than those related to income taxes), we accrue a liability when the loss is probable and the amount is reasonably estimable. If a range of amounts can be reasonably estimated and no amount within the range is a better estimate than any other amount, then the minimum of the range is accrued. We do not reduce these liabilities for potential insurance or third-party recoveries. If applicable, we accrue receivables for probable insurance or other third-party recoveries. With respect to income-tax-related contingencies, we use a cumulative probability-weighted loss accrual in cases where sustaining a tax position is less than certain.
Based on currently available information, we believe it is remote that future costs related to known contingent liability exposures will exceed current accruals by an amount that would have a material adverse impact on our consolidated financial statements. As we learn new facts concerning contingencies, we reassess our position both with respect to accrued liabilities and other potential exposures. Estimates particularly sensitive to future changes include contingent liabilities recorded for environmental remediation, tax and legal matters. Estimated future environmental remediation costs are subject to change due to such factors as the uncertain magnitude of cleanup costs, the unknown time and extent of such remedial actions that may be required, and the determination of our liability in proportion to that of other responsible parties. Estimated future costs related to tax and legal matters are subject to change as events evolve and as additional information becomes available during the administrative and litigation processes. For information on other contingencies, see Note 11—Contingencies and Commitments, in the Notes to Consolidated Financial Statements.
Legal Matters
We are subject to various lawsuits and claims including but not limited to matters involving oil and gas royalty and severance tax payments, gas measurement and valuation methods, contract disputes, environmental damages, personal injury, and property damage. Our primary exposures for such matters relate to alleged royalty underpayments on certain federal, state and privately owned properties and claims of alleged environmental contamination from historic operations. We will continue to defend ourselves vigorously in these matters.
48
Table of Contents
Our legal organization applies its knowledge, experience and professional judgment to the specific characteristics of our cases, employing a litigation management process to manage and monitor the legal proceedings against us. Our process facilitates the early evaluation and quantification of potential exposures in individual cases. This process also enables us to track those cases that have been scheduled for trial and/or mediation. Based on professional judgment and experience in using these litigation management tools and available information about current developments in all our cases, our legal organization regularly assesses the adequacy of current accruals and determines if adjustment of existing accruals, or establishment of new accruals, is required.
Environmental
We are subject to the same numerous international, federal, state and local environmental laws and regulations as other companies in our industry. For a discussion of the most significant of these environmental laws and regulations, including those with associated remediation obligations, see the “Environmental” section in Management’s Discussion and Analysis of Financial Condition and Results of Operations on pages 59–61 of our 2014 Annual Report on Form 10-K.
We occasionally receive requests for information or notices of potential liability from the Environmental Protection Agency (EPA) and state environmental agencies alleging that we are a potentially responsible party under the Federal Comprehensive Environmental Response, Compensation and Liability Act (CERCLA) or an equivalent state statute. On occasion, we also have been made a party to cost recovery litigation by those agencies or by private parties. These requests, notices and lawsuits assert potential liability for remediation costs at various sites that typically are not owned by us, but allegedly contain wastes attributable to our past operations. As of September 30, 2015, there were 13 sites around the United States in which we were identified as a potentially responsible party under CERCLA and comparable state laws.
At September 30, 2015, our balance sheet included a total environmental accrual of $286 million, compared with $344 million at December 31, 2014, for remediation activities in the United States and Canada. We expect to incur a substantial amount of these expenditures within the next 30 years.
Notwithstanding any of the foregoing, and as with other companies engaged in similar businesses, environmental costs and liabilities are inherent concerns in our operations and products, and there can be no assurance that material costs and liabilities will not be incurred. However, we currently do not expect any material adverse effect upon our results of operations or financial position as a result of compliance with current environmental laws and regulations.
Climate Change
There has been a broad range of proposed or promulgated state, national and international laws focusing on greenhouse gas (GHG) reduction. These proposed or promulgated laws apply or could apply in countries where we have interests or may have interests in the future. Laws in this field continue to evolve, and while it is not possible to accurately estimate either a timetable for implementation or our future compliance costs relating to implementation, such laws, if enacted, could have a material impact on our results of operations and financial condition. Examples of legislation and precursors for possible regulation that do or could affect our operations include the EPA’s announcement on March 29, 2010 (published as “Interpretation of Regulations that Determine Pollutants Covered by Clean Air Act Permitting Programs,” 75 Fed. Reg. 17004 (April 2, 2010)) and the EPA’s and U.S. Department of Transportation’s joint promulgation of a Final Rule on April 1, 2010, that trigger regulation of GHGs under the Clean Air Act, may trigger more climate-based claims for damages, and may result in longer agency review time for development projects.
For other examples of legislation or precursors for possible regulation and factors on which the ultimate impact on our financial performance will depend, see the “Climate Change” section in Management’s Discussion and Analysis of Financial Condition and Results of Operations on pages 61–62 of our 2014 Annual Report on Form 10-K.
49
Table of Contents
CAUTIONARY STATEMENT FOR THE PURPOSES OF THE “SAFE HARBOR” PROVISIONS OF THE PRIVATE SECURITIES LITIGATION REFORM ACT OF 1995
This report includes forward-looking statements within the meaning of Section 27A of the Securities Act of 1933 and Section 21E of the Securities Exchange Act of 1934. All statements other than statements of historical fact included or incorporated by reference in this report, including, without limitation, statements regarding our future financial position, business strategy, budgets, projected revenues, projected costs and plans, and objectives of management for future operations, are forward-looking statements. You can identify our forward-looking statements by the words “anticipate,” “estimate,” “believe,” “budget,” “continue,” “could,” “intend,” “may,” “plan,” “potential,” “predict,” “seek,” “should,” “will,” “would,” “expect,” “objective,” “projection,” “forecast,” “goal,” “guidance,” “outlook,” “effort,” “target” and similar expressions.
We based the forward-looking statements on our current expectations, estimates and projections about ourselves and the industries in which we operate in general. We caution you these statements are not guarantees of future performance as they involve assumptions that, while made in good faith, may prove to be incorrect, and involve risks and uncertainties we cannot predict. In addition, we based many of these forward-looking statements on assumptions about future events that may prove to be inaccurate. Accordingly, our actual outcomes and results may differ materially from what we have expressed or forecast in the forward-looking statements. Any differences could result from a variety of factors, including, but not limited to, the following:
| • | Fluctuations in crude oil, bitumen, natural gas, LNG and natural gas liquids prices. |
| • | Potential failures or delays in achieving expected reserve or production levels from existing and future oil and gas developments due to operating hazards, drilling risks and the inherent uncertainties in predicting reserves and reservoir performance. |
| • | Inability to maintain reserves replacement rates consistent with prior periods. |
| • | Unsuccessful exploratory drilling activities or the inability to obtain access to exploratory acreage. |
| • | Unexpected changes in costs or technical requirements for constructing, modifying or operating exploration and production facilities. |
| • | Legislative and regulatory initiatives further regulating hydraulic fracturing, methane emissions, flaring or water disposal. |
| • | Lack of, or disruptions in, adequate and reliable transportation for our crude oil, bitumen, natural gas, LNG and natural gas liquids. |
| • | Inability to timely obtain or maintain permits, including those necessary for drilling and/or development, construction of LNG terminals or regasification facilities; comply with government regulations; or make capital expenditures required to maintain compliance. |
| • | Failure to complete definitive agreements and feasibility studies for, and to timely complete construction of, announced and future exploration and production and LNG development. |
| • | Potential disruption or interruption of our operations due to accidents, extraordinary weather events, civil unrest, political events, terrorism, cyber attacks or infrastructure constraints or disruptions. |
| • | International monetary conditions and exchange controls. |
| • | Substantial investment or reduced demand for products as a result of existing or future environmental rules and regulations, use of competing energy sources or the development of alternative energy sources. |
| • | Liability for remedial actions, including removal and reclamation obligations, under environmental regulations. |
| • | Liability resulting from litigation. |
| • | General domestic and international economic and political developments, including armed hostilities; expropriation of assets; changes in governmental policies relating to crude oil, bitumen, natural gas, LNG and natural gas liquids pricing, regulation or taxation; other political, economic or diplomatic developments; and international monetary fluctuations. |
| • | Volatility in the commodity futures markets. |
| • | Changes in tax and other laws, regulations (including alternative energy mandates), or royalty rules applicable to our business. |
50
Table of Contents
| • | Competition in the oil and gas exploration and production industry. |
| • | Limited access to capital or significantly higher cost of capital related to illiquidity or uncertainty in the domestic or international financial markets. |
| • | Delays in, or our inability to, execute asset dispositions. |
| • | Inability to obtain economical financing for development, construction or modification of facilities and general corporate purposes. |
| • | The operation and financing of our joint ventures. |
| • | The ability of our customers and other contractual counterparties to satisfy their obligations to us. |
| • | The factors generally described in Item 1A—Risk Factors in our 2014 Annual Report on Form 10-K and additional risks described in our other filings with the SEC. |
| Item 3. | QUANTITATIVE AND QUALITATIVE DISCLOSURES ABOUT MARKET RISK |
Information about market risks for the nine months ended September 30, 2015, does not differ materially from that discussed under Item 7A in our 2014 Annual Report on Form 10-K.
| Item 4. | CONTROLS AND PROCEDURES |
We maintain disclosure controls and procedures designed to ensure information required to be disclosed in reports we file or submit under the Securities Exchange Act of 1934, as amended (the Act), is recorded, processed, summarized and reported within the time periods specified in Securities and Exchange Commission rules and forms, and that such information is accumulated and communicated to management, including our principal executive and principal financial officers, as appropriate, to allow timely decisions regarding required disclosure. As of September 30, 2015, with the participation of our management, our Chairman and Chief Executive Officer (principal executive officer) and our Executive Vice President, Finance and Chief Financial Officer (principal financial officer) carried out an evaluation, pursuant to Rule 13a-15(b) of the Act, of ConocoPhillips’ disclosure controls and procedures (as defined in Rule 13a-15(e) of the Act). Based upon that evaluation, our Chairman and Chief Executive Officer and our Executive Vice President, Finance and Chief Financial Officer concluded our disclosure controls and procedures were operating effectively as of September 30, 2015.
There have been no changes in our internal control over financial reporting, as defined in Rule 13a-15(f) of the Act, in the period covered by this report that have materially affected, or are reasonably likely to materially affect, our internal control over financial reporting.
| Item 1A. | RISK FACTORS |
There have been no material changes from the risk factors disclosed in Item 1A of our 2014 Annual Report on Form 10-K.
51
Table of Contents
| 3.1 | Amended and Restated By-Laws of ConocoPhillips, as amended and restated as of October 9, 2015 (incorporated by reference to Exhibit 3.1 to the Current Report of ConocoPhillips on Form 8-K filed on October 13, 2015; File No. 001-32395). | |
| 10.1* | Form of Key Employee Award Terms and Conditions, as part of the ConocoPhillips Targeted Variable Long Term Incentive Program, granted under the 2014 Omnibus Stock and Performance Incentive Plan of ConocoPhillips, dated September 3, 2015. | |
| 12* | Computation of Ratio of Earnings to Fixed Charges. | |
| 31.1* | Certification of Chief Executive Officer pursuant to Rule 13a-14(a) under the Securities Exchange Act of 1934. | |
| 31.2* | Certification of Chief Financial Officer pursuant to Rule 13a-14(a) under the Securities Exchange Act of 1934. | |
| 32* | Certifications pursuant to 18 U.S.C. Section 1350. | |
| 101.INS* | XBRL Instance Document. | |
| 101.SCH* | XBRL Schema Document. | |
| 101.CAL* | XBRL Calculation Linkbase Document. | |
| 101.LAB* | XBRL Labels Linkbase Document. | |
| 101.PRE* | XBRL Presentation Linkbase Document. | |
| 101.DEF* | XBRL Definition Linkbase Document. | |
* Filed herewith.
52
Table of Contents
Pursuant to the requirements of the Securities Exchange Act of 1934, the registrant has duly caused this report to be signed on its behalf by the undersigned thereunto duly authorized.
| CONOCOPHILLIPS |
| /s/ Glenda M. Schwarz |
| Glenda M. Schwarz Vice President and Controller (Chief Accounting and Duly Authorized Officer) |
November 3, 2015
53