Attached files
| file | filename |
|---|---|
| EX-99.2 - AZZ FINANCIAL AND OTHER STAT INFO - AZZ INC | ex992azzotherinfo.htm |
| 8-K - AZZ FY12 Q1 GUIDANCE - AZZ INC | form8kfy12q1guidance.htm |
May 31, 2011

2
Certain statements herein about our expectations of future events or results constitute forward-looking
statements for purposes of the safe harbor provisions of The Private Securities Litigation Reform Act of 1995.
You can identify forward-looking statements by terminology such as, “may,” “should,” “expects, “ “plans,”
“anticipates,” “believes,” “estimates,” “predicts,” “potential,” “continue,” or the negative of these terms or
other comparable terminology. Such forward-looking statements are based on currently available competitive,
financial and economic data and management’s views and assumptions regarding future events. Such forward-
looking statements are inherently uncertain, and investors must recognize that actual results may differ from
those expressed or implied in the forward-looking statements. In addition, certain factors could affect the
outcome of the matters described herein. This presentation may contain forward-looking statements that
involve risks and uncertainties including, but not limited to, changes in customer demand and response to
products and services offered by AZZ, including demand by the electrical power generation markets, electrical
transmission and distribution markets, the industrial markets, and the hot dip galvanizing markets; prices and
raw material cost, including zinc and natural gas which are used in the hot dip galvanizing process; changes in
the economic conditions of the various markets that AZZ serves, foreign and domestic, customer request
delays of shipments, acquisition opportunities, currency exchange rates, adequacy of financing, and availability
of experienced management employees to implement AZZ’s growth strategy. AZZ has provided additional
information regarding risks associated with the business in AZZ’s Annual Report on Form 10-K for the fiscal
year ended February 28, 2011 and other filings with the SEC, available for viewing on AZZ’s website at
www.azz.com and on the SEC’s website at www.sec.gov.
You are urged to consider these factors carefully in evaluating the forward-looking statements herein and are
cautioned not to place undue reliance on such forward-looking statements, which are qualified in their entirety
by this cautionary statement. These statements are based on information as of the date hereof and AZZ
assumes no obligation to update any forward-looking statements, whether as a result of new information,
future events, or otherwise.
Forward Looking Statement

3
AZZ is a specialty electrical equipment manufacturer
serving the global markets of power generation,
transmission, distribution and industrial as well as a
leading provider of hot dip galvanizing services to the
steel fabrication market nationwide.
serving the global markets of power generation,
transmission, distribution and industrial as well as a
leading provider of hot dip galvanizing services to the
steel fabrication market nationwide.
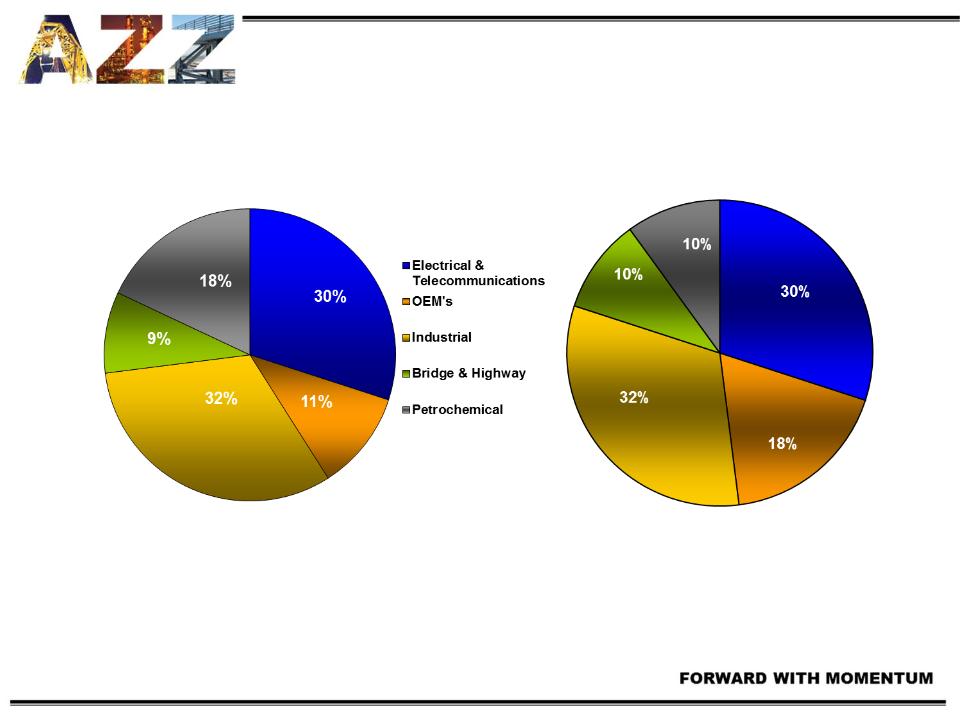
Company Overview
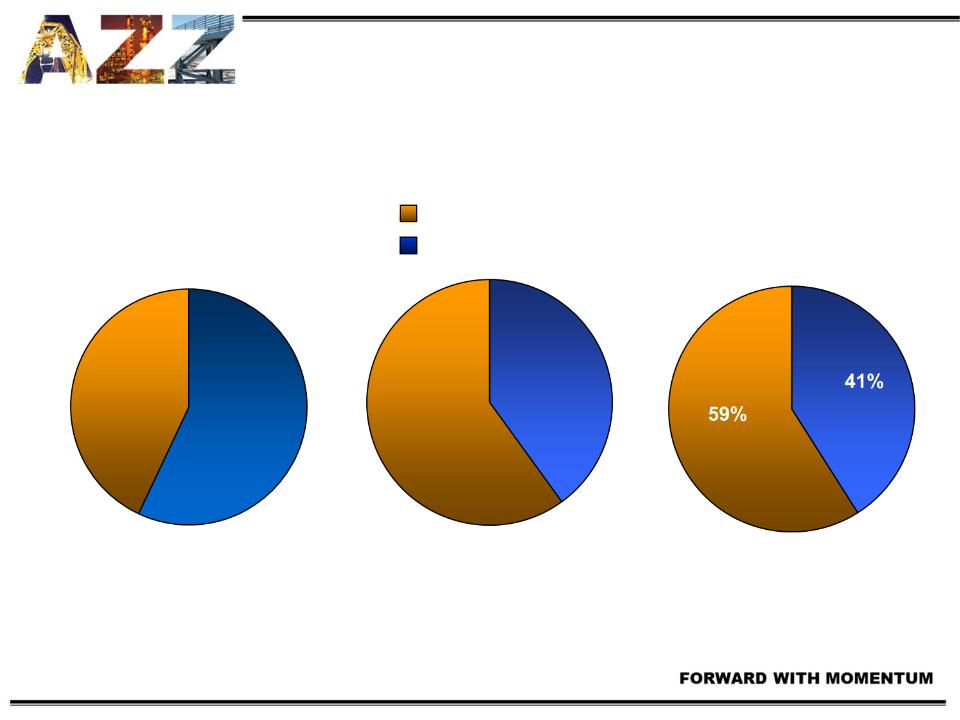
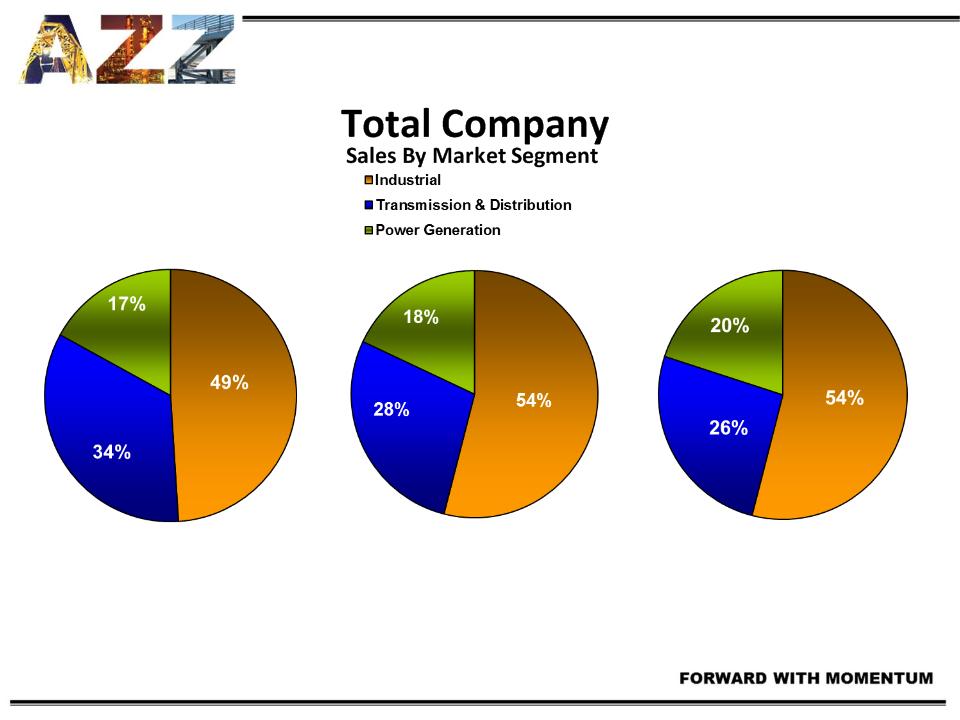
Total Company
Sales By Segment
Sales By Segment
43%
57%
57%
43%
Actual
FY2010
$357
(in millions)
Actual
FY2011
$381
(in millions)
Projected
FY2012
$450 to $475
(in millions)
Galvanizing
Electrical and Industrial
4
5
Actual
FY2010
$357
(in millions)
Actual
FY2011
$381
(in millions)
Projected
FY2012
$450 to $475
(in millions)
6
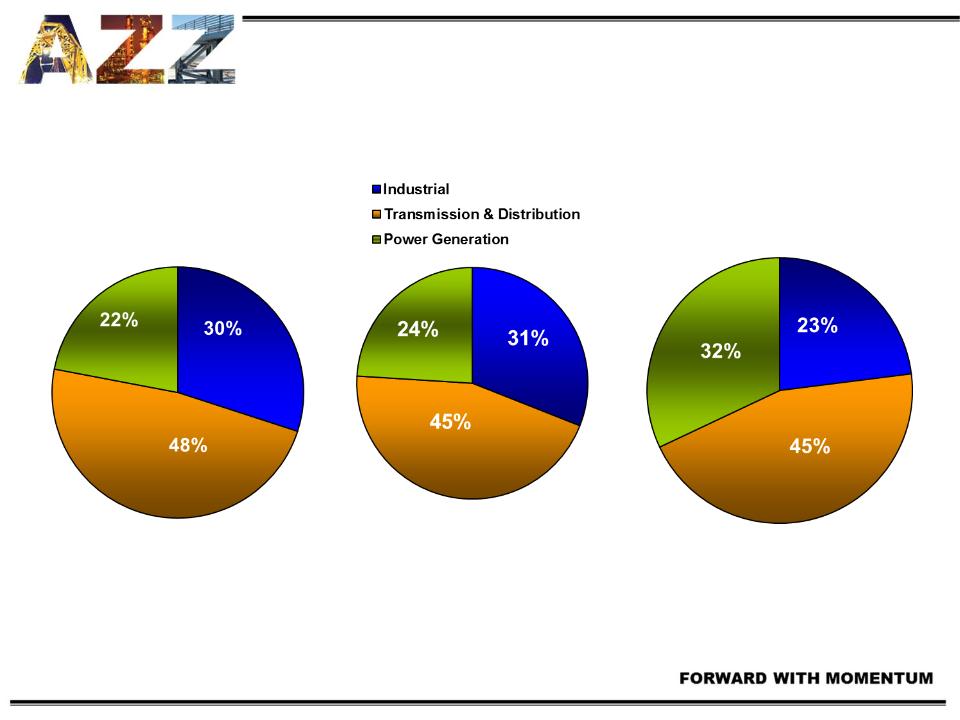
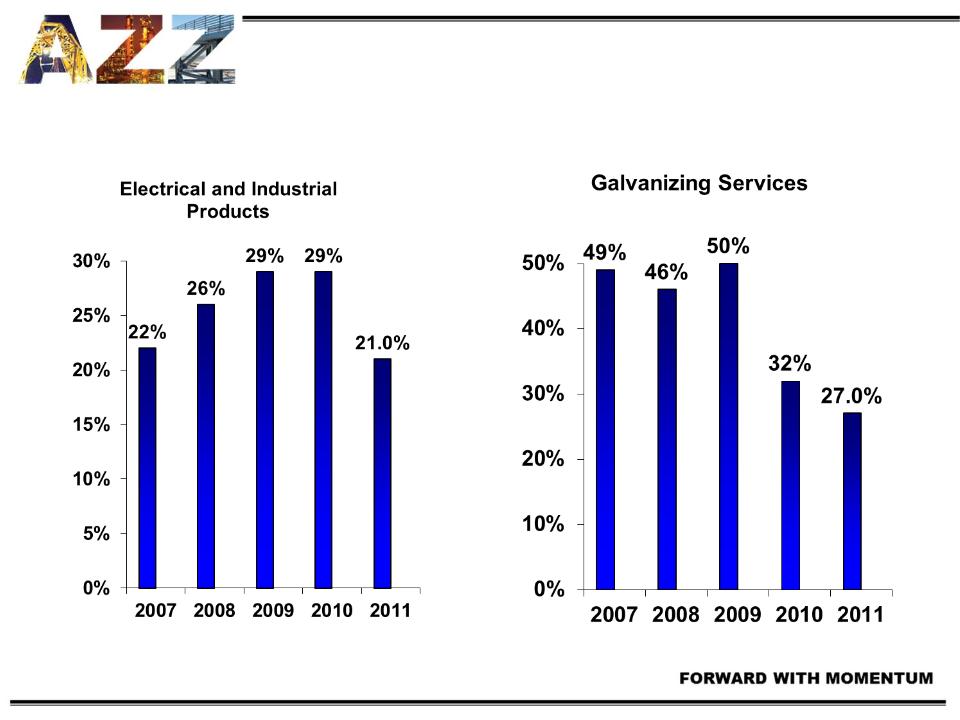
Electrical and Industrial Products
7
Electrical and Industrial Products
Actual
FY2010
$203.5
(in millions)
Actual
FY2011
$163
(in millions)
Projected
FY2012
$185 to $195
(in millions)
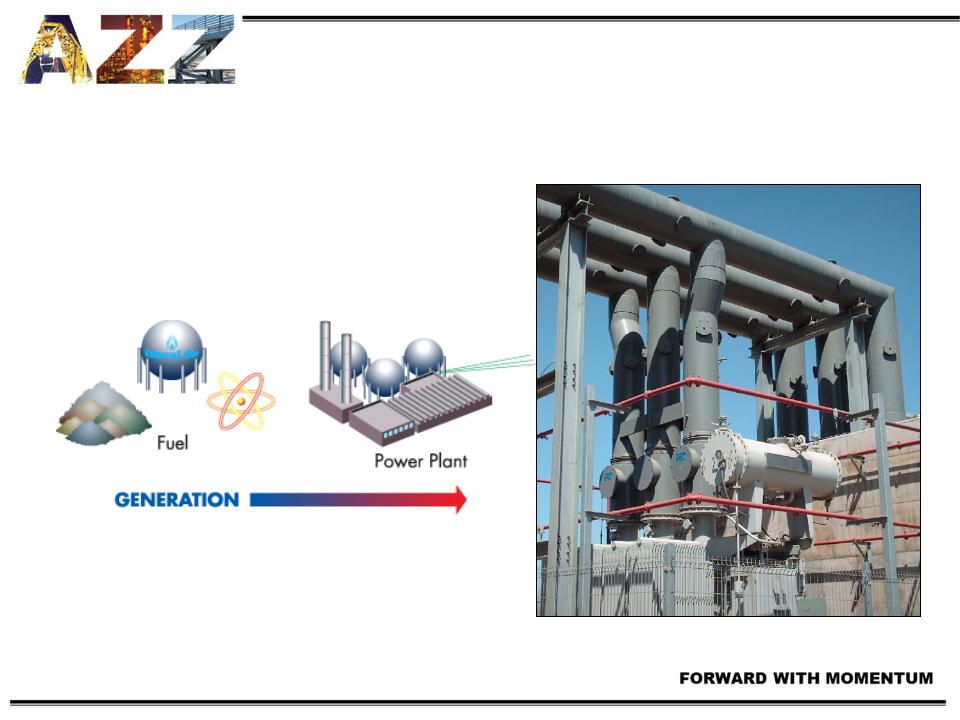
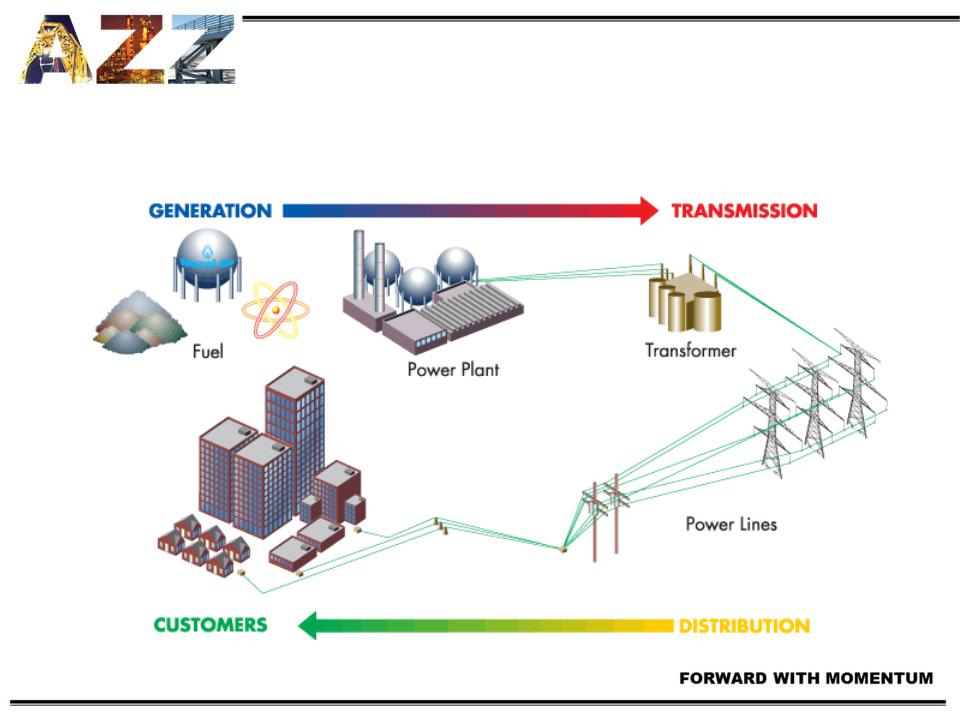
Power Generation
8
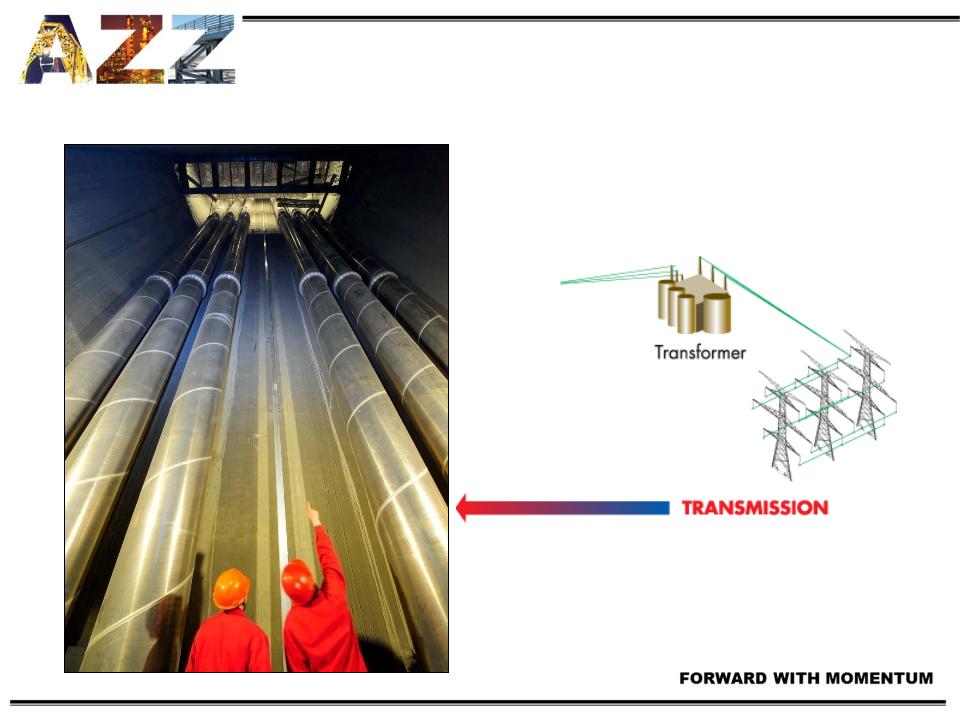
Power Transmission
9
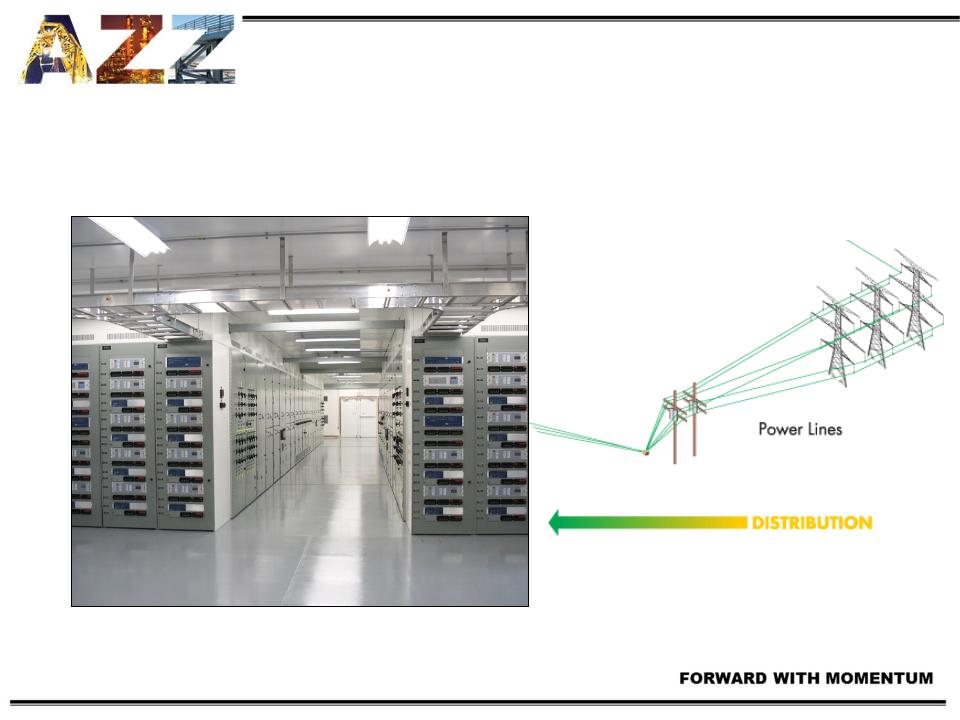
Power Distribution
10
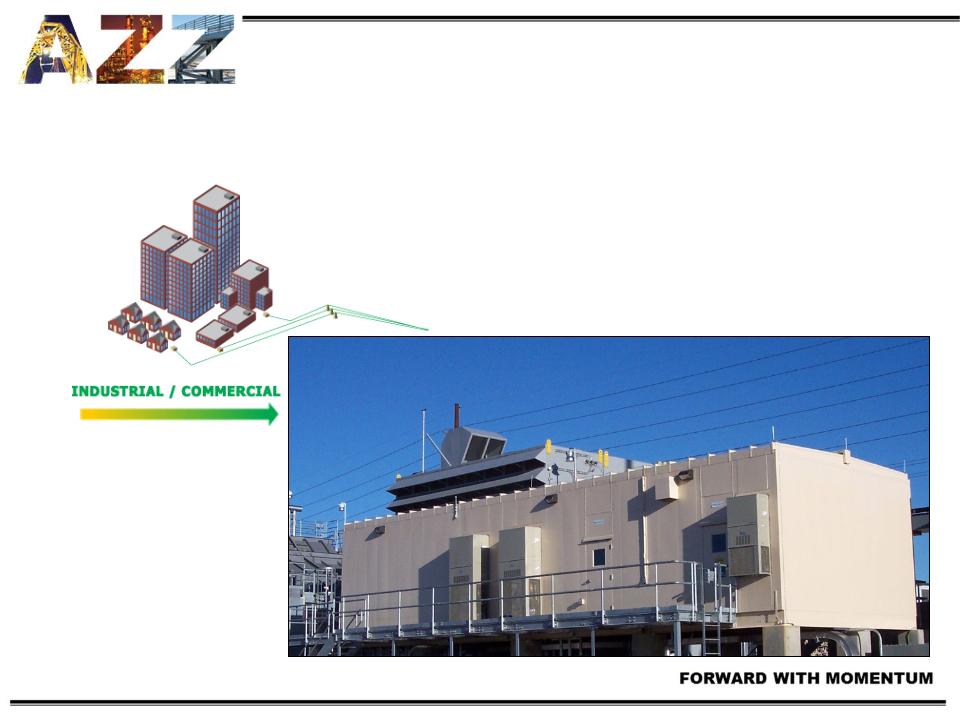
Industrial / Commercial
11
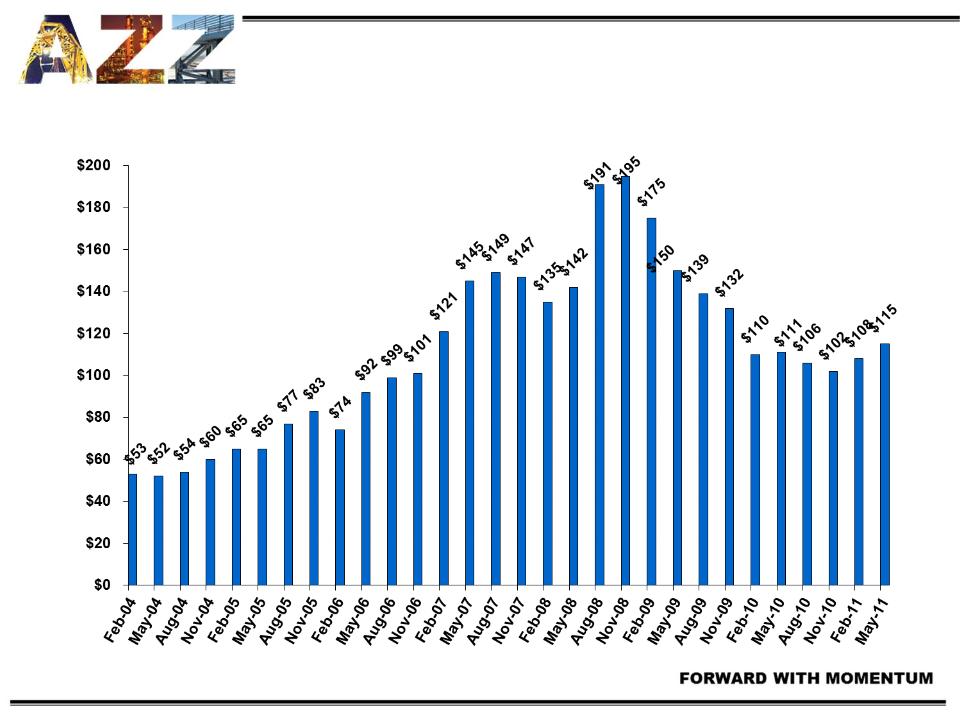
Backlog
($ In Millions)
12

13
Backlog
($ In Millions)
|
|
Fiscal 2010
|
Fiscal 2011
|
1st Qtr 2012
|
|
Beginning Backlog
|
$174.8
|
$109.9
|
$108.4
|
|
Bookings
|
$292.1
|
$379.1
|
$120.7
|
|
Shipments
|
$357.0
|
$380.6
|
$114.4
|
|
Ending Backlog
|
$109.9
|
$108.4
|
$114.7
|
|
Book to Ship Ratio
|
82%
|
100%
|
106%
|
14
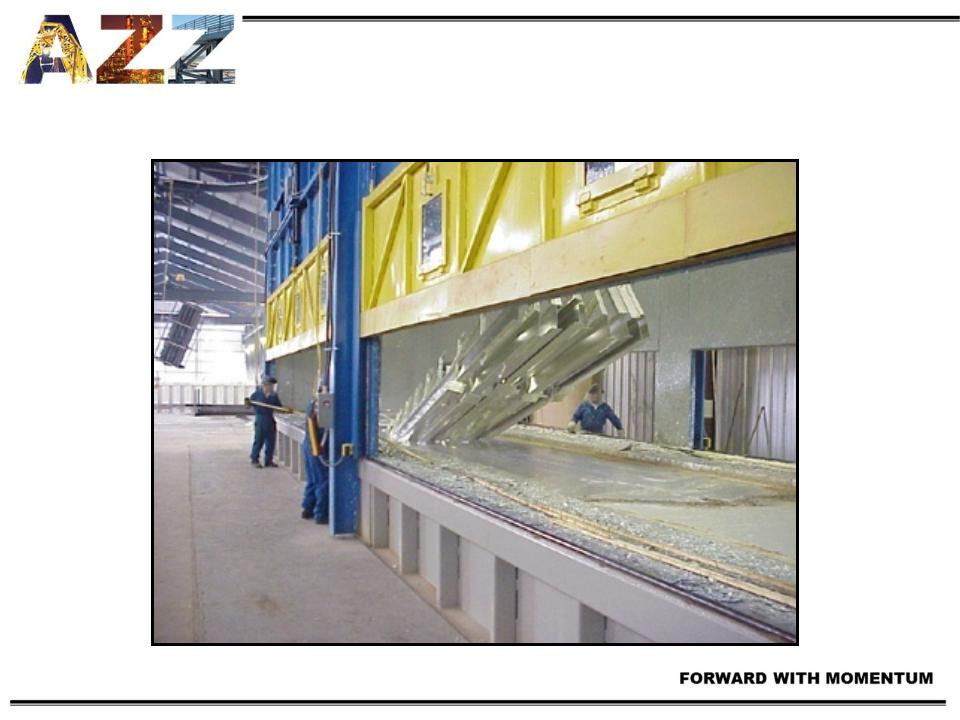
Galvanizing Services
15
Application: “After-fabrication”
steel corrosion protection
steel corrosion protection
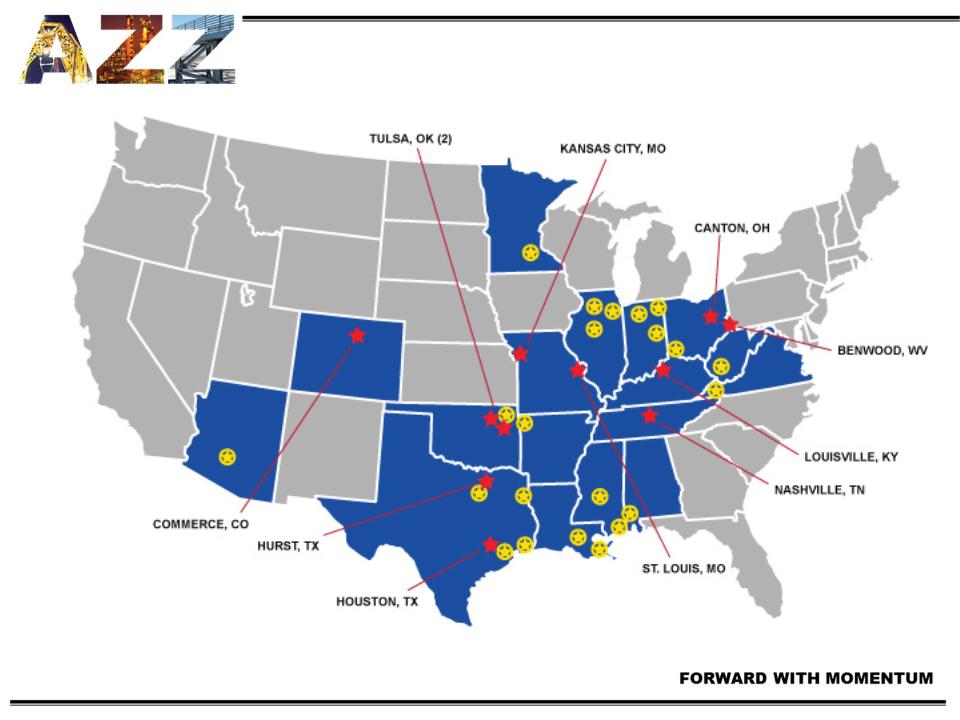
Locations: 33 facilities in 17 states
16
Galvanizing Services
Actual
FY2011
$218
(in millions)
Projected
FY2012
$265 to $280
(in millions)
17
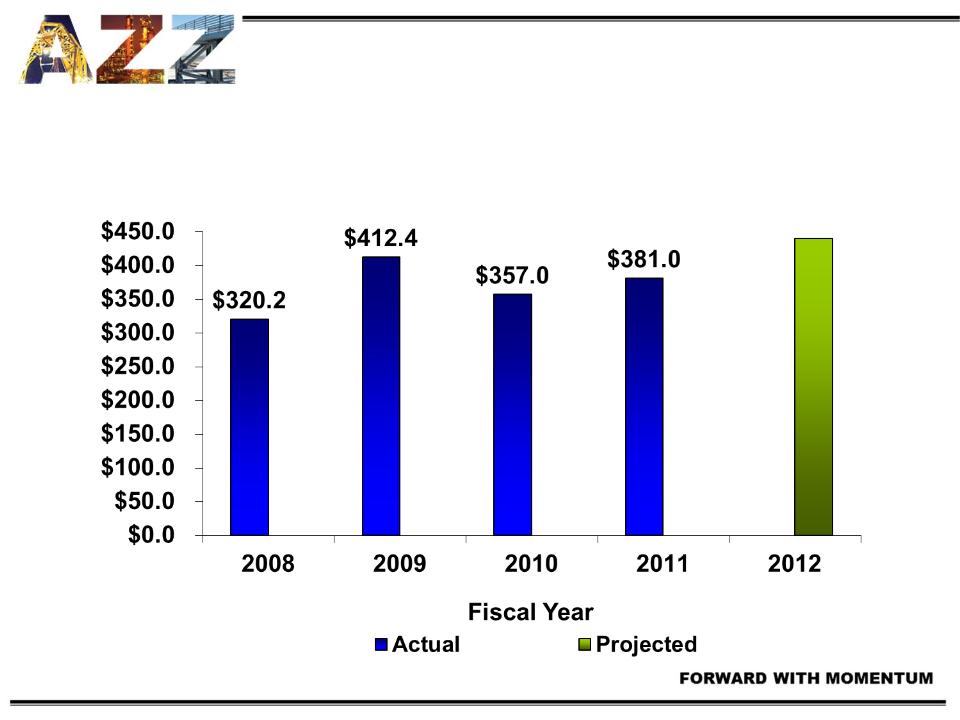
Consolidated Net Sales
($ In Millions)
($ In Millions)
$450 to
$475
$475
18
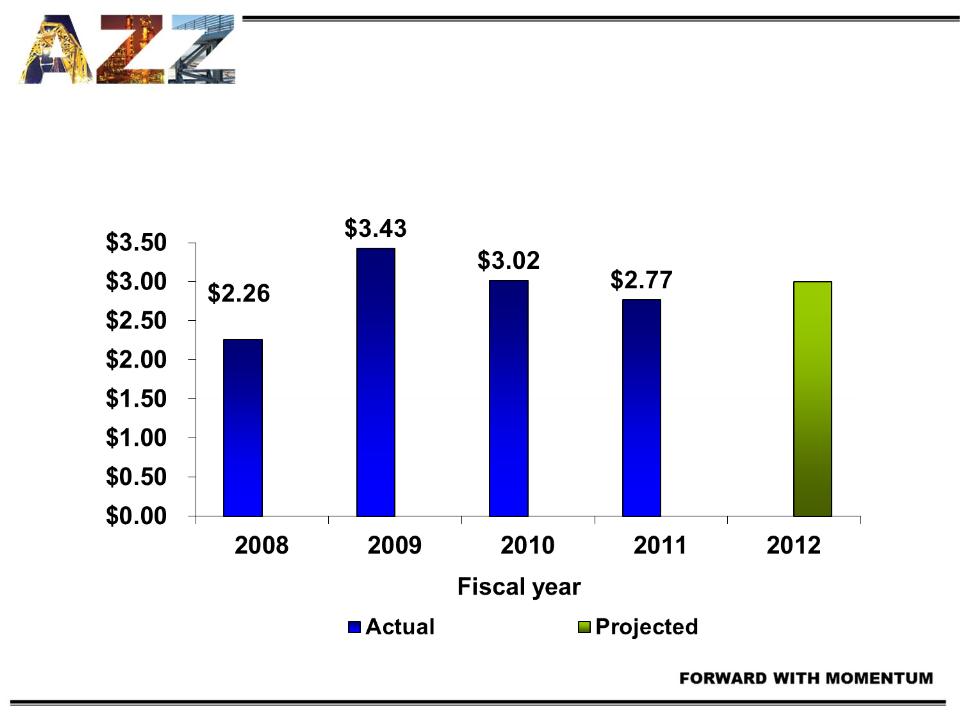
Earnings Per Share
(Fully Diluted)
(Fully Diluted)
$2.90 to
$3.10
$3.10
19
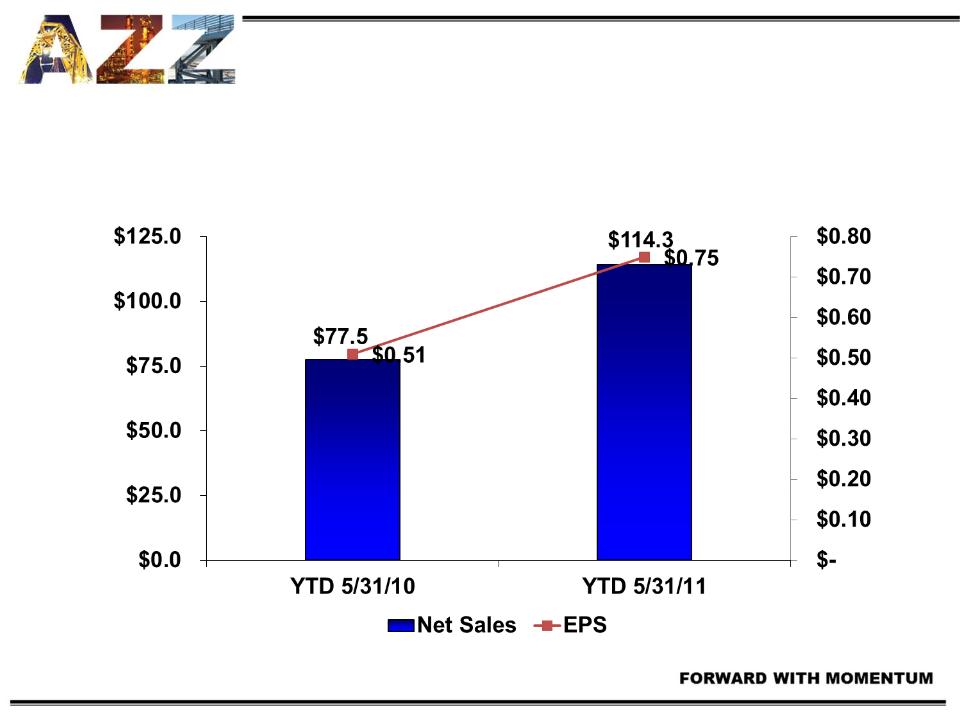
Consolidated Net Sales/Earnings Per Share
First Three Months FY12
First Three Months FY12
20
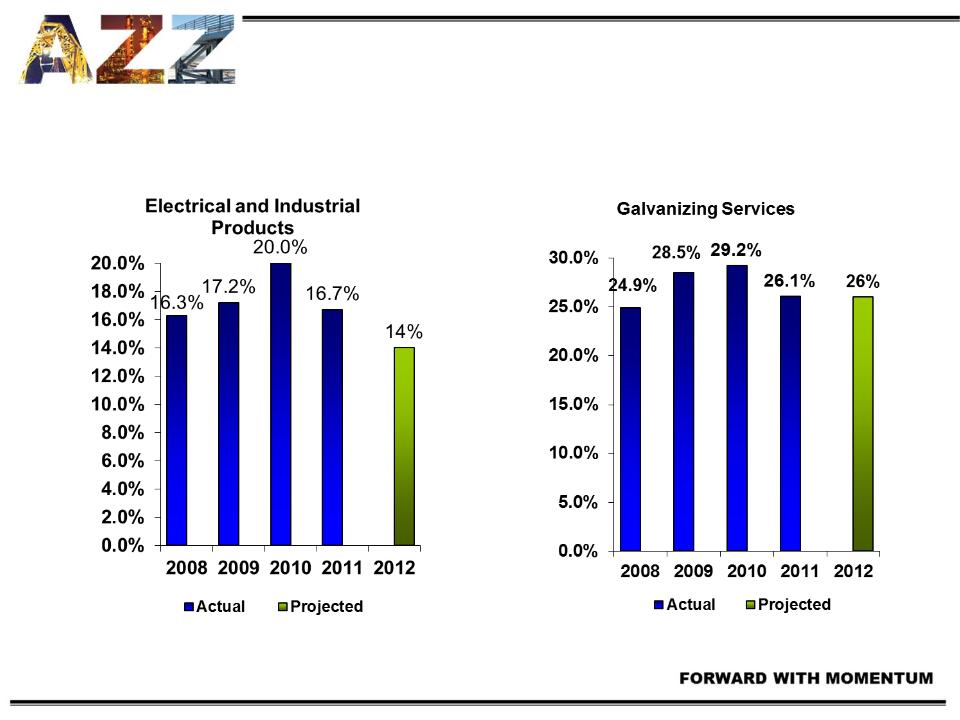
Operating Margins
21
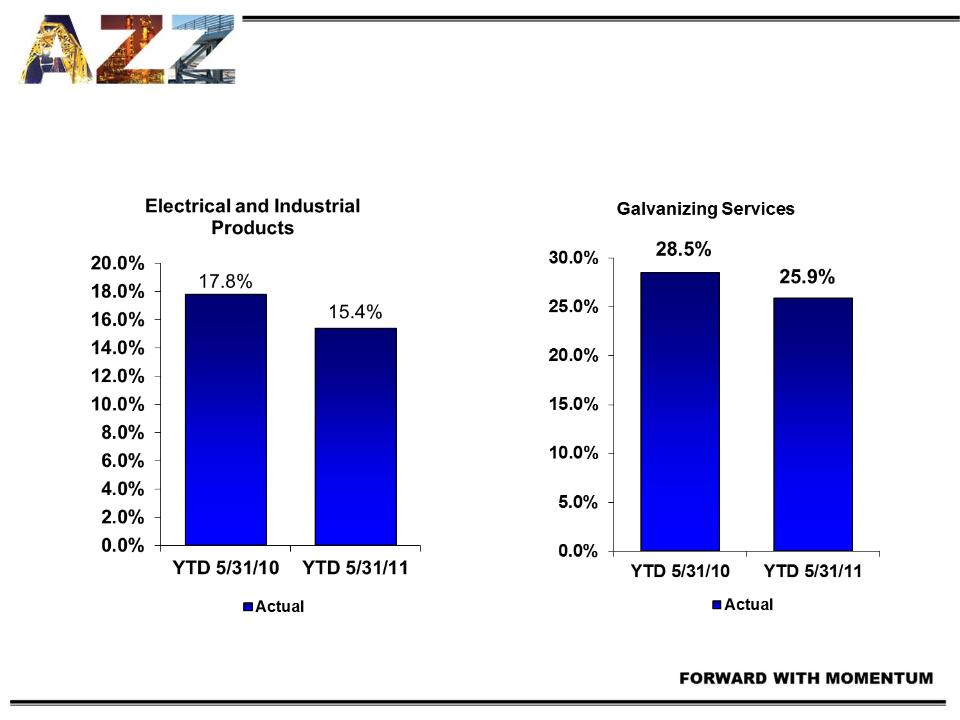
Operating Margins
First Three Months FY12
First Three Months FY12
22
Projected
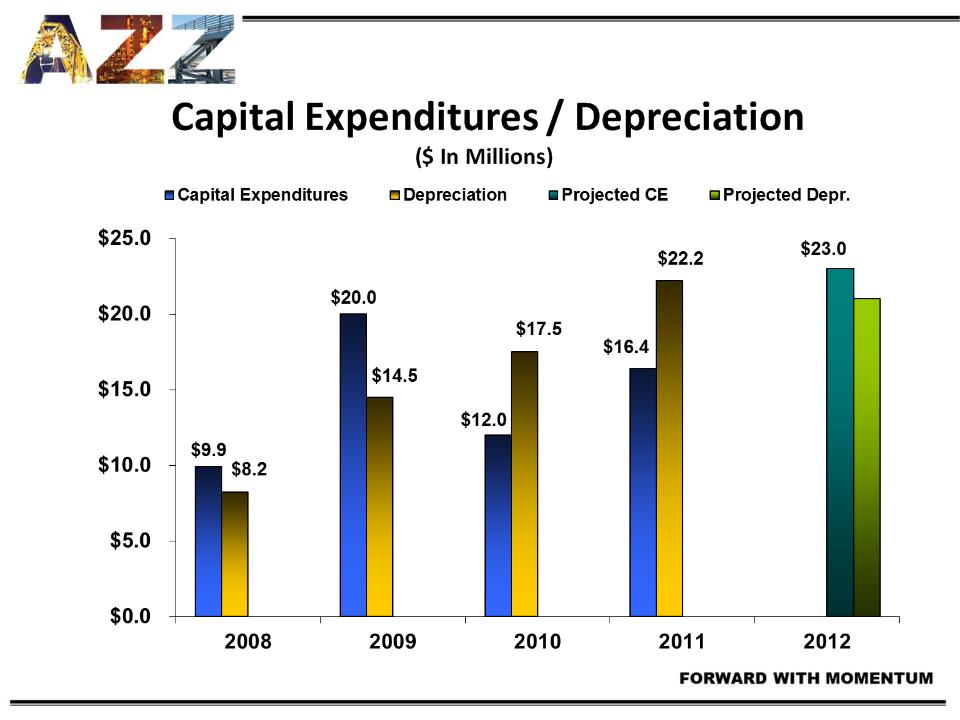
23
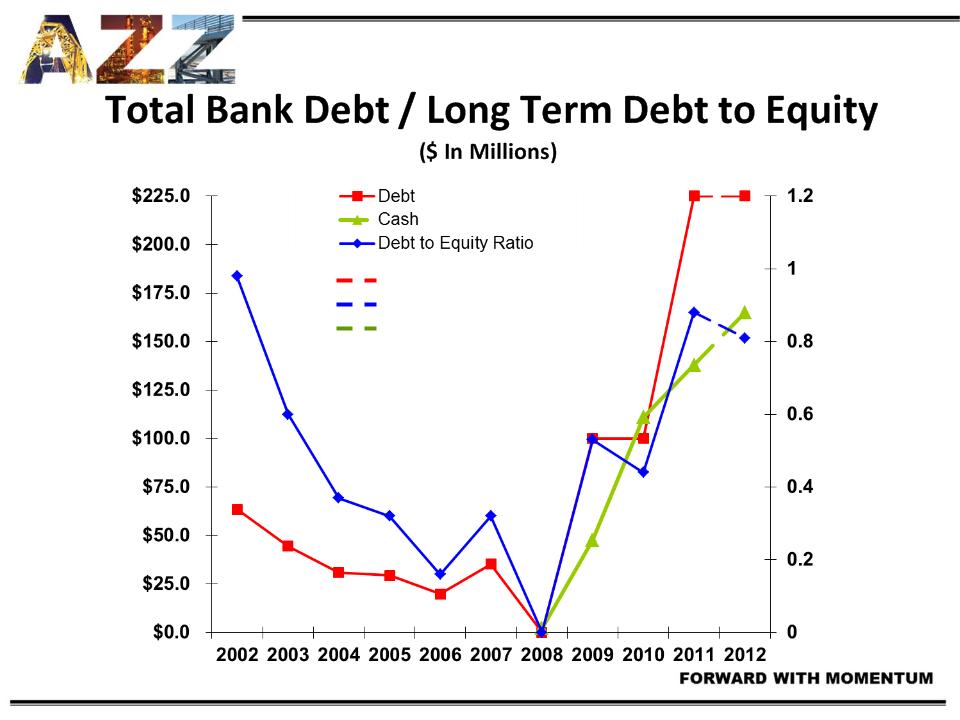
Projected Debt
Projected Debt to Equity Ratio
Projected Cash
Fiscal Year
24
$21.0
25
Return On Assets

26
Investment Summary
• Strong Historical Performance
• FY11 is the 24th consecutive year of profitability
• 5 Yr CAGR - Revenues 15%, Net Income 35%, EPS 32%
• Significant Operating Margins (above industry averages)
• Key Growth Drivers
• Domestic & international demand for electrical power and energy
• U.S. infrastructure investment
• Niche products and value added services with strong market share position
• Strong Management Team
• Successful acquisition track record and opportunities for further expansion and
growth
growth
• Strong balance sheet and cash flows
• Cash Dividend
27