Attached files
| file | filename |
|---|---|
| 8-K - FORM 8-K - Manitex International, Inc. | d8k.htm |
 Manitex International, Inc.
Corporate Presentation
(NASDAQ: MNTX)
June 2011
“Focused
manufacturer of
engineered lifting
equipment”
Exhibit 99.1 |
 2
Forward Looking Statements &
Non GAAP Measures
Safe Harbor Statement under the U.S. Private Securities Litigation Reform Act of
1995: This presentation contains statements that are forward-looking in
nature which express the beliefs and expectations of management including
statements regarding the Company’s expected results of operations or
liquidity; statements concerning projections, predictions, expectations,
estimates or forecasts as to our business, financial and operational results and future
economic performance; and statements of management’s goals and objectives and
other similar expressions concerning matters that are not historical
facts. In some cases, you can identify forward-looking statements by
terminology such as “anticipate,”
“estimate,”
“plan,”
“project,”
“continuing,”
“ongoing,”
“expect,”
“we believe,”
“we
intend,”
“may,”
“will,”
“should,”
“could,”
and similar expressions. Such statements are based on current plans,
estimates and expectations and involve a number of known and unknown risks,
uncertainties and other factors that could cause the Company's future
results, performance or achievements to differ significantly from the results,
performance or achievements expressed or implied by such forward-looking
statements. These factors and additional information are discussed in the
Company's filings with the Securities and Exchange Commission and statements
in this presentation should be evaluated in light of these important factors. Although we believe that
these statements are based upon reasonable assumptions, we cannot guarantee future
results. Forward-looking statements
speak
only
as
of
the
date
on
which
they
are
made,
and
the
Company
undertakes
no
obligation
to
update
publicly or revise any forward-looking statement, whether as a result of new
information, future developments or otherwise.
Non-GAAP
Measures:
Manitex
International
from
time
to
time
refers
to
various
non-GAAP
(generally
accepted
accounting
principles)
financial
measures
in
this
presentation.
Manitex
believes
that
this
information
is
useful
to
understanding its operating results without the impact of special items. See
Manitex’s first quarter 2011 earnings release
on
the
Investor
Relations
section
of
our
website
www.manitexinternational.com
for
a
description
and/or
reconciliation of these measures.
“Focused
manufacturer of
engineered lifting
equipment” |
 3
Company Snapshot
“Focused
manufacturer of
engineered lifting
equipment”
Manitex
International, Inc.
Global provider of highly specialized and custom configured
cranes, materials and container handling equipment sold
through dealerships
Launched as a private company in 2003, Manitex International,
is publicly traded as NASDAQ:MNTX and has steadily grown
organically and as a consolidator in its industry, acquiring seven
branded product lines since going public in 2006
Energy, utilities, military, railroads, port, government/agency
Niches
Served
Company
Origin |
 4
Summary Financials
“Focused
manufacturer of
engineered lifting
equipment”
Financial Summary
Total Enterprise Value
(06/03/2011):
$90.9 million
Market Cap (06/03/2011):
$57.0 million
2010 Revenue:
$95.9 million
2010 Net Income:
$2.1 million
2010 EBITDA:
$8.7 million
Stock Price (06/03/2011):
$5.00
Ticker / Exchange:
MNTX / NASDAQ
Equity Capitalization
Diluted shares outstanding
03/31/2011):
11.6 million
Warrants outstanding (03/31/2011):
$4.4 million
Avg. warrant strike price
$4.59
$000, except percentages
2007
2008
2009
2010
Revenues
$106,946
$106,341
$55,887
$95,875
Gross Margin (%)
18.6%
16.4%
20.0%
24.3%
EBITDA
$8,461
$5,416
$1,982
$8,676
EBITDA Margin (%)
7.9%
5.1%
3.5%
9.0%
Net income
$2,126
$1,799
$3,639*
$2,109
*includes gain on bargain purchase of $3,815 |
 Investment Highlights
“Focused
manufacturer of
engineered lifting
equipment”
2010: Solid return to operating & net profitability
–
Sales rebounded to $95.9 million, a 72% year-over-year increase
–
Backlog advanced 80% to $40 million at 12/31/2010
–
2010 gross margin 24%, $6.7 million increase in EBITDA
–
Record full year 2010 EBITDA margin of 9%
Experienced senior management
–
Over 70 years of collective experience from
well-known
industrial
leaders
-
Terex,
Manitowoc, Rolls Royce, GKN Sinter Metals,
Grove and Genie
Global presence ~ 25K units
Operates worldwide
Equipment dealerships throughout world
–
High recurring parts revenue stream: approximately 20% of
total sales (average 40% margin
Growing market share
–
Increased penetration: oil and gas, power grid & rail
–
Rebounding commercial sales
–
Expanding international sales
Focused on earnings, cash flow
& working capital management
5 |
 6
Manitex International Businesses
“Focused
manufacturer of
engineered lifting
equipment”
Growth Strategy
•
Organic growth
•
Strategic acquisitions
•
International diversification
•
Exploit synergies
Serving Major Industries
Business Model
Business Model
•
Accretive, high margin niche
acquisitions; utilize seller
financing
•
2009: Badger & LoadKing
•
2010: CVS rental agreement
Global Provider
Global Provider
•
Boom trucks
•
Sign cranes
•
Rough-terrain cranes
•
Specialized material handling
equipment
•
Reach stackers and container
handling equipment
•
Energy
•
Utilities
•
Commercial
building
•
Rental fleets
•
Cargo transport
•
Infrastructure
dev.
•
Port & Inter-
Modal |
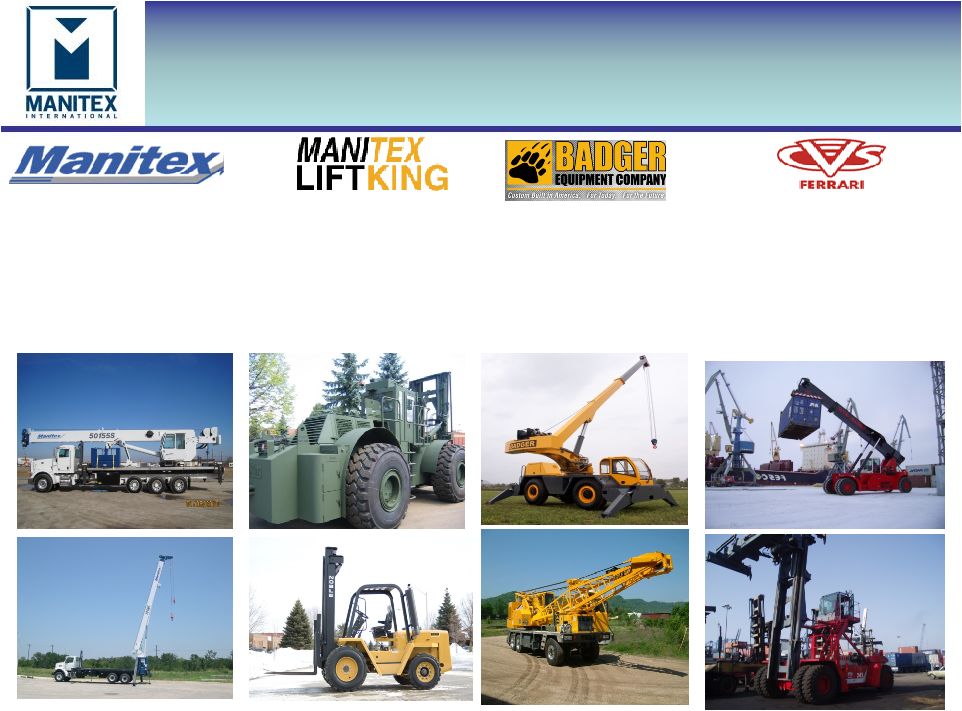 7
“Focused
manufacturer of
engineered lifting
equipment”
•
Engineered lifting
equipment
•
Manitex boom trucks
•
SkyCrane aerial platforms
•
Sign cranes
•
Rough terrain forklifts
•
Special mission-oriented
vehicles
•
Carriers
•
Heavy material handling
•
Transporters & steel mill
equipment
•
Specialized railroad and
material handling
equipment since 1945
•
Has built ~ 10,000 units
•
Container handling
equipment for the global
port and inter-modal
sectors.
•
Products: reach stackers,
laden and unladen
container forklifts &
straddle carriers
Product
Overview |
 8
Key Management
“Focused
manufacturer of
engineered lifting
equipment”
Name & Title
Experience
David Langevin
Chairman & CEO
20+ years principally with Terex
Andrew Rooke
President & COO
20+ years principally with Rolls Royce, GKN Sinter
Metals, Off-Highway & Auto Divisions
David Gransee
CFO & Treasurer
Formerly with Arthur Andersen, 15+ years with Eon
Labs (formerly listed)
Robert Litchev
President –
Manufacturing
Operations
10+ years principally with Terex
Scott Rolston
SVP Sales & Marketing –
Manitex
International
13+ years principally with Manitowoc |
 2010
2008
2009
2007
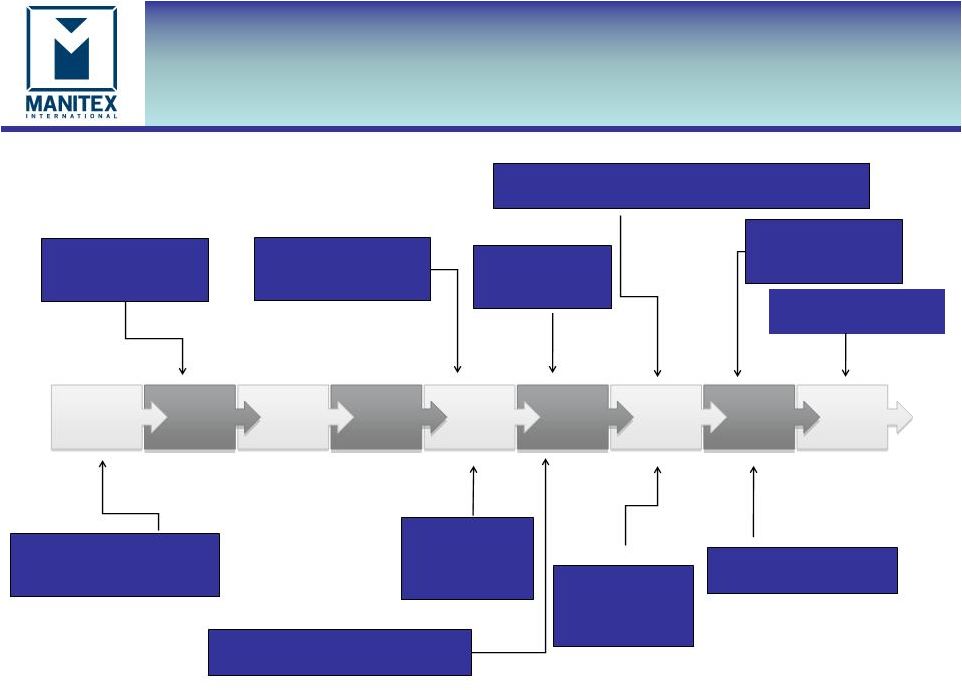
9
Company Timeline
“Focused
manufacturer of
engineered lifting
equipment”
March 2002:
Manitowoc (NYSE:MTW)
acquires Grove
January 2003:
Manitowoc divests
Manitex
December 2009:
Acquires Load
King Trailers
July 2009: Acquires
Badger Equipment Co.
November
2006: VCC
Acquires
LiftKing
July 2007: VCC
acquires Noble
forklift
August 2007: Sale of assets and
closure of legacy VCC business
May 2008: Name changed to Manitex International
and listed on Nasdaq (MNTX)
October 2008:
Acquires Crane
& Machinery and
Schaeff Forklift
July 2006: Manitex
merges into Veri-Tek,
Intl. (VCC)
July 2010 : CVS
Operating Agreement
2006
2004
2002
2005
2003 |
 10
Transformational Acquisition
(subject to approval)
“Focused
manufacturer of
engineered lifting
equipment”
Pre-7/10: CVS SpA
•Near Milan, Italy
•Designed &
manufactured stackers &
lifting equipment for
global container handling
market
2008: CVS SpA
•Annual sales of $106M
prior to global downturn
2011
•Rental period could extend for up to
two years but creditors approval was
received in May 2011 so expect
completion Q3 2011
July 2010: MNTX CVS Ferrari srl
•MNTX subsidiary
•Rental agreement for certain assets
of CVS SpA in liquidation on an
exclusive basis filed with Italian court.
Includes offer to purchase at end of
insolvency process
Adds global products & scale
European manufacturing & design
Above average growth profile in containers / ports / inter-modal
sectors •
Consolidated sales &
profit from 07/10
•
No assumption of “old
CVS”
debt or liabilities
•
Revenues currently
tracking at approx
$2M/month |
 11
Replacement Parts & Service
Consistent Recurring Revenue
“Focused
manufacturer of
engineered lifting
equipment”
•
Recurring revenue of approximately 20% of total sales
•
Spares relate to swing drives, rotating components, and booms among others,
many of which are proprietary
–
Serve additional brands
–
Service team for crane equipment |
 12
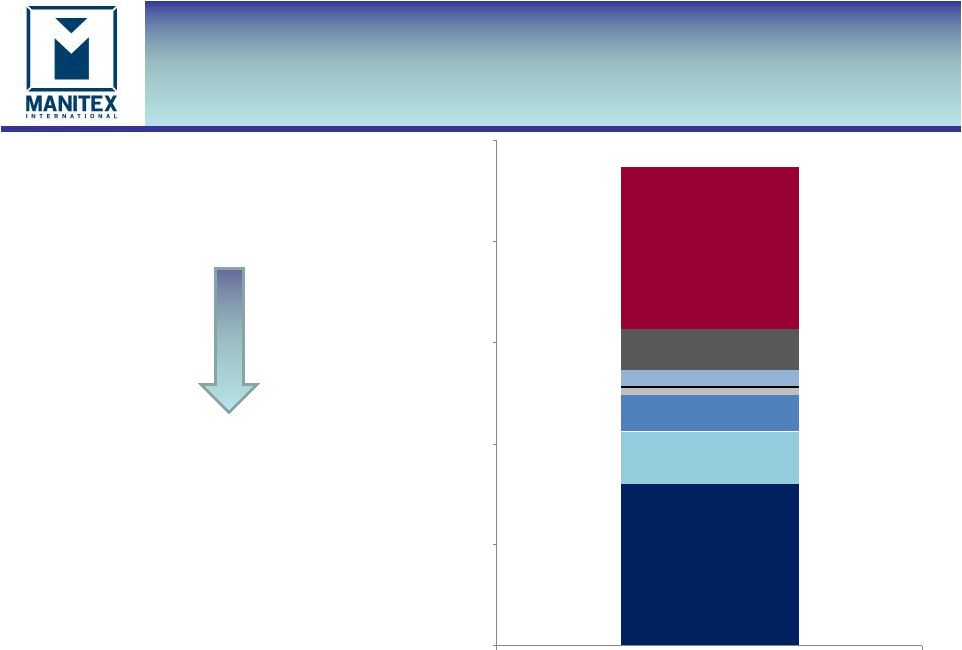
Pro-forma Revenues ($ millions)
“Focused
manufacturer of
engineered lifting
equipment”
•
We believe Pro-forma revenues are more
representative of revenue opportunity
than revenues in the current phase of the
economic cycle
Manitex, $80.0
Liftking, $26.0
Crane & Machinery, $18.1
Schaeff, $3.3
Noble, $1.1
Badger, $8.0
LoadKing, $20.0
CVS Ferrari, $80.0
$0.0
$50.0
$100.0
$150.0
$200.0
$250.0
Pro-forma Annual Revenue
•
Pro-forma revenues are based on 2007
revenue numbers for each respective
business, regardless of date of
acquisition by Manitex International |
 13
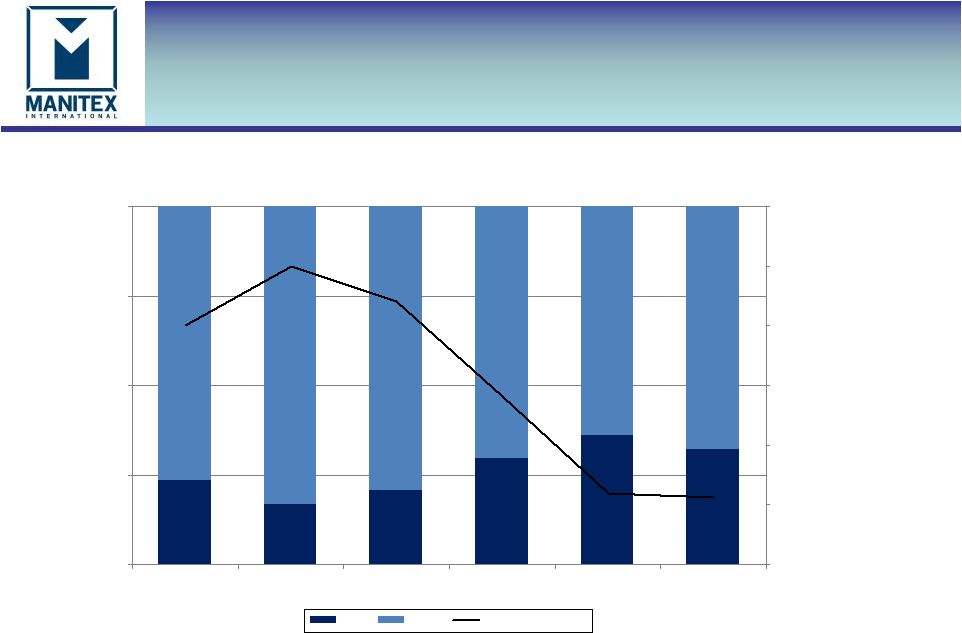
Increased Market Share as
Market Declined
“Focused
manufacturer of
engineered lifting
equipment”
Boom Truck Crane Market
23.4%
16.7%
20.8%
29.6%
36.1%
32.0%
76.6%
83.3%
79.2%
70.4%
63.9%
68.0%
0.0%
25.0%
50.0%
75.0%
100.0%
2005
2006
2007
2008
2009
2010
Market Share
0
500
1000
1500
2000
2500
3000
Units Shipped
MNTX
Others
Total Units Shipped |
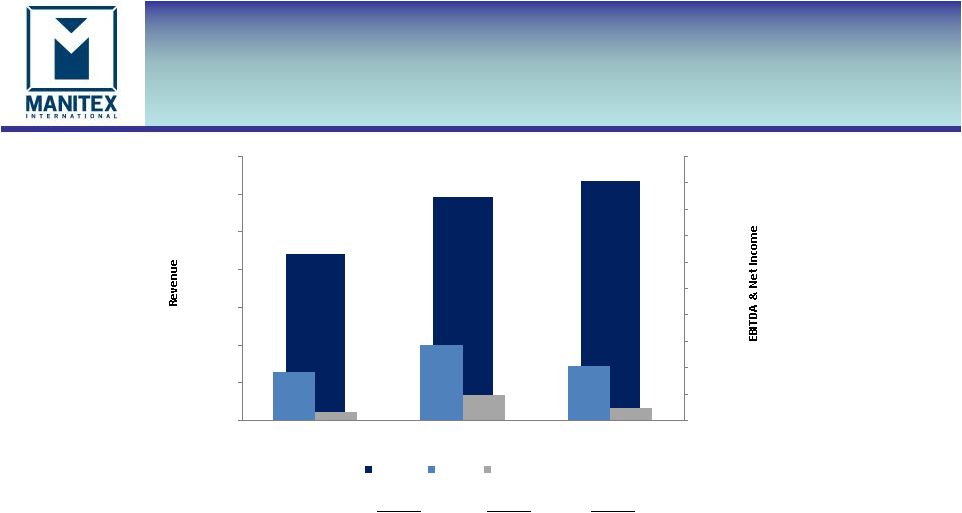
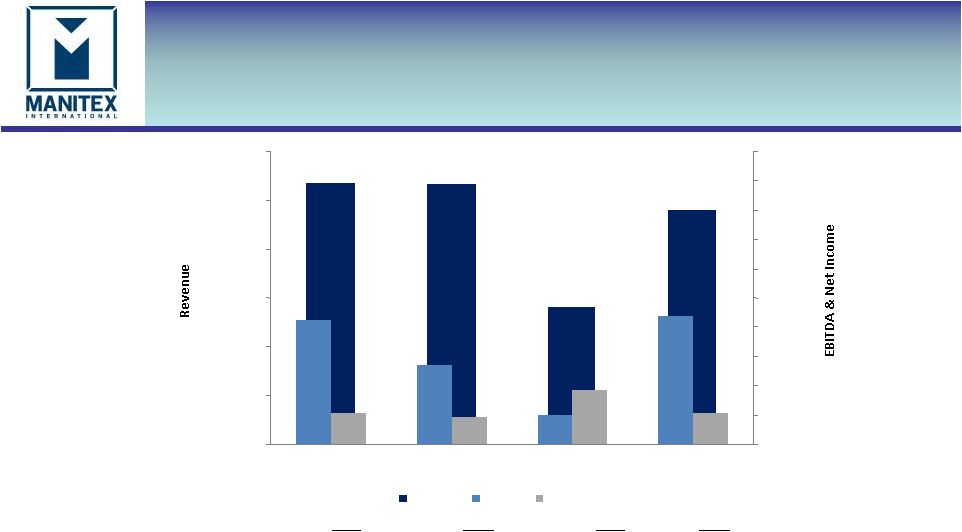 14
Select Financial Data
“Focused
manufacturer of
engineered lifting
equipment”
$000, except percentages
2007
2008
2009
2010
Revenue
$106,946
$106,341
$55,887
$95,875
Gross Margin
18.6%
16.4%
20.0%
24.3%
EBITDA
8,461
5,416
1,982
8,676
EBITDA Margin (%)
7.9%
5.1%
3.5%
9.0%
Net Income
2,126
1,799
3,639 *
2,109
* Includes gain on bargain purchase of $3,815
$106,946
$106,341
$55,887
$95,875
$8,461
$5,416
$1,982
$8,676
$1,799
$3,639
$2,109
$2,126
$0
$20,000
$40,000
$60,000
$80,000
$100,000
$120,000
2007
2008
2009
2010
$0
$2,000
$4,000
$6,000
$8,000
$10,000
$12,000
$14,000
$16,000
$18,000
$20,000
Revenue
EBITDA
Net Income |
 15
Growth Drivers-
2010 and Beyond
“Focused
manufacturer of
engineered lifting
equipment”
Worldwide improvements: GDP, economic recovery
Increased market penetration with product developments
& innovative distribution
Synergy with railroad industry
Specific products for Oil & Gas, Railroads, Power Grid, Wind Power
Potential government infrastructure spending
International expansion
CVS Ferrari |
 16
Summary
“Focused
manufacturer of
engineered lifting
equipment”
•
Growing market share
•
Increased penetration in oil & gas, power grid
& rail
•
Steady improvement in commercial sales
•
Coordinated distribution of products
worldwide
•
Continued expansion into international
markets
•
In the recent past have scaled business to
match demand; now look forward to long
term growth
•
Focused on earnings, cash flow and working
capital management
Delivering sound
operational and financial
performance despite
historic economic and
industry-specific
challenges
Poised for Growth |
 17
Appendix
“Focused
manufacturer of
engineered lifting
equipment”
Manitex International, Inc.
Corporate Presentation
May 2011 |
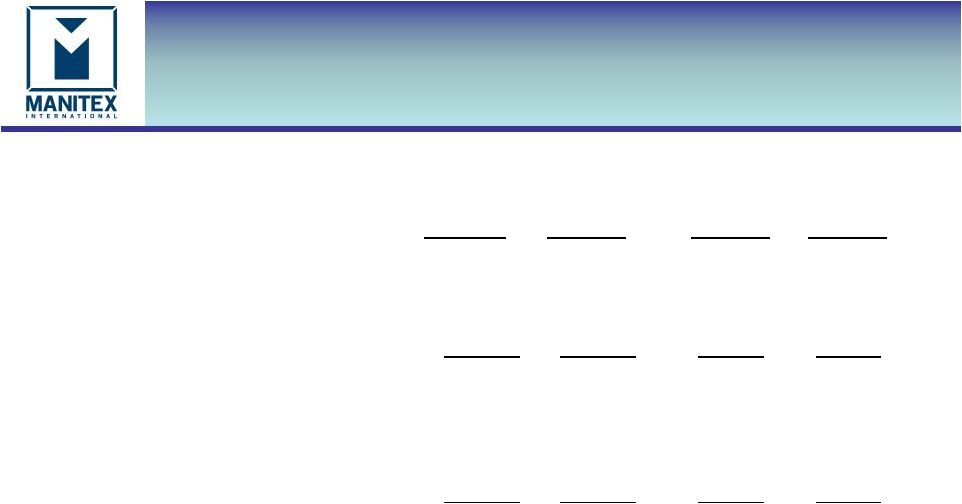
 18
Key Figures -
Quarterly
“Focused
manufacturer of
engineered lifting
equipment”
USD thousands
Q1-2010
Q4-2010
Q1-2011
Net sales
$21,970
$29,544
$31,722
% change to prior quarter
44%
7%
Gross profit
5,212
7,660
6,459
Gross margin %
23.7%
25.9%
20.4%
Operating expenses
4,169
5,605
5,207
Net Income
307
932
442
EBITDA
1,823
2,850
2,055
EBITDA % of Sales
8.3%
9.6%
6.5%
Backlog ($ million)
21.8
39.9
47.7
$21,970
$29,544
$31,722
$1,823
$2,850
$2,055
$932
$442
$307
$0
$5,000
$10,000
$15,000
$20,000
$25,000
$30,000
$35,000
Q1-2010
Q4-2010
Q1-2011
$0
$1,000
$2,000
$3,000
$4,000
$5,000
$6,000
$7,000
$8,000
$9,000
$10,000
Revenue
EBITDA
Net Income |
 19
Summarized Balance Sheet
“Focused
manufacturer of
engineered lifting
equipment”
Current assets
$59,242
$54,703
$40,147
$40,685
Fixed assets
10,387
10,659
11,804
5,878
Other long term assets
39,587
40,155
42,734
39,665
Total Assets
$109,216
$105,517
$94,685
$86,228
Current liabilities
25,413
23,011
14,569
17,062
Long term liabilities
39,786
39,232
39,688
34,152
Total Liabilities
$65,199
$62,243
$54,257
$51,214
Shareholders equity
44,017
43,274
40,428
35,014
Total liabilities & Shareholders equity
$109,216
$105,517
$94,685
$86,228
$000
31-Dec-08
31-Dec-09
31-Dec-10
31-Mar-11 |
 20
Debt & Liquidity
$000
Q1-2011
Q4-2010
Q1-2010
Total Cash
1,441
662
455
Total Debt
35,293
34,019
34,590
Total Equity
44,017
43,274
41,291
Net capitalization
77,869
76,631
75,426
Net debt / capitalization
43.5%
43.5%
45.3%
YTD EBITDA
2,055
8,676
1,823
YTD EBITDA % of sales
6.5%
9.0%
8.3%
•
Ebitda for Q1-2011 impacted by ConExpo expenditures of $0.5m
•
N. American revolver facility, based on available collateral at March 31, 2010 was $23.7m. In
Italy, additional
transactional
facilities
of
$2.4m
in
place
subject
to
collateral
for
CVS.
•
Cash and N. American revolver availability at March 31, 2010 $3.9m
•Net capitalization is the sum of debt plus equity minus cash.
•Net debt is total debt less cash
“Focused
manufacturer of
engineered lifting
equipment” |
 21
Working Capital
$000
Q1-2010
Q4 2010
Q1 2010
Working Capital
$33,829
$31,692
$27,914
Days sales outstanding
53
60
59
Days payable outstanding
63
62
47
Inventory turns
2.8
2.9
2.6
Current ratio
2.3
2.4
2.9
Operating working capital
38,174
36,763
31,840
Operating working capital % of
LQ sales
30.1%
31.1%
36.2%
•Increase in working capital Q1-2011 v Q4-2010 principally from increased
cash ($0.8m) and inventory ($4.8m), offset by decreased receivables ($1.1m) and
increased accounts payable, accruals & other liabilities ($1.8m)
•Inventory increase v Q4-2010 principally Manitex cranes and CVS
•Operating working capital improvement to 30% of annualized LQ sales
“Focused
manufacturer of
engineered lifting
equipment” |