Attached files
| file | filename |
|---|---|
| 8-K - FORM 8-K - CVR ENERGY INC | y91671e8vk.htm |
Exhibit 99.1
| CVR Energy, Inc. Anlyst Day June 14, 2011 |
| The following information contains forward-looking statements based on current expectations and beliefs, as well as a number of assumptions concerning future events. These statements are subject to risks, uncertainties, assumptions and other important factors. You are cautioned not to put undue reliance on such forward-looking statements (including forecasts and projections regarding our future performance) because actual results may vary materially from those expressed or implied as a result of various factors, including, but not limited to (i) those set forth under “Risk Factors” in CVR Energy, Inc.’s Annual Report on Form 10-K, Quarterly Reports on Form 10-Q and any other filings CVR Energy, Inc. makes with the Securities and Exchange Commission, and (ii) those set forth under “Risk Factors” and “Cautionary Note Regarding Forward-Looking in the CVR Partners, LP Prospectus and any other filings CVR Partners, LP makes with the Securities and Exchange Commission. CVR Energy, Inc. assumes no obligation to, and expressly disclaims any obligation to, update or revise any forward-looking statements, whether as a result of new information, future events or otherwise. |

| WELCOME |
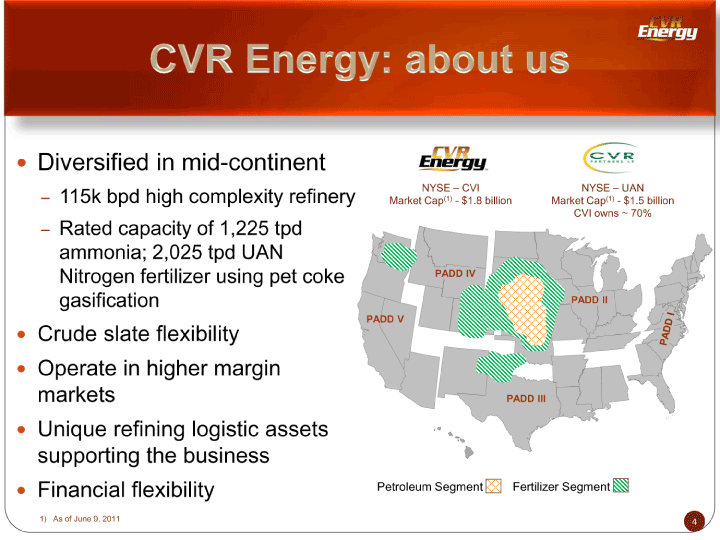
| Diversified in mid-continent 115k bpd high complexity refinery Rated capacity of 1,225 tpd ammonia; 2,025 tpd UAN Nitrogen fertilizer using pet coke gasification Crude slate flexibility Operate in higher margin markets Unique refining logistic assets supporting the business Financial flexibility |
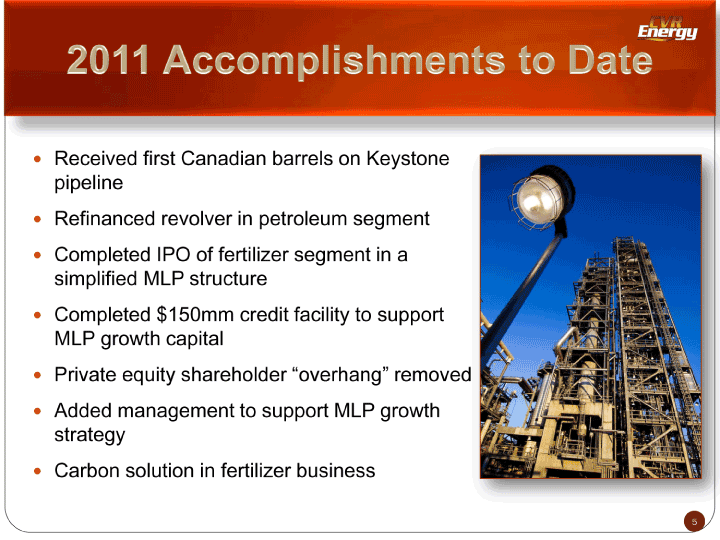
| Received first Canadian barrels on Keystone pipeline Refinanced revolver in petroleum segment Completed IPO of fertilizer segment in a simplified MLP structure Completed $150mm credit facility to support MLP growth capital Private equity Added management to support MLP growth strategy Carbon solution in fertilizer business |
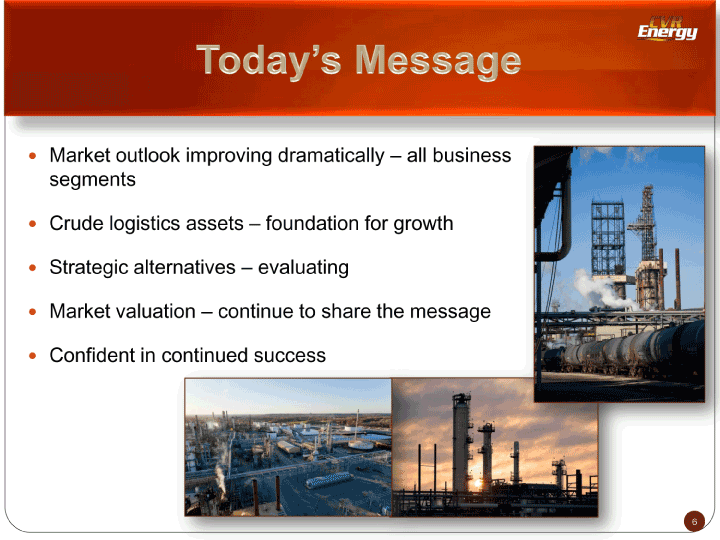
| Market outlook improving dramatically all business segments Crude logistics assets foundation for growth Strategic alternatives evaluating Market valuation continue to share the message Confident in continued success |

| Let’s Get Started |
| Issue: Our thoughts: Continued U.S. rationalization, PADD II continues to be Refinery Utilization under supplied |
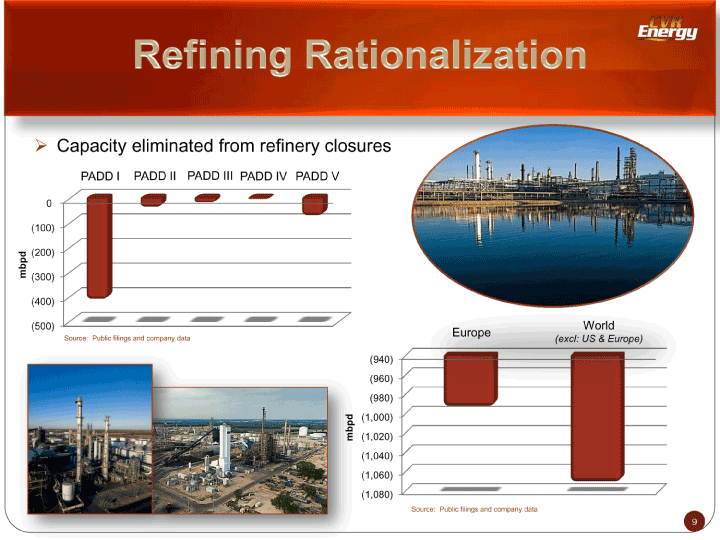
| Capacity eliminated from refinery closures PADD I PADD II PADD III PADD IV PADD V 0 (100) mbpd (200) (300) (400) (500) Source: Public filings and company data |
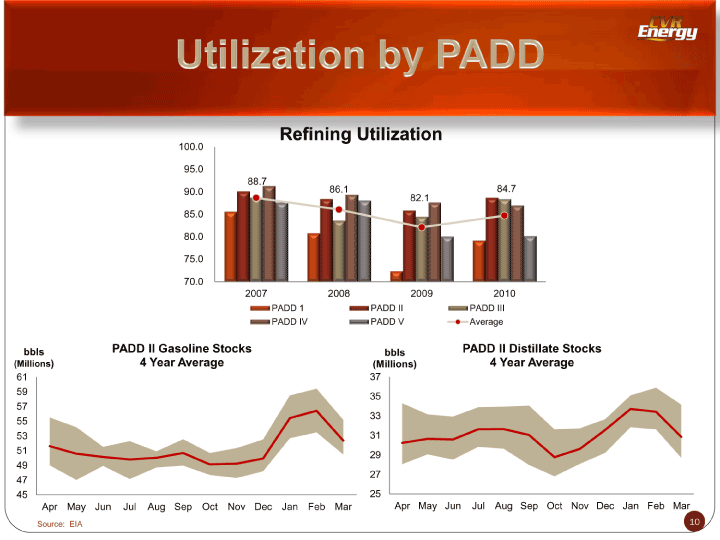
| Refining Utilization 100.0 95.0 88.7 90.0 86.1 84.7 82.1 85.0 80.0 75.0 70.0 2007 2008 2009 2010 PADD 1 PADD II PADD III PADD IV PADD V Average bbls PADD II Gasoline Stocks bbls PADD II Distillate Stocks (Millions) 4 Year Average (Millions) 4 Year Average 61 37 59 35 57 33 55 53 31 51 29 49 27 47 45 25 Apr May Jun Jul Aug Sep Oct Nov Dec Jan Feb Mar Apr May Jun Jul Aug Sep Oct Nov Dec Jan Feb Mar Source: EIA 10 |
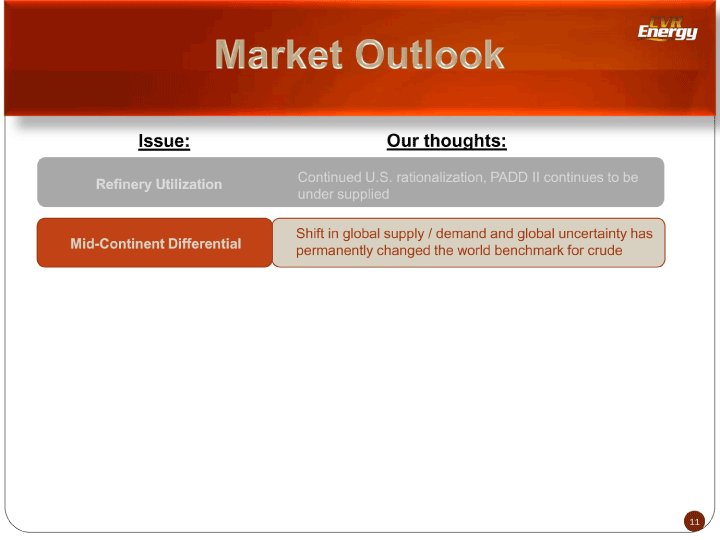
| Issue: Our thoughts: Continued U.S. rationalization, PADD II continues to be Refinery Utilization under supplied Shift in global supply / demand and global uncertainty has Mid-Continent Differential permanently changed the world benchmark for crude |
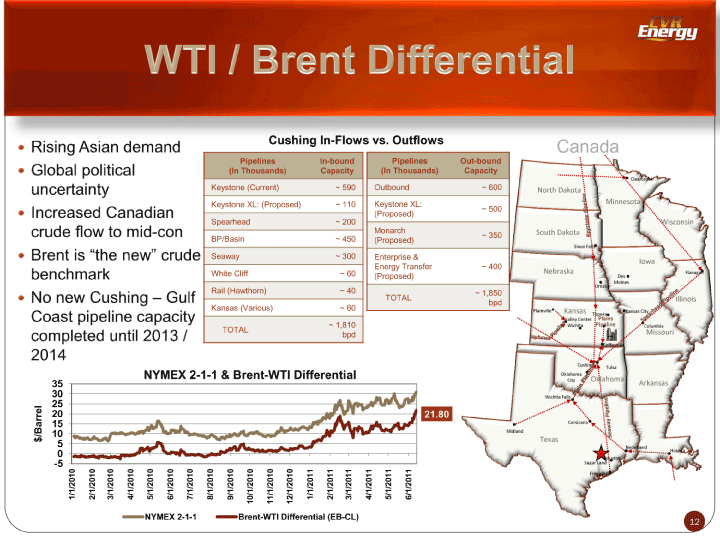
| Cushing In-Flows vs. Outflows Pipelines In-bound Pipelines Out-bound (In Thousands) Capacity (In Thousands) Capacity Keystone (Current) ~ 590 Outbound ~ 600 Keystone XL: (Proposed) ~ 110 Keystone XL: ~ 500 (Proposed) Spearhead ~ 200 Monarch ~ 350 BP/Basin ~ 450 (Proposed) Seaway ~ 300 Enterprise & Energy Transfer ~ 400 White Cliff ~ 60 (Proposed) Rail (Hawthorn) ~ 40 ~ 1,850 TOTAL bpd Kansas (Various) ~ 60 ~ 1,810 TOTAL bpd NYMEX 2-1-1 & Brent-WTI Differential 35 |
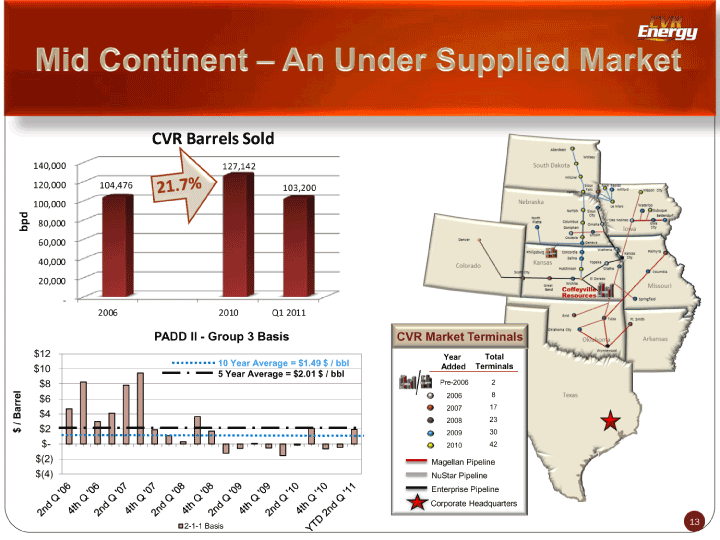
| CVR Barrels Sold 140,000 127,142 120,000 104,476 103,200 100,000 bpd 80,000 60,000 40,000 20,000 — 2006 2010 Q1 2011 PADD II — Group 3 Basis $12 10 Year Average = $1.49 $ / bbl $10 5 Year Average = $2.01 $ / bbl $8 Barrel $6 $4 / $2 $ $- $(2) $(4) 2-1-1 Basis |
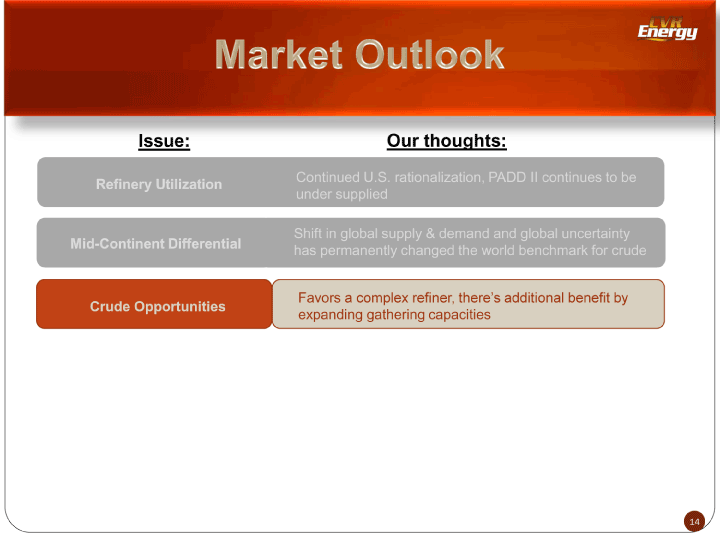
| Issue: Our thoughts: Continued U.S. rationalization, PADD II continues to be Refinery Utilization under supplied Shift in global supply & demand and global uncertainty Mid-Continent Differential has permanently changed the world benchmark for crude Favors a complex refiner, Crude Opportunities expanding gathering capacities |
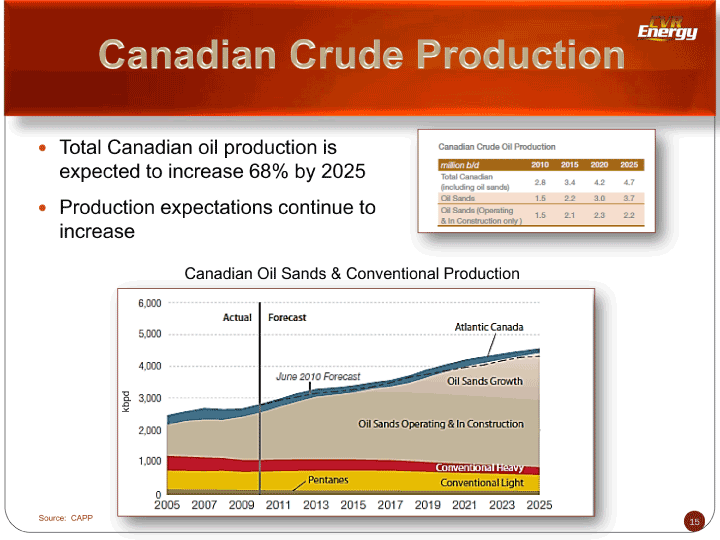
| Total Canadian oil production is expected to increase 68% by 2025 Production expectations continue to increase Canadian Oil Sands & Conventional Production kbpd |
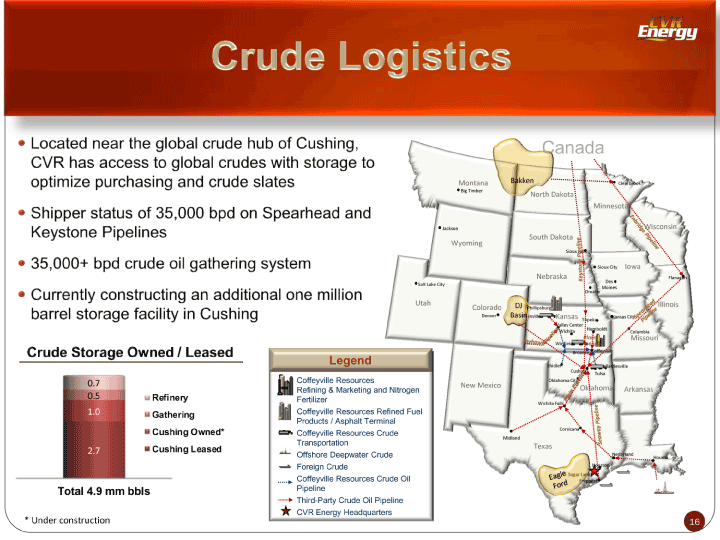
| Jackson Salt Lake City Utah Legend 0.7 Coffeyville Resources Refining & Marketing and Nitrogen 0.5 Refinery Fertilizer 1.0 Gathering Coffeyville Resources Refined Fuel Products / Asphalt Terminal Cushing Owned* Coffeyville Resources Crude Transportation 2.7 Cushing Leased Offshore Deepwater Crude Foreign Crude Coffeyville Resources Crude Oil Total 4.9 mm bbls Pipeline Third-Party Crude Oil Pipeline CVR Energy Headquarters * Under construction |
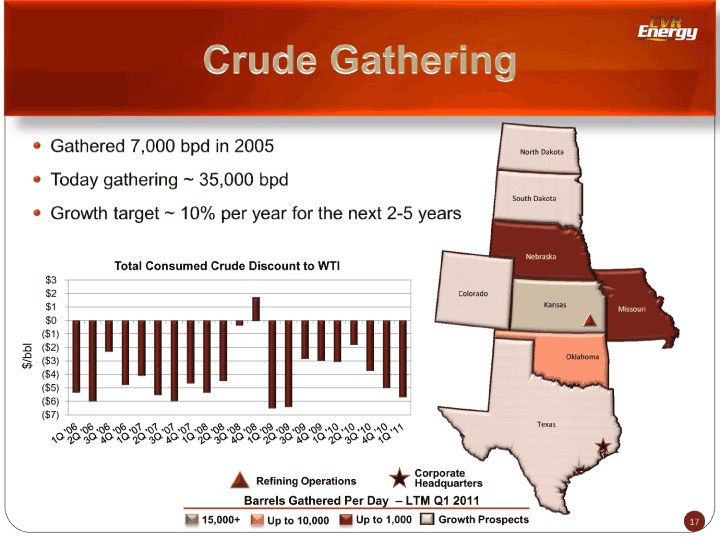
| North South Total Consumed Crude Discount to WTI $3 $2 Colorado $1 $0 ($1) /bbl ($2) ($3) $ ($4) ($5) ($6) ($7) Corporate Refining Operations Headquarters Barrels Gathered Per Day LTM Q1 2011 15,000+ Up to 10,000 Up to 1,000 Growth Prospects |
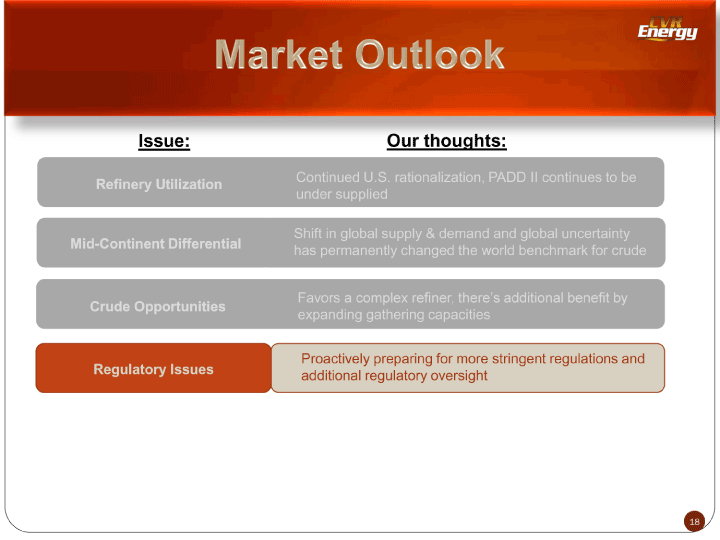
| Issue: Our thoughts: Continued U.S. rationalization, PADD II continues to be Refinery Utilization under supplied Shift in global supply & demand and global uncertainty Mid-Continent Differential has permanently changed the world benchmark for crude Favors a complex refiner, there’s Crude Opportunities expanding gathering capacities Proactively preparing for more stringent regulations and Regulatory Issues additional regulatory oversight |
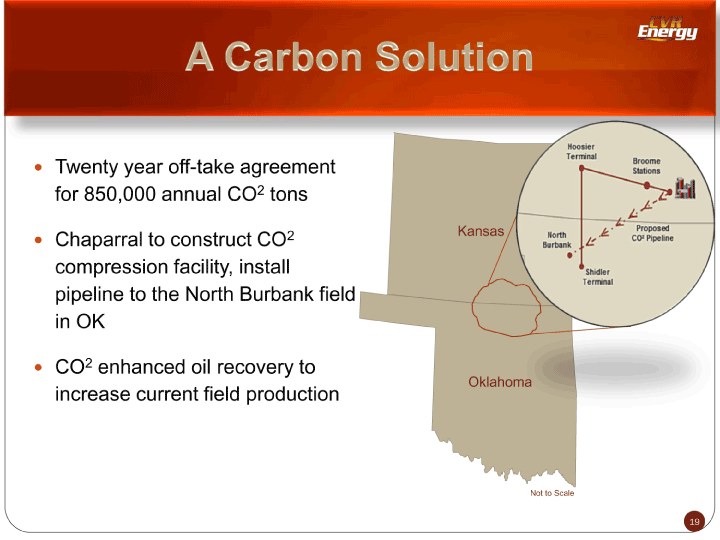
| Twenty year off-take agreement for 850,000 annual CO2 tons Chaparral to construct CO2 compression facility, install pipeline to the North Burbank field in OK CO2 enhanced oil recovery to increase current field production |
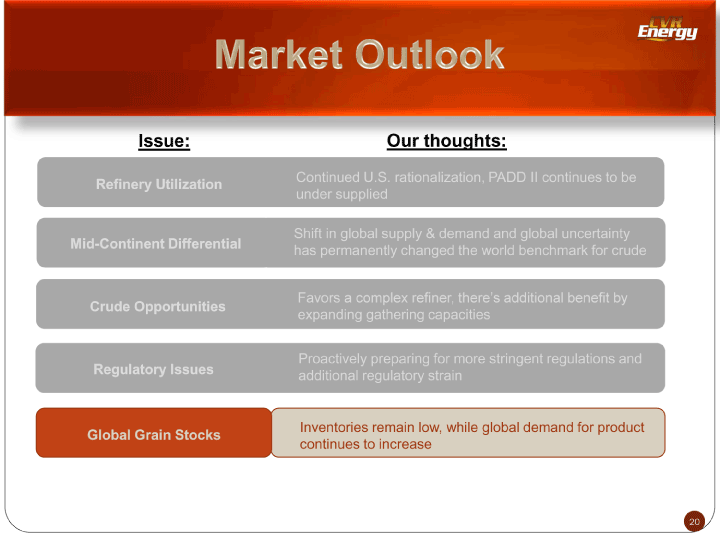
| Issue: Our thoughts: Continued U.S. rationalization, PADD II continues to be Refinery Utilization under supplied Shift in global supply & demand and global uncertainty Mid-Continent Differential has permanently changed the world benchmark for crude Favors a complex refiner, Crude Opportunities expanding gathering capacities Proactively preparing for more stringent regulations and Regulatory Issues additional regulatory strain Inventories remain low, while global demand for product Global Grain Stocks continues to increase |
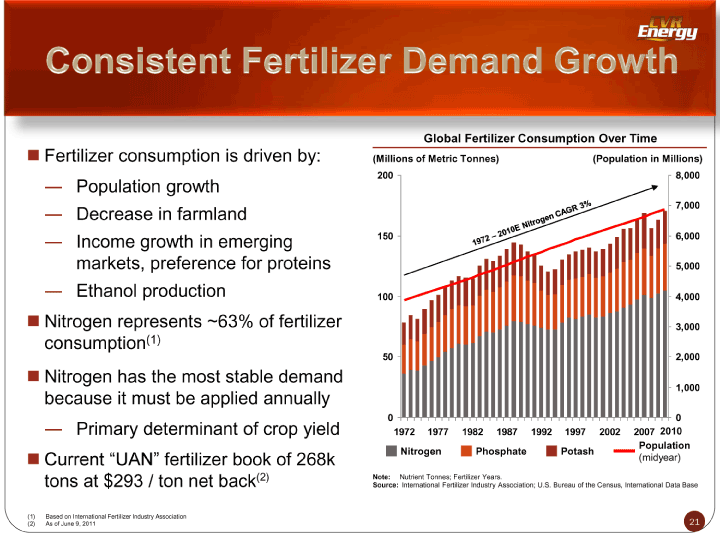
| Global Fertilizer Consumption Over Time Fertilizer consumption is driven by: (Millions of Metric Tonnes) (Population in Millions) 200 8,000 Population growth Decrease in farmland 7,000 Income growth in emerging 150 6,000 markets, preference for proteins 5,000 Ethanol production 100 4,000 Nitrogen represents ~63% of fertilizer 3,000 consumption(1) 50 2,000 Nitrogen has the most stable demand 1,000 because it must be applied annually 0 0 Primary determinant of crop yield 1972 1977 1982 1987 1992 1997 2002 2007 2010 Population Nitrogen Phosphate Potash Current UAN” fertilizer book of 268k” (midyear) tons at $293 / ton net back(2) Note: Nutrient Tonnes; Fertilizer Years. Source: International Fertilizer Industry Association; U.S. Bureau of the Census, International Data Base (1) Based on International Fertilizer Industry Association (2) As of June 9, 2011 21 |
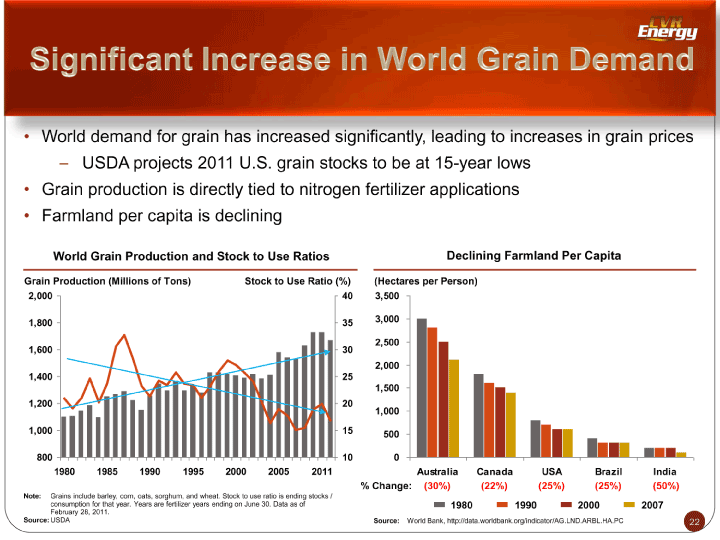
| • World demand for grain has increased significantly, leading to increases in grain prices — USDA projects 2011 U.S. grain stocks to be at 15-year lows • Grain production is directly tied to nitrogen fertilizer applications • Farmland per capita is declining World Grain Production and Stock to Use Ratios Declining Farmland Per Capita Grain Production (Millions of Tons) Stock to Use Ratio (%) (Hectares per Person) 2,000 40 3,500 1,800 35 3,000 2,500 1,600 30 2,000 1,400 25 1,500 1,200 20 1,000 1,000 15 500 800 10 0 1980 1985 1990 1995 2000 2005 2011 Australia Canada USA Brazil India % Change: (30%) (22%) (25%) (25%) (50%) Note: Grains include barley, corn, oats, sorghum, and wheat. Stock to use ratio is ending stocks / consumption for that year. Years are fertilizer years ending on June 30. Data as of 1980 1990 2000 2007 February 28, 2011. Source: USDA Source: World Bank, http://data.worldbank.org/indicator/AG.LND.ARBL.HA.PC 22 |
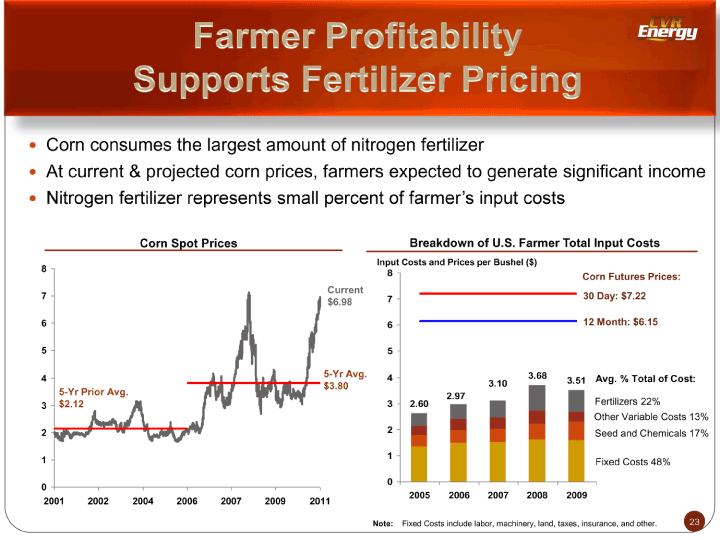
| Corn consumes the largest amount of nitrogen fertilizer At current & projected corn prices, farmers expected to generate significant income Nitrogen fertilizer represents small Corn Spot Prices Breakdown of U.S. Farmer Total Input Costs Input Costs and Prices per Bushel ($) 8 8 Corn Futures Prices: Current 7 7 30 Day: $7.22 $6.98 6 6 12 Month: $6.15 5 5 5-Yr Avg. 4 3.68 4 3.51 Avg. % Total of Cost: $3.80 3.10 5-Yr Prior Avg. 2.97 3$2.12 3 2.60 Fertilizers 22% Other Variable Costs 13% 2 2 Seed and Chemicals 17% 1 1 Fixed Costs 48% 0 0 2005 2006 2007 2008 2009 2001 2002 2004 2006 2007 2009 2011 Note: Fixed Costs include labor, machinery, land, taxes, insurance, and other. 23 |
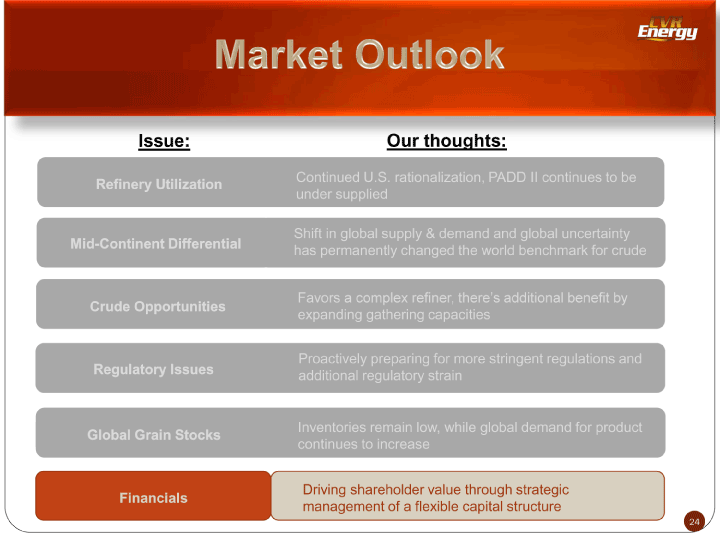
| Issue: Our thoughts: Continued U.S. rationalization, PADD II continues to be Refinery Utilization under supplied Shift in global supply & demand and global uncertainty Mid-Continent Differential has permanently changed the world benchmark for crude Favors a complex refiner, there’s Crude Opportunities expanding gathering capacities Proactively preparing for more stringent regulations and Regulatory Issues additional regulatory strain Inventories remain low, while global demand for product Global Grain Stocks continues to increase Driving shareholder value through strategic Financials management of a flexible capital structure 24 |
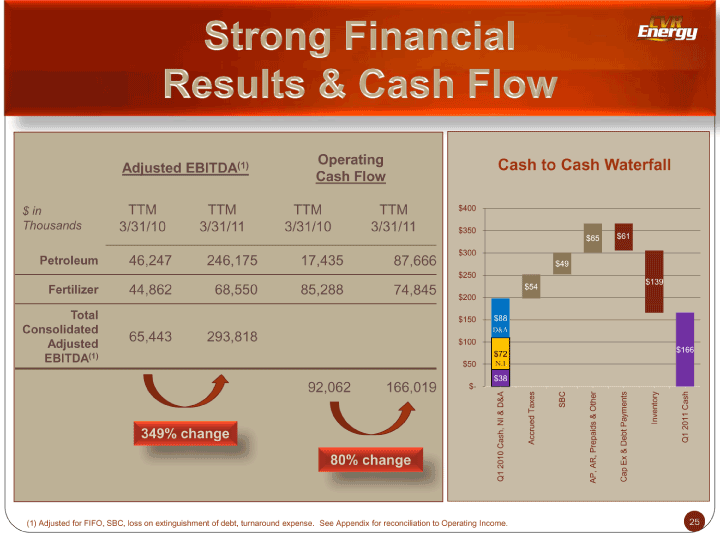
| Operating Cash to Cash Waterfall Adjusted EBITDA(1) Cash Flow $ in TTM TTM TTM TTM $400 Thousands 3/31/10 3/31/11 3/31/10 3/31/11 $350 $65 $61 $300 Petroleum 46,247 246,175 17,435 87,666 $49 $250 $139 Fertilizer 44,862 68,550 85,288 74,845 $54 $200 Total $150 $88 Consolidated D&A 65,443 293,818 $100 Adjusted $166 EBITDA(1) $72 $50 N.I. $38 92,062 166,019 $- Taxes SBC Payments Inventory & Other Accrued Prepaids 349% change Q1 2011 Cash 80% change Q1 2010 Cash, NI & D&A AP, AR, Cap Ex & Debt (1) Adjusted for FIFO, SBC, loss on extinguishment of debt, turnaround expense. See Appendix for reconciliation to Operating Income. 25 |
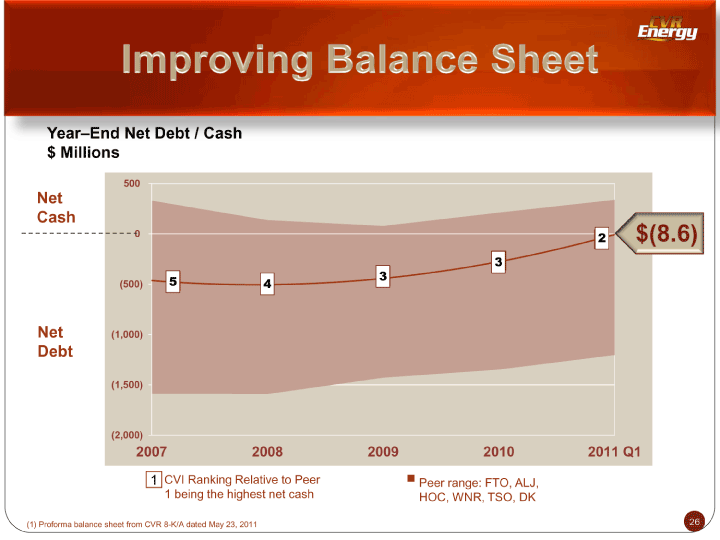
| Year— End Net Debt / Cash $ Millions 500 Net Cash 0 2 $(8.6) 3 5 3 (500) 4 Net (1,000) Debt (1,500) (2,000) 2007 2008 2009 2010 2011 Q1 1 CVI Ranking Relative to Peer Peer range: FTO, ALJ, 1 being the highest net cash HOC, WNR, TSO, DK (1) Proforma balance sheet from CVR 8-K/A dated May 23, 2011 26 |
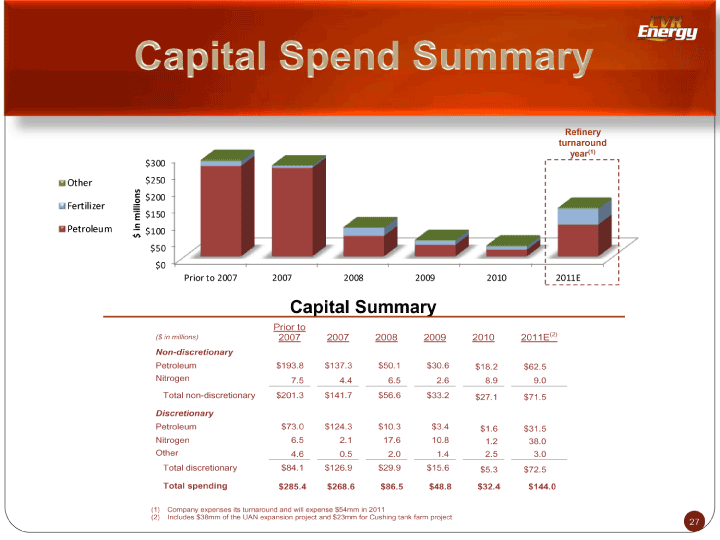
| Refinery turnaround year(1)$300 Other $250 millions $200 Fertilizer $150 Petroleum in $100 $ $50 $0 Prior to 2007 2007 2008 2009 2010 2011E Capital Summary Prior to ($ in millions) 2007 2007 2008 2009 2010 2011E(2) Non-discretionary Petroleum $193.8 $137.3 $50.1 $30.6 $18.2 $62.5 Nitrogen 7.5 4.4 6.5 2.6 8.9 9.0 Total non-discretionary $201.3 $141.7 $56.6 $33.2 $27.1 $71.5 Discretionary Petroleum $73.0 $124.3 $10.3 $3.4 $1.6 $31.5 Nitrogen 6.5 2.1 17.6 10.8 1.2 38.0 Other 4.6 0.5 2.0 1.4 2.5 3.0 Total discretionary $84.1 $126.9 $29.9 $15.6 $5.3 $72.5 Total spending $285.4 $268.6 $86.5 $48.8 $32.4 $144.0 (1) Company expenses its turnaround and will expense $54mm in 2011 (2) Includes $38mm of the UAN expansion project and $23mm for Cushing tank farm project 27 |
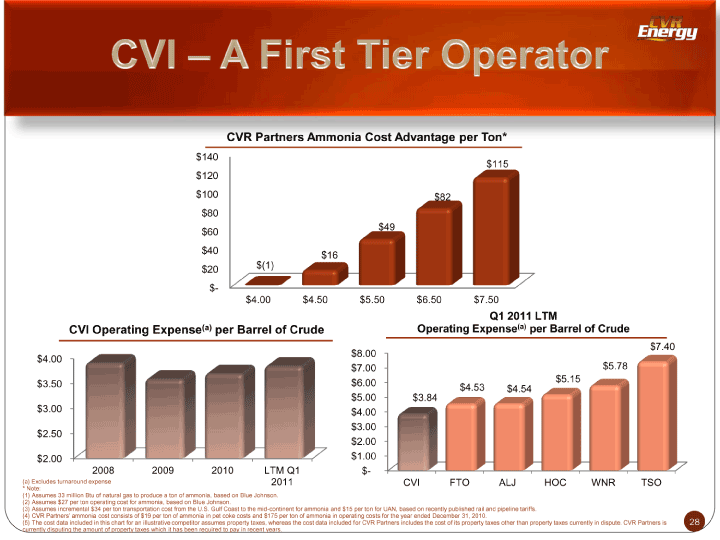
| CVR Partners Ammonia Cost Advantage per Ton* $140 $115 $120 $100 $82 $80 $49 $60 $40 $16 $20 $(1) $- $4.00 $4.50 $5.50 $6.50 $7.50 Q1 2011 LTM CVI Operating Expense(a) per Barrel of Crude Operating Expense(a) per Barrel of Crude $7.40 $8.00 $4.00 $7.00 $5.78 $6.00 $5.15 $3.50 $4.53 $4.54 $5.00 $3.84 $3.00 $4.00 $3.00 $2.50 $2.00 $2.00 $1.00 2008 2009 2010 LTM Q1 $- (a) Excludes turnaround expense 2011 CVI FTO ALJ HOC WNR TSO * Note: (1) Assumes 33 million Btu of natural gas to produce a ton of ammonia, based on Blue Johnson. (2) Assumes $27 per ton operating cost for ammonia, based on Blue Johnson. (3) Assumes incremental $34 per ton transportation cost from the U.S. Gulf Coast to the mid-continent for ammonia and $15 per ton for UAN, based on recently published rail and pipeline tariffs. (4) CVR Partners’ ammonia cost consists of $19 per ton of ammonia ts for the year ended December 31, in pet coke 2010.costs and $175 per ton of ammonia in (5) The cost data included in this chart for an illustrative competitor assumes property taxes, whereas the cost data included for CVR Partners includes the cost of its property taxes other than property taxes currently in dispute. CVR Partners is 28 currently disputing the amount of property taxes which it has been required to pay in recent years. |
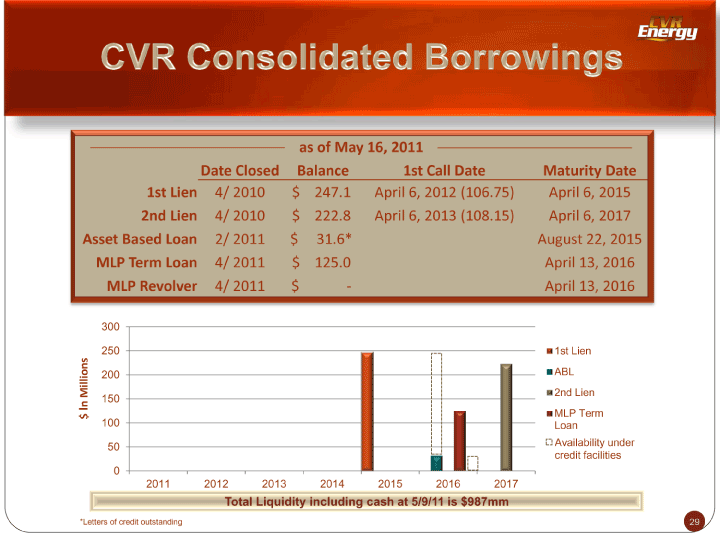
| as of May 16, 2011 Date Closed Balance 1st Call Date Maturity Date 1st Lien 4/ 2010 $247.1 April 6, 2012 (106.75) April 6, 2015 2nd Lien 4/ 2010 $222.8 April 6, 2013 (108.15) April 6, 2017 Asset Based Loan 2/ 2011 $31.6* August 22, 2015 MLP Term Loan 4/ 2011 $125.0 April 13, 2016 MLP Revolver 4/ 2011 $ — April 13, 2016 300 250 1st Lien 200 ABL 2nd Lien n Millions 150 I MLP Term $100 Loan 50 Availability under credit facilities 0 2011 2012 2013 2014 2015 2016 2017 Total Liquidity including cash at 5/9/11 is $987mm *Letters of credit outstanding 29 |
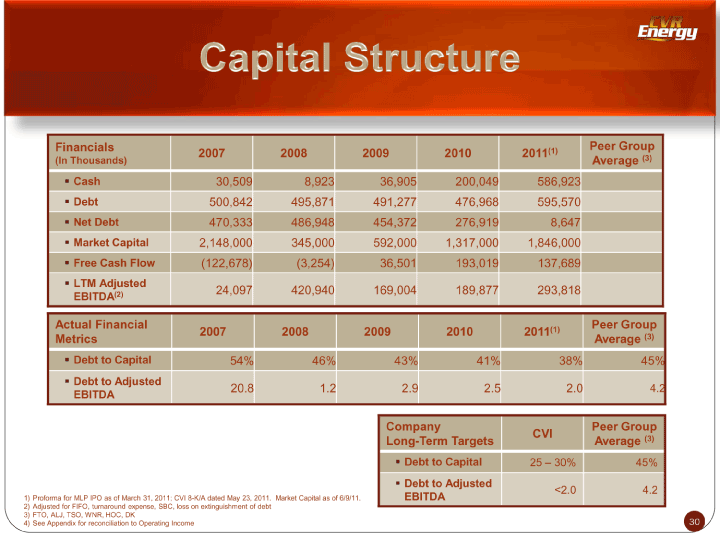
| Financials Peer Group 2007 2008 2009 2010 2011(1) (In Thousands) Average (3) Cash 30,509 8,923 36,905 200,049 586,923 Debt 500,842 495,871 491,277 476,968 595,570 Net Debt 470,333 486,948 454,372 276,919 8,647 Market Capital 2,148,000 345,000 592,000 1,317,000 1,846,000 Free Cash Flow (122,678) (3,254) 36,501 193,019 137,689 LTM Adjusted 24,097 420,940 169,004 189,877 293,818 EBITDA(2) Actual Financial Peer Group 2007 2008 2009 2010 2011(1)Metrics Average (3) Debt to Capital 54% 46% 43% 41% 38% 45% Debt to Adjusted 20.8 1.2 2.9 2.5 2.0 4.2 EBITDA Company Peer Group CVI Long-Term Targets Average (3) Debt to Capital 25 — 30% 45% Debt to Adjusted <2.0 4.2 1) Proforma for MLP IPO as of March 31, 2011; CVI 8-K/A dated May 23, 2011. Market Capital as of 6/9/11. EBITDA 2) Adjusted for FIFO, turnaround expense, SBC, loss on extinguishment of debt 3) FTO, ALJ, TSO, WNR, HOC, DK 4) See Appendix for reconciliation to Operating Income 30 |

| What’s Next 31 |
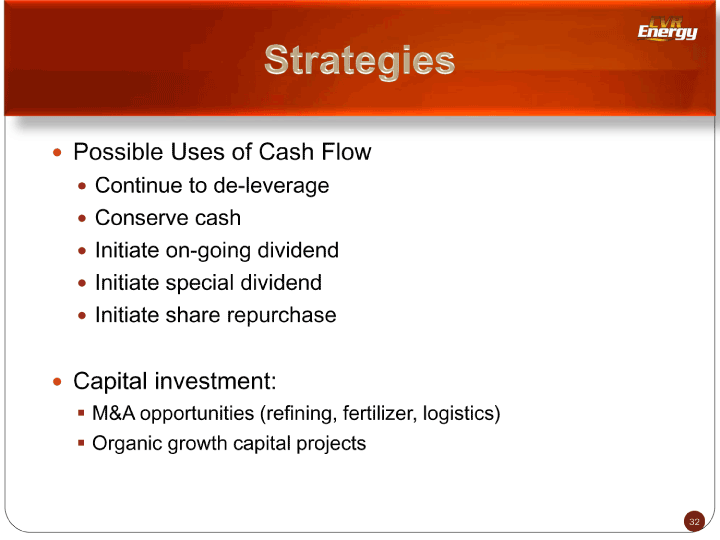
| Possible Uses of Cash Flow Continue to de-leverage Conserve cash Initiate on-going dividend Initiate special dividend Initiate share repurchase Capital investment: M&A opportunities (refining, fertilizer, logistics) Organic growth capital projects 32 |
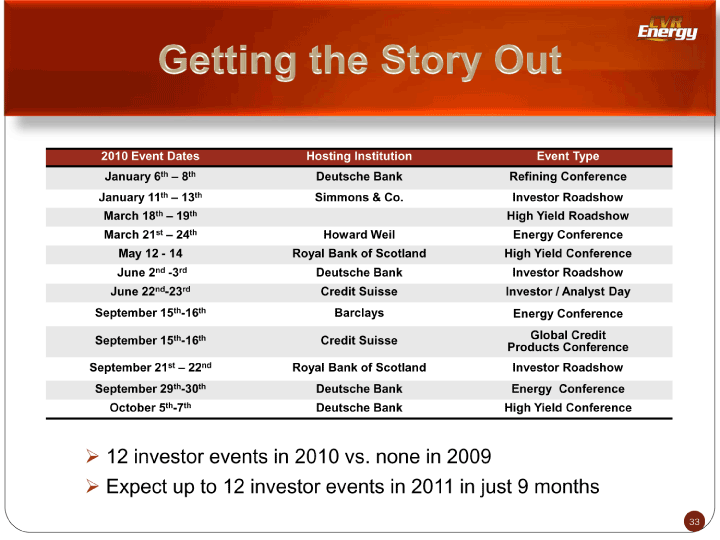
| 2010 Event Dates Hosting Institution Event Type January 6th — 8th Deutsche Bank Refining Conference January 11th — 13th Simmons & Co. Investor Roadshow March 18th — 19th High Yield Roadshow March 21st — 24th Howard Weil Energy Conference May 12 — 14 Royal Bank of Scotland High Yield Conference June 2nd -3rd Deutsche Bank Investor Roadshow June 22nd-23rd Credit Suisse Investor / Analyst Day September 15th-16th Barclays Energy Conference September 15th-16th Credit Suisse Global Credit Products Conference September 21st — 22nd Royal Bank of Scotland Investor Roadshow September 29th-30th Deutsche Bank Energy Conference October 5th-7th Deutsche Bank High Yield Conference 12 investor events in 2010 vs. none in 2009 Expect up to 12 investor events in 2011 in just 9 months 33 |
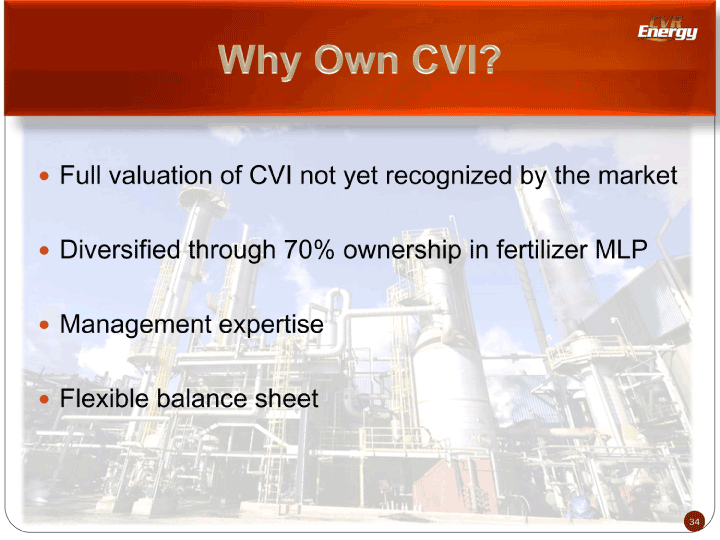
| Full valuation of CVI not yet recognized by the market Diversified through 70% ownership in fertilizer MLP Management expertise Flexible balance sheet 34 |

| Q & A 35 |
| Appendix 36 |
| To supplement the actual results in accordance with U.S. generally accepted accounting principles (GAAP), for the applicable periods, the Company also uses certain non-GAAP financial measures as discussed below, which are adjusted for GAAP-based results. The use of non-GAAP adjustments are not in accordance with or an alternative for GAAP. The adjustments are provided to enhance the overall understanding of the Company’s financial performance for the applicable periods and are also indicators that management utilizes for planning and forecasting future periods. The non-GAAP measures utilized by the Company are not necessarily comparable to similarly titled measures of other companies. The Company believes that the presentation of non-GAAP financial measures provides useful information to investors regarding the Company’s financial condition and results of operations because these measures, when used in conjunction with related GAAP financial measures (i) together provide a more comprehensive view of the Company’s core operations and ability to generate cash flow, (ii) provide investors with the financial analytical framework upon which management bases financial and operational planning decisions, and (iii) presents measurements that investors and rating agencies have indicated to management are useful to them in assessing the Company and its results of operations. 37 |
| EBITDA: EBITDA represents net income before the effect of interest expense, interest income, income tax expense (benefit) and depreciation and amortization. EBITDA is not a calculation based upon GAAP; however, the amounts included in EBITDA are derived from amounts included in the consolidated statement of operations of the Company. Adjusted EBITDA by operating segment results from operating income by segment adjusted for items that the company believes are needed in order to evaluate results in a more comparative analysis from period to period. Additional adjustments to EBITDA include major scheduled turnaround expense, the impact of the Company’s use of accounting for its inventory under first-in, first-out (FIFO), net realized gains/losses on derivative activities, share-based compensation expense, loss on extinguishment of debt, and other income (expense). Adjusted EBITDA is not a recognized term under GAAP and should not be substituted for operating income or net income as a measure of performance but should be utilized as a supplemental measure of financial performance in evaluating our business. First-in, first-out (FIFO): The Company’s basis for determining inventory value on a GAAP basis. Changes in crude oil prices can cause fluctuations in the inventory valuation of our crude oil, work in process and finished goods, thereby resulting in favorable FIFO impacts when crude oil prices increase and unfavorable FIFO impacts when crude oil prices decrease. The FIFO impact is calculated based upon inventory values at the beginning of the accounting period and at the end of the accounting period. 38 |
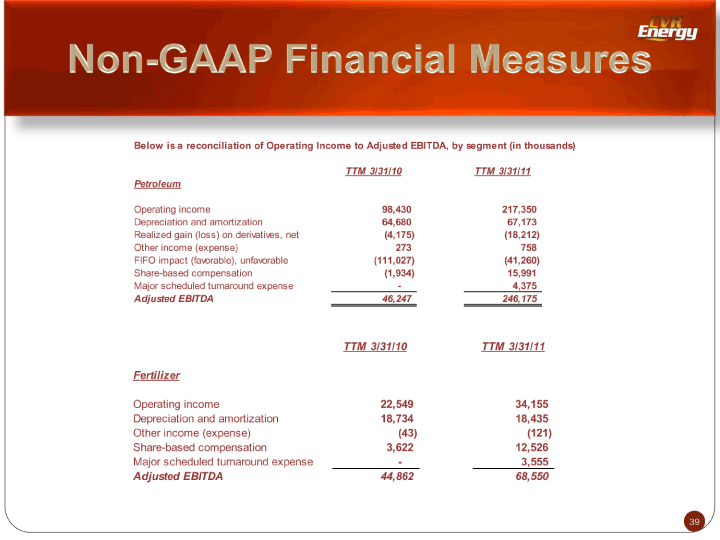
| Below is a reconciliation of Operating Income to Adjusted EBITDA, by segment (in thousands) TTM 3/31/10 TTM 3/31/11 Petroleum Operating income 98,430 217,350 Depreciation and amortization 64,680 67,173 Realized gain (loss) on derivatives, net (4,175) (18,212) Other income (expense) 273 758 FIFO impact (favorable), unfavorable (111,027) (41,260) Share-based compensation (1,934) 15,991 Major scheduled turnaround expense — 4,375 Adjusted EBITDA 46,247 246,175 TTM 3/31/10 TTM 3/31/11 Fertilizer Operating income 22,549 34,155 Depreciation and amortization 18,734 18,435 Other income (expense) (43) (121) Share-based compensation 3,622 12,526 Major scheduled turnaround expense - 3,555 Adjusted EBITDA 44,862 68,550 39 |
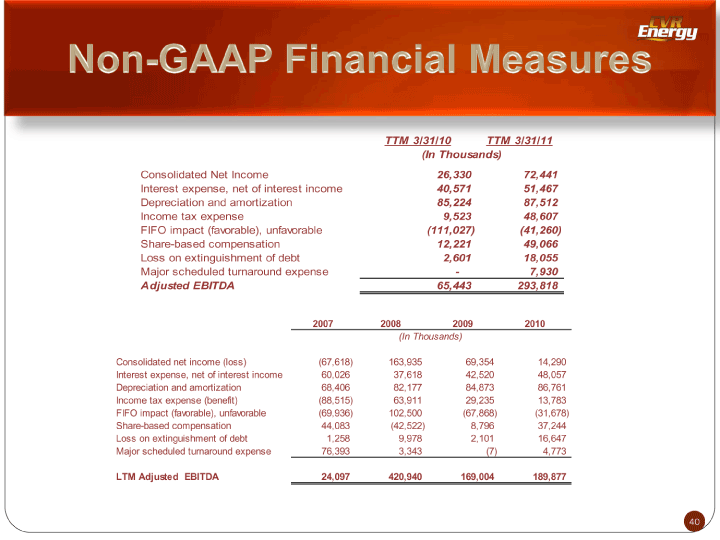
| TTM 3/31/10 TTM 3/31/11 (In Thousands) Consolidated Net Income 26,330 72,441 Interest expense, net of interest income 40,571 51,467 Depreciation and amortization 85,224 87,512 Income tax expense 9,523 48,607 FIFO impact (favorable), unfavorable (111,027) (41,260) Share-based compensation 12,221 49,066 Loss on extinguishment of debt 2,601 18,055 Major scheduled turnaround expense - 7,930 Adjusted EBITDA 65,443 293,818 2007 2008 2009 2010 (In Thousands) Consolidated net income (loss) (67,618) 163,935 69,354 14,290 Interest expense, net of interest income 60,026 37,618 42,520 48,057 Depreciation and amortization 68,406 82,177 84,873 86,761 Income tax expense (benefit) (88,515) 63,911 29,235 13,783 FIFO impact (favorable), unfavorable (69,936) 102,500 (67,868) (31,678) Share-based compensation 44,083 (42,522) 8,796 37,244 Loss on extinguishment of debt 1,258 9,978 2,101 16,647 Major scheduled turnaround expense 76,393 3,343 (7) 4,773 LTM Adjusted EBITDA 24,097 420,940 169,004 189,877 40 |
