Attached files
| file | filename |
|---|---|
| 8-K - FORM 8-K - GAIN Capital Holdings, Inc. | d8k.htm |
| EX-99.1 - PRESS RELEASE - GAIN Capital Holdings, Inc. | dex991.htm |
 1
st
Quarter 2011
Financial and Operating Results
and Update on dbFX Acquisition
May 16, 2011
Exhibit 99.2 |
 Special Note Regarding Forward-Looking
Information
2
In addition to historical information, this presentation contains
"forward-looking" statements that reflect
management's expectations for the future. A variety of important factors could
cause results to differ materially from such statements. These factors
are noted throughout GAIN Capital’s annual report on Form
10-K, as filed with the Securities and Exchange Commission
on March 30, 2010, and include, but are not limited to, the actions of both
current and potential new competitors, fluctuations in market trading
volumes, financial market volatility, evolving industry
regulations, errors or malfunctions in our systems or
technology, rapid changes in technology, effects of inflation, customer
trading patterns, the success of our products and service
offerings, our ability to continue to innovate and meet the
demands of our customers for new or enhanced products, our ability to successfully
integrate assets and companies we have acquired, changes in tax policy
or accounting rules, fluctuations in foreign exchange rates,
adverse changes or volatility in interest rates, as well as
general economic, business, credit and financial market conditions, internationally or
nationally. The forward-looking statements included herein
represent GAIN Capital’s views as of the date of this
release. GAIN Capital undertakes no obligation to revise or update
publicly any forward-looking statement for any reason unless
required by law. |
 Overview
Glenn Stevens, CEO |
 1
st
Quarter 2011 Summary
4
•
1Q 2011 Financial Summary
•
Revenue: $40.4 million
•
Adjusted EBITDA
(1)
: $5.0 million
•
Adjusted Net Income
(2)
: $2.5 million
•
Adjusted EPS (Diluted)
(3)
: $0.06
•
Operating Metrics
(4)
•
Total trading volume: $512.5 billion
•
Retail: $402.5 billion
•
Institutional: $110.1 billion
•
Client assets: $283.0 million
•
Funded retail accounts: 85,698
•
Retail trading revenue per million: $99.0
(1)
Adjusted EBITDA is a non-GAAP financial measure that prior to the closing of our initial public
offering in December 2010 represented our earnings before interest, taxes, depreciation and amortization and
excluded the change in fair value of the embedded derivative in our preferred stock. With the
consummation of our IPO, all outstanding shares of our preferred stock converted into common stock. A reconciliation
of net income to adjusted EBITDA is available in the appendix to this presentation.
(2)
Adjusted net income is a non-GAAP financial measure that that prior to the closing of our initial
public offering in December 2010 represented our net income/(loss) excluding the change in fair value of the
embedded derivative in our preferred stock and purchase intangible amortization. With the
consummation of our IPO, all outstanding shares of our preferred stock converted into common stock and in 2011 and
future periods adjusted net income will no longer reflect an adjustment related to the embedded
derivative. A reconciliation of net income to adjusted net income is available in the appendix to this presentation.
(3)
Reconciliation of diluted EPS to adjusted diluted EPS available in appendix.
(4)
Definitions for all our operating metrics are available in the appendix to this presentation.
|
 Retail
Volume by Geography (1)(2)
5
1Q ‘10
1Q ‘11
Note: Dollars in billions.
(1)
Definitions for all our operating metrics are available in the appendix to this
presentation. (2)
For period ended March 31.
(3)
Source: Aite Group.
Americas
60%
Asia-Pacific
24%
Europe
15%
Rest of World
1%
Americas
33%
Asia-Pacific
48%
Europe
18%
Rest of World
1%
Country/Region
Q1 2010
Q1 2011
% Growth
Americas
$174.0
$130.6
(25%)
Asia-Pacific
70.7
194.9
176%
Europe
44.2
71.8
62%
Rest of World
2.4
5.1
113%
Total
$291.4
$402.5
38%
Americas
22%
Asia-Pacific
45%
Europe
28%
Rest of World
5%
Global Retail FX Market (FY 2008)
(3) |
 Business Development Highlights
•
dbFX Acquisition
–
On May 13, we completed our acquisition of the client assets of
dbFX
–
Based on preliminary figures, approximately 1,650 accounts and
approximately $55.0 million assets transferred
–
Deal structure
•
Upfront and follow-on payments that align the interests of both
GAIN Capital and Deutsche Bank
•
China
–
CBRC regulatory approval
–
Beijing rep office
•
GTX
–
Launch of GTX Direct
–
Leverage international expansion
6 |
 Financial and Operating Metric Review
Henry Lyons, CFO |
 Operating Metrics
(1)
8
Note: Trading volume in billions. Client assets in millions.
(1)
Definitions for all our operating metrics are available in the appendix to this
presentation. (2)
For period ending March 31.
(3)
As of March 31.
(4)
Based on preliminary figures as of May 13, 2011.
(5)
Includes acquisition of approximate accounts and assets from dbFX, based on
preliminary figures as of May 13, 2011, and loss of accounts and assets from Tradestation.
$291.4
$402.5
$24.2
$110.1
$315.6
$512.5
$0.0
$100.0
$200.0
$300.0
$400.0
$500.0
$600.0
$0.0
$100.0
$200.0
$300.0
$400.0
$500.0
$600.0
1Q '10
1Q '11
Total Trading Volume
(2)
Retail
Institutional
31,027
36,570
-
5,000
10,000
15,000
20,000
25,000
30,000
35,000
40,000
1Q '10
1Q '11
Traded Retail Accounts (Period)
(2)
65,024
85,698
4,873
~1,650
82,475
0
10,000
20,000
30,000
40,000
50,000
60,000
70,000
80,000
90,000
1Q '10
1Q '11
Tradestation
dbFX (4)
1Q '11 (5)
Funded Retail Accounts
(3)
$212.0
$283.0
$30.8
~$55.0
$307.2
$0.0
$50.0
$100.0
$150.0
$200.0
$250.0
$300.0
$350.0
1Q '10
1Q '11
Tradestation
dbFX (4)
1Q '11 (5)
Client Assets
(3) |
 Operating
Metrics
(cont.)
(1)
9
Note: Net deposits and trades in millions.
(1)
Definitions for all our operating metrics are available in the appendix to this
presentation. (2)
For period ending March 31.
(3)
2008 data excludes our China trading operations.
$105.2
$144.4
$99.0
$114.2
$132.4
$146.2
$128.9
$0.0
$20.0
$40.0
$60.0
$80.0
$100.0
$120.0
$140.0
$160.0
$180.0
Q1 09
Q2 09
Q3 09
Q4 09
Q1 10
Q2 10
Q3 10
Q4 10
Q1 11
Retail
Trading
Revenue
per
Million
(2)(3)
Retail Trading Revenue per Million (Quarterly)
Retail Trading Revenue per Million (Last Twelve Months)
$62.2
$60.7
$0.0
$10.0
$20.0
$30.0
$40.0
$50.0
$60.0
$70.0
1Q '10
1Q '11
Net
Deposits
from
Retail
Customers
(2)
7.1
9.0
-
1.0
2.0
3.0
4.0
5.0
6.0
7.0
8.0
9.0
10.0
1Q '10
1Q '11
Trades
(2)
10,504
8,910
-
2,000
4,000
6,000
8,000
10,000
12,000
1Q '10
1Q '11
New
Retail
Accounts
(2) |
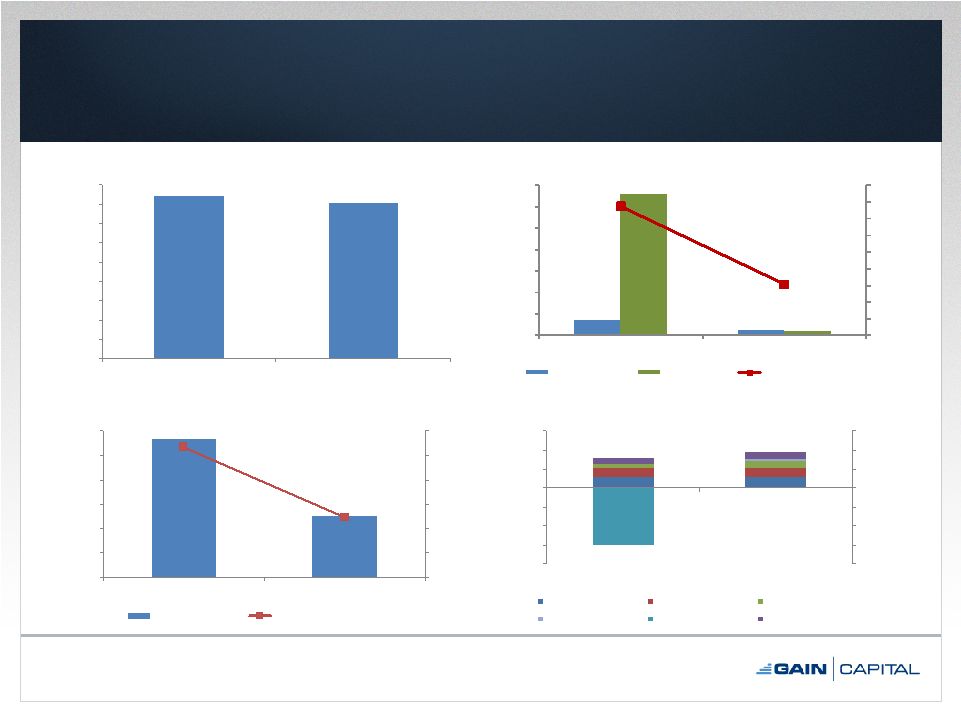 Financial Results
10
Note: Dollars in millions.
(1)
Reconciliation
of
net
income
to
adjusted
net
income
available
in
appendix.
(2)
Reconciliation of net income to adjusted EBTIDA available in appendix.
$42.0
$40.4
$0.0
$5.0
$10.0
$15.0
$20.0
$25.0
$30.0
$35.0
$40.0
$45.0
1Q '10
1Q '11
Revenue
$11.2
$11.1
$9.9
$10.2
$5.1
$7.2
$1.7
($59.5)
$5.6
$8.0
($27.7)
$38.2
($80.0)
($60.0)
($40.0)
($20.0)
$0.0
$20.0
$40.0
$60.0
($80.0)
($60.0)
($40.0)
($20.0)
$0.0
$20.0
$40.0
$60.0
1Q '10
1Q '11
Total Expenses
Comp & Benefits
Marketing
Trading
Purchase Intangible Amort.
Embedded Derivative
All Other
$11.3
$5.0
27%
12%
0%
5%
10%
15%
20%
25%
30%
$0.0
$2.0
$4.0
$6.0
$8.0
$10.0
$12.0
1Q '10
1Q '11
Adjusted EBITDA
(2)
& Margin %
Adjusted EBITDA
Adjusted EBITDA Margin %
$6.5
$2.5
$66.0
$1.4
15%
6%
0%
2%
4%
6%
8%
10%
12%
14%
16%
18%
-
10.0
20.0
30.0
40.0
50.0
60.0
70.0
1Q '10
1Q '11
GAAP
&
Adjusted
Net
Income
(1)
&
Margin
%
Adjusted Net Income
GAAP Net Income
Adjusted Net Income Margin % |
 Allocation of Capital
•
Continued investment in organic business
–
Products
–
Geographies
•
Robust corporate development pipeline
–
Consolidation transactions
–
Introducing broker and white label arrangements
•
Return of capital to shareholders
–
Stock repurchase plan
11 |
 Closing Remarks
Glenn Stevens, CEO |
 Closing Remarks
•
Macroeconomic
–
Industry fundamentals remain positive
–
Increasing acknowledgement of FX as an asset class
–
Geopolitical events will influence FX market conditions
•
GAIN Capital
–
Record quarterly trading volume
–
Growing institutional volume
–
Retail revenue per million returning to historical rates
–
dbFX transaction demonstrates our continued
commitment to industry consolidation
–
Robust acquisition and product development pipeline
13 |
 Appendix |
 Consolidated Statements of Operations
15
2011
2010
Revenue
Trading revenue
39.8
$
42.1
$
Other revenue
1.0
0.4
Total non-interest revenue
40.8
42.5
Interest revenue
0.1
0.1
Interest expense
(0.5)
(0.6)
Total net interest revenue/(expense)
(0.4)
(0.5)
Net Revenue
40.4
42.0
Expenses
Compensation and benefits
11.1
11.2
Selling and marketing
10.2
9.9
Trading expenses and commissions
7.2
5.1
Bank fees
1.0
1.0
Depreciation and amortization
0.9
0.8
Purchase intangible amortization
1.7
Communication and data processing
0.7
0.8
Occupancy and equipment
1.2
1.0
Bad debt provision/(recovery)
0.5
0.2
Professional fees
1.9
0.7
Change in fair value of convertible,
redeemable preferred stock embedded
derivative
(1)
(59.5)
Other
1.8
1.1
Total
38.2
(27.7)
Income before income tax expense
and equity in earnings of equity method
investment
2.2
69.7
Income tax expense
0.8
4.1
Net income
1.4
65.6
Net income/(loss) applicable to
non-controlling interest
-
(0.4)
Net income/(loss) applicable to GAIN
Capital Holdings,Inc.
1.4
$
66.0
$
Earnings per share
(2)
:
Basic
0.04
$
22.22
$
Diluted
0.04
$
1.80
$
Weighted averages shares outanding
(2)
:
Basic
33,797,165
2,969,194
Diluted
38,888,775
36,575,912
Three Months Ended March 31,
Note:
-
-
Dollars in millions.
(1)
For the periods prior to the closing of our initial public offering in December 2010, in accordance
with Financial Accounting Standards Board Accounting Standards Codification 815, Derivatives and Hedging, we accounted for
an embedded derivative liability attributable to the redemption feature of our previously outstanding
preferred stock and amortization of purchase intangibles. This redemption feature and the associated embedded derivative
liability was no longer required to be recognized following the conversion of all of our preferred
stock to common stock in connection with our IPO. (2)
In connection with the completion of the Company’s IPO, the Company’s board of directors
approved a 2.29-for-1 stock split of the Company’s common stock effective immediately prior to the completion of the Company’s
December 2010 IPO, as well as the settlement of the primary share offering which was allocated to all
common shareholders on a pro-rata basis resulting in an effective stock split of 2.26-for-1. As a result, all references to
share and per share data have been retroactively restated to reflect the stock split for the three
months ended March 31, 2010. |
 Balance Sheet
16
Note: Dollars in millions.
March 31,
December 31,
2011
2010
Assets
Cash
and
cash
equivalents
337.4
$
284.2
$
Short Term Investments
0.1
0.1
Trading Securities
20.1
Receivables from brokers
87.7
98.1
Property and
equipment -
net of accumulated depreciation
7.3
7.3
Prepaid Assets
10.6
9.9
Deferred financing costs
0.1
0.1
Goodwill
3.1
3.1
Intangible
assets,
net
7.4
9.1
Other
Assets
9.7
11.1
Total
assets
463.4
$
443.1
$
Liabilities
and
Shareholders'
Equity
Payables to brokers, dealers, FCM'S and other regulated entities
13.1
$
6.1
$
Payable to customers
269.9
250.6
Accrued compensation & benefits payable
1.3
5.1
Accrued expenses and other liabilities
8.8
10.5
Income tax payable
0.4
2.5
Notes payable
15.8
18.4
Total
liabilities
309.3
$
293.2
$
Shareholders' Equity
154.1
149.9
Total
liabilities
and
shareholders`
equity
463.4
$
443.1
$
-
$
$ |
 Adjusted Net Income / Margin Reconciliation
17
Note: Dollars in millions.
Three Months Ended March 31,
2011
2010
Revenue
40.4
$
42.0
$
Net income/(loss) applicable to GAIN
Capital Holdings, Inc.
1.4
$
66.0
$
Change in fair value of convertible,
redeemable preferred stock embedded
derivative
-
(59.5)
Plus: Purchase intangible amortization (net of tax)
1.1
-
Adjusted Net Income
2.5
$
6.5
$
Adjusted Earnings per Share
Basic
0.07
$
2.19
$
Diluted
0.06
$
0.18
$
Net Income Margin %
3%
157%
Adjusted Net Income Margin %
6%
15%
(1)
In connection with the completion of the Company’s IPO, the Company’s board of directors
approved a 2.29-for-1 stock split of the Company’s common stock effective immediately
prior to the completion of the Company’s December 2010 IPO, as well as the settlement of the
primary share offering which was allocated to all common shareholders on a pro-rata basis
resulting in an effective stock split of 2.26-for-1. As a result, all references to share and per share data have been retroactively restated for the three months ended March 31,
2010 to reflect the stock split.
(1) |
 Adjusted EBITDA / Margin Reconciliation
18
Note: Dollars in millions.
Three Months Ended March 31,
2011
2010
Revenue
40.4
$
42.0
$
Interest on Note Payable
0.2
0.3
Revenue (ex. Interest on Note)
40.5
$
42.3
$
Net income/(loss) applicable to GAIN
Capital Holdings, Inc.
1.4
$
66.0
$
Change in fair value of convertible,
redeemable preferred stock embedded
derivative
-
(59.5)
Plus: Depreciation & amortization
0.9
0.8
Plus: Purchase intangible amortization
1.7
-
Plus: Interest expense of note payable
0.2
0.3
Plus: Income tax expense
0.8
4.1
Less: Net income/(loss) applicable to
non-controlling interest
-
(0.4)
Adjusted EBITDA
5.0
$
11.3
$
Adjusted EBITDA Margin %
12%
27% |
 Adjusted EPS (Diluted) Reconciliation
19
Three Months Ended March 31,
2011
2010
GAAP Earnings per Share (Diluted)
0.04
$
1.80
$
Change in fair value of convertible,
redeemable preferred stock embedded
derivative
-
(1.62)
Plus: Purchase intangible amortization
(1)
0.02
-
Adjusted
Earnings
per
Share
(Diluted)
(2)
0.06
$
0.18
$
(1)
(2)
Net of tax.
In connection with the completion of the Company’s IPO, the Company’s board of directors
approved a 2.29-for-1 stock split of the Company’s common stock effective immediately
prior to the completion of the Company’s December 2010 IPO, as well as the settlement of the
primary share offering which was allocated to all common shareholders on a pro-rata basis
resulting in an effective stock split of 2.26-for-1. As a result, all references to share and per share data have been retroactively restated for the three months ended March 31,
2010 to reflect the stock split.
|
 Q1
2011 Financial Summary 20
Note: Dollars in millions, except per share data.
(1)
See page 18 for a reconciliation of GAAP net income to adjusted EBITDA.
(2)
See page 17 for a reconciliation of GAAP net income to adjusted net income.
(3)
See page 19 for a reconciliation of GAAP EPS to adjusted EPS.
3 Mos. Ended March 31,
'11 v '10
1Q '11
1Q '10
% Change
Revenue
$40.4
$42.0
(4%)
Interest Expense on Note Payable
0.2
0.3
Revenue (ex. Interest on Note)
$40.5
$42.3
(4%)
Operating Expenses
35.5
31.0
15%
Adjusted EBITDA
(1)
$5.0
$11.3
(56%)
GAAP Net Income
$1.4
$66.0
(98%)
Adjusted Net Income
(2)
2.5
6.5
(62%)
GAAP EPS (Diluted)
$0.04
$1.80
(98%)
Adjusted EPS (Diluted)
(3)
0.06
0.18
(67%)
Adjusted EBITDA Margin %
12%
27%
(14 pts)
Net Income Margin %
3%
157%
(154 pts)
Adjusted Net Income Margin %
6%
15%
(9 pts) |
 Q1
2011 Operating Metrics 21
Note: Dollars in millions, except retail trading revenue per million.
(1)
Average calculated using excess net capital balance at month-end.
1st Quarter
'11 v '10
2011
2010
% Change
For Period Ending March 31,
Total Trading Volume (billions)
$512.5
$315.6
62%
Retail
402.5
291.4
38%
Institutional
110.1
24.2
355%
Traded Retail Accounts (Period)
36,570
31,027
18%
Traded Retail Accounts (Last 12 Months)
66,115
55,568
19%
New Retail Accounts
8,910
10,504
(15%)
Net Deposits from Retail Customers
$60.7
$62.2
(2%)
Trades
9,025,828
7,095,699
27%
Retail Trading Revenue per Million
$99.0
$144.4
(31%)
As of March 31,
Funded Retail Accounts
85,698
65,024
32%
Client Assets
$283.0
$212.0
34%
Average Excess Net Capital
(1)
$45.2
$49.0
(8%) |
 Monthly Operating Metrics
(1)
22
Note: Dollars in millions.
(1)
Definitions for all our operating metrics are available in the appendix to this
presentation. (2)
As of period ended.
(3)
For period ended.
(4)
Excludes 3,632 accounts from GAIN Capital’s acquisition of MG Financial.
(5)
Excludes 13,091 accounts from GAIN Capital’s acquisition of CMS Forex.
Funded
New Retail
Client
Month
Retail Accts.
(2)
Accounts
(3)
Assets
(2)
Apr 2010
66,138
3,431
$222.6
May 2010
64,477
3,451
218.4
Jun 2010
65,348
3,234
222.2
Jul 2010
65,948
2,824
220.4
Aug 2010
66,525
2,999
229.6
Sep 2010
70,858
3,056
(4)
222.4
Oct 2010
81,793
3,345
(5)
241.6
Nov 2010
84,985
3,054
263.2
Dec 2010
85,562
2,525
256.7
Jan 2011
86,236
2,904
277.0
Feb 2011
87,049
2,874
286.3
Mar 2011
85,698
3,132
283.0
|
 Quarterly
Operating
Metrics
(1)
23
Note: For period ended. Volume in billions. Net deposits in
millions. (1)
Definitions for all our operating metrics are available in the appendix to this
presentation. Net Deposits
Volume
Traded Retail
From Retail
Quarter
Retail
Institutional
Accts. (Period)
Customers
Trades
Q2 10
$355.6
$67.9
34,174
$75.6
8,954,401
Q3 10
311.6
43.3
32,976
68.7
7,535,907
Q4 10
366.3
103.9
36,241
61.4
8,161,012
Q1 11
402.5
110.1
36,570
60.7
9,025,828
|
 Definition of Metrics
24
•
Total Trading Volume
–
Represents the U.S. dollar equivalent of notional amounts traded •
Traded Retail Accounts
–
Retail accounts who executed a transaction during a given period •
Funded Retail Accounts
–
Retail accounts who maintain a cash balance
•
Client Assets
–
Represents amounts due to clients, including customer deposits and
unrealized gains or losses arising from open positions •
New Retail Accounts
–
The number of customer accounts that have initially opened and funded
their accounts •
Net Deposits from Retail Customers
–
Represents customers’ deposits less withdrawals for a given
period •
Trades
–
The number of transactions retail customers have completed for a given
period •
Retail Trading Revenue per Million
–
The revenue we realize from our forex, CFDs and metals trading
activities per one million of U.S. dollar- equivalent
trading volume •
Excess Net Capital
–
Represents the excess funds held over the regulatory minimum capital
requirements, as defined by the regulatory bodies that
regulate our operating subsidiaries |
 1
st
Quarter 2011
Financial and Operating Results
and Update on dbFX Acquisition
May 16, 2011 |