Attached files
Table of Contents
UNITED STATES
SECURITIES AND EXCHANGE COMMISSION
Washington, D.C. 20549
Form 10-Q
(Mark One)
| x | QUARTERLY REPORT PURSUANT TO SECTION 13 OR 15(d) OF THE SECURITIES EXCHANGE ACT OF 1934 |
For the quarterly period ended March 31, 2011
OR
| ¨ | TRANSITION REPORT PURSUANT TO SECTION 13 OR 15(d) OF THE SECURITIES EXCHANGE ACT OF 1934 |
For the transition period from to
COMMISSION FILE NUMBER No: 001-35026

(Exact Name of Registrant as Specified in its Charter)
| Delaware | 95-3673456 | |
| (State or other jurisdiction of incorporation or organization) |
(I.R.S. Employer Identification No.) | |
| 1021 Anacapa St. Santa Barbara, California |
93101 | |
| (Address of principal executive offices) | (Zip Code) | |
(805) 564-6405
(Registrant’s telephone number, including area code)
Indicate by check mark whether the registrant (1) has filed all reports required to be filed by Section 13 or 15(d) of the Securities Exchange Act of 1934 during the preceding 12 months (or for such shorter period that the registrant was required to file such reports), and (2) has been subject to such filing requirements for the past 90 days. Yes x No ¨
Indicate by check mark whether the registrant has submitted electronically and posted on its corporate Web site, if any, every Interactive Data File required to be submitted and posted pursuant to Rule 405 of Regulation S-T (§232.405 of this chapter) during the preceding 12 months (or for such shorter period that the registrant was required to submit and post such files). Yes ¨ No ¨
Indicate by check mark whether the registrant is a large accelerated filer, an accelerated filer, a non-accelerated filer, or a smaller reporting company. See definitions of “large accelerated filer”, “accelerated filer” and “smaller reporting company” in Rule 12b-2 of the Exchange Act.
Large accelerated filer ¨ Accelerated filer ¨ Non-accelerated filer ¨ Smaller reporting company x
(Do not check if a smaller reporting company)
Indicate by check mark whether the registrant is a shell company (as defined in Rule 12b-2 of the Exchange Act).
Yes ¨ No x
Number of shares of common stock of the registrant outstanding as of April 29, 2011: 32,903,520
Table of Contents
| Page | ||||||
| 3 | ||||||
| 3 | ||||||
| Item 1. |
Financial Statements: | |||||
| Consolidated Balance Sheets | 5 | |||||
| Consolidated Statements of Operations | 6 | |||||
| Consolidated Statements of Changes in Shareholders’ Equity and Comprehensive (Loss) | 8 | |||||
| Consolidated Statements of Cash Flows | 10 | |||||
| Notes to Consolidated Financial Statements | 12 | |||||
| Item 2. |
Management’s Discussion and Analysis of Financial Condition and Results of Operations | 68 | ||||
| Item 3. |
Quantitative and Qualitative Disclosures About Market Risk | 88 | ||||
| Item 4. |
Controls and Procedures | 91 | ||||
| 92 | ||||||
| 94 | ||||||
| Item 1. |
Legal Proceedings | 94 | ||||
| Item 1A. |
Risk Factors | 94 | ||||
| Item 2. |
Unregistered Sales of Equity Securities and Use of Proceeds | 94 | ||||
| Item 3. |
Defaults Upon Senior Securities | 94 | ||||
| Item 4. |
Removed and Reserved | 94 | ||||
| Item 5. |
Other Information | 94 | ||||
| Item 6. |
Exhibits | 95 | ||||
| 96 | ||||||
2
Table of Contents
This Quarterly Report on Form 10-Q (“Form 10-Q”) contains “forward-looking statements” within the meaning of Section 27A of the Securities Act of 1933, as amended, and Section 21E of the Securities Exchange Act of 1934, as amended. Pacific Capital Bancorp (the “Company” or “PCBC”) intends such forward-looking statements to be covered by the safe harbor provisions for forward-looking statements in these provisions. All statements, other than statements of historical fact, are “forward-looking statements” for purposes of federal and state securities laws, including, but not limited to, statements about anticipated future operating and financial performance, financial position and liquidity, business prospects, strategic alternatives, business strategies, regulatory and competitive outlook, investment and expenditure plans, capital and financing needs and availability, acquisition and divestiture opportunities, plans and objectives of management for future operations, and other similar forecasts and statements of expectation and statements of assumptions underlying any of the foregoing. Words such as “will likely result,” “aims,” “anticipates,” “believes,” “could,” “estimates,” “expects,” “hopes,” “intends,” “may,” “plans,” “projects,” “seeks,” “should,” “will,” and variations of these words and similar expressions are intended to identify these forward-looking statements.
Forward-looking statements are based on the Company’s current expectations and assumptions regarding its business, the regulatory environment, the economy and other future conditions. Because forward-looking statements relate to the future, they are subject to inherent uncertainties, risks and changes in circumstances that are difficult to predict. The Company’s actual results may differ materially from those contemplated by the forward-looking statements. The Company cautions the reader of these statements therefore against relying on any of these forward-looking statements. They are neither statements of historical fact nor guarantees or assurances of future performance. Important factors that could cause actual results to differ materially from those in the forward-looking statements include, but are not limited to, the following:
| n | inability to continuously satisfy the higher minimum capital ratios that Pacific Capital Bank, N.A. (the “Bank” or “PCBNA”) is required to maintain pursuant to the Operating Agreement dated September 2, 2010 (the “Operating Agreement”) by and between the Bank and the Office of the Comptroller of the Currency (the “OCC”); |
| n | the effect of other requirements of the Operating Agreement and the requirements of the Consent Order issued by the OCC on May 11, 2010 (as modified, the “Consent Order”) and the Written Agreement dated May 11, 2010 (“Written Agreement”), by and between the Company and the Federal Reserve Bank of San Francisco (the “Reserve Bank”), and any further regulatory actions; |
| n | inability to generate assets on acceptable terms or at all; |
| n | Management’s ability to effectively execute the Company’s business plan; |
| n | inability to raise additional capital, if and when necessary, on acceptable terms or at all; |
| n | inability to receive dividends from the Bank; |
| n | costs and effects of legal and regulatory developments, including the resolution of legal proceedings or regulatory or other governmental inquiries, and the results of regulatory examinations or reviews; |
| n | changes in capital classification; |
| n | the impact of current economic conditions and the Company’s results of operations on its ability to borrow additional funds to meet its liquidity needs; |
| n | local, regional, national and international economic conditions and events and the impact they may have on the Company and its customers; |
| n | changes in the economy affecting real estate values; |
| n | inability to attract and retain deposits; |
| n | changes in the level of nonperforming assets and charge-offs; |
3
Table of Contents
| n | changes in estimates of future reserve requirements based upon the periodic review thereof under relevant regulatory and accounting requirements; |
| n | changes in the financial performance and/or condition of the Bank’s borrowers; |
| n | effect of additional provision for loan losses; |
| n | long term negative trends in the Company’s market capitalization; |
| n | effects of any changes in trade and monetary and fiscal policies and laws, including the interest rate policies of the Board of Governors of the Federal Reserve System (the “Reserve Board”); |
| n | inflation, interest rate, cost of funds, securities market and monetary fluctuations; |
| n | political instability; |
| n | acts of war or terrorism, natural disasters such as earthquakes or fires, or the effects of pandemic flu; |
| n | the timely development and acceptance of new products and services and perceived overall value of these products and services by users; |
| n | changes in consumer spending, borrowings and savings habits; |
| n | technological changes, including the implementation of new systems; |
| n | changes in the Company’s organization, management, compensation and benefit plans; |
| n | competitive pressures from other financial institutions; |
| n | continued consolidation in the financial services industry; |
| n | inability to maintain or increase market share and control expenses; |
| n | impact of reputational risk on such matters as business generation and retention, funding and liquidity; |
| n | rating agency downgrades; |
| n | continued volatility in the credit and equity markets and its effect on the general economy; |
| n | effect of changes in laws and regulations (including enactment of the Dodd-Frank Wall Street Reform and Consumer Protection Act of 2010 (“Dodd-Frank”) and other changes in laws concerning banking, taxes and securities) with which the Company and its subsidiaries must comply; |
| n | effect of changes in accounting policies and practices, as may be adopted by the regulatory agencies, as well as the Public Company Accounting Oversight Board (“PCAOB”), the Financial Accounting Standards Board (“FASB”) and other accounting standard setters; |
| n | other factors that are described under the heading “Risk Factors” in this Form 10-Q and in the Company’s Annual Report on Form 10-K for the year ended December 31, 2010 (the “2010 Form 10-K”); and |
| n | the Company’s success at managing the risks involved in the foregoing items. |
Forward-looking statements speak only as of the date they are made, and the Company does not undertake to update forward-looking statements to reflect circumstances or events that occur after the date the forward-looking statements are made, whether as a result of new information, future developments or otherwise, except as may be required by law.
Definition of Terms
Specific accounting and banking industry terms and acronyms used throughout this document are defined in the glossary on pages 92 through 93.
4
Table of Contents
Pacific Capital Bancorp and Subsidiaries
CONSOLIDATED BALANCE SHEETS
(dollars and shares in thousands, except per share amounts)
| Successor Company | ||||||||
| March
31, 2011 |
December
31, 2010 |
|||||||
| (unaudited) | (audited) | |||||||
| ASSETS |
||||||||
| Cash and due from banks |
$ | 42,520 | $ | 45,820 | ||||
| Interest bearing demand deposits in other financial institutions |
291,020 | 450,044 | ||||||
| Cash and cash equivalents |
333,540 | 495,864 | ||||||
| Investment securities available for sale |
1,320,505 | 1,278,100 | ||||||
| Loans held for sale |
4,599 | 16,512 | ||||||
| Loans held for investment |
3,809,349 | 3,761,517 | ||||||
| Allowance for loan and lease losses |
(2,131) | (520) | ||||||
| Net loans held for investment |
3,807,218 | 3,760,997 | ||||||
| Premises and equipment, net |
71,322 | 71,465 | ||||||
| FHLB stock and other investments |
81,661 | 84,235 | ||||||
| Goodwill and other intangible assets |
88,124 | 93,700 | ||||||
| Other assets |
236,227 | 284,675 | ||||||
| TOTAL ASSETS |
$ | 5,943,196 | $ | 6,085,548 | ||||
| LIABILITIES |
||||||||
| Deposits |
||||||||
| Noninterest bearing |
$ | 1,073,219 | $ | 1,099,260 | ||||
| Interest bearing |
3,680,907 | 3,809,028 | ||||||
| Total deposits |
4,754,126 | 4,908,288 | ||||||
| Securities sold under agreements to repurchase |
318,615 | 319,737 | ||||||
| Other borrowings |
119,956 | 121,014 | ||||||
| Other liabilities |
90,781 | 93,826 | ||||||
| TOTAL LIABILITIES |
5,283,478 | 5,442,865 | ||||||
| COMMITMENTS AND CONTINGENCIES (Note 11) |
||||||||
| SHAREHOLDERS’ EQUITY |
||||||||
| Common stock ($0.001 par value; 50,000 authorized; 32,903 and 32,901 shares issued and outstanding at March 31, 2011 and December 31, 2010, respectively) |
33 | 33 | ||||||
| Paid in capital |
650,002 | 650,010 | ||||||
| Retained earnings |
42,504 | 25,744 | ||||||
| Accumulated other comprehensive loss |
(32,821) | (33,104) | ||||||
| TOTAL SHAREHOLDERS’ EQUITY |
659,718 | 642,683 | ||||||
| TOTAL LIABILITIES AND SHAREHOLDERS’ EQUITY |
$ | 5,943,196 | $ | 6,085,548 | ||||
The accompanying notes are an integral part of these financial statements.
5
Table of Contents
Pacific Capital Bancorp and Subsidiaries
CONSOLIDATED STATEMENTS OF OPERATIONS (unaudited)
(dollars and shares in thousands, except per share amounts)
| Successor
Company |
Predecessor
Company |
|||||||||||
| Three
Months Ended March 31, 2011 |
Three
Months Ended March 31, 2010 |
|||||||||||
| Interest income |
||||||||||||
| Loans |
$ | 59,763 | $ | 65,848 | ||||||||
| Trading assets |
— | 64 | ||||||||||
| Investment securities |
6,096 | 8,326 | ||||||||||
| Other |
622 | 1,080 | ||||||||||
| TOTAL INTEREST INCOME |
66,481 | 75,318 | ||||||||||
| Interest expense |
||||||||||||
| Deposits |
7,106 | 17,794 | ||||||||||
| Securities sold under agreements to repurchase |
2,102 | 2,006 | ||||||||||
| Other borrowings |
2,976 | 11,014 | ||||||||||
| TOTAL INTEREST EXPENSE |
12,184 | 30,814 | ||||||||||
| NET INTEREST INCOME |
54,297 | 44,504 | ||||||||||
| Provision for loan losses |
1,667 | 99,865 | ||||||||||
| NET INTEREST INCOME/(LOSS) AFTER PROVISION FOR LOAN LOSSES |
52,630 | (55,361) | ||||||||||
| Noninterest income |
||||||||||||
| Service charges and fees |
5,751 | 5,739 | ||||||||||
| Trust and investment advisory fees |
5,335 | 5,408 | ||||||||||
| (Loss)/gain on securities, net |
(4) | 4,511 | ||||||||||
| Other |
1,783 | 3,680 | ||||||||||
| TOTAL NONINTEREST INCOME |
12,865 | 19,338 | ||||||||||
| Noninterest expense |
||||||||||||
| Salaries and employee benefits |
22,947 | 22,078 | ||||||||||
| Net occupancy expense |
5,676 | 5,803 | ||||||||||
| Other |
19,640 | 23,439 | ||||||||||
| TOTAL NONINTEREST EXPENSE |
48,263 | 51,320 | ||||||||||
| INCOME/(LOSS) BEFORE INCOME TAX EXPENSE |
17,232 | (87,343) | ||||||||||
| Income tax expense |
472 | 49 | ||||||||||
| NET INCOME/(LOSS) FROM CONTINUING OPERATIONS |
16,760 | (87,392) | ||||||||||
| Expense from discontinued operations, net of tax |
— | (1,231) | ||||||||||
| Gain on sale of discontinued operations, net of tax |
— | 8,160 | ||||||||||
| Income from discontinued operations, net |
— | 6,929 | ||||||||||
| NET INCOME/(LOSS) |
16,760 | (80,463) | ||||||||||
| Dividends and accretion on preferred stock |
— | 2,522 | ||||||||||
| NET INCOME/(LOSS) APPLICABLE TO COMMON SHAREHOLDERS |
$ | 16,760 | $ | (82,985) | ||||||||
(continued on next page)
6
Table of Contents
Pacific Capital Bancorp and Subsidiaries
CONSOLIDATED STATEMENTS OF OPERATIONS (unaudited)
(dollars and shares in thousands, except per share amounts)
(continued)
| Successor Company |
Predecessor Company |
|||||||||||
| Three Months Ended March 31, 2011 |
Three Months Ended March 31, 2010 |
|||||||||||
| Earnings/(loss) per share from continuing operations: |
||||||||||||
| Basic |
$ | 0.51 | $ | (186.74) | ||||||||
| Diluted |
$ | 0.51 | $ | (186.74) | ||||||||
| Earnings per share from discontinued operations: |
||||||||||||
| Basic |
$ | — | $ | 14.81 | ||||||||
| Diluted |
$ | — | $ | 14.81 | ||||||||
| Earnings/(loss) per share applicable to common shareholders: |
||||||||||||
| Basic |
$ | 0.51 | $ | (177.32) | ||||||||
| Diluted |
$ | 0.51 | $ | (177.32) | ||||||||
| Weighted average number of common shares outstanding: |
||||||||||||
| Basic |
32,903 | 468 | ||||||||||
| Diluted |
32,909 | 468 | ||||||||||
The accompanying notes are an integral part of these financial statements.
7
Table of Contents
Pacific Capital Bancorp and Subsidiaries
CONSOLIDATED STATEMENTS OF CHANGES IN SHAREHOLDERS’ EQUITY
AND COMPREHENSIVE (LOSS)/INCOME (unaudited)
(dollars and shares in thousands)
| Preferred Stock | Common Stock | Accumulated Other Comprehensive Income |
Retained Deficit |
Total Shareholders’ Equity |
||||||||||||||||||||||||||||
| Shares | Amount | Shares | Amount | Paid in Capital |
||||||||||||||||||||||||||||
| Predecessor Company |
||||||||||||||||||||||||||||||||
| Balance, December 31, 2009 |
181 | $ | 176,742 | 467 | $ | 11,689 | $ | 123,886 | $ | 14,352 | $ | 37,934 | $ | 364,603 | ||||||||||||||||||
| Net loss |
— | — | — | — | — | — | (80,463) | (80,463) | ||||||||||||||||||||||||
| Other comprehensive loss, net of tax |
||||||||||||||||||||||||||||||||
| Unrealized gain on AFS securities |
— | — | — | — | — | 1,828 | — | 1,828 | ||||||||||||||||||||||||
| Realized gain on sale and calls of AFS securities included in earnings |
— | — | — | — | — | (4,521) | — | (4,521) | ||||||||||||||||||||||||
| Postretirement expense obligation arising during period |
— | — | — | — | — | (629) | — | (629) | ||||||||||||||||||||||||
| Total comprehensive loss |
(83,785) | |||||||||||||||||||||||||||||||
| Amortization of preferred stock discount |
— | 216 | — | — | — | — | (216) | — | ||||||||||||||||||||||||
| Accrued stock dividends not paid |
— | — | — | — | — | — | (2,307) | (2,307) | ||||||||||||||||||||||||
| Stock based compensation |
— | — | — | — | 214 | — | — | 214 | ||||||||||||||||||||||||
| Net restricted stock activity (1) |
— | — | 1 | 14 | 639 | — | — | 653 | ||||||||||||||||||||||||
| Balance, March 31, 2010 |
181 | $ | 176,958 | 468 | $ | 11,703 | $ | 124,739 | $ | 11,030 | $ | (45,052) | $ | 279,378 | ||||||||||||||||||
| (1) | The amount recognized as compensation expense related to restricted stock awards for the three months ended March 31, 2010 was $668,000. |
(continued on next page)
8
Table of Contents
Pacific Capital Bancorp and Subsidiaries
CONSOLIDATED STATEMENTS OF CHANGES IN SHAREHOLDERS’ EQUITY
AND COMPREHENSIVE (LOSS)/INCOME (unaudited)
(dollars and shares in thousands)
(continued)
| Preferred Stock | Common Stock | Accumulated Other Comprehensive Income |
Retained Earnings |
Total Shareholders’ Equity |
||||||||||||||||||||||||||||
| Shares | Amount | Shares | Amount | Paid in Capital |
||||||||||||||||||||||||||||
| Successor Company |
||||||||||||||||||||||||||||||||
| Balance, December 31, 2010 |
— | $ | — | 32,901 | $ | 33 | $ | 650,010 | $ | (33,104) | $ | 25,744 | $ | 642,683 | ||||||||||||||||||
| Net income |
— | — | — | — | — | — | 16,760 | 16,760 | ||||||||||||||||||||||||
| Other comprehensive income, net of tax |
||||||||||||||||||||||||||||||||
| Unrealized gain on AFS securities |
— | — | — | — | — | 279 | — | 279 | ||||||||||||||||||||||||
| Realized loss on sale and calls of AFS securities included in earnings |
— | — | — | — | — | 4 | — | 4 | ||||||||||||||||||||||||
| Total comprehensive income |
17,043 | |||||||||||||||||||||||||||||||
| Net restricted stock activity (2) |
— | — | 2 | — | (8) | — | — | (8) | ||||||||||||||||||||||||
| Balance, March 31, 2011 |
— | $ | — | 32,903 | $ | 33 | $ | 650,002 | $ | (32,821) | $ | 42,504 | $ | 659,718 | ||||||||||||||||||
(2) There was no compensation expense related to restricted stock awards for the three months ended March 31, 2011.
The accompanying notes are an integral part of these statements.
9
Table of Contents
Pacific Capital Bancorp and Subsidiaries
CONSOLIDATED STATEMENTS OF CASH FLOWS (unaudited)
(dollars in thousands)
| Successor Company |
Predecessor Company |
|||||||||||||||
| Three Months Ended March 31, 2011 |
Three Months Ended March 31, 2010 |
|||||||||||||||
| OPERATING ACTIVITIES: |
||||||||||||||||
| Net income/(loss) from continuing operations |
$ 16,760 | $ (87,392) | ||||||||||||||
| Net income from discontinued operations |
— | 6,929 | ||||||||||||||
| Net income/(loss) |
16,760 | (80,463) | ||||||||||||||
| Adjustments to reconcile net income/(loss) to net cash provided by |
||||||||||||||||
| Provision for loan losses |
1,667 | 99,865 | ||||||||||||||
| Depreciation, amortization and accretion |
2,899 | 4,214 | ||||||||||||||
| Accretion of acquired loans |
(51,617) | — | ||||||||||||||
| Stock-based compensation |
— | 882 | ||||||||||||||
| Net amortization of discounts and premiums for |
1,725 | (258) | ||||||||||||||
| Operating lease impairment |
— | 1,301 | ||||||||||||||
| (Gains)/losses on sale of: |
||||||||||||||||
| Loans, net |
(438) | (3,955) | ||||||||||||||
| Investment securities, AFS |
4 | (4,520) | ||||||||||||||
| Fair value of loan commitments |
(23) | — | ||||||||||||||
| Other real estate owned |
(2,041) | 192 | ||||||||||||||
| Loans originated for sale and principal collections, net |
4,599 | 26,629 | ||||||||||||||
| Collection of taxes receivable |
50,050 | — | ||||||||||||||
| Changes in: |
||||||||||||||||
| Other assets |
2,547 | 4,911 | ||||||||||||||
| Other liabilities |
(2,866) | (3,959) | ||||||||||||||
| Trading securities, net |
— | 117 | ||||||||||||||
| Servicing rights, net |
168 | 416 | ||||||||||||||
| Net cash used by operating activities attributable to |
— | (808) | ||||||||||||||
| NET CASH PROVIDED BY OPERATING ACTIVITIES |
23,434 | 44,564 | ||||||||||||||
(continued on next page)
10
Table of Contents
Pacific Capital Bancorp and Subsidiaries
CONSOLIDATED STATEMENTS OF CASH FLOWS (unaudited)
(dollars in thousands)
(continued)
| Successor Company |
Predecessor Company |
|||||||||||||||
| Three Months Ended March 31, 2011 |
Three
Months Ended March 31, 2010 |
|||||||||||||||
| INVESTING ACTIVITIES: |
||||||||||||||||
| Proceeds from loan sales |
3,298 | 33,328 | ||||||||||||||
| Loan originations and principal collections, net |
176,142 | 112,384 | ||||||||||||||
| Purchase of loans held for investment |
(178,932) | — | ||||||||||||||
| Proceeds from sale of AFS securities |
2,386 | 48,636 | ||||||||||||||
| Principal pay downs, calls and maturities of AFS securities |
50,217 | 162,596 | ||||||||||||||
| Purchase of AFS securities |
(96,452) | — | ||||||||||||||
| Redemption of Federal Home Loan Bank stock |
2,571 | — | ||||||||||||||
| Purchase of premises and equipment, net |
(2,120) | (271) | ||||||||||||||
| Proceeds from sale of other real estate owned, net |
12,107 | 2,316 | ||||||||||||||
| Net cash provided by investing activities attributable to discontinued operations |
— | 2,077 | ||||||||||||||
| NET CASH (USED IN) / PROVIDED BY INVESTING ACTIVITIES |
(30,783) | 361,066 | ||||||||||||||
| FINANCING ACTIVITIES: |
||||||||||||||||
| Net (decrease)/increase in deposits |
(151,882) | 44,142 | ||||||||||||||
| Net decrease in short term borrowings |
(2,295) | (26,933) | ||||||||||||||
| Repayment of long term debt and other borrowings |
(790) | (216,031) | ||||||||||||||
| Other, net |
(8) | (15) | ||||||||||||||
| Net cash provided by financing activities attributable to discontinued operations |
— | 113,437 | ||||||||||||||
| NET CASH USED IN FINANCING ACTIVITIES |
(154,975) | (85,400) | ||||||||||||||
| (DECREASE)/INCREASE IN CASH AND CASH EQUIVALENTS |
(162,324) | 320,230 | ||||||||||||||
| CASH AND CASH EQUIVALENTS AT BEGINNING OF PERIOD |
495,864 | 995,522 | ||||||||||||||
| CASH AND CASH EQUIVALENTS AT END OF PERIOD |
$ | 333,540 | $ | 1,315,752 | ||||||||||||
| SUPPLEMENTAL DISCLOSURE OF CASH FLOWS INFORMATION: |
||||||||||||||||
| Cash paid during the period for |
||||||||||||||||
| Interest |
$ | 12,250 | $ | 31,449 | ||||||||||||
| Income taxes |
2,266 | — | ||||||||||||||
| Non-cash investing activity |
||||||||||||||||
| Net transfers from loans held for investment to loans held for sale |
2,811 | 47,862 | ||||||||||||||
| Transfers to other real estate owned, net |
10,973 | 14,184 | ||||||||||||||
| Non-cash financing activity |
||||||||||||||||
| Preferred stock dividends declared not paid |
— | 2,522 | ||||||||||||||
The accompanying notes are an integral part of these statements.
11
Table of Contents
Pacific Capital Bancorp and Subsidiaries
NOTES TO CONSOLIDATED FINANCIAL STATEMENTS
NOTE 1. SUMMARY OF SIGNIFICANT ACCOUNTING POLICIES
Nature of Operations
Pacific Capital Bancorp (“the Company” or “PCBC”) is a bank holding company organized under the laws of the state of Delaware. PCBC provides a full range of commercial and consumer banking services to households, professionals, and businesses through its wholly-owned subsidiary Pacific Capital Bank, National Association (“the Bank” or “PCBNA”). These banking services include depository, lending and wealth management services. PCBNA’s lending products include commercial and industrial (“commercial”), consumer, commercial and residential real estate loans and Small Business Administration (“SBA”) loans. Depository services include checking, interest bearing checking (“NOW”), money market (“MMDA”), savings, and Certificate of Deposit (“CD”) accounts, as well as safe deposit boxes, travelers’ checks, money orders, foreign exchange services, and cashier’s checks. PCBNA also offers a wide range of wealth management services through a full service trust operation and two registered investment advisors that are wholly-owned subsidiaries, Morton Capital Management (“MCM”) and R.E. Wacker Associates (“REWA”).
PCBNA currently conducts its banking services under five brand names: Santa Barbara Bank & Trust (“SBB&T”), First National Bank of Central California, South Valley National Bank, San Benito Bank, and First Bank of San Luis Obispo. The SBB&T offices are located in Santa Barbara, Ventura and Los Angeles counties. The banking offices using the other brand names are located in the counties of Monterey, San Luis Obispo, Santa Clara, Santa Cruz, and San Benito. In December 2010, the Company announced plans to begin to consolidate the brand bank names listed to the SBB&T brand name, its oldest brand.
Basis of Presentation
The accompanying Consolidated Financial Statements of Pacific Capital Bancorp are unaudited and, in the opinion of Management, include all adjustments necessary for a fair statement of the Company’s financial position and results of operations for the periods presented. All inter-company balances and transactions are eliminated in consolidation.
The Consolidated Financial Statements should be read in conjunction with the Consolidated Financial Statements and footnotes thereto included in the Company’s Form 10-K for the fiscal year ended December 31, 2010. The accompanying unaudited Consolidated Financial Statements and related footnotes have been prepared in accordance with generally accepted accounting principles in the United States (“GAAP”) for interim financial information and with the instructions to Form 10-Q and Rule 10-01 of Regulation S-X and conform to practices within the financial services industry. Accordingly, they do not include all of the information and footnotes required by GAAP for complete financial statements.
The results of operations for the three months ended March 31, 2011 are not necessarily indicative of the results to be expected for the fiscal year ending December 31, 2011.
The Consolidated Financial Statements refer to “Management” within the disclosures. The Company’s definition of Management is the executive management team of the Company and its subsidiaries.
The preparation of financial statements in conformity with GAAP requires Management to make estimates and assumptions that affect the amount of assets and liabilities as well as disclosures of contingent assets and liabilities at the date of the financial statements. Although Management believes these estimates to be reasonably accurate, actual amounts may differ. In the opinion of Management, all adjustments considered necessary have
12
Table of Contents
Pacific Capital Bancorp and Subsidiaries
NOTES TO CONSOLIDATED FINANCIAL STATEMENTS - CONTINUED
NOTE 1. SUMMARY OF SIGNIFICANT ACCOUNTING POLICIES - CONTINUED
been reflected in the financial statements during their preparation. Certain amounts in the 2010 financial statements have been reclassified to be comparable with classifications used in the 2011 financial statements.
On December 28, 2010, the Company effected a 1-for-100 reverse stock split, reducing its authorized common shares from 5 billion to 50 million. Outstanding shares were reduced from 3.29 billion to 32.9 million. All outstanding stock options and warrants to purchase stock, and their respective exercise prices, were adjusted for this reverse stock split. All per share amounts for both the Predecessor Company and the Successor Company in the Company’s Consolidated Financial Statements have been restated to reflect this reverse stock split.
Recapitalization through the Investment Transaction and Purchase Accounting
On August 31, 2010, pursuant to the terms of an Investment Agreement (the “Investment Agreement”), dated as of April 29, 2010, by and among the Company, the Bank and SB Acquisition Company LLC, a wholly-owned subsidiary of Ford Financial Fund, L.P. (the “Investor”), the Company issued to the Investor (i) 2,250,000 shares of common stock at a purchase price of $20.00 per share and (ii) 455,000 newly created shares of our Series C Convertible Participating Voting Preferred Stock (the “Series C Preferred Stock”) at a purchase price of $1,000 per share (the purchase and sale of these securities, the “Investment Transaction”). The aggregate consideration paid to the Company by the Investor for these securities was $500 million in cash.
As a result of the Investment Transaction, pursuant to which the Investor acquired and controlled 98.1% of the voting securities of the Company, the Company followed the acquisition or purchase method of accounting as required by the Business Combinations Topic of the Accounting Standard Codification (“ASC”) Topic 805, Business Combinations (“ASC 805”). Under the rules of the SEC Staff Accounting Bulletin T. 5J, New Basis of Accounting Required in Certain Circumstances (“SEC SAB T. 5J”) or ASC 805-50-S99, the application of “push down” accounting is required.
As a result of the adjustments required by purchase accounting, the Company’s balance sheets and results of operations from periods through August 31, 2010 are labeled as “Predecessor Company” amounts and may not be comparable to balances and results of operations from periods after the close of business on August 31, 2010 (the “Transaction Date”), which are labeled as “Successor Company.” Purchase accounting requires that the assets purchased, the liabilities assumed, and non-controlling interests all be reported in the acquirer’s financial statements at their fair value, with any excess of purchase consideration over the net assets being reported as goodwill. Although the $500 million in cash from the Investor was received on August 31, 2010, the purchase accounting adjustments are reflected in the Consolidated Financial Statements after the close of business on the Transaction Date. The purchase accounting transactions are reflected within the Successor Company’s Consolidated Financial Statements. Acquisition accounting requires that the valuation of assets, liabilities, and non-controlling interests be recorded in the acquiree’s records as well. Accordingly, the Company’s Consolidated Financial Statements and transactional records prior to the Investment Transaction reflect the historical accounting basis of assets and liabilities and are labeled “Predecessor Company,” while such records subsequent to the Investment Transaction are labeled “Successor Company” and reflect the push down basis of accounting for the new fair values in the Company’s Consolidated Financial Statements. This change in accounting basis is represented in the Consolidated Financial Statements by a vertical black line which appears between the columns entitled “Successor Company” and “Predecessor Company” on the statements and in the relevant notes of the Consolidated Financial Statements. The black line signifies that the amounts shown for the periods prior to and subsequent to the Investment Transaction are not comparable.
13
Table of Contents
Pacific Capital Bancorp and Subsidiaries
NOTES TO CONSOLIDATED FINANCIAL STATEMENTS - CONTINUED
NOTE 1. SUMMARY OF SIGNIFICANT ACCOUNTING POLICIES - CONTINUED
In addition to the new accounting basis established for assets, liabilities and noncontrolling interests, purchase accounting requires the reclassification of any retained earnings from periods prior to the acquisition to be recognized as common share equity and the elimination of any accumulated other comprehensive income (“OCI”) or loss and paid in capital within the Company’s Shareholders’ Equity section of the Company’s Consolidated Financial Statements. Accordingly, retained earnings and OCI since the Transaction Date represent only the results of operations subsequent to the Transaction Date.
Consolidation of Subsidiaries and Variable Interest Entities
PCBC has six wholly-owned subsidiaries: PCBNA, a banking subsidiary, PCB Service Corporation, utilized as a trustee of deeds of trust in which PCBNA is the beneficiary and four unconsolidated subsidiaries used as business trusts in connection with issuance of trust preferred securities as described in Note 17, “Long Term Debt and Other Borrowings” of the 2010 Form 10-K.
PCBNA has three wholly-owned consolidated subsidiaries:
| n | MCM and REWA, two registered investment advisors that provide investment advisory services to individuals, foundations, retirement plans and select institutional clients. |
| n | SBBT RAL Funding Corp., which was utilized for the securitization of RALs to assist with the financing of the RAL program as described in Note 26, “Discontinued Operations—RAL and RT Programs” of the 2010 Form 10-K’s Consolidated Financial Statements. |
PCBNA also retains ownership in several low income housing tax credit partnerships (“LIHTCP”) that generate tax credits. These partnerships are not consolidated into these Consolidated Financial Statements. These investments historically have played a significant role in meeting the Bank’s Community Reinvestment Act (“CRA”) requirements as well as providing tax credits to reduce the Company’s taxable income.
The Company does not have any other entities that should be considered for consolidation.
Recent Accounting Pronouncements
During the three months ended March 31, 2011, the following accounting pronouncements applicable to the Company were issued or became effective:
In January 2011, the FASB issued Accounting Standards Update (“ASU”) 2011-01, Receivables (Topic 310): Deferral of the Effective Date of Disclosures about Troubled Debt Restructurings in Update No. 2010-20 (“ASU 2011-01”). The ASU temporarily delays the effective date of the disclosures about troubled debt restructurings in ASU 2010-20 until the FASB completes its deliberations on what constitutes a troubled debt restructuring.
In April 2011, the FASB issued ASU 2011-02, Receivables (Topic 310): A Creditor’s Determination of Whether a Restructuring Is a Troubled Debt Restructuring. The ASU clarifies which loan modifications constitute troubled debt restructuring and is intended to assist creditors in determining whether a modification of the terms of a receivable meet the criteria to be considered a troubled debt restructuring, both for purposes of recording an impairment loss and for disclosure of troubled debt restructurings. In evaluating whether a restructuring constitutes a troubled debt restructuring, a creditor must separately conclude that both of the following exist:
14
Table of Contents
Pacific Capital Bancorp and Subsidiaries
NOTES TO CONSOLIDATED FINANCIAL STATEMENTS - CONTINUED
NOTE 1. SUMMARY OF SIGNIFICANT ACCOUNTING POLICIES - CONTINUED
(a) the restructuring constitutes a concession; and (b) the debtor is experiencing financial difficulties. The guidance will be effective for the Company on July 1, 2011 and applies retrospectively to restructurings occurring on or after January 1, 2011. The adoption of the new guidance is not expected to have a material impact on the Company’s financial statements.
Cash Reserve Requirement
All depository institutions are required by law to maintain reserves against their transaction deposits. The reserves must be held in cash or with the Reserve Bank. The amount of the reserve may vary each day as banks are permitted to meet this requirement by maintaining the specified amount as an average balance over a two week period. In addition, PCBNA must maintain sufficient balances to cover the checks written by bank customers that are clearing through the Reserve Bank because they have been deposited at other banks.
Trading Assets
The identification of a trading asset is determined at the time of purchase. Trading securities are recorded at fair value on a recurring basis. Trading assets are reported on the Consolidated Balance Sheets at their estimated fair value. The changes in the fair value of the trading securities are reported in noninterest income as they occur. All trading assets were transferred to the available for sale (“AFS”) portfolio at the Transaction Date.
Investment Securities
All investment securities are debt securities and are classified as AFS. The appropriate classification is determined at the time of purchase. Securities classified as AFS are reported as an asset on the Consolidated Balance Sheets at their estimated fair value. As the fair value of AFS securities changes, the changes are reported (net of the appropriate income tax) as an element of OCI. When AFS securities, specifically identified, are sold, the unrealized gain or loss is reclassified from OCI to noninterest income.
When the estimated fair value of a security is lower than the book value, a security is considered to be impaired. On a quarterly basis, Management evaluates any securities in a loss position to determine whether the impairment is other-than-temporary. If there is an intent to sell the security or if the Company will be required to sell the security or if the Company will not recover the entire cost basis of the security, the security is other-than-temporarily impaired and impairment is recognized. The amount of impairment resulting from credit loss is recognized in earnings and impairment related to all other factors is recognized in OCI.
Interest income is recognized based on the coupon rate and is increased by the accretion of discounts earned or decreased by the amortization of premiums paid over the contractual life of the security using the effective interest method.
PCBNA is a member of both the Reserve Bank and the Federal Home Loan Bank (“FHLB”), and as a condition of membership in both organizations, it is required to purchase stock. In the case of the Reserve Bank, the amount of stock that is required to be held is based on PCBNA’s capital. The required ownership of FHLB stock is based on the borrowing capacity used by PCBNA. These investments are considered equity securities with no actively traded market. Therefore, the shares are considered restricted investment securities and reported in FHLB and other investments in the Consolidated Balance Sheets. Such investments are carried at cost, which is equal to the
15
Table of Contents
Pacific Capital Bancorp and Subsidiaries
NOTES TO CONSOLIDATED FINANCIAL STATEMENTS - CONTINUED
NOTE 1. SUMMARY OF SIGNIFICANT ACCOUNTING POLICIES - CONTINUED
value at which they may be redeemed. The dividend income received from the stock is reported in interest income.
Loans Held for Sale
Periodically, the Company identifies loans it expects to sell prior to maturity. When loans are originated or identified to be sold, they are recorded as held for sale and reported at the lower of cost or fair value in the Consolidated Balance Sheets. The loan’s cost basis includes unearned deferred fees and costs, and premiums and discounts. These loans are generally held between 30 to 90 days from their origination date. Due to the short period of time loans are held for sale, deferred fees or expenses are not amortized. If a loan has been reported as held for sale and is then determined that it is unlikely to be sold, the loan is reclassified to loans held for investment at the lower of cost or fair value. The majority of loans held for sale by the Company are residential real estate loans. Loans classified as held for sale are disclosed in Note 4, “Loans” of these Consolidated Financial Statements.
Loans Held for Investment
Loans held for investment, except for Purchased Credit Impaired (“PCI”) Loan Pools described below, are reported at their outstanding principal balances net of any unearned income, cumulative charge-offs, unamortized deferred fees and costs on originated loans and unamortized premiums or discounts on purchased loans.
Loans originated and purchased since the Transaction Date are included in “Loans Held for Investment” within these Consolidated Financial Statements and are referred to within these Consolidated Financial Statements as “Loans originated and purchased since the Transaction Date.” At March 31, 2011 and at December 31, 2010, a majority of the loans reported as Loans Held for Investment are PCI Loan Pools. The accounting for PCI Loan Pools is significantly different from the accounting for loans originated and purchased since the Transaction Date. The accounting policies for the loans originated since the Transaction Date is covered within this section, while the accounting for PCI Loan Pools is described in the section below called “Accounting for PCI Loan Pools.”
Interest income on all loans is accrued daily, except for PCI loan pools and loans in a nonaccrual status. Loan fees collected for the origination of loans less direct loan origination costs (net deferred loan fees) are amortized over the contractual life of the loan through interest income. If a loan has scheduled payments, the amortization of the net deferred loan fee is calculated using the effective interest method over the contractual life of the loan. If the loan does not have scheduled payments, such as a line of credit, the net deferred loan fee is recognized as interest income on a straight line basis over the contractual life of the loan commitment. Loan fees received for loan commitments are recognized as interest income over the term of the commitment. When loans are repaid, any remaining unamortized balances of unearned fees, deferred fees and costs and premiums and discounts paid on purchased loans are accounted for through interest income.
Unfunded Loan Commitments and Letters of Credit
Letters and lines of credit are commitments to extend credit and standby letters of credit to the Bank’s customers. These commitments meet the financing needs of the Bank’s customers in the normal course of business and are commitments with “off-balance sheet” risk since the Bank has committed to issuing funds to or on behalf of customers, but there is no current loan outstanding. Included in unfunded loan commitments are secured and unsecured lines of credit.
16
Table of Contents
Pacific Capital Bancorp and Subsidiaries
NOTES TO CONSOLIDATED FINANCIAL STATEMENTS - CONTINUED
NOTE 1. SUMMARY OF SIGNIFICANT ACCOUNTING POLICIES - CONTINUED
Lines of credit are obligations to lend money to a borrower. Credit risk arises when the borrowers’ current financial condition may indicate less ability to pay than when the commitment was originally made. Standby letters of credit and financial guarantees are conditional commitments issued by the Company to guarantee the performance of a customer to a third party in borrowing arrangements. In the case of standby letters of credit, the risk arises from the possibility of the failure of the customer to perform according to the terms of a contract. In such a situation, the third party might draw on the standby letter of credit to pay for completion of the contract and the Company would have to look to its customer to repay these funds to the Company with interest. The Company uses the same credit policies in making commitments and conditional obligations as it would for a loan to that customer.
The Company has exposure to losses from unfunded loan commitments and letters of credit. Since the funds have not been disbursed on these commitments, they are not reported as loans outstanding. Losses related to these commitments are not included in the allowance for loan and lease losses reported in Note 6, “Allowance for Loan and Lease Losses” of these Consolidated Financial Statements. Instead, they are accounted for as a separate loss contingency or reserve within other liabilities on the Company’s Consolidated Balance Sheets.
Prior to the funding of a loan, the Bank may provide an interest rate lock commitment for mortgage loans that will be originated with the intent to sell. The Bank also enters into mandatory delivery contracts, which are loan sale agreements in which the Company has committed to deliver a certain principal amount of mortgage loans to a third party investor at a specified price on or before a specified date. These interest rate lock commitments and mandatory delivery contracts qualify as derivatives under GAAP. The fair value of the interest rate lock commitments is based on the change in interest rates between the date the interest rate lock commitment is executed and the date the loan is funded. The fair value of the mandatory delivery contracts is calculated by comparing the price on the contract accepted date to the price on the actual sale date. The fair value of these derivatives is reported as other assets or other liabilities and changes in the fair values are reflected through noninterest income in the Company’s Consolidated Financial Statements.
Accounting for PCI Loan Pools
Loans acquired in a transfer, including business combinations, where there is evidence of credit deterioration since origination and it is probable at the date of acquisition that the acquirer will not collect all contractually required principal and interest payments, are accounted for using the guidance for PCI loans, which is contained in the ASC 310-30, Receivables, Loans and Debt Securities Acquired with Deteriorated Credit Quality (“ASC 310-30”). In addition, the American Institute of Certified Public Accountants (“AICPA”) reached an understanding with the SEC that permits an acquirer to elect to account for acquired loans that are not impaired by means of expected cash flows rather than contractual cash flows. This understanding is documented in a letter from the AICPA to the SEC dated December 18, 2009. The Company has elected an accounting policy to apply expected cash flows accounting guidance to all loans subject to the business combination and push-down accounting requirements for loan portfolios acquired in a business combination and will herein be referred to as “PCI Term Pools”.
Some loans that otherwise meet the definition of credit impaired, such as revolving lines of credit, are specifically excluded from the scope of the accounting guidance in ASC 310-30 and are accounted for using ASC 310-20, Receivables, Nonrefundable Fees and Other Costs (“ASC 310-20”). However, Management considers these revolving lines of credit to also be credit impaired and has pooled these revolving lines of credit purchased through the Investment Transaction and herein will refer to these loans as “PCI Revolving Pools”.
17
Table of Contents
Pacific Capital Bancorp and Subsidiaries
NOTES TO CONSOLIDATED FINANCIAL STATEMENTS - CONTINUED
NOTE 1. SUMMARY OF SIGNIFICANT ACCOUNTING POLICIES - CONTINUED
PCI Term Pools are initially recorded at fair value, and any related allowance for loan and lease losses from before the acquisition cannot be carried over. Fair value is determined by estimating the principal and interest cash flows expected to be collected after discounting at the prevailing market rate of interest. The difference between contractual cash flows and expected cash flows, on an undiscounted basis, represents the nonaccretable difference. The difference between undiscounted expected cash flows and discounted expected cash flows represents the accretable yield. The Company’s estimated expected cash flows on PCI loan pools take into consideration estimated prepayments based on the characteristics of the loans contained in each loan pool and expected charge-offs and recoveries of the PCI loans. The accretable yield is recognized in interest income over the remaining life of the pool of loans using the effective yield method.
Management has elected to have PCI loans aggregated into several pools based on common risk characteristics as allowed under ASC 310-30. Each pool is accounted for as a single asset with a single composite interest rate and an aggregate expectation of cash flows. Both the accretion of interest income and the comparison of actual cash flows to expected cash flows are completed at the pool level rather than by individual loans. The Company has aggregated all of the loans acquired at the Transaction Date into the pools. Loans may not be removed from a pool, added to a pool, or moved from one pool to another. All activity such as payments, charge-offs, recoveries, and prepayments received is applied to the loan pool in which the loan was placed at the Transaction Date. Payments which are in excess of expectations in one pool may not be applied to other pools to avoid the recognition of impairment for deficient payments within another pool. Only the disposal of a loan, which may include sales of loans to third parties, payoff or prepayment by the borrower, foreclosure of the collateral, or charge-off will result in the removal of a loan from a loan pool. When a loan is removed from a pool, it is removed at its carrying amount.
The Company periodically compares actual cash flows to expected cash flows for PCI Term Pools to determine whether such cash flows are substantially the same as was expected at the time the loan’s expected cash flows were last estimated. Actual cash flows less than expected cash flows may result in the establishment of an allowance for loan losses through a charge to the provision for loan losses. Actual cash flows significantly greater than expected cash flows may result in the reduction of any allowance that had previously been established and then an increase to interest income through the adjustment of the discount rate used to calculate the accretable yield.
Because PCI Term Pools are written down at acquisition to an amount estimated to be collectible and aggregated into pools, the classification and disclosures are at pool levels regardless of the underlying individual loan performance. PCI Term Pools are not reported as delinquent, nonaccrual, impaired or troubled debt restructured (“TDRs”) even though some of the underlying loans may be contractually past due, on nonaccrual, impaired or TDRs as the pool is evaluated as a single unit of account.
PCI Revolving Pools
As mentioned above, acquired loans which are revolving are excluded from ASC 310-30 but the accounting for purchase discounts on pooled revolving lines of credit is required in accordance with ASC 310-20. Individual revolving lines of credit that had been originated prior to the Investment Transaction were placed in pools with similar risk characteristics. PCI Revolving Pools were recorded at fair value at the Transaction Date based on expected cash flows, which included estimated losses inherent in the pool at the Transaction Date. A new carrying amount is established for PCI Revolving Pools based on its fair value, which represents its net realizable value. The difference between the former carrying value and the net realizable value is the purchase discount.
18
Table of Contents
Pacific Capital Bancorp and Subsidiaries
NOTES TO CONSOLIDATED FINANCIAL STATEMENTS - CONTINUED
NOTE 1. SUMMARY OF SIGNIFICANT ACCOUNTING POLICIES - CONTINUED
Because of the uncertainty in the underlying cash flows associated with the PCI Revolving Pools at the Transaction Date, Management determined that the purchase discount should not be accreted and has only recorded interest income on these pools at the contractual rate to the extent considered collectible. Management periodically reassesses the net realizable value of each PCI Revolving Pool and records interest income relating to the purchase discount in accordance with ASC 310-20 when it is probable that amounts in excess of the carrying value will be realized. Such amounts are recognized in income on a straight line basis over the period the revolving line of credit is active, assuming that borrowings are outstanding for the maximum term provided in the loan contract. In the event that credit losses are higher than expectations, the Company records an allowance to the extent that the carrying value exceeds the amounts expected to be collected.
Unlike PCI Term Pools, accounting guidance requires that disclosures be made on the underlying loans in PCI Revolving Pools even though such loans were written down to fair value on the Transaction Date. As a result, the underlying loans in PCI Revolving Loan Pools are reported as contractually delinquent, nonaccrual, impaired, or TDRs to the extent applicable.
Allowance for Loan and Lease Losses
Credit risk is inherent in the business of extending loans and leases to borrowers. Normally, this credit risk is addressed through a valuation allowance termed Allowance for Loan and Lease Losses (“ALLL”). The ALLL represents a creditor’s estimate of loan losses inherent within the loan portfolio at each balance sheet date. Netted against the outstanding loan balance, this allowance reduces the balance to the creditor’s estimate of what will be collected from borrowers. The ALLL is established through charges to current period earnings by recording a provision for loan losses. When losses become specifically identifiable and quantifiable, the loan balance is reduced through recording a charge-off against the ALLL. Should payments be received on charged-off loans, the payment is credited to the allowance as a recovery.
Charge-offs of loans are generally processed by policy as well as by regulatory guidance. Secured consumer loans, including residential real estate loans, that are 120 days past due are written down to the fair value of the collateral. Unsecured consumer loans are charged-off once the loan is 120 days past due. Decisions on when to charge-off commercial loans and loans secured by commercial real estate are made on an individual basis rather than length of delinquency, though it is a factor in the decision. The financial resources of the borrower and/or guarantor and the nature and value of any collateral are other factors considered. It is also more common among these business loans to charge-off or write down portions of the balance than with consumer loans other than real estate.
Prior to the Transaction Date, the ALLL related to probable losses inherent in the Company’s loans held for investment as of the balance sheet date. However, the purchase accounting guidance for business combinations significantly impacted the Company’s allowance for loan and lease losses as of the Transaction Date. The revaluation of assets required by this accounting guidance resulted in all loans being reported at their fair value as of the Transaction Date. The fair value is presumed to take into account the contractual payments on loans that are not expected to be received, and consequently no allowance for loan and lease losses was carried over for the Company’s loans as of the Transaction Date. Subsequent to the Transaction Date, the ALLL is comprised of the Company’s estimate of losses inherent in successor loans originated and purchased since the Transaction Date; the differential between current expected cash flows and prior expected cash flows for PCI Term Pools when current expected cash flows are less than prior expected cash flows; and the amount of credit losses inherent in PCI Revolving Pools in excess of the net realizable value.
19
Table of Contents
Pacific Capital Bancorp and Subsidiaries
NOTES TO CONSOLIDATED FINANCIAL STATEMENTS - CONTINUED
NOTE 1. SUMMARY OF SIGNIFICANT ACCOUNTING POLICIES - CONTINUED
Credit risk ratings of large problem loans in the commercial loan portfolio (loans secured by multifamily real estate, loans secured by commercial real estate, loans secured by the construction of multifamily or commercial real estate, commercial and industrial/commercial loans, and other) are reviewed at a minimum, quarterly. A credit risk rating for a commercial loan may be assessed and require a credit risk rating change when the following events occur:
| n | new credit requests, |
| n | loan renewals, |
| n | review of borrower financial statements or non receipt of borrower financial statements when requested, |
| n | appearance on delinquency reports, |
| n | outside credit inquires, |
| n | identified facts demonstrate change in risk of nonpayment, |
| n | historical payment experience, |
| n | current economic trends, |
| n | emerging industry problems, and |
| n | contact with borrower provides new credit information. |
Credit risk ratings in the consumer loan portfolio (term and revolving loans secured by residential real estate for 1 to 4 families, secured consumer loans, and unsecured lines of credit for consumer loans) are assessed and require a credit risk rating change when the following events occur:
| n | new credit requests, |
| n | deterioration of credit score, |
| n | loan renewals, |
| n | appearance on delinquency reports, |
| n | identified facts demonstrate change in risk of nonpayment, |
| n | historical payment experience, and |
| n | contact with borrower provides new credit information. |
The change in a borrower’s credit risk rating is not limited to the listing above. Quarterly, the Bank’s credit administration department obtains a credit score refreshment report which assesses consumer loan borrower’s credit scores to identify borrowers which could have a deterioration of credit score which would trigger a credit risk rating change for a borrower.
Once a credit risk rating is assessed for a loan, its classification is determined based on the expectation of repayment. Nonclassified loans generally include those loans that are expected to be repaid in accordance with contractual loan terms. Classified loans are those loans that are classified as substandard or doubtful consistent with regulatory guidelines.
20
Table of Contents
Pacific Capital Bancorp and Subsidiaries
NOTES TO CONSOLIDATED FINANCIAL STATEMENTS - CONTINUED
NOTE 1. SUMMARY OF SIGNIFICANT ACCOUNTING POLICIES - CONTINUED
Loans Classified as Substandard
A substandard loan is a loan which is inadequately protected by a current sound worth and paying capacity of the borrower or the collateral pledged, if any. The extension of credit has a well defined weakness and/or the Company identifies a distinct possibility that a loss will be incurred if the deficiency identified is not corrected. When a loan is classified as substandard it does not necessarily imply there is a loss exposure in a specific loan, but a loss potential does exist.
Loans Classified as Doubtful
Loans classified as doubtful have all of the weaknesses inherent in a loan classified as substandard with an added characteristic that the weaknesses make the collection or liquidation in full, on the basis of currently existing facts, conditions, and values highly questionable and improbable.
After reviewing the credit risk ratings in the loan portfolio, the second step is to develop an estimate of the loss inherent in individual loans or groups of similar loans. The estimation of probable losses takes into consideration the loan credit risk ratings and other factors such as:
| n | loan balances, |
| n | loan pool segmentation, |
| n | historical loss analysis, |
| n | identification, review, and valuation of impaired loans, |
| n | changes in the economy impacting lending activities, |
| n | changes in the concentrations of various loan types, |
| n | changes in the growth rate or volume of lending activities, |
| n | changes in the trends for delinquent and problem loans, |
| n | changes in the control environment or procedures, |
| n | changes in the management and staffing effectiveness, |
| n | changes in the loan review effectiveness, |
| n | changes in the underlying collateral values of loans, |
| n | changes in the competition/regulatory/legal issues, |
| n | unanticipated events, and |
| n | changes and additional valuation for structured financing and syndicated national credits. |
The amount of the allowance recorded at the end of the prior reporting period is then compared with the new estimate of inherent loss. If additional allowance is required to cover the revised estimate, the additional amount is provided through a charge to provision for loan losses. If the recorded allowance is higher than the revised estimate, the allowance is reduced by a negative provision for loan losses.
For PCI Loan Pools, which represent 93.8% of the carrying value of the Company’s loans held for investment at March 31, 2011, there is no ALLL unless further deterioration of credit quality has occurred since the Transaction Date. These loans were recorded at fair value as of the Transaction Date based on the acquirer’s estimate of
21
Table of Contents
Pacific Capital Bancorp and Subsidiaries
NOTES TO CONSOLIDATED FINANCIAL STATEMENTS - CONTINUED
NOTE 1. SUMMARY OF SIGNIFICANT ACCOUNTING POLICIES - CONTINUED
collections to be received. In addition, each quarter, Management must make a determination whether the estimate of expected cash flows from these loans needs to be revised. This determination is based on actual cash flows received and any information available about the borrowers and their financial condition that would lead Management to conclude that expected cash flows will be substantially different from what was estimated at the end of the last accounting period. Of the factors noted above for PCI Loan Pools, those that relate specifically to the borrower, to the economy, and to credit deterioration seen for similar borrowers or similar businesses or industries will be most relevant.
As is indicated in the section above for PCI Loan Pools, the Company has aggregated all of these loans into pools with similar risk characteristics that have become the individual units of accounting. The estimates of expected cash flows are therefore calculated at the pool level. An unfavorable change in the estimate of expected cash flows requires that the Company recognize the deterioration by establishing an ALLL on a pool by pool basis. A favorable change in the estimate of expected cash flows would result in reversing any allowance previously established because of an unfavorable change, but no negative allowance is recorded if the favorable change exceeds any previously recorded allowance. Instead, the excess expected cash flows are accreted into income over the remaining estimated terms of the loans in the pool.
Further information on the allowance for loan loss is provided in Note 6, “Allowance for Loan and Lease Losses” of these Consolidated Financial Statements.
ALLL Model Methodology
The Company considers both quantitative and qualitative factors when determining the level of estimated ALLL. Quantitative factors are based primarily on historical credit losses for each portfolio of similar loans over a time horizon or “look-back” period. The Company uses historical credit losses over the past six quarters as a basis for its quantitative factors.
Qualitative factors are used to increase historical loss rates based on the Company’s estimate of the losses inherent in the outstanding loan portfolio that are not fully captured by the quantitative factors alone. Qualitative factors taken into consideration in calculations of the ALLL include: concentrations of types of loans, loan growth, control environment, delinquency and classified loan trends, Management and staffing experience and turnover, economic conditions, results of independent loan review, underlying collateral values, competition, regulatory, legal issues, structured finance and syndicated national credits, and other factors. These qualitative factors are applied as adjustments to the historical loss rates when Management believes they are necessary to better reflect current conditions.
Nonaccrual Loans, Impaired Loans, and Restructures of Troubled Debt
As discussed above in the PCI Loan Pools section, the accounting for pooled credit impaired loans has implications for classification and reporting disclosures of loans classified as nonaccrual, impaired, or TDRs. Because the Company’s loans were written down to fair value and pooled as of the Transaction Date, the carrying amount of the loans in the Company’s Consolidated Financial Statements is based upon amounts estimated to be collected. PCI Term Pools are not classified as nonaccrual, impaired or TDRs even though some of the underlying loans may be contractually past due or nonperforming unlike the underlying loans in the PCI Revolving Pools which are required to be disclosed as delinquent, nonaccrual, impaired, or TDR. Quarterly, the individual pools are assessed for the overall collectability of the expected cash flows on a pool by pool basis.
22
Table of Contents
Pacific Capital Bancorp and Subsidiaries
NOTES TO CONSOLIDATED FINANCIAL STATEMENTS - CONTINUED
NOTE 1. SUMMARY OF SIGNIFICANT ACCOUNTING POLICIES - CONTINUED
For all loans originated since the Transaction Date, when an individual borrower discontinues making payments as contractually required by the note, the Company must determine whether it is appropriate to continue to accrue interest. Generally, the Company places loans in a nonaccrual status and ceases recognizing interest income when the loan has become delinquent by more than 90 days and/or when Management determines that the repayment of principal and collection of interest is unlikely. The Company may decide that it is appropriate to continue to accrue interest on certain loans more than 90 days delinquent if they are well secured by collateral and collection is in process.
When a loan is placed on nonaccrual status, any accrued but uncollected interest for the loan is reversed out of interest income in the period in which the status is changed. Subsequent payments received from the customer are applied to principal and no further interest income is recognized until the principal has been paid in full or until circumstances have changed such that payments are again consistently received as contractually required. In the case of commercial customers, the pattern of payment must also be accompanied by a positive change in the financial condition of the borrower.
A loan is identified as impaired when it is probable that interest and principal will not be collected according to the contractual terms of the loan agreement. However, there are some loans that are termed impaired because of doubt regarding collectability of interest and principal according to the contractual terms, but are both fully secured by collateral and are current in their interest and principal payments. These impaired loans may be placed back on accrual. After Management determines a loan is impaired, it determines the fair value of the loan. A valuation allowance is established for an impaired loan when the fair value of the collateral supporting that loan or the expected cash flows of a loan is less than the recorded investment. For additional information in obtaining the fair value of a loan, refer to Note 2, “Fair Value of Financial Instruments,” on page 30 of these Consolidated Financial Statements.
A loan may be restructured when the Company determines that a borrower’s financial condition has deteriorated, but still has the ability to repay at least some portion of the loan. A loan is considered to be a TDR when the original terms have been modified in favor of the borrower such that either principal or interest has been forgiven, contractual payments are deferred, or the interest rate is reduced. A loan may also be considered a TDR when the loan of a financially troubled borrower is renewed with the same terms as were offered when the borrower was not troubled because it is normally expected that interest rates will be higher to cover the increased credit risk from a troubled borrower.
Additional information regarding loans classified nonaccrual, impaired, and TDRs is disclosed in Note 6, “Allowance for Loan and Lease Losses” of these Consolidated Financial Statements.
23
Table of Contents
Pacific Capital Bancorp and Subsidiaries
NOTES TO CONSOLIDATED FINANCIAL STATEMENTS - CONTINUED
NOTE 1. SUMMARY OF SIGNIFICANT ACCOUNTING POLICIES - CONTINUED
Premises and Equipment
Premises and equipment are reported at cost less accumulated depreciation. Depreciation is expensed over the estimated useful lives of the assets. The Company depreciates assets utilizing a combination of accelerated methods of depreciation and straight line depreciation. The estimated useful lives of premises and equipment are as follows:
| Buildings |
40 years | |||
| Building improvements |
3 – 40 years | |||
| Furniture and equipment |
5 – 7 years | |||
| Electronic equipment and software |
3 – 10 years |
Leasehold improvements are amortized over the terms of the leases or the estimated useful lives of the improvements, whichever is shorter. Management annually reviews Premises and Equipment in order to determine if facts and circumstances suggest that the value of an asset is not recoverable.
Leases
The Company leases a majority of its branches and support offices. Most of these leases are operating leases for which a monthly rental expense is recognized. However, when the terms of the lease are such that the Company is leasing the building for most of its useful economic life or the present value of the sum of lease payments represents most of the fair value of the building, the transaction is accounted for as a capital lease. In a capital lease, the building is recognized as an asset of the Company and the net present value of the contracted lease payments is recognized as a long term liability. The amortization charge relating to assets recorded under capital leases is included with depreciation expense.
Some of the Company’s leases have cost-of-living adjustments based on the consumer price index. Some of the leases have fixed increases provided for in the terms or increases based on the index but have a minimum increase irrespective of the change in index. In these cases, the total fixed or minimum lease expense is recognized on a straight line basis over the term of the lease. As part of the purchase accounting due to the Investment Transaction, the Company evaluated all of its leases. A liability was recorded as of the Transaction Date because the contracted lease payments were above the current market rates for similar properties in aggregate. The contractual obligations for leases are disclosed in Note 9, “Premises and Equipment” of the 2010 Form 10-K’s Consolidated Financial Statements.
Goodwill and Intangible Assets
Intangible assets are generally acquired through an acquisition. If the benefit of the intangible asset is obtained through contractual or other legal rights, or if the intangible asset can be sold, transferred, licensed, rented, or exchanged, regardless of the acquirer’s intent to do so, the acquired intangible asset will be a separately recognized asset. Such intangible assets are subject to amortization over their useful lives. Among these identifiable intangible assets are core deposit intangibles and customer relationship intangibles (“CRI”). The Company amortizes core deposit intangibles and core relationship intangibles over their estimated useful lives.
Any excess of the purchase price over the estimated fair value of the assets received and liabilities assumed is an unidentifiable intangible asset and is recorded as goodwill. Goodwill must be reviewed for impairment whenever there is evidence to suggest that the reason an acquirer paid more than the estimated value of the net
24
Table of Contents
Pacific Capital Bancorp and Subsidiaries
NOTES TO CONSOLIDATED FINANCIAL STATEMENTS - CONTINUED
NOTE 1. SUMMARY OF SIGNIFICANT ACCOUNTING POLICIES - CONTINUED
assets no longer is present but not less frequently than once per year. This evidence may be in the form of a triggering event or a series of events or developments.
Testing goodwill for impairment consists of a two part test to determine the fair value of goodwill. In Step 1, the fair value of the reporting unit is determined and compared to its carrying value including goodwill. If the fair value of the reporting unit is more than its carrying value, goodwill is not impaired. If the fair value of the reporting unit is less than its carrying value, the company must proceed with Step 2. In Step 2, the implied fair value of goodwill is estimated. The implied fair value of goodwill is the excess of fair value of the reporting unit over the fair values of the assets and liabilities of the reporting unit as they would be determined in an acquisition. If the carrying amount of the goodwill is more than its implied fair value, it is impaired and an impairment charge must be recognized.
All of the goodwill recognized in the Company’s Consolidated Financial Statements as of March 31, 2011 is the result of the purchase accounting for the Investment Transaction. Additional information regarding goodwill and the computation of goodwill is disclosed in Note 2, “Business Combination—Investment Transaction” and Note 10, “Goodwill and Intangible Assets” of the 2010 Form 10-K’s Consolidated Financial Statements.
Bank Owned Life Insurance
Bank owned life insurance (“BOLI”) is a source of funding for employee benefit expenses. BOLI involves the purchase of life insurance by the Bank on a chosen group of employees. The Bank is the owner and is a joint or sole beneficiary of the policies. This life insurance investment is carried as an asset at the cash surrender value of the underlying policies. In cases where the Bank is a joint beneficiary of the policies, the Bank has recorded a liability for the portion of the cash surrender value owned by the other party. Income from the increase in cash surrender value of the policies is reflected in noninterest income. The cash surrender value approximates fair value.
Other Real Estate Owned
Real estate acquired through foreclosure on a loan or by the surrender of real estate in lieu of foreclosure is called Other Real Estate Owned or (“OREO”). OREO is recorded in the Company’s financial records at the lower of its carrying value or fair value of the OREO, less estimated costs to sell. If the outstanding balance of the loan is greater than the fair value of the OREO at the time of foreclosure, the excess of the loan balance over the fair value is charged-off against the ALLL before recording the asset as an OREO. OREOs are recorded as other assets within the Consolidated Financial Statements.
Once the collateral is foreclosed on and the property becomes an OREO, Management periodically obtains appraisals to determine if further valuation adjustments are required. Valuation adjustments are also required when the listing price to sell an OREO has had to be reduced below the current carrying value. If there is a decrease in the fair value of the property from the last valuation, the decrease in value is charged against noninterest income. During the time the property is held, all related operating and maintenance costs are expensed as incurred. Increases in the values of properties are not recognized until sale. All income produced from OREOs, such as from renting the property, is included in noninterest income.
25
Table of Contents
Pacific Capital Bancorp and Subsidiaries
NOTES TO CONSOLIDATED FINANCIAL STATEMENTS - CONTINUED
NOTE 1. SUMMARY OF SIGNIFICANT ACCOUNTING POLICIES - CONTINUED
Mortgage and Other Loan Servicing Rights
Included in other assets are mortgage and other loan servicing rights associated with the sale of loans for which the servicing of the loan is retained. The Company receives a fee for servicing these loans. The right to receive this fee for performing servicing is of value to the Company and could be sold should the Company choose to do so. Companies engaged in selling loans and retaining servicing rights for a fee are required to recognize servicing rights as an asset or liability. The rights are recorded at the net present value of the fees that will be collected, less estimated servicing costs, which approximates the fair value. Loan servicing rights are amortized into noninterest income in proportion to, and over the period of, estimated future net servicing income. Estimates of the lives of the loans are based on several industry standard sources and take into consideration prepayment rates expected in the current market interest rate environment.
Each quarter Management evaluates servicing rights for impairment. Impairment occurs when the fair value of loan servicing rights is less than amortized cost. The rates at which consumers prepay their loans are impacted by changes in interest rates—prepayments generally increase as interest rates fall, and generally decrease as interest rates rise so the value of the servicing right changes with changes in interest rates. When prepayments increase, the Company will collect less servicing fees, and the value of the servicing rights declines. A valuation of the servicing assets is performed at each reporting period and reductions to the servicing assets’ carrying value are made when the carrying balance is higher than the fair value of the servicing asset utilizing the lower of cost or fair value valuation methodology.
Securities Sold Under Agreement to Repurchase
The Company enters into repurchase agreements whereby it sells securities or loans to another institution and agrees to repurchase them at a later date for an amount in excess of the sale price. While in form these are agreements to sell and repurchase, in substance they are secured borrowings in which the excess of the repurchase price over the sale price represents interest expense. This expense is accrued over the term of the borrowing. For security or collateral, the Company must pledge assets with a higher fair value than the amount borrowed. Information about the amounts held and the interest rates may be found in Note 16, “Securities Sold Under Agreements to Repurchase and Federal Funds Purchased” of the 2010 Form 10-K’s Consolidated Financial Statements. There was a purchase accounting premium recorded as a result of the Investment Transaction for these repurchase agreements based on current market rates for similar instruments.
Other Borrowings
Management utilizes a variety of sources to raise borrowed funds at competitive rates, including FHLB borrowings and subordinated debt. FHLB borrowings typically carry rates approximating the London Inter-Bank Offered Rate (“LIBOR”) for the equivalent term because they are secured with investments or high quality loans. Interest is accrued on a monthly basis based on the outstanding borrowings interest rate and is included in interest expense.
In past quarters, a majority of the long term and short term debt of the Company were advances with the FHLB. Long term funding through the FHLB is collateralized by pledging qualifying loans and/or securities. Virtually all of the FHLB advances were repaid by the Company in early September 2010 from the proceeds received in the Investment Transaction and deposits maintained at the Reserve Bank. Purchase accounting adjustments were made based on current market rates for similar instruments. Refer to Note 10, “Other Borrowings” of these Consolidated Financial Statements for the current period activity within long term debt and other borrowings.
26
Table of Contents
Pacific Capital Bancorp and Subsidiaries
NOTES TO CONSOLIDATED FINANCIAL STATEMENTS - CONTINUED
NOTE 1. SUMMARY OF SIGNIFICANT ACCOUNTING POLICIES - CONTINUED
Reserve for Off-Balance Sheet Commitments
The Company has exposure to losses from unfunded loan commitments and letters of credit. Since the funds have not been disbursed on these commitments, they are not reported as loans outstanding. Estimated losses related to these commitments are not included in the ALLL reported in Note 6, “Allowance for Loan and Lease Losses” of these Consolidated Financial Statements. Instead, they are accounted for as a separate loss contingency or reserve as a liability within other liabilities on the Company’s Consolidated Balance Sheets also referred to as a “Reserve for Off-Balance Sheet Commitments”. Losses are experienced when the Company is contractually obligated to make a payment under these instruments and must seek repayment from a party that may not be as financially sound in the current period as it was when the commitment was originally made.
As with its outstanding loans, the Company applies the same historical loss rates and qualitative factors to its off-balance sheet obligations in determining an estimate of losses inherent in these contractual obligations. The estimate for loan losses on off-balance sheet instruments is included within other liabilities and the charge to income that establishes this liability is reported within other noninterest expense.
The estimate for loan losses on off-balance sheet instruments is included as a contingent liability under the provisions of ASC 450, Loss Contingencies. It is included within other liabilities and the charges to income that establish this liability are reported within other noninterest expense.
At the Transaction Date, a liability was recorded for the fair value of the unfunded commitments as part of the purchase accounting adjustments and therefore no further reserve for off-balance sheet commitments are carried-over. This is a onetime measurement, and the Company will reduce this liability as these commitments are funded or expire without being funded. Additional disclosure regarding the Company’s reserve for off-balance sheet commitments is located in Note 4, “Loans” of these Consolidated Financial Statements.
Derivative Financial Instruments
GAAP requires that all derivatives be recorded at their fair value on the balance sheet. Certain derivative transactions that meet specified criteria qualify for hedge accounting under GAAP. The Company does not hold any derivatives that meet the criteria for hedge accounting. If a derivative does not meet the specific criteria, gains or losses associated with changes in its fair value are immediately recognized in noninterest income.
Trust Assets and Investment and Advisory Fees
The Company has a trust department and two registered investment advisory subsidiaries, MCM and REWA, each of which have fiduciary responsibility for the assets that they manage on behalf of customers. These assets are not owned by the Company and are not reflected in the Consolidated Balance Sheets. Fees for most trust services are based on the market value of customer assets, and the fees are accrued monthly. All of the activity for the trust department and investment and advisory services are reported in the wealth management segment.
Stock-Based Compensation
The Company grants nonqualified stock options and restricted stock to directors and employees as a form of compensation. All stock-based compensation is accounted for in accordance with GAAP which requires compensation expense for the issuance of stock-based compensation be recognized over the vesting period of the share-based award.
27
Table of Contents
Pacific Capital Bancorp and Subsidiaries
NOTES TO CONSOLIDATED FINANCIAL STATEMENTS - CONTINUED
NOTE 1. SUMMARY OF SIGNIFICANT ACCOUNTING POLICIES - CONTINUED
The amount of compensation expense to be recognized for options is based on the fair value of the options, utilizing a binomial option pricing model, at the date of the grant. The fair value for the options is estimated based on the length of their term, the volatility of the stock price in past periods, and other factors. Details regarding the accounting for stock-based compensation expense are disclosed in Note 21 “Shareholders’ Equity” of the 2010 Form 10-K’s Consolidated Financial Statements.
A valuation model is not used for pricing restricted stock because the value is based on the closing price of the Company’s stock on the grant date. The amount of expense is the number of shares granted multiplied by the stock price. The employee receives any dividends paid on the stock from the time of the grant, but receives the restricted stock only when the vesting period has elapsed.
Discontinued Operations—RAL and RT Programs
The RAL and RT Programs were sold in January 2010, requiring that the assets and liabilities of these programs be reported in the Consolidated Balance Sheets as “Assets from discontinued operations” and as “Liabilities from discontinued operations,” and that the results of operations from these programs be reported in a single line net of tax in the Consolidated Statements of Operations as “Expense from discontinued operations, net”. An abbreviated statement of operations for the programs is provided in Note 26, “Discontinued Operations—RAL and RT Programs” of the 2010 Form 10-K’s Consolidated Financial Statements. Because the sale of the programs occurred before the start of the 2010 tax season, there were only staff and operating expenses in 2010.
Income Taxes
The Company uses the asset and liability method, which recognizes a liability or asset representing the tax effects of future deductible or taxable amounts attributable to events that have been recognized in these Consolidated Financial Statements. Due to tax regulations, several items of income and expense are recognized in different periods for tax return purposes than for financial reporting purposes. These items represent “temporary differences.” The Company is required to provide in its financial statements for the eventual liability or deduction in its tax return for these temporary differences until the item of income or expense has been recognized for both financial reporting and for taxes. The provision is recorded in the form of deferred tax expense or benefit as the temporary differences arise, with the accumulated amount recognized as a deferred tax liability or asset. Deferred tax assets represent future deductions in the Company’s income tax return, while deferred tax liabilities represent future payments to tax authorities. When realization of the benefit of a deferred tax asset is uncertain, the Company is required to recognize a valuation allowance so as not to overstate the realizability. The valuation allowance recorded by the Company in 2009 and maintained throughout 2010 due to a lack of assurance of future taxable income against which to apply the benefit is discussed in Note 9, “Deferred Tax Asset and Tax Provision” of these Consolidated Financial Statements and in Note 13, “Deferred Tax Asset and Tax Provision” of the 2010 Form 10-K’s Consolidated Financial Statements.
Earnings Per Share
The computation of basic earnings per share for all periods presented in the Consolidated Statements of Operations is based on the weighted average number of shares outstanding during each year retroactively adjusted for the reverse stock split effective December 28, 2010.
Diluted earnings per share include the effect of common stock equivalents for the Company, which consist of shares issuable on the exercise of outstanding options and restricted stock awards and common stock warrants.
28
Table of Contents
Pacific Capital Bancorp and Subsidiaries
NOTES TO CONSOLIDATED FINANCIAL STATEMENTS - CONTINUED
NOTE 1. SUMMARY OF SIGNIFICANT ACCOUNTING POLICIES - CONTINUED
The number of options assumed to be exercised is computed using the “treasury stock method.” This method assumes that all options with an exercise price lower than the average stock price for the period have been exercised at the average market price for the period and that the proceeds from the assumed exercise have been used for market repurchases of shares at the average market price. Normally, the Company would receive a tax benefit for the difference between the market price and the exercise price of nonqualified options when options are exercised. The treasury stock method also assumes that the tax benefit from the assumed exercise of options is used to retire shares thereby lowering the number of shares assumed to be exercised. Options that have an exercise price higher than the average market price are excluded from the computation because they are anti-dilutive. When the Company’s net income available to common shareholders is in a loss position, the diluted earnings per share calculation utilizes only the average shares outstanding, because assuming the exercise of stock options or warrants would lower the loss per share.
Once stock options are exercised or restricted stock vests, the shares are included in the actual weighted average shares outstanding rather than as common stock equivalents.
Statement of Cash Flows
For purposes of reporting cash flows, “cash and cash equivalents” includes cash and due from banks, Federal funds sold, and securities purchased under agreements to resell. Federal funds sold and securities purchased under agreements to resell are one-day transactions, with the Company’s funds being returned to it the next business day.
Segments
GAAP requires that the Company disclose certain information related to the performance of various segments of its business. Segments are defined based on how the chief operating decision maker of the Company views the Company’s operations. Management has determined that the Company has two reportable operating segments: (1) Commercial and Community Banking and (2) the Wealth Management Group. The All Other segment consists of the administrative support units and the Bancorp and is not considered an operating segment. In the first quarter of 2010, the RAL and RT Programs were sold and were reported as discontinued operations. Up until the sale of the RAL and RT Programs, they were a separate operating segment but, due to the sale, this segment was removed from this disclosure. The factors used in determining these reportable segments are explained in Note 27, “Segments” of the 2010 Form 10-K.
29
Table of Contents
Pacific Capital Bancorp and Subsidiaries
NOTES TO CONSOLIDATED FINANCIAL STATEMENTS - CONTINUED
NOTE 2. FAIR VALUE OF FINANCIAL INSTRUMENTS
The accounting guidance for fair value establishes a framework for measuring fair value and establishes a three-level valuation hierarchy for disclosure of fair value measurement. The valuation hierarchy is based upon the transparency of inputs to the valuation of an asset or liability as of the measurement date. The three levels are defined as follows:
| Level 1: |
Observable quoted prices in active markets for identical assets and liabilities. | |
| Level 2: |
Observable quoted prices for similar assets and liabilities in active markets, quoted prices for identical or similar instruments in markets that are not active, and model-based valuation techniques for which all significant assumptions are observable in the market. | |
| Level 3: |
Model-based techniques that use at least one significant assumption not observable in the market. These unobservable assumptions reflect estimates of assumptions that market participants would use in pricing the asset or liability. Valuation techniques include use of option pricing models, discounted cash flow models and similar techniques. | |
Fair value is defined as the amount at which an asset (or liability) could be bought (or incurred) or sold (or settled) in a current transaction between willing parties, that is, other than in a forced or liquidation sale. The assets and liabilities which are fair valued on a recurring basis are described below and contained in the following tables. In addition, the Company may be required to record other assets and liabilities at fair value on a nonrecurring basis. These nonrecurring fair value adjustments involve the lower of carrying value or fair value accounting and write downs resulting from impairment of assets. The following methods and assumptions were used to estimate the fair value of each class of financial instruments that are recorded in the Company’s Consolidated Financial Statements at fair value on a recurring and nonrecurring basis.
Investment Securities
Investment securities are recorded at fair value on a recurring basis. Where quoted prices are available in an active market for identical assets, securities are classified within Level 1 of the valuation hierarchy. Such quoted prices are available for the Company’s U.S. Treasury securities. Most of the remainder of the Company’s securities are quoted using observable market information for similar assets which requires the Company to report and use Level 2 pricing for them. When observable market information is not available for securities or there is limited activity or less transparency around inputs, such securities would be classified within Level 3 of the valuation hierarchy. The Company does not have any securities within the Level 3 hierarchy.
Derivatives
The Company’s swap derivatives are not listed on an exchange and are instead executed over the counter (“OTC”). As no quoted market prices exist for such instruments, the Company values these OTC derivatives primarily based on the broker pricing indications, which involve proprietary models based upon financial principles and assumptions regarding past, present, and future market conditions. As a result, the swap values are classified within Level 3 of the fair value hierarchy.
As discussed in Note 1, “Summary of Significant Accounting Policies,” of these Consolidated Financial Statements, prior to the funding of a mortgage loan, the Bank may provide an interest rate lock commitment and mandatory delivery contracts for mortgage loans originated for sale that qualify as derivatives under GAAP. The value of the interest rate lock commitments is based on the change in interest rates between the date the interest
30
Table of Contents
Pacific Capital Bancorp and Subsidiaries
NOTES TO CONSOLIDATED FINANCIAL STATEMENTS - CONTINUED
NOTE 2. FAIR VALUE OF FINANCIAL INSTRUMENTS - CONTINUED
rate lock commitment is executed and the date the loan is funded. The interest rates used to fair value these derivatives are of similar assets in observable markets. The value of the mandatory delivery contract is calculated by comparing the price on the contract accepted date to the price on the actual sale date on similar assets that are currently being sold. As a result, these derivatives are classified within Level 2 of the fair value hierarchy.
Foreclosed Collateral or OREO
OREO is carried at the lower of its carrying value or fair value less estimated cost to sell. Fair value is determined by the lower of suggested market prices obtained from independent certified appraisers or the current listing price. When the fair value of the collateral is based on a current appraised value, the Company reports the fair value of the foreclosed collateral as nonrecurring Level 2.
Low Income Housing Tax Credit Partnerships
At March 31, 2011, and December 31, 2010, the Company had investments in LIHTCP’s with a carrying value of $36.6 million and $37.8 million, respectively. Because the Company is profitable, it is not required to fair value the LIHTCP’s on a quarterly basis. Therefore, Management evaluates the recoverability of these investments by obtaining fair value indications through LIHTCP asset managers on an annual basis. This was done previously as of December 31, 2010. At March 31, 2011, and December 31, 2010, no impairment of these investments was recognized. The Company classifies the valuation of these investments in LIHTCP as a nonrecurring Level 2 in the fair value hierarchy.
Loans Held for Sale
Loans held for sale are carried at the lower of carrying value or fair value. The fair value of loans held for sale is based on what secondary markets are currently offering for portfolios with similar characteristics or based on the agreed upon sale price. As such, the Company classifies the fair value of loans held for sale as a nonrecurring valuation within Level 2 of the fair value hierarchy. At March 31, 2011, and December 31, 2010, the Company had loans held for sale with an aggregate carrying value of $4.6 million and $16.5 million, respectively.
Mortgage and Other Loan Servicing Rights
Servicing rights are carried at the lower of aggregate cost or estimated fair value. Servicing rights are subject to quarterly impairment testing. When the fair value of the servicing rights is lower than their carrying value, an impairment is recorded by establishing or increasing the amount of a valuation allowance so that the net carrying amount is equal to the fair value. The Company uses independent third parties to value the servicing rights. At the Transaction Date, the Company wrote the servicing rights asset down to its fair value, eliminating the valuation allowance and establishing a new “cost” basis. The valuation model takes into consideration discounted cash flows using current interest rates and prepayment speeds for each type of the underlying asset being serviced. At March 31, 2011, and December 31, 2010, valuation adjustments of $5,000 and $10,000 were recognized, respectively. The Company classifies these servicing rights as nonrecurring Level 3 in the valuation hierarchy.
31
Table of Contents
Pacific Capital Bancorp and Subsidiaries
NOTES TO CONSOLIDATED FINANCIAL STATEMENTS - CONTINUED
NOTE 2. FAIR VALUE OF FINANCIAL INSTRUMENTS - CONTINUED
Financial Assets and Liabilities Measured at Fair Value on a Recurring Basis
Assets and liabilities measured at fair value on a recurring basis at March 31, 2011, and December 31, 2010, are summarized in the following tables:
| Recurring Fair Value Measurements at Reporting | ||||||||||||||||
| Successor Company |
Quoted prices in active markets for |
Active markets for |
||||||||||||||
| As
of March 31, 2011 |
identical assets (Level 1) |
similar assets (Level 2) |
Unobservable inputs (Level 3) |
|||||||||||||
| (dollars in thousands) | ||||||||||||||||
| Assets: |
||||||||||||||||
| Available for Sale: |
||||||||||||||||
| U.S. Agency obligations |
$ | 257,059 | $ | — | $ | 257,059 | $ | — | ||||||||
| Collateralized mortgage obligations |
625,676 | — | 625,676 | — | ||||||||||||
| Mortgage backed securities |
235,208 | — | 235,208 | — | ||||||||||||
| Asset backed securities |
1,728 | — | 1,728 | — | ||||||||||||
| State and municipal securities |
200,834 | — | 200,834 | — | ||||||||||||
| Total available for sale securities |
1,320,505 | — | 1,320,505 | — | ||||||||||||
| Fair value swap asset |
9,212 | — | — | 9,212 | ||||||||||||
| Fair value of derivative loans contracts |
33 | — | 33 | — | ||||||||||||
| Total assets at fair value |
$ | 1,329,750 | $ | — | $ | 1,320,538 | $ | 9,212 | ||||||||
| Liabilities: |
||||||||||||||||
| Fair value swap liability |
$ | 9,433 | $ | — | $ | — | $ | 9,433 | ||||||||
| Fair value of derivative loans contracts |
10 | — | 10 | — | ||||||||||||
| Total liabilities at fair value |
$ | 9,443 | $ | — | $ | 10 | $ | 9,433 | ||||||||
(continued on next page)
32
Table of Contents
Pacific Capital Bancorp and Subsidiaries
NOTES TO CONSOLIDATED FINANCIAL STATEMENTS - CONTINUED
NOTE 2. FAIR VALUE OF FINANCIAL INSTRUMENTS - CONTINUED
| Recurring Fair Value Measurements at Reporting | ||||||||||||||||
| Successor
Company |
Quoted prices in active markets for |
Active markets for |
||||||||||||||
| As
of December 31, 2010 |
identical assets (Level 1) |
similar assets (Level 2) |
Unobservable
inputs (Level 3) |
|||||||||||||
| (dollars in thousands) | ||||||||||||||||
| Assets: |
||||||||||||||||
| Available for Sale: |
||||||||||||||||
| U.S. Agency obligations |
$ | 268,443 | $ | — | $ | 268,443 | $ | — | ||||||||
| Collateralized mortgage obligations |
608,425 | — | 608,425 | — | ||||||||||||
| Mortgage backed securities |
197,912 | — | 197,912 | — | ||||||||||||
| Asset backed securities |
1,754 | — | 1,754 | — | ||||||||||||
| State and municipal securities |
201,566 | — | 201,566 | — | ||||||||||||
| Total available for sale securities |
1,278,100 | — | 1,278,100 | — | ||||||||||||
| Fair value swap asset |
10,692 | — | — | 10,692 | ||||||||||||
| Total assets at fair value |
$ | 1,288,792 | $ | — | $ | 1,278,100 | $ | 10,692 | ||||||||
| Liabilities: |
||||||||||||||||
| Fair value swap liability |
$ | 11,240 | $ | — | $ | — | $ | 11,240 | ||||||||
| Total liabilities at fair value |
$ | 11,240 | $ | — | $ | — | $ | 11,240 | ||||||||
The following table provides a reconciliation of the beginning and ending balances for the net derivative liabilities that are measured at fair value using significant unobservable inputs (Level 3):
| Successor Company |
||||
| Three
Months Ended March 31, 2011 |
||||
| (dollars in thousands) | ||||
| Balance, beginning of period |
$ | 548 | ||
| Total net gains included in net income |
327 | |||
| Balance, end of period |
$ | 221 | ||
33
Table of Contents
Pacific Capital Bancorp and Subsidiaries
NOTES TO CONSOLIDATED FINANCIAL STATEMENTS – CONTINUED
NOTE 2. FAIR VALUE OF FINANCIAL INSTRUMENTS - CONTINUED
Financial Assets and Liabilities Measured at Fair Value on a Nonrecurring Basis
The Company was required to measure all assets and liabilities at fair value on the Transaction Date. In addition, the Company may be required to measure certain assets and liabilities at fair value on a nonrecurring basis in accordance with GAAP, usually upon some triggering event. These include assets and liabilities that are measured at the lower of cost or fair value that were recognized at fair value below cost at the end of the period.
Assets and liabilities measured at fair value on a nonrecurring basis at March 31, 2011, and December 31, 2010, are summarized in the table below:
| Nonrecurring Fair Value Measurements at Reporting |
||||||||||||||||
|
Successor As of |
Quoted prices in active markets for identical assets (Level 1) |
Active markets for similar assets (Level 2) |
Unobservable inputs (Level 3) |
|||||||||||||
| (dollars in thousands) | ||||||||||||||||
| Foreclosed collateral |
$ | 41,674 | $ | — | $ | 41,674 | $ | — | ||||||||
| Investments in LIHTCP |
36,627 | — | 36,627 | — | ||||||||||||
| Loans held for sale |
4,633 | — | 4,633 | — | ||||||||||||
| Servicing rights |
4,275 | — | — | 4,275 | ||||||||||||
| Total assets at fair value |
$ | 87,209 | $ | — | $ | 82,934 | $ | 4,275 | ||||||||
| Nonrecurring Fair Value Measurements at Reporting |
||||||||||||||||
| Successor Company As of December 31, 2010 |
Quoted prices in active markets for identical assets (Level 1) |
Active markets for similar assets (Level 2) |
Unobservable inputs (Level 3) |
|||||||||||||
| (dollars in thousands) | ||||||||||||||||
| Foreclosed collateral |
$ | 40,767 | $ | — | $ | 40,767 | $ | — | ||||||||
| Investments in LIHTCP |
40,892 | — | 40,892 | — | ||||||||||||
| Loans held for sale |
16,787 | — | 16,787 | — | ||||||||||||
| Servicing rights |
4,269 | — | — | 4,269 | ||||||||||||
| Total assets at fair value |
$ | 102,715 | $ | — | $ | 98,446 | $ | 4,269 | ||||||||
34
Table of Contents
Pacific Capital Bancorp and Subsidiaries
NOTES TO CONSOLIDATED FINANCIAL STATEMENTS - CONTINUED
NOTE 2. FAIR VALUE OF FINANCIAL INSTRUMENTS - CONTINUED
There were no liabilities measured at fair value on a nonrecurring basis at March 31, 2011, and December 31, 2010. There were no transfers in or out of the Company’s Level 3 financial assets during the periods presented within this note of these Consolidated Financial Statements by reason of a change in the methodology for establishing the fair value.
Disclosure of the Fair Value of Financial Instruments
The disclosure below provides the carrying value and fair value of the financial instruments which are not carried on the Company’s Consolidated Financial Statements at fair value or are carried at the lower of cost or fair value and not disclosed in the recurring or nonrecurring fair value measurements in the tables above.
| Successor Company | ||||||||||||||||
| March 31, 2011 | December 31, 2010 | |||||||||||||||
| Carrying Amount |
Fair Value |
Carrying Amount |
Fair Value |
|||||||||||||
| (dollars in thousands) | ||||||||||||||||
| Assets: |
||||||||||||||||
| Cash and due from banks |
$ | 42,520 | $ | 42,520 | $ | 45,820 | $ | 45,820 | ||||||||
| Interest bearing demand deposits in |
291,020 | 291,020 | 450,044 | 450,044 | ||||||||||||
| Loans held for investment, net |
3,807,218 | 3,790,473 | 3,760,997 | 3,723,796 | ||||||||||||
| Liabilities: |
||||||||||||||||
| Deposits |
4,754,126 | 4,776,123 | 4,908,288 | 4,921,551 | ||||||||||||
| Other borrowings |
119,956 | 119,945 | 121,014 | 120,184 | ||||||||||||
| Securities sold under agreements to repurchase |
318,615 | 318,807 | 319,737 | 318,354 | ||||||||||||
A summary of the valuation methodology used to disclose the fair value of the financial instruments in the table above is as follows:
Cash and Due from Banks and Interest Bearing Demand Deposits in Other Financial Institutions
The carrying values of cash and interest bearing demand deposits in other financial institutions are the fair value.
Loans Held for Investment, net
The carrying value of the loans held for investment at March 31, 2011, and December 31, 2010, was significantly impacted by the write down to fair value at the Transaction Date due to the application of purchase accounting related to the Investment Transaction. At the Transaction Date the loans purchased were at fair value based on the contractual cash flows expected to be collected. The fair value presented above is calculated based on the present value of expected principal and interest cash flows. The carrying value of the loans originated subsequent to the Investment Transaction is net of the ALLL which represents Management’s evaluation of expected credit losses inherent in those loan portfolios.
The methods used to estimate the fair value of loans are sensitive to the assumptions and estimates used. While Management has attempted to use assumptions and estimates that best reflect the Company’s loan portfolio and
35
Table of Contents
Pacific Capital Bancorp and Subsidiaries
NOTES TO CONSOLIDATED FINANCIAL STATEMENTS - CONTINUED
NOTE 2. FAIR VALUE OF FINANCIAL INSTRUMENTS - CONTINUED
current market conditions, a greater degree of subjectivity is inherent in these values than in those determined in active markets. Accordingly, readers are cautioned in using this information for purposes of evaluating the financial condition and/or value of the Company in and of itself or in comparison with any other company.
Deposits
The fair value of demand deposits, money market accounts, and savings accounts is the amount payable on demand at March 31, 2011, and December 31, 2010. The fair value of fixed-maturity certificates of deposit is estimated by discounting the interest and principal payments using the rates currently offered for deposits of similar remaining maturities.
Other Borrowings
For FHLB advances, the fair value is estimated using rates currently quoted by the FHLB for advances of similar remaining maturities. For subordinated debt and trust preferred securities, the fair value is estimated by discounting the interest and principal payments using current market rates for comparable securities. For treasury tax and loan (“TT&L”) obligations, the carrying amount is the fair value.
Securities sold under agreements to repurchase
The fair value of repurchase agreements is determined by reference to rates in the wholesale repurchase market. The rates paid to the Company’s customers are slightly lower than rates in the wholesale market and, consequently, the fair value will generally be less than the carrying amount. The fair value of the long term repurchase agreements is determined in the same manner as the other borrowings, above.
Disclosed Fair Value of Financial Instruments is not Equivalent to Franchise Value
The financial instruments disclosed in this note include such items as securities, loans, deposits, debt, and other instruments. Disclosure of fair values is not required for certain assets and liabilities that are not financial instruments such as obligations for pension and other postretirement benefits, premises and equipment, prepaid expenses, and income tax assets and liabilities. Accordingly, the aggregate fair value of amounts presented in this note does not purport to represent, and should not be considered representative of, the underlying “market” or franchise value of the Company. Further, due to a variety of alternative valuation techniques and approaches permitted by the fair value measurement accounting standards as well as the significant assumptions that are required to be made in the process of valuation, the determinations or estimations of fair value for many of the financial instruments disclosed in this note could and do differ between various market participants. A direct comparison of the Company’s fair value information with that of other financial institutions may not be appropriate.
36
Table of Contents
Pacific Capital Bancorp and Subsidiaries
NOTES TO CONSOLIDATED FINANCIAL STATEMENTS - CONTINUED
NOTE 3. INVESTMENT SECURITIES
A summary of investment securities held by the Company at March 31, 2011, and December 31, 2010, is as follows:
| Successor Company | ||||||||||||||||
| March 31, 2011 | ||||||||||||||||
| Amortized Cost | Gross Unrealized Gains |
Gross Unrealized Losses |
Fair Value | |||||||||||||
| (dollars in thousands) | ||||||||||||||||
| Available for sale: |
||||||||||||||||
| U.S. Agency obligations (1) |
$ | 257,088 | $ | 172 | $ | (201) | $ | 257,059 | ||||||||
| Mortgage backed securities (2) |
238,151 | 415 | (3,358) | 235,208 | ||||||||||||
| Collateralized mortgage obligations (3) |
639,409 | 164 | (13,897) | 625,676 | ||||||||||||
| Asset backed securities |
1,780 | — | (52) | 1,728 | ||||||||||||
| State and municipal securities |
216,898 | 7 | (16,071) | 200,834 | ||||||||||||
| Total securities |
$ | 1,353,326 | $ | 758 | $ | (33,579) | $ | 1,320,505 | ||||||||
| Successor Company | ||||||||||||||||
| December 31, 2010 | ||||||||||||||||
| Amortized Cost | Gross Unrealized Gains |
Gross Unrealized Losses |
Fair Value | |||||||||||||
| (dollars in thousands) | ||||||||||||||||
| Available for sale: |
||||||||||||||||
| U.S. Agency obligations (1) |
$ | 268,383 | $ | 174 | $ | (114) | $ | 268,443 | ||||||||
| Mortgage backed securities (2) |
200,918 | 140 | (3,146) | 197,912 | ||||||||||||
| Collateralized mortgage obligations (3) |
619,621 | 288 | (11,484) | 608,425 | ||||||||||||
| Asset backed securities |
1,754 | — | — | 1,754 | ||||||||||||
| State and municipal securities |
220,528 | 14 | (18,976) | 201,566 | ||||||||||||
| Total securities |
$ | 1,311,204 | $ | 616 | $ | (33,720) | $ | 1,278,100 | ||||||||
| (1) | U.S. Agency obligations are general obligations that are not backed by the full faith and credit of the United States government and consist of Government Sponsored Enterprises issued by the Federal Farm Credit, Federal Home Loan Mortgage Corporation (“FHLMC”), Federal National Mortgage Association (“FNMA”), Federal Home Loan Bank and Tennessee Valley Authority. |
| (2) | Mortgage backed securities (“MBSs”) are securitized mortgage loans that are not backed by the full faith and credit of the United States government and consist of Government Sponsored Enterprises which guarantee the collection of principal and interest payments. The securities primarily consist of securities issued by FHLMC and FNMA. |
| (3) | Collateralized mortgage obligations (“CMO’s”) are securities which pool together mortgages and separate them into short, medium, or long term positions called tranches. The CMO’s in the table above primarily consist of securities issued by Government National Mortgage Association (“GNMA”), FNMA, FHLMC and private label. |
37
Table of Contents
Pacific Capital Bancorp and Subsidiaries
NOTES TO CONSOLIDATED FINANCIAL STATEMENTS - CONTINUED
NOTE 3. INVESTMENT SECURITIES - CONTINUED
Available for Sale Securities
At March 31, 2011, and December 31, 2010, the Company held $1.32 billion and $1.28 billion, respectively, of securities in its AFS portfolio. Unrealized gains or losses relating to AFS securities are accounted for by adjusting the carrying amount of the securities. An offsetting entry after the adjustment for taxes at the Company’s corporate effective tax rate of 42.05% is recognized in OCI.
Fair values are obtained from independent sources based on current market prices for the specific security held by the Company or for a security with similar characteristics. If a security is in an unrealized loss position, Management is required to determine whether or not the security is temporarily or permanently impaired.
The following table shows all AFS securities that are in an unrealized loss position and temporarily impaired as of March 31, 2011, and December 31, 2010.
| Successor Company | ||||||||||||||||||||||||
| March 31, 2011 | ||||||||||||||||||||||||
| Less than 12 months | 12 months or more | Total | ||||||||||||||||||||||
| Fair Value |
Unrealized Loss |
Fair Value |
Unrealized Loss |
Fair Value |
Unrealized Loss |
|||||||||||||||||||
| (dollars in thousands) | ||||||||||||||||||||||||
| U.S. Agencies |
$ | 64,089 | $ | (201) | $ | — | $ | — | $ | 64,089 | $ | (201) | ||||||||||||
| Municipal bonds |
193,000 | (16,071) | — | — | 193,000 | (16,071) | ||||||||||||||||||
| Mortgage backed securities |
166,127 | (3,358) | — | — | 166,127 | (3,358) | ||||||||||||||||||
| Asset backed securities |
1,728 | (52) | — | — | 1,728 | (52) | ||||||||||||||||||
| Collateralized mortgage obligations |
617,980 | (13,897) | — | — | 617,980 | (13,897) | ||||||||||||||||||
| Total |
$ | 1,042,924 | $ | (33,579) | $ | — | $ | — | $ | 1,042,924 | $ | (33,579) | ||||||||||||
| Successor Company | ||||||||||||||||||||||||
| December 31, 2010 | ||||||||||||||||||||||||
| Less than 12 months | 12 months or more | Total | ||||||||||||||||||||||
| Fair Value |
Unrealized Loss |
Fair Value |
Unrealized Loss |
Fair Value |
Unrealized Loss |
|||||||||||||||||||
| (dollars in thousands) | ||||||||||||||||||||||||
| U.S. Agencies |
$ | 115,909 | $ | (114) | $ | — | $ | — | $ | 115,909 | $ | (114) | ||||||||||||
| Municipal bonds |
197,916 | (18,976) | — | — | 197,916 | (18,976) | ||||||||||||||||||
| Mortgage backed securities |
160,966 | (3,146) | — | — | 160,966 | (3,146) | ||||||||||||||||||
| Collateralized mortgage obligations |
572,986 | (11,484) | — | — | 572,986 | (11,484) | ||||||||||||||||||
| Total |
$ | 1,047,777 | $ | (33,720) | $ | — | $ | — | $ | 1,047,777 | $ | (33,720) | ||||||||||||
The $33.6 million and $33.7 million of unrealized losses for the AFS portfolio as of March 31, 2011, and December 31, 2010, respectively, are a result of changes in market interest rates. The fair value is based on current market prices obtained from independent sources for each security held. The issuers of these securities have not,
38
Table of Contents
Pacific Capital Bancorp and Subsidiaries
NOTES TO CONSOLIDATED FINANCIAL STATEMENTS - CONTINUED
NOTE 3. INVESTMENT SECURITIES - CONTINUED
to the Company’s knowledge, established any cause for default on these securities and the most recent ratings on all securities have an investment grade rating, except for three securities. At March 31, 2011, Management does not intend to sell any of the securities in a loss position nor are there any conditions present at March 31, 2011, that would require Management to sell them. As such, Management does not believe that there are any securities that are other-than-temporarily impaired as of March 31, 2011.
Contractual Maturities for Securities Portfolio
The amortized cost and estimated fair value of debt securities at March 31, 2011, and December 31, 2010, by contractual maturity, are shown in the table below.
| Successor Company | ||||||||||||||||
| March 31, 2011 | December 31, 2010 | |||||||||||||||
| Amortized Cost |
Estimated Fair Value |
Amortized Cost |
Estimated Fair Value |
|||||||||||||
| (dollars in thousands) | ||||||||||||||||
| Available for sale securities: |
||||||||||||||||
| In one year or less |
$ | 101,412 | $ | 101,207 | $ | 101,430 | $ | 100,821 | ||||||||
| After one year through five years |
795,658 | 782,105 | 785,739 | 775,438 | ||||||||||||
| After five years through ten years |
289,519 | 284,211 | 258,091 | 252,180 | ||||||||||||
| After ten years |
166,737 | 152,982 | 165,944 | 149,661 | ||||||||||||
| Total securities |
$ | 1,353,326 | $ | 1,320,505 | $ | 1,311,204 | $ | 1,278,100 | ||||||||
Expected maturities will differ from contractual maturities because issuers may have the right to call or prepay investment securities with or without call or prepayment penalties. With interest rates on a number of the Company’s securities having coupon rates higher than the current market rates, Management expects that issuers that have the right to call the securities will exercise these rights and pay the investment securities off earlier than the contractual term.
39
Table of Contents
Pacific Capital Bancorp and Subsidiaries
NOTES TO CONSOLIDATED FINANCIAL STATEMENTS – CONTINUED
NOTE 3. INVESTMENT SECURITIES - CONTINUED
Interest Income
The following table summarizes interest income from investment securities:
| Successor Company |
Predecessor Company |
|||||||||||
| (dollars in thousands) | Three Months Ended March 31, 2011 |
Three Months Ended March 31, 2010 |
||||||||||
| Trading: taxable |
||||||||||||
| Mortgage backed securities |
$ | — | $ | 64 | ||||||||
| Total interest income for Trading securities |
— | 64 | ||||||||||
| Interest income for AFS securities: |
||||||||||||
| Taxable: |
||||||||||||
| U.S. Treasury securities |
— | 82 | ||||||||||
| U.S. Agencies |
415 | 2,677 | ||||||||||
| Asset backed securities |
61 | 34 | ||||||||||
| CMO’s and MBS |
3,460 | 2,532 | ||||||||||
| Nontaxable: |
||||||||||||
| State and municipal securities |
2,160 | 3,001 | ||||||||||
| Total interest income for AFS securities |
6,096 | 8,326 | ||||||||||
| Total securities |
$ | 6,096 | $ | 8,390 | ||||||||
Pledged Securities
Securities with a carrying value of approximately $640.4 million and $671.2 million at March 31, 2011, and December 31, 2010, respectively, were pledged to secure public funds, trust deposits, repurchase agreements and other borrowings as required or permitted by law.
Investment in FHLB and Reserve Bank Stock
The Company’s investment in stock of the FHLB was $62.3 million and $64.8 million at March 31, 2011, and December 31, 2010, respectively. The Company’s investment in stock of the Reserve Bank was $18.2 million at March 31, 2011, and December 31, 2010, respectively. The investment of FHLB and Reserve Bank stock is included in FHLB stock and other investments of the Company’s Consolidated Balance Sheets.
40
Table of Contents
Pacific Capital Bancorp and Subsidiaries
NOTES TO CONSOLIDATED FINANCIAL STATEMENTS – CONTINUED
NOTE 4. LOANS
Loans held for sale
As of March 31, 2011, and December 31, 2010, the Company had $4.6 million and $16.5 million, respectively, of loans held for sale. All of the loans held for sale were from the residential real estate portfolio.
Loans held for investment
The composition of the Company’s loans held for investment portfolio at carrying value is as follows:
| Successor Company | ||||||||
| March
31, 2011 |
December
31, 2010 |
|||||||
| (dollars in thousands) | ||||||||
| Real estate: |
||||||||
| Residential - 1 to 4 family |
$ | 889,214 | $ | 897,478 | ||||
| Multifamily |
324,727 | 254,511 | ||||||
| Commercial |
1,786,573 | 1,745,589 | ||||||
| Construction |
203,084 | 234,837 | ||||||
| Revolving - 1 to 4 family |
277,035 | 280,753 | ||||||
| Commercial loans |
251,889 | 266,702 | ||||||
| Consumer loans |
57,018 | 60,713 | ||||||
| Other loans |
19,809 | 20,934 | ||||||
| Total loans |
$ | 3,809,349 | $ | 3,761,517 | ||||
The table above includes PCI Term Pools and PCI Revolving Pools, which were written down to fair value at the Transaction Date. The loan balances above are net of deferred loan origination fees, commitment, extension fees and origination costs of $78,000 and $22,000 at March 31, 2011, and December 31, 2010, respectively. The unamortized net deferred fees relate only to loans originated and purchased since the Transaction Date. Unamortized net deferred fees were eliminated in the purchase accounting of the Transaction Date.
41
Table of Contents
Pacific Capital Bancorp and Subsidiaries
NOTES TO CONSOLIDATED FINANCIAL STATEMENTS - CONTINUED
NOTE 4. LOANS - CONTINUED
Of the loans held for investment, a summary of the outstanding balance of loans originated and purchased since the Transaction Date is as follows:
| Successor Company | ||||||||
| March
31, 2011 |
December 31, 2010 |
|||||||
| (dollars in thousands) | ||||||||
| Real estate: |
||||||||
| Residential - 1 to 4 family |
$ | 45,398 | $ | 7,652 | ||||
| Multifamily loans |
92,900 | — | ||||||
| Commercial |
86,029 | — | ||||||
| Revolving - 1 to 4 family |
2,449 | 1,237 | ||||||
| Commercial loans |
2,477 | 2,553 | ||||||
| Consumer loans |
2,447 | 1,155 | ||||||
| Other loans |
4,708 | 3,807 | ||||||
| Total New loans originated and purchased since the Transaction Date - carrying balance |
$ | 236,408 | $ | 16,404 | ||||
| Total New loans originated and purchased since the Transaction Date - unpaid principal balance |
$ | 241,743 | $ | 16,376 | ||||
Pledged Loans
At March 31, 2011, loans secured by residential and commercial real estate with principal balances totaling $1.89 billion were pledged to FHLB and $491.8 million were pledged to the Reserve Bank as collateral for borrowings. These amounts pledged do not represent the amount of outstanding borrowings that are required to be supported by collateral. The Company maintains an excess of collateral at these institutions so that it may borrow without having to first transfer collateral to them.
Loan Purchases
In March 2011, the Company purchased $188.4 million of multifamily and commercial real estate loans. The loans were purchased at a discount which will accrete into income over the life of the loans using a level yield method. The purchased loans are not credit impaired based on the due diligence prior to the purchase. When reviewing and selecting the loans purchased, the Company required that the loans purchased had not been delinquent for the last 36 months, i.e. all contractual payments had been made on time. In addition, a majority of the loans purchased were seasoned loans which had been originated prior to 2005 and the collateral securing the loans purchased were considered to be lower risk based on the experience of the Company. Finally, all these loans were assigned a risk rating of “Pass” loans.
42
Table of Contents
Pacific Capital Bancorp and Subsidiaries
NOTES TO CONSOLIDATED FINANCIAL STATEMENTS - CONTINUED
NOTE 4. LOANS - CONTINUED
Loan Sales
A summary of the loan sale activities by loan portfolio, excluding SBA loans, is below.
| Successor Company |
Predecessor Company |
|||||||||||||
| (dollars in thousands) | Three Months Ended March 31, 2011 |
Three Months Ended March 31, 2010 |
||||||||||||
| Loans sold: |
||||||||||||||
| Residential real estate loans |
$ | 29,632 | $ | 50,530 | ||||||||||
| Commercial loans |
— | 13,605 | ||||||||||||
| Commercial real estate and construction loans |
2,500 | 1,840 | ||||||||||||
| Total loans sold |
$ | 32,132 | $ | 65,975 | ||||||||||
| Net gain on loans sold: |
||||||||||||||
| Net gain on residential real estate loans sold |
$ | 430 | $ | 515 | ||||||||||
| Net gain on commercial loans sold |
— | 3,523 | ||||||||||||
| Net gain on commercial real estate and construction loans sold |
— | 131 | ||||||||||||
| Total net gain on loans sold |
$ | 430 | $ | 4,169 | ||||||||||
| Loans sold with servicing released: |
||||||||||||||
| Residential real estate loans |
$ | 22,326 | $ | 38,370 | ||||||||||
| Commercial loans |
— | 13,605 | ||||||||||||
| Commercial real estate and construction loans |
2,500 | 1,840 | ||||||||||||
| Total loans sold with servicing released |
$ | 24,826 | $ | 53,815 | ||||||||||
| Loans sold with servicing retained: |
||||||||||||||
| Residential real estate loans |
$ | 7,306 | $ | 12,160 | ||||||||||
| Total loans sold with servicing retained |
$ | 7,306 | $ | 12,160 | ||||||||||
| Servicing rights recorded on loans sold: |
$ | 80 | $ | 130 | ||||||||||
| Residential real estate loans sold: |
||||||||||||||
| Loans sold that were originated for sale |
$ | 29,321 | $ | 36,331 | ||||||||||
| Loans sold from held for investment portfolio |
$ | 311 | $ | 14,199 | ||||||||||
SBA Loan Sales
During the three months ended March 31, 2010, the Company sold $2.7 million of SBA loans but due to the new accounting standard adopted for the transfer of financial assets on January 1, 2010, the sale of these loans were not recognized until 90 days after the date of sale. The loans sold were reported in loans held for sale with an offsetting liability reported as a secured borrowing. The gain on the sale of the SBA loans of $305,000 was not recognized until 90 days after the date of the sale. SBA loans have a government-guaranteed portion, and it is this portion that the Company sells into the secondary market, on a servicing retained basis. If the transfer of the guaranteed portion of an SBA loan results in a premium, the “seller” is obligated by the SBA to refund the premium to the “purchaser” if the loan is repaid within 90 days of the transfer. Due to these conditions, the Company was precluded from recognizing this gain until 90 days after the sale. There were no SBA loan sales during the three months ended March 31, 2011.
43
Table of Contents
Pacific Capital Bancorp and Subsidiaries
NOTES TO CONSOLIDATED FINANCIAL STATEMENTS – CONTINUED
NOTE 4. LOANS - CONTINUED
Unfunded Loan Commitments and Letters of Credit
As of March 31, 2011, and December 31, 2010, the contractual commitments for unfunded commitments and letters of credit are as follows:
| Successor Company | ||||||||||||||||||||
| March 31, 2011 | ||||||||||||||||||||
| Total | Less than one year |
One to three years |
Three to five years |
More than five years |
||||||||||||||||
| (dollars in thousands) | ||||||||||||||||||||
| Unfunded Commitments |
$ | 521,135 | $ | 155,020 | $ | 42,795 | $ | 83,967 | $ | 239,353 | ||||||||||
| Standby letters of credit and financial guarantees |
66,712 | 34,153 | 13,385 | 9,086 | 10,088 | |||||||||||||||
| Total |
$ | 587,847 | $ | 189,173 | $ | 56,180 | $ | 93,053 | $ | 249,441 | ||||||||||
| Successor Company | ||||||||||||||||||||
| December 31, 2010 | ||||||||||||||||||||
| Total | Less than one year |
One to three years |
Three to five years |
More than five years |
||||||||||||||||
| (dollars in thousands) | ||||||||||||||||||||
| Unfunded Commitments |
$ | 533,237 | $ | 149,067 | $ | 47,451 | $ | 85,723 | $ | 250,996 | ||||||||||
| Standby letters of credit and financial guarantees |
70,809 | 20,102 | 26,224 | 14,382 | 10,101 | |||||||||||||||
| Total |
$ | 604,046 | $ | 169,169 | $ | 73,675 | $ | 100,105 | $ | 261,097 | ||||||||||
Included in unfunded loan commitments are secured and unsecured lines of credit and loans. Letters and lines of credit are commitments to extend credit and standby letters of credit for the Bank’s customers. These commitments meet the financing needs of the Bank’s customers in the normal course of business and are commitments with “off-balance sheet” risk since the Bank has committed to issuing funds to or on behalf of customers, but there is no current loan outstanding.
Standby letters of credit and financial guarantees are conditional commitments issued by the Company to guarantee the performance of a customer to a third party in borrowing arrangements. At March 31, 2011, the maximum undiscounted future payments that the Company could be required to make were $66.7 million. Approximately 51.2% of these arrangements mature within one year. The Company generally has recourse to recover from the customer any amounts paid under these guarantees. Most of the guarantees are fully collateralized by the same types of assets used as loan collateral, however several are unsecured.
The reserve for the unfunded loan commitments and letters of credit was $47,000 at March 31, 2011. The reserve for off-balance sheet commitments is attributable to the unfunded loan commitments made since the Transaction Date. All unfunded commitments at the Transaction Date were fair valued as part of the purchase accounting adjustments. The reserve for off-balance sheet commitments has been reviewed and no additional reserve for the loan commitments is required. See Note 1, “Summary of Significant Accounting Policies” of these Consolidated Financial Statements for more information on the accounting for unfunded loan commitments and letters of credit.
44
Table of Contents
Pacific Capital Bancorp and Subsidiaries
NOTES TO CONSOLIDATED FINANCIAL STATEMENTS – CONTINUED
NOTE 5. PURCHASED CREDIT IMPAIRED POOLS
As discussed in Note 1, “Summary of Significant Accounting Policies” of the Consolidated Financial Statements, the Company has classified all of the loans acquired on the Transaction Date as purchased credit impaired loans and pooled the purchased loans into pools of loans which have similar risk characteristics. Purchased credit impaired loans which have revolving lines of credit are referred to as PCI Revolving Pools while the remainder of the loans purchased are referred to as PCI Term Pools.
The following table summarizes all of the loans purchased on the Transaction Date.
| Successor Company | ||||||||||||
| PCI
Term Pools |
PCI Revolving Pools |
Total | ||||||||||
| (dollars in thousands) | ||||||||||||
| Contractually required payments including interest |
$ | 6,905,416 | $ | 1,089,340 | $ | 7,994,756 | ||||||
| Difference related to credit |
(2,570,701) | (396,131) | (2,966,832) | |||||||||
| Cash flows expected to be collected |
4,334,715 | 693,209 | 5,027,924 | |||||||||
| Difference related to interest |
(928,294) | (79,540) | (1,007,834) | |||||||||
| Fair value |
$ | 3,406,421 | $ | 613,669 | $ | 4,020,090 | ||||||
The following table summarizes the accretable yield or income expected to be collected for PCI Term Pools purchased:
| Successor Company | ||||
| (dollars in thousands) | ||||
| Balance at December 31, 2010 |
$ | 861,898 | ||
| Accretable yield for new loans purchased |
— | |||
| Accretion of income |
(51,617) | |||
| Reclassifications from nonaccretable difference |
4,230 | |||
| Disposals |
— | |||
| Balance at March 31, 2011 |
$ | 814,511 | ||
45
Table of Contents
Pacific Capital Bancorp and Subsidiaries
NOTES TO CONSOLIDATED FINANCIAL STATEMENTS – CONTINUED
NOTE 5. PURCHASED CREDIT IMPAIRED POOLS - CONTINUED
The following table summarizes the balance of PCI Term Pools:
| Successor Company | ||||||||
| March
31, 2011 |
December 31, 2010 |
|||||||
| (dollars in thousands) | ||||||||
| Real estate: |
||||||||
| Residential - 1 to 4 family |
$ | 771,373 | $ | 814,770 | ||||
| Multifamily loans |
229,583 | 252,379 | ||||||
| Commercial |
1,678,354 | 1,718,029 | ||||||
| Construction |
193,698 | 227,424 | ||||||
| Revolving - 1 to 4 family |
5,367 | 5,451 | ||||||
| Commercial loans |
104,368 | 115,799 | ||||||
| Consumer loans |
31,738 | 34,491 | ||||||
| Other loans |
8,142 | 9,458 | ||||||
| Total PCI term pools - carrying balance |
$ | 3,022,623 | $ | 3,177,801 | ||||
| Total PCI term pools - unpaid principal balance |
$ | 3,323,012 | $ | 3,494,683 | ||||
The following table summarizes the balance of the PCI Revolving Pools:
| Successor Company | ||||||||
| March 31, 2011 |
December 31, 2010 |
|||||||
| (dollars in thousands) | ||||||||
| Real estate: |
||||||||
| Residential - 1 to 4 family |
$ | 72,443 | $ | 75,056 | ||||
| Multifamily loans |
2,244 | 2,132 | ||||||
| Commercial |
22,190 | 27,560 | ||||||
| Construction |
9,386 | 7,413 | ||||||
| Revolving - 1 to 4 family |
269,219 | 274,065 | ||||||
| Commercial loans |
145,044 | 148,350 | ||||||
| Consumer loans |
22,833 | 25,067 | ||||||
| Other loans |
6,959 | 7,669 | ||||||
| Total PCI revolving pools - carrying balance |
$ | 550,318 | $ | 567,312 | ||||
| Total PCI revolving pools - unpaid principal balance |
$ | 646,300 | $ | 668,988 | ||||
46
Table of Contents
Pacific Capital Bancorp and Subsidiaries
NOTES TO CONSOLIDATED FINANCIAL STATEMENTS – CONTINUED
NOTE 6. ALLOWANCE FOR LOAN AND LEASE LOSSES
The following table summarizes the allowance for loan and lease losses.
| Successor Company | ||||||||||||||||||||
| Beginning Balance at December 31, 2010 |
Charge-offs | Recoveries | Provision for loan and lease losses |
Ending Balance at March 31, 2011 |
||||||||||||||||
| (dollars in thousands) | ||||||||||||||||||||
| Real estate: |
||||||||||||||||||||
| Residential - 1 to 4 family |
$ | 120 | $ | — | $ | — | $ | 462 | $ | 582 | ||||||||||
| Multifamily |
— | — | — | 508 | 508 | |||||||||||||||
| Commercial |
— | — | — | 492 | 492 | |||||||||||||||
| Revolving - 1 to 4 family |
28 | — | — | 25 | 53 | |||||||||||||||
| Commercial loans |
206 | — | — | 12 | 218 | |||||||||||||||
| Consumer loans |
69 | (8) | — | 86 | 147 | |||||||||||||||
| Other loans |
97 | (64) | 16 | 82 | 131 | |||||||||||||||
| Total |
$ | 520 | $ | (72) | $ | 16 | $ | 1,667 | $ | 2,131 | ||||||||||
The $2.1 million and $520,000 of ALLL reported as of March 31, 2011, and December 31, 2010, respectively, relates only to the Company’s estimate of credit losses inherent in the $236.4 million and $16.4 million of loans originated and purchased since the Transaction Date.
The methodology used to calculate the ALLL for purchased loans was different from the ALLL methodology used for the loans originated since the Transaction Date. The ALLL methodology for purchased loans is based on the due diligence prior to the purchase and that the loans were assigned a risk rating of “Pass” loans. Based on this information, a $1.0 million ALLL was established for the loans purchased during the period. The ALLL for these purchased loans will be assessed separately from the ALLL for the newly originated loans since the Transaction Date and will be assessed on a quarterly basis.
As disclosed in Note 1, “Summary of Significant Accounting Policies,” the Investment Transaction significantly impacted the Bank’s ALLL. As a result of the Investment Transaction and the application of the accounting guidance for business combinations, the ALLL for the loans purchased was required to be eliminated and the PCI loan Pools were recorded at their fair value at the Transaction Date. Consequently, no ALLL is provided for PCI Loan Pools at the Transaction Date.
Management anticipates that the actual cash flows for each individual loan within the pool will differ each quarter from the estimate calculated at the Transaction Date. Management expects that cash flows from some of the loans within the pool will exceed the estimate prepared for them and some will be less than the estimate. However, from the Transaction Date forward, the pooled loans are accounted for as if they are single assets, and
47
Table of Contents
Pacific Capital Bancorp and Subsidiaries
NOTES TO CONSOLIDATED FINANCIAL STATEMENTS – CONTINUED
NOTE 6. ALLOWANCE FOR LOAN AND LEASE LOSSES - CONTINUED
only if the cash flows for the entire pool are less than what was estimated at the Transaction Date, is an allowance established for the pool through recognition of an ALLL through a provision for loan loss. Periodically, the Company is required to analyze each loan pool’s actual cash flows and compare them to the expected cash flows which established the fair value at the Transaction Date. Since the Transaction Date, there has been no ALLL established for PCI Term Pools or PCI Revolving Pools.
The following table disaggregates the ALLL and the recorded investment of loans by impairment methodology at March 31, 2011, and December 31, 2010.
| Successor Company | ||||||||||||
| Allowance for Loan and Lease Losses March 31, 2011 |
||||||||||||
| Commercial | Consumer | Total | ||||||||||
| (dollars in thousands) | ||||||||||||
| Individually evaluated for impairment (1) |
$ | — | $ | — | $ | — | ||||||
| Collectively evaluated for impairment (2) |
1,218 | 913 | 2,131 | |||||||||
| Acquired with deteriorated credit quality (3) |
— | — | — | |||||||||
| $ | 1,218 | $ | 913 | $ | 2,131 | |||||||
| Successor Company | ||||||||||||
| Recorded Investment of
Loans March 31, 2011 |
||||||||||||
| Commercial | Consumer | Total | ||||||||||
| (dollars in thousands) | ||||||||||||
| Individually evaluated for impairment (1) |
$ | — | $ | — | $ | — | ||||||
| Collectively evaluated for impairment (2) |
181,406 | 55,002 | 236,408 | |||||||||
| Acquired with deteriorated credit quality (3) |
2,351,174 | 1,221,767 | 3,572,941 | |||||||||
| $ | 2,532,580 | $ | 1,276,769 | $ | 3,809,349 | |||||||
48
Table of Contents
Pacific Capital Bancorp and Subsidiaries
NOTES TO CONSOLIDATED FINANCIAL STATEMENTS – CONTINUED
NOTE 6. ALLOWANCE FOR LOAN AND LEASE LOSSES - CONTINUED
| Successor Company | ||||||||||||
| Allowance for Loan and Lease Losses December 31, 2010 |
||||||||||||
| Commercial | Consumer | Total | ||||||||||
| (dollars in thousands) | ||||||||||||
| Individually evaluated for impairment (1) |
$ | — | $ | — | $ | — | ||||||
| Collectively evaluated for impairment (2) |
206 | 314 | 520 | |||||||||
| Acquired with deteriorated credit quality (3) |
— | — | — | |||||||||
| $ | 206 | $ | 314 | $ | 520 | |||||||
| Successor Company | ||||||||||||
| Recorded Investment of
Loans December 31, 2010 |
||||||||||||
| Commercial | Consumer | Total | ||||||||||
| (dollars in thousands) | ||||||||||||
| Individually evaluated for impairment (1) |
$ | — | $ | — | $ | — | ||||||
| Collectively evaluated for impairment (2) |
2,553 | 13,851 | 16,404 | |||||||||
| Acquired with deteriorated credit quality (3) |
2,461,779 | 1,283,334 | 3,745,113 | |||||||||
| $ | 2,464,332 | $ | 1,297,185 | $ | 3,761,517 | |||||||
| (1) | Represents loans individually evaluated for impairment in accordance with ASC 310-10, Receivables (formerly FAS 114), and pursuant to amendments by ASU 2010-20 regarding allowance for impaired loans. |
| (2) | Represents loans collectively evaluated for impairment in accordance with ASC 450-20, Loss Contingencies (formerly FAS 5), and pursuant to amendments by ASU 2010-20 regarding allowance for unimpaired loans. |
| (3) | Represents the related loan carrying value determined in accordance with ASC 310-30, Receivables — Loans and Debt Securities Acquired with Deteriorated Credit Quality (formerly SOP 03-3) and pursuant to amendments by ASU 2010-20 regarding allowance for PCI loans and purchased revolving lines of credit. |
Nonperforming Loans
Nonperforming assets include nonaccrual loans, past due loans which are accruing interest, TDRs and OREO. The reporting for nonperforming assets was significantly impacted by the Investment Transaction as described in Note 1, “Summary of Significant Accounting Policies” and Note 5, “Purchased Credit Impaired Pools” of these Consolidated Financial Statements because all loans and OREOs were written down to their fair value at the Transaction Date. For more information related to OREO, refer to Note 8, “OREO” of these Consolidated Financial Statements.
49
Table of Contents
Pacific Capital Bancorp and Subsidiaries
NOTES TO CONSOLIDATED FINANCIAL STATEMENTS – CONTINUED
NOTE 6. ALLOWANCE FOR LOAN AND LEASE LOSSES - CONTINUED
The table below summarizes loans classified as nonperforming:
| Successor Company | ||||||||
| March 31, 2011 |
December 31, 2010 |
|||||||
| (dollars in thousands) | ||||||||
| Nonaccrual loans: |
||||||||
| Real estate: |
||||||||
| Residential - 1 to 4 family |
$ | 2,172 | $ | 1,020 | ||||
| Commercial |
470 | 452 | ||||||
| Revolving - 1 to 4 family |
6,619 | 4,898 | ||||||
| Commercial loans |
10,519 | 5,369 | ||||||
| Consumer loans |
139 | 224 | ||||||
| Other loans |
1,028 | 963 | ||||||
| Total nonaccrual loans |
20,947 | 12,926 | ||||||
| Loans past due 90 days or more on accrual status: |
||||||||
| Real estate: |
||||||||
| Commercial |
— | 375 | ||||||
| Construction |
— | 255 | ||||||
| Commercial loans |
325 | 6,945 | ||||||
| Other loans |
306 | 335 | ||||||
| Total Loans past due 90 days or more on accrual status |
631 | 7,910 | ||||||
| Troubled debt restructured loans: |
||||||||
| Real estate: |
||||||||
| Residential - 1 to 4 family |
863 | 875 | ||||||
| Revolving - 1 to 4 family |
169 | 172 | ||||||
| Commercial loans |
139 | — | ||||||
| Total Troubled debt restructured loans |
1,171 | 1,047 | ||||||
| Total nonperforming loans |
$ | 22,749 | $ | 21,883 | ||||
At March 31, 2011, and December 31, 2010, all of the nonperforming loans reported in the table above are from the PCI Revolving Pools. All loans originated since the Transaction Date are performing at March 31, 2011, and December 31, 2010.
Aging of Past Due Loans
A majority of the loans held by the Company at March 31, 2011, have been pooled into PCI Term Pools and are not considered to be past due when reporting on a pooled basis in accordance with ASC 310-30. The following tables provide the aging of past due loans on an individual loan basis at the net carrying amount at March 31, 2011, and December 31, 2010. The difference between the unpaid principal balance and the carrying amount was allocated on a weighted average basis.
50
Table of Contents
Pacific Capital Bancorp and Subsidiaries
NOTES TO CONSOLIDATED FINANCIAL STATEMENTS – CONTINUED
NOTE 6. ALLOWANCE FOR LOAN AND LEASE LOSSES - CONTINUED
| Successor Company | ||||||||||||||||||||
| March 31, 2011 | ||||||||||||||||||||
| Current | 30-89 Days Past Due |
90+ Days Past Due - Still Accruing |
90+ Days Past Due - Nonaccrual |
Total | ||||||||||||||||
| (dollars in thousands) | ||||||||||||||||||||
| Loans Originated and Purchased Since Transaction Date: |
|
|||||||||||||||||||
| Real estate: |
||||||||||||||||||||
| Residential - 1 to 4 family |
$ | 45,398 | $ | — | $ | — | $ | — | $ | 45,398 | ||||||||||
| Multifamily loans |
92,900 | — | — | — | 92,900 | |||||||||||||||
| Commercial |
86,029 | — | — | — | 86,029 | |||||||||||||||
| Revolving - 1 to 4 family |
2,449 | — | — | — | 2,449 | |||||||||||||||
| Commercial loans |
2,477 | — | — | — | 2,477 | |||||||||||||||
| Consumer loans |
2,447 | — | — | — | 2,447 | |||||||||||||||
| Other loans |
4,677 | 31 | — | — | 4,708 | |||||||||||||||
| $ | 236,377 | $ | 31 | $ | — | $ | — | $ | 236,408 | |||||||||||
| PCI Revolving Pools: |
||||||||||||||||||||
| Real estate: |
||||||||||||||||||||
| Residential - 1 to 4 family |
$ | 69,490 | $ | 2,235 | $ | — | $ | 718 | $ | 72,443 | ||||||||||
| Multifamily loans |
2,244 | — | — | — | 2,244 | |||||||||||||||
| Commercial |
22,190 | — | — | — | 22,190 | |||||||||||||||
| Construction |
9,386 | — | — | — | 9,386 | |||||||||||||||
| Revolving - 1 to 4 family |
263,066 | 4,153 | — | 2,000 | 269,219 | |||||||||||||||
| Commercial loans |
130,730 | 5,281 | 325 | 8,708 | 145,044 | |||||||||||||||
| Consumer loans |
22,321 | 512 | — | — | 22,833 | |||||||||||||||
| Other loans |
5,266 | 765 | 306 | 622 | 6,959 | |||||||||||||||
| $ | 524,693 | $ | 12,946 | $ | 631 | $ | 12,048 | $ | 550,318 | |||||||||||
| PCI Term Pools: |
||||||||||||||||||||
| Real estate: |
||||||||||||||||||||
| Residential - 1 to 4 family |
$ | 723,383 | $ | 24,423 | $ | 23,567 | $ | — | $ | 771,373 | ||||||||||
| Multifamily loans |
220,695 | 5,120 | 3,768 | — | 229,583 | |||||||||||||||
| Commercial |
1,558,877 | 29,955 | 89,522 | — | 1,678,354 | |||||||||||||||
| Construction |
113,509 | 7,840 | 72,349 | — | 193,698 | |||||||||||||||
| Revolving - 1 to 4 family |
1,935 | — | 3,432 | — | 5,367 | |||||||||||||||
| Commercial loans |
76,617 | 5,058 | 22,693 | — | 104,368 | |||||||||||||||
| Consumer loans |
30,934 | 791 | 13 | — | 31,738 | |||||||||||||||
| Other loans |
7,597 | 545 | — | — | 8,142 | |||||||||||||||
| $ | 2,733,547 | $ | 73,732 | $ | 215,344 | $ | — | $ | 3,022,623 | |||||||||||
| Total |
$ | 3,494,411 | $ | 86,915 | $ | 215,975 | $ | 12,048 | $ | 3,809,349 | ||||||||||
51
Table of Contents
Pacific Capital Bancorp and Subsidiaries
NOTES TO CONSOLIDATED FINANCIAL STATEMENTS – CONTINUED
NOTE 6. ALLOWANCE FOR LOAN AND LEASE LOSSES - CONTINUED
| Successor Company | ||||||||||||||||||||
| December 31, 2010 | ||||||||||||||||||||
| Current | 30-89 Days Past Due |
90+ Days Past Due - Still Accruing |
90+ Days Past Due - Nonaccrual |
Total | ||||||||||||||||
| (dollars in thousands) | ||||||||||||||||||||
| Loans Originated Since Transaction Date: |
|
|||||||||||||||||||
| Real estate: |
||||||||||||||||||||
| Residential - 1 to 4 family |
$ | 7,652 | $ | — | $ | — | $ | — | $ | 7,652 | ||||||||||
| Revolving - 1 to 4 family |
1,237 | — | — | — | 1,237 | |||||||||||||||
| Commercial loans |
2,553 | — | — | — | 2,553 | |||||||||||||||
| Consumer loans |
1,155 | — | — | — | 1,155 | |||||||||||||||
| Other loans |
3,776 | 31 | — | — | 3,807 | |||||||||||||||
| $ | 16,373 | $ | 31 | $ | — | $ | — | $ | 16,404 | |||||||||||
| PCI Revolving Pools: |
||||||||||||||||||||
| Real estate: |
||||||||||||||||||||
| Residential - 1 to 4 family |
$ | 73,019 | $ | 1,910 | $ | — | $ | 127 | $ | 75,056 | ||||||||||
| Multifamily loans |
2,132 | — | — | — | 2,132 | |||||||||||||||
| Commercial |
26,248 | 937 | 375 | — | 27,560 | |||||||||||||||
| Construction |
6,397 | 761 | 255 | — | 7,413 | |||||||||||||||
| Revolving - 1 to 4 family |
267,689 | 4,486 | — | 1,890 | 274,065 | |||||||||||||||
| Commercial loans |
131,243 | 6,053 | 6,945 | 4,109 | 148,350 | |||||||||||||||
| Consumer loans |
24,323 | 685 | — | 59 | 25,067 | |||||||||||||||
| Other loans |
5,868 | 1,297 | 335 | 169 | 7,669 | |||||||||||||||
| $ | 536,919 | $ | 16,129 | $ | 7,910 | $ | 6,354 | $ | 567,312 | |||||||||||
| PCI Term Pools: |
||||||||||||||||||||
| Real estate: |
||||||||||||||||||||
| Residential - 1 to 4 family |
$ | 767,231 | $ | 18,273 | $ | 29,266 | $ | — | $ | 814,770 | ||||||||||
| Multifamily loans |
243,869 | 5,726 | 2,784 | — | 252,379 | |||||||||||||||
| Commercial |
1,589,908 | 21,988 | 106,133 | — | 1,718,029 | |||||||||||||||
| Construction |
131,473 | 10,658 | 85,293 | — | 227,424 | |||||||||||||||
| Revolving - 1 to 4 family |
1,954 | 1,006 | 2,491 | — | 5,451 | |||||||||||||||
| Commercial loans |
83,808 | 7,062 | 24,929 | — | 115,799 | |||||||||||||||
| Consumer loans |
33,347 | 833 | 311 | — | 34,491 | |||||||||||||||
| Other loans |
8,160 | 121 | 1,177 | — | 9,458 | |||||||||||||||
| $ | 2,859,750 | $ | 65,667 | $ | 252,384 | $ | — | $ | 3,177,801 | |||||||||||
| Total |
$ | 3,413,042 | $ | 81,827 | $ | 260,294 | $ | 6,354 | $ | 3,761,517 | ||||||||||
52
Table of Contents
Pacific Capital Bancorp and Subsidiaries
NOTES TO CONSOLIDATED FINANCIAL STATEMENTS – CONTINUED
NOTE 6. ALLOWANCE FOR LOAN AND LEASE LOSSES - CONTINUED
Classified and Nonclassified Loans
The following table summarizes classified and nonclassified loans as defined in Note 1, “Summary of Significant Accounting Policies” of these Consolidated Financial Statements. The amounts are reported at the net carrying amounts at March 31, 2011.
| Successor Company | ||||||||||||
| March 31, 2011 | ||||||||||||
| Non-Classified | Classified | Total | ||||||||||
| (dollars in thousands) | ||||||||||||
| Loans Originated and Purchased Since Transaction Date: |
|
|||||||||||
| Real estate: |
||||||||||||
| Residential - 1 to 4 family |
$ | 45,398 | $ | — | $ | 45,398 | ||||||
| Multifamily loans |
92,900 | — | 92,900 | |||||||||
| Commercial |
86,029 | — | 86,029 | |||||||||
| Revolving - 1 to 4 family |
2,449 | — | 2,449 | |||||||||
| Commercial loans |
2,477 | — | 2,477 | |||||||||
| Consumer loans |
2,447 | — | 2,447 | |||||||||
| Other loans |
4,547 | 161 | (1) | 4,708 | ||||||||
| Total loans |
$ | 236,247 | $ | 161 | $ | 236,408 | ||||||
| Successor Company | ||||||||||||
| December 31, 2010 | ||||||||||||
| Non-Classified | Classified | Total | ||||||||||
| (dollars in thousands) | ||||||||||||
| Loans Originated Since Transaction Date: |
||||||||||||
| Real estate: |
||||||||||||
| Residential - 1 to 4 family |
$ | 7,652 | $ | — | $ | 7,652 | ||||||
| Revolving - 1 to 4 family |
1,237 | — | 1,237 | |||||||||
| Commercial loans |
2,553 | — | 2,553 | |||||||||
| Consumer loans |
1,155 | — | 1,155 | |||||||||
| Other loans |
3,723 | 84 | (1) | 3,807 | ||||||||
| Total loans |
$ | 16,320 | $ | 84 | $ | 16,404 | ||||||
| (1) | The classified loans reported are overdraft loans. |
The Company closely monitors and assesses credit quality and credit risk in the loan portfolio on an ongoing basis. Loan credit risk ratings and classifications of loans are reviewed and updated periodically. Large classified loans credit risk ratings are reviewed at a minimum on a quarterly basis as disclosed in Note 1, “Summary of Significant Accounting Policies” of these Consolidated Financial Statements. At March 31, 2011, and December 31, 2010, all of the PCI Term and Revolving Pools were considered to be nonclassified and are not included in the table above. PCI loan pools are categorized based on the overall performance on a pool by pool basis. The underlying individual loans, within each pool, may be categorized based on individual loan performance.
53
Table of Contents
Pacific Capital Bancorp and Subsidiaries
NOTES TO CONSOLIDATED FINANCIAL STATEMENTS - CONTINUED
NOTE 6. ALLOWANCE FOR LOAN AND LEASE LOSSES - CONTINUED
Impaired Loans
Successor Company
Loans that had been identified as impaired loans prior to the Investment Transaction are no longer considered impaired because the impairment has already been recognized when the loans were fair valued based on the expected cash flows. All previously identified individual impaired loans are now part of a pool of loans which are all considered performing.
There were no impaired loans at either March 31, 2011 or December 31, 2010. There was no average investment in impaired loans for the three months ended March 31, 2011.
Predecessor Company
The average investment in impaired loans for the three months ended March 31, 2010 was $309.8 million. Interest recognized and interest income recognized using a cash basis of accounting was not material during this period.
Troubled Debt Restructurings
As discussed in Note 1, “Summary of Significant Accounting Policies” of these Consolidated Financial Statements, the aggregation of loans into pools at the Transaction Date with the application of ASC 310-30 causes TDRs in the PCI Term Pools to no longer be recognized as TDRs. Accordingly, the Company has few TDRs at March 31, 2011, and December 31, 2010.
Successor Company
During the three months ended March 31, 2011, commercial loans of $139,000 were modified as TDRs. There were no defaulted payments on TDRs during the three months ended March 31, 2011, which had been modified 12 months prior to March 31, 2011. At March 31, 2011, and December 31, 2010, there were no commitments to lend additional funds to borrowers whose terms have been modified as TDRs.
Predecessor Company
During the three months ended March 31, 2010, loans totaling $44.3 million were modified as TDRs. The amounts and loan types of TDRs modified during the three months ended March 31, 2010, consisted of $14.0 million of construction loans, $9.7 million of commercial loans, $8.8 million of commercial real estate loans, $8.8 million of residential real estate loans, $1.6 million of revolving 1-4 family loans, $1.3 million in multifamily loans, and $95,000 of consumer loans. During the three months ended March 31, 2010, loans totaling $42.1 million that had been modified as TDRs during the previous 12 months were in payment default. This consisted of $18.6 million of commercial real estate loans, $12.7 million of commercial loans, $9.1 million of construction loans, and $1.7 million of residential real estate loans.
54
Table of Contents
Pacific Capital Bancorp and Subsidiaries
NOTES TO CONSOLIDATED FINANCIAL STATEMENTS – CONTINUED
NOTE 7. GOODWILL AND INTANGIBLE ASSETS
Goodwill and intangible assets reported on the Consolidated Balance Sheets for March 31, 2011, and December 31, 2010 is comprised of the following:
| Successor Company | ||||||||
| March 31, 2011 |
December 31, 2010 |
|||||||
| (dollars in thousands) | ||||||||
| Core deposit intangible |
$ | 35,736 | $ | 37,469 | ||||
| Goodwill |
18,462 | 21,672 | ||||||
| Customer relationship intangible |
18,259 | 18,684 | ||||||
| Trade name intangible |
12,642 | 12,669 | ||||||
| Mortgage and other loan servicing rights |
2,897 | 3,065 | ||||||
| Other |
128 | 141 | ||||||
| Total |
$ | 88,124 | $ | 93,700 | ||||
Goodwill
Goodwill was recorded as a result of the Investment Transaction as disclosed in Note 2, “Business Combination—Investment Transaction” of the 2010 Form 10-K’s Consolidated Financial Statements.
Goodwill has been allocated by reporting segment as follows:
| Commercial & Community Banking |
Wealth Management |
All Other |
Total | |||||||||||||
| (dollars in thousands) | ||||||||||||||||
| Balance beginning of period, Successor Company |
$ | 19,152 | $ | 2,520 | $ | — | $ | 21,672 | ||||||||
| Adjustment to goodwill for loan valuation |
(5,323) | — | — | (5,323) | ||||||||||||
| Adjustment to goodwill for earnout liability |
— | 2,113 | — | 2,113 | ||||||||||||
| Balance end of period, Successor Company |
$ | 13,829 | $ | 4,633 | $ | — | $ | 18,462 | ||||||||
The reduction of goodwill of $5.3 million in the Commercial & Community Banking Segment in the first quarter of 2011 is from additional value assigned to loan pools as a result of recoveries received by the Company since the Investment Transaction Date through December 31, 2010. These recoveries were from commercial and commercial real estate loans which were fully charged-off and were not assigned a fair value at the Transaction Date. The increase of goodwill of $2.1 million in the Wealth Management segment in the first quarter of 2011 is from an increase in the fair value of the Morton Capital Management Earnout Agreement. At the Transaction Date, a fair value of $5.2 million was recorded as goodwill. In March 2011, the valuation was updated to a value of $7.3 million.
Intangible Assets
The Company has five types of identifiable intangible assets: core deposit intangibles, customer relationship intangibles, trade name intangibles, non-compete intangibles, and mortgage and other loan servicing rights. All intangible assets are amortized over their estimated lives. The core deposit, the customer relationship, the trade name, and the non-compete intangibles are created when a company acquires another company. The loan servicing rights are created when loans are sold but the right to service the loans is retained by the seller. Additional information regarding the Company’s intangible assets is disclosed in Note 10, “Goodwill and Intangible Assets” of the 2010 Form 10-K.
55
Table of Contents
Pacific Capital Bancorp and Subsidiaries
NOTES TO CONSOLIDATED FINANCIAL STATEMENTS – CONTINUED
NOTE 8. OREO
A summary of the OREO by loan type is as follows:
| Successor Company | ||||||||
| March 31, 2011 |
December 31, 2010 |
|||||||
| (dollars in thousands) | ||||||||
| OREO |
||||||||
| Real estate: |
||||||||
| Residential - 1 to 4 family |
$ |
11,083 |
|
$ | 12,254 | |||
| Multifamily loans |
— | 444 | ||||||
| Commercial |
9,916 | 5,816 | ||||||
| Construction |
19,146 | 21,743 | ||||||
| Revolving - 1 to 4 family |
1,419 | 282 | ||||||
| Commercial loans |
110 | 228 | ||||||
| Total OREO |
$ | 41,674 | $ | 40,767 | ||||
Below is a summary of the OREO valuation allowance activity for the three months ended March 31, 2011 and 2010.
| Successor Company |
Predecessor Company |
|||||||||||||||
| (dollars in thousands) | Three Months Ended March 31, 2011 |
Three Months Ended March 31, 2010 |
||||||||||||||
| Beginning balance |
$ | 134 | $ | 4,801 | ||||||||||||
| Additions |
1,740 | 321 | ||||||||||||||
| Sales |
(821) | (65) | ||||||||||||||
| Ending balance |
$ | 1,053 | $ | 5,057 | ||||||||||||
NOTE 9. DEFERRED TAX ASSETS AND TAX PROVISION
The Company recognizes deferred tax assets and liabilities for the future tax consequences related to differences between the financial statement carrying amounts of existing assets and liabilities and their respective tax bases, and for tax credits. The deferred tax assets, net of valuation allowance was $2.0 million at March 31, 2011, and was zero at December 31, 2010. Management evaluates the Company’s deferred tax assets for recoverability using a consistent approach which considers the relative impact of negative and positive evidence, including the Company’s historical profitability and projections of future taxable income. The Company is required to establish a valuation allowance for deferred tax assets and record a charge to income if Management determines, based on
56
Table of Contents
Pacific Capital Bancorp and Subsidiaries
NOTES TO CONSOLIDATED FINANCIAL STATEMENTS – CONTINUED
NOTE 9. DEFERRED TAX ASSETS AND TAX PROVISION - CONTINUED
available evidence at the time the determination is made, that it is more likely than not that some portion or all of the deferred tax assets will not be realized.
Estimates of the annual effective tax rate at the end of interim periods are, of necessity, based on evaluations of possible future events and transactions and may be subject to subsequent refinement or revision. Since the Company believes a reliable estimate cannot be made, the actual effective tax rate for the year to date has been used as the best estimate of the annual effective tax rate.
During the first quarter of 2011, the Company was able to release a portion of the state deferred tax valuation allowance due to a change in judgment about the realizability of the deferred tax asset based on existing California State law allowing a 50% carryback of 2013 losses to 2011, which reduced the net State tax provision to zero. For the three months ended March 31, 2011, a $472,000 tax provision expense was recognized. The tax provision is primarily attributable to a current Federal alternative minimum tax (“AMT”) payable. While AMT tax creates a credit carryforward, the Company still has a valuation allowance fully offsetting its Federal deferred tax assets resulting in a net current tax provision. There was also an adjustment to the deferred tax asset and valuation allowance as the Company was able to utilize a portion of its net operating loss (“NOL”) carryforwards to offset its current estimated Federal taxable income.
At December 31, 2010, the Company was in a cumulative pretax loss position. For purposes of establishing a deferred tax valuation allowance, this cumulative pretax loss position is considered significant, objective evidence that the Company may not be able to realize some portion of the deferred tax assets in the future. The Company’s cumulative pretax loss position was caused by the large amount of loan losses resulting from the weak housing and credit market conditions. At December 31, 2010, the Company had a tax receivable of $56.8 million for the amount estimated to be recovered through carryback of NOLs. During the first quarter of 2011, $50.1 million of the tax receivable was received.
As a result of the Investment Transaction, the Company incurred an ownership change under Section 382 of the Internal Revenue Code. The ownership change will limit the amount of certain items of the net deferred tax asset including net operating losses and credit carryforwards. The Company adopted the accounting guidance for Accounting for Uncertainty in Income Taxes on January 1, 2007. This guidance provides the accounting and disclosure for uncertainty in tax provisions and for the recognition and measurement related to the accounting for income taxes. At March 31, 2011, and at December 31, 2010, Management concluded that there were no significant uncertain tax positions requiring recognition in the Company’s Consolidated Financial Statements. As a result, the Company did not recognize any adjustment in the liability for unrecognized tax benefits that impacted the beginning retained earnings.
57
Table of Contents
Pacific Capital Bancorp and Subsidiaries
NOTES TO CONSOLIDATED FINANCIAL STATEMENTS – CONTINUED
NOTE 10. OTHER BORROWINGS
The following table summarizes other borrowings:
| Successor Company | ||||||||
| March 31, 2011 | December 31, 2010 | |||||||
| (dollars in thousands) | ||||||||
| Other short term borrowings: |
||||||||
| Amounts due to the Reserve Bank |
$ | 3,074 | $ | 5,831 | ||||
| Total short term borrowings |
3,074 | 5,831 | ||||||
| Long term borrowings: |
||||||||
| Subordinated debt issued by the Bank |
45,980 | 44,409 | ||||||
| Subordinated debt issued by the Company |
51,284 | 51,188 | ||||||
| Total long term debt |
97,264 | 95,597 | ||||||
| Total long term and other short term borrowings |
100,338 | 101,428 | ||||||
| Obligation under capital lease |
19,618 | 19,586 | ||||||
| Total other borrowings |
$ | 119,956 | $ | 121,014 | ||||
Other Short Term Borrowings
The following table summarizes additional information for other short term borrowings
| Successor Company |
Predecessor Company |
|||||||||||
| (dollars in thousands) | Three Months Ended March 31, 2011 |
Three Months Ended March 31, 2010 |
||||||||||
| Weighted average interest rate at end of period (1) |
0.00% | 0.00% | ||||||||||
| Weighted average interest rate for the period (1) |
0.00% | 0.16% | ||||||||||
| Average outstanding balance |
$ | 3,377 | $ | 12,477 | ||||||||
| Total balance at end of period |
$ | 3,074 | $ | 4,874 | ||||||||
| Maximum outstanding at any month-end |
$ | 3,330 | $ | 25,087 | ||||||||
| (1) | Included in the balances are TT&L funds from customers on behalf of the Reserve Bank. The funds received and held for TT&Ls do not incur interest expense, therefore no interest expense or rates are disclosed. |
58
Table of Contents
Pacific Capital Bancorp and Subsidiaries
NOTES TO CONSOLIDATED FINANCIAL STATEMENTS – CONTINUED
NOTE 11. COMMITMENTS AND CONTINGENCIES
Contractual Lease Obligations
The following table shows the contractual lease obligations of the Company at March 31, 2011:
| Successor Company | ||||||||||||||||||||||||
| March 31, 2011 | ||||||||||||||||||||||||
| Less than one year |
One to three years |
Three to five years |
More than five years |
Total | December 31, 2010 |
|||||||||||||||||||
| (dollars in thousands) | ||||||||||||||||||||||||
| Non-cancelable leases |
$ | 12,181 | $ | 20,127 | $ | 13,253 | $ | 52,647 | $ | 98,208 | $ | 101,150 | ||||||||||||
| Capital leases |
786 | 1,727 | 2,086 | 29,575 | 34,174 | 34,363 | ||||||||||||||||||
| Total lease obligations |
12,967 | 21,854 | 15,339 | 82,222 | 132,382 | 135,513 | ||||||||||||||||||
| Purchase accounting accretion |
(1,209) | (1,453) | (1,330) | (4,265) | (8,257) | (8,571) | ||||||||||||||||||
| Total lease expense |
$ | 11,758 | $ | 20,401 | $ | 14,009 | $ | 77,957 | $ | 124,125 | $ | 126,942 | ||||||||||||
The Company leases most of its office locations and substantially all of these office leases contain multiple multi-year renewal options and provisions for increased rents, principally for property taxes and maintenance. At March 31, 2011, the minimum commitments under non-cancelable leases for the next five years and thereafter are shown in the above table. The amounts in the table for minimum rentals are not reported net of the contractual obligations of sub-tenants. Sub-tenants leasing space from the Company under these operating leases are contractually obligated to the Company for approximately $2.1 million. Approximately 90% of these payments are due to the Company over the next three years.
Contractual Commitments for Unfunded Loans and Letter of Credits
For a summary and more information on the contractual commitments for unfunded loan commitments and letters of credit as of March 31, 2011, refer to Note 4, “Loans” of these Consolidated Financial Statements.
Legal Matters
On October 29, 2009, a shareholder derivative suit was filed by James Clem on behalf of Pacific Capital Bancorp against former Chief Executive Officer (“CEO”), George Leis, former Chief Financial Officer (“CFO”), Stephen Masterson, former Chief Credit Officer (“CCO”), David Porter, all members of the Board of Directors of the Company, and Sandler O’Neill Partners L.P., and against the Company as a nominal defendant. The lawsuit is entitled James Clem v. George S. Leis, et al. The complaint was filed in the Superior Court in Santa Barbara, Case No. CIVRS1340306, and alleged breach of fiduciary duty, waste of corporate assets and unjust enrichment by the defendants. The complaint alleged that the Company and the officer defendants made knowingly false statements of confidence regarding the adequacy of loan loss reserves taken in the first quarter of 2009, which plaintiff Clem contended were proven false when the Company announced second quarter results, which included an additional $117 million reserve.
On November 30, 2009, Marianne Monty filed a similar shareholder derivative suit against the same defendants except CCO, David Porter, who was not included. The lawsuit is entitled Marianne Monty v. George S. Leis, et al. This complaint was also filed in the Superior Court in Santa Barbara, Case No. CIVRS1340825. On January 5, 2010, the Court entered an order consolidating this case and the Clem case. The Court subsequently appointed Ms. Monty as lead plaintiff of the consolidated case. Ms. Monty filed a consolidated complaint, expanding her allegations of wrongdoing to include direct claims based on the Company’s approval of a
59
Table of Contents
Pacific Capital Bancorp and Subsidiaries
NOTES TO CONSOLIDATED FINANCIAL STATEMENTS – CONTINUED
NOTE 11. COMMITMENTS AND CONTINGENCIES - CONTINUED
proposed Investment Transaction with the Investor. Ms. Monty filed a motion for preliminary injunction, seeking to enjoin the closing of the Investment Transaction until a shareholder vote could be held. The Court denied the motion, and Ms. Monty appealed from that denial. The Investment Transaction closed on August 31, 2010. The Court of Appeal heard oral argument on Ms. Monty’s appeal on February 9, 2011, and issued its decision on March 30, 2011, affirming the trial court’s denial of the preliminary injunction. Ms. Monty filed a petition for rehearing, and the Company filed an opposition to that petition. The petition is now pending before the Court of Appeal. The Company’s demurrer to the consolidated complaint was overruled at the trial court, and the defendants filed answers to the consolidated complaint. Management believes this lawsuit does not have merit, and the likely outcome would not have a material effect on the Company’s financial position, results of operation or cash flow.
The Company is involved in various lawsuits of a routine nature that are being handled and defended in the ordinary course of the Company’s business. Expenses are being incurred in connection with defending the Company, but in the opinion of Management, based in part on consultation with legal counsel, the resolution of these lawsuits will not have a material impact on the Company’s financial position, results of operations, or cash flows.
60
Table of Contents
Pacific Capital Bancorp and Subsidiaries
NOTES TO CONSOLIDATED FINANCIAL STATEMENTS - CONTINUED
NOTE 12. EARNINGS PER SHARE
The following table presents a reconciliation of basic earnings per share and diluted earnings per share. The denominator of the diluted earnings per share ratio includes the effect of dilutive securities. The securities outstanding that are potentially dilutive are employee stock options, restricted stock and common stock warrants.
| Successor Company |
Predecessor Company |
|||||||||||||||
| (dollars and shares in thousands, except per share amounts) | Three Months Ended March 31, 2011 |
Three Months Ended March 31, 2010 |
||||||||||||||
| Net income/(loss) from continuing operations |
$ | 16,760 | $ | (87,392) | ||||||||||||
| Expense from discontinued operations, net of tax |
— | (1,231) | ||||||||||||||
| Gain on sale of discontinued operations, net of tax |
— | 8,160 | ||||||||||||||
| Income from discontinued operations, net |
— | 6,929 | ||||||||||||||
| Net income/(loss) |
16,760 | (80,463) | ||||||||||||||
| Less: Dividends and accretion on preferred stock |
— | 2,522 | ||||||||||||||
| Net income/(loss) applicable to common shareholders |
$ | 16,760 | $ | (82,985) | ||||||||||||
| Basic weighted average shares outstanding |
32,903 | 468 | ||||||||||||||
| Dilutive effect of stock options |
1 | — | ||||||||||||||
| Dilutive effect of common stock warrants |
5 | — | ||||||||||||||
| Diluted weighted average shares outstanding |
32,909 | 468 | ||||||||||||||
| Anti-dilutive common stock equivalents excluded from computation of diluted weighted average shares outstanding: |
||||||||||||||||
| Stock options |
9 | 11 | ||||||||||||||
| Common stock warrants |
— | 15 | ||||||||||||||
| Earnings/(loss) per share from continuing operations: |
||||||||||||||||
| Basic |
$ | 0.51 | $ | (186.74) | ||||||||||||
| Diluted(1) |
$ | 0.51 | $ | (186.74) | ||||||||||||
| Earnings per share from discontinued operations: |
||||||||||||||||
| Basic |
$ | — | $ | 14.81 | ||||||||||||
| Diluted(1) |
$ | — | $ | 14.81 | ||||||||||||
| Earnings/(loss) per share applicable to common shareholders: |
||||||||||||||||
| Basic |
$ | 0.51 | $ | (177.32) | ||||||||||||
| Diluted(1) |
$ | 0.51 | $ | (177.32) | ||||||||||||
| (1) | Common stock equivalents are not included in the computation of the diluted weighted average shares outstanding when they are anti-dilutive. No common stock equivalents are included in the computation of the diluted weighted average shares outstanding when there is a net loss for reporting period. |
61
Table of Contents
Pacific Capital Bancorp and Subsidiaries
NOTES TO CONSOLIDATED FINANCIAL STATEMENTS – CONTINUED
NOTE 12. EARNINGS PER SHARE - CONTINUED
The common stock warrants were issued in conjunction with the preferred stock issued to the U.S. Treasury in November 2008 and were renegotiated as part of the Investment Agreement. For more information related to the common stock warrants, refer to Note 1, “Summary of Significant Accounting Policies,” of the Consolidated Financial Statements in the 2010 Form 10-K.
For the Predecessor Company, no dilutive shares were included in the computation of diluted earnings per share because the period presented had a net loss.
NOTE 13. NONINTEREST INCOME
The table below discloses the largest items included in other noninterest income.
| Successor Company | Predecessor Company | |||||||||||||||
| (dollars in thousands) | Three Months Ended March 31, 2011 |
Three Months Ended March 31, 2010 |
||||||||||||||
| Other Income: |
||||||||||||||||
| Gain/ (loss) on OREO Sales |
$ | 2,041 | $ | (192) | ||||||||||||
| Customer fee income |
1,288 | 968 | ||||||||||||||
| Gain on loan sales |
438 | 3,955 | ||||||||||||||
| Swap market value adjustment |
— | (897) | ||||||||||||||
| OREO valuation adjustment |
(1,740) | — | ||||||||||||||
| LIHTCP losses |
(1,074) | (950) | ||||||||||||||
| Other |
830 | 796 | ||||||||||||||
| Total |
$ | 1,783 | $ | 3,680 | ||||||||||||
62
Table of Contents
Pacific Capital Bancorp and Subsidiaries
NOTES TO CONSOLIDATED FINANCIAL STATEMENTS - CONTINUED
NOTE 14. NONINTEREST EXPENSE
The table below discloses the largest items included in other noninterest expense.
| Successor Company | Predecessor Company | |||||||||||||||
| (dollars in thousands) | Three Months Ended March 31, 2011 |
Three Months Ended March 31, 2010 |
||||||||||||||
| Other Expense: |
||||||||||||||||
| Regulatory assessments |
$ | 4,487 | $ | 3,838 | ||||||||||||
| Professional services |
3,996 | 4,072 | ||||||||||||||
| Other intangible expense |
2,199 | 233 | ||||||||||||||
| Customer deposit service and support |
1,750 | 1,911 | ||||||||||||||
| Software expense |
1,518 | 3,475 | ||||||||||||||
| Furniture, fixtures and equipment, net |
1,234 | 1,287 | ||||||||||||||
| Supplies and postage |
955 | 1,115 | ||||||||||||||
| Other real estate owned expense |
812 | 1,052 | ||||||||||||||
| Telephone and data |
656 | 1,093 | ||||||||||||||
| Reserve for off balance sheet commitments |
19 | 1,813 | ||||||||||||||
| Operating lease impairment |
— | 1,301 | ||||||||||||||
| FHLB advance prepayment penalties |
— | 864 | ||||||||||||||
| Credit risk swap market value adjustment |
(327) | (863) | ||||||||||||||
| Other |
2,341 | 2,248 | ||||||||||||||
| Total |
$ | 19,640 | $ | 23,439 | ||||||||||||
NOTE 15. SEGMENTS
The segments are aligned based on how the Company’s Board of Directors has set performance goals for the CEO and his management team. The Company has two operating business segments: Commercial & Community Banking and Wealth Management. The All Other segment is not considered an operating segment, but includes all corporate administrative support departments such as human resources, legal, finance and accounting, treasury, information technology, internal audit, risk management, facilities management, marketing, executive management and the holding company. The operations and expenses reported in the All Other segment cannot specifically be allocated to the operating segments based on the services provided. The administrative departments which specifically support the operating segments have been identified and reported within the operating segment.
A summary of the operating segments products and services and customers are below:
Commercial & Community Banking
The Commercial & Community Banking reportable segment is the aggregation of customer sales and service activities typically found in a bank. This reportable segment includes all lending and deposit products of the Bank. Customers include small business and middle market companies as well as individuals in the communities which the Bank serves.
63
Table of Contents
Pacific Capital Bancorp and Subsidiaries
NOTES TO CONSOLIDATED FINANCIAL STATEMENTS – CONTINUED
NOTE 15. SEGMENTS - CONTINUED
Included in the Commercial & Community Banking segment are the associated administrative departments to support their products and activities such as loan servicing, credit administration, special assets department, research, wire room, delinquency management unit, central vault operations, retail banking administration and retail and commercial lending administration departments.
Wealth Management
The Wealth Management segment includes the trust and investment advisory services division and the two registered investment advisors, MCM and REWA which are subsidiaries of the Bank. The Wealth Management segment provides investment reviews, analysis and customized portfolio management for separately managed accounts, full service brokerage, trust and fiduciary services, equity and fixed income management and real estate and specialty asset management.
All Other
This segment consists of administrative support areas of the Company and the Bancorp and does not consider “All Other” an operating segment of the Company. The income generated by the All Other segment is from PCBNA’s securities portfolio which is managed by the treasury department and allocated to the operating segments as part of the allocation process in preparing segment balance sheets.
Indirect Credit/(Charge) for Funds
Included in “Indirect credit/(charge) for funds” is an allocation of net interest income between segments with the All Other segment being used for the funding center. The indirect credit/(charge) for funds is calculated by analyzing average earning assets and average interest bearing liabilities plus average noninterest bearing deposits and equity. If a segment’s average earning assets are greater, the net average assets are multiplied by the net cost of funds to calculate the indirect charge for funds as the segment does not have enough liabilities to fund the assets of the segment. If a segment has more interest bearing liabilities than assets, then the net average interest bearing liabilities are multiplied by the net cost of funds and the segment receives an indirect credit for funds.
The Company has no operations in foreign countries to require disclosure by geographical area. The Company has no single customer generating 10% or more of total revenues.
64
Table of Contents
Pacific Capital Bancorp and Subsidiaries
NOTES TO CONSOLIDATED FINANCIAL STATEMENTS – CONTINUED
NOTE 15. SEGMENTS - CONTINUED
The following tables present information for each specific operating segment regarding assets, profit or loss, and specific items of revenue and expense that are included in the measure of segment profit or loss. Included in the table is an “All Other” segment which includes the administrative support units, holding company, and balancing of the funding uses and sources activity that are not allocated to the two operating segments.
| Successor Company | ||||||||||||||||
| Three Months Ended March 31, 2011 | ||||||||||||||||
| Operating Segments | ||||||||||||||||
| Commercial & Community Banking |
Wealth Management |
All Other | Total | |||||||||||||
| (dollars in thousands) | ||||||||||||||||
| Interest income |
$ | 59,765 | $ | — | $ | 6,716 | $ | 66,481 | ||||||||
| Interest expense |
6,300 | (126) | 6,010 | 12,184 | ||||||||||||
| Net interest income |
53,465 | 126 | 706 | 54,297 | ||||||||||||
| Provision for loan losses |
1,667 | — | — | 1,667 | ||||||||||||
| Noninterest income |
8,025 | 5,466 | (626) | 12,865 | ||||||||||||
| Noninterest expense |
42,041 | 5,169 | 1,053 | 48,263 | ||||||||||||
| Direct income/(loss) before tax |
17,782 | 423 | (973) | 17,232 | ||||||||||||
| Indirect credit/(charge) for funds |
7,983 | 43 | (8,026) | — | ||||||||||||
| Net income/(loss) from continuing operations before tax |
$ | 25,765 | $ | 466 | $ | (8,999) | $ | 17,232 | ||||||||
| Total assets |
$ | 3,988,814 | $ | 42,939 | $ | 1,911,443 | $ | 5,943,196 | ||||||||
| Predecessor Company | ||||||||||||||||
| Three Months Ended March 31, 2010 | ||||||||||||||||
| Operating Segments | ||||||||||||||||
| Commercial & Community Banking |
Wealth Management |
All Other | Total | |||||||||||||
| (dollars in thousands) | ||||||||||||||||
| Interest income |
$ | 65,848 | $ | — | $ | 9,470 | $ | 75,318 | ||||||||
| Interest expense |
14,536 | 118 | 16,160 | 30,814 | ||||||||||||
| Net interest income/(loss) |
51,312 | (118) | (6,690) | 44,504 | ||||||||||||
| Provision for loan losses |
99,865 | — | — | 99,865 | ||||||||||||
| Noninterest income |
9,394 | 5,437 | 4,507 | 19,338 | ||||||||||||
| Noninterest expense |
22,244 | 3,155 | 25,921 | 51,320 | ||||||||||||
| Direct (loss)/income before tax |
(61,403) | 2,164 | (28,104) | (87,343) | ||||||||||||
| Indirect (charge)/credit for funds |
(2,888) | 14 | 2,874 | — | ||||||||||||
| Net (loss)/income from continuing operations before tax |
$ | (64,291) | $ | 2,178 | $ | (25,230) | $ | (87,343) | ||||||||
| Total assets |
$ | 4,771,909 | $ | 18,488 | $ | 2,578,722 | $ | 7,369,119 | ||||||||
65
Table of Contents
Pacific Capital Bancorp and Subsidiaries
NOTES TO CONSOLIDATED FINANCIAL STATEMENTS – CONTINUED
NOTE 16. REGULATORY MATTERS
On September 2, 2010, the OCC issued a Modification of Existing Consent Order, pursuant to which the OCC terminated Article III of the Consent Order issued by the OCC on May 11, 2010. Article III of the Consent Order had required, among other things, that the Bank achieve and maintain total capital at least equal to 12% of risk-weighted assets and Tier 1 capital at least equal to 9% of adjusted total assets by September 8, 2010. Also on September 2, 2010, the Bank entered into the Operating Agreement with the OCC, pursuant to which, among other things, the Bank agreed to maintain total capital at least equal to 12% of risk-weighted assets and Tier 1 capital at least equal to 8% of adjusted total assets and to not pay any dividend or reduce its capital without the prior non-objection of the OCC and unless at least three years shall have elapsed since the effective date of the Operating Agreement. The Bank was in compliance with these minimum capital ratios at March 31, 2011, and December 31, 2010, with a total risk-based capital ratio of 15.5% and 14.7%, respectively and a Tier 1 leverage ratio of 9.9% and 9.2%, respectively.
The Bank is also subject to the Consent Order issued by the OCC, pursuant to which, among other things, the Bank agreed to:
| n | establish a compliance committee to monitor and coordinate compliance with the Consent Order; |
| n | develop and implement a three-year strategic plan for the Bank, which shall, among other things, establish objectives for the Bank’s overall risk profile, earnings performance, growth, balance sheet mix, off-balance sheet activities, liability structure, capital adequacy, reduction in the volume of nonperforming assets, product line development, and market segments that the Bank intends to promote or develop, together with strategies to achieve those objectives; |
| n | ensure that the Bank has competent management in place on a full-time basis in all executive officer positions to carry out the Bank’s policies, ensure compliance with the Consent Order, ensure compliance with applicable laws, rules and regulations, and manage the day to day operations of the Bank in a safe and sound manner; |
| n | develop and implement a written credit policy and a commercial real estate concentration management program; |
| n | obtain current and complete credit information and collateral documentation on all loans lacking such information and documentation, and to maintain a list of any credit exceptions and collateral exceptions that have not been corrected within 60 days; |
| n | develop and implement a written consumer mortgage credit risk program, a retail mortgage loan collections program, a retail mortgage loan loss recognition program, a commercial credit risk ratings program, and an independent loan review program; |
| n | develop and implement a program to determine whether a loan is impaired and for measuring the amount of the impairment to ensure that the Bank maintains an adequate Allowance for Loan and Lease Losses, consistent with Financial Accounting Standards 114; |
| n | implement a program for the maintenance of an adequate Allowance for Loan and Lease Losses; |
66
Table of Contents
Pacific Capital Bancorp and Subsidiaries
NOTES TO CONSOLIDATED FINANCIAL STATEMENTS – CONTINUED
NOTE 16. REGULATORY MATTERS - CONTINUED
| n | develop and implement a program to protect the Bank’s interest in those assets criticized in the more recent and any subsequent Report of Examinations, by any internal or external loan review, or in any list provided to management by the National Bank Examiners during any examination as “doubtful,” “substandard,” or “special mention;” |
| n | adopt and implement an action plan to manage each parcel of Other Real Estate Owned; and |
| n | take action to maintain adequate sources of stable funding and to review the Bank’s liquidity on a monthly basis. |
On May 11, 2010, the Company entered into the Written Agreement with the Reserve Bank. The Written Agreement restricts the payment of dividends by the Company, as well as the taking of dividends or any other payment representing a reduction in capital from the Bank, without the prior approval of the Reserve Bank. The Written Agreement further requires that the Company not incur, increase, or guarantee any debt, repurchase or redeem any shares of its stock, or pay any interest or principal on subordinated debt or trust preferred securities, in each case without the prior approval of the Reserve Bank. The Written Agreement also requires the Company to develop a capital plan for the Company, which shall address, among other things, the Company’s current and future capital requirements, including compliance with the minimum capital ratios, the adequacy of the capital, the source and timing of additional funds, and procedures to notify the Reserve Bank no more than thirty days after the end of any quarter in which the Company’s consolidated capital ratios or the Bank’s capital ratios fall below the required minimums. The Company will also be required to provide notice to the Reserve Bank regarding the appointment of any new director or senior executive officer. Finally, the Board of Directors of the Company is required to submit written progress reports to the Reserve Bank within thirty days after the end of each calendar quarter.
Any material failure to comply with the provisions of the Written Agreement, Consent Order or Operating Agreement could result in additional enforcement actions by the Reserve Bank and the OCC. While the Company and the Bank intend to take such actions as may be necessary to comply with the requirements of the Written Agreement, Consent Order and Operating Agreement, there can be no assurance that the Company will be able to comply fully with the provisions of the Written Agreement or that the Bank will be able to comply fully with the provisions of the Consent Order and Operating Agreement, that compliance with the Written Agreement, Consent Order and Operating Agreement will not be more time consuming or more expensive than anticipated, that compliance with the Written Agreement, Consent Order and Operating Agreement will enable the Company and the Bank to resume profitable operations, or that efforts to comply with the Written Agreement, Consent Order and Operating Agreement will not have adverse effects on the operations and financial condition of the Company or the Bank.
NOTE 17. SUBSEQUENT EVENTS
We have evaluated the effects of events that have occurred subsequent to period end March 31, 2011, and there have been no material events that would require recognition in the March 31, 2011 Consolidated Financial Statements.
67
Table of Contents
| ITEM 2. | MANAGEMENT’S DISCUSSION AND ANALYSIS OF FINANCIAL CONDITION AND RESULTS OF OPERATIONS |
Pacific Capital Bancorp (the “Company or “PCBC”) provides a wide range of banking, investment and trust services to its clients primarily through its wholly-owned subsidiary, Pacific Capital Bank, N.A. (the “Bank”) and its subsidiaries. For over 50 years, the Bank has served clients through relationship banking. The Bank combines the breadth of financial products typically associated with a larger financial institution with the type of individual client service that is found in a community bank. The Bank provides full service banking, including all aspects of checking and savings, private and commercial lending, investment advisory services, trust, and other banking products and services. Products and services are offered through retail branch offices, commercial and wealth management centers and other distribution channels to consumers and businesses operating throughout the Central Coast of California, in eight contiguous counties including Santa Barbara, Ventura, Monterey, Santa Cruz, Santa Clara, San Benito, San Luis Obispo and Los Angeles. The Company is headquartered in Santa Barbara, California.
The following discussion and analysis should be read in conjunction with the Company’s 2010 Form 10-K and the Consolidated Financial Statements and notes to the Consolidated Financial Statements in this Form 10-Q, herein referred to as “the Consolidated Financial Statements” included and incorporated by reference herein. “Bancorp” will be used in this discussion when referring only to the holding company as distinct from the consolidated company and “the Bank” will be used when referring to Pacific Capital Bank, N.A.
As a result of the adjustments required by purchase accounting at the Transaction Date in 2010, the Company’s balance sheets and results of operations from periods prior to the Transaction Date are labeled as “Predecessor Company” and may not be comparable to balances and results of operations from periods subsequent to the Transaction Date, which are labeled as “Successor Company.” The lack of comparability arises from the assets and liabilities having new accounting bases as a result of recording them at their fair values as of the Transaction Date rather than at their historical cost basis recorded in the predecessor period. As a result of the change in accounting bases, items of income and expense such as the rate of interest income and expense as well as depreciation, amortization, and rental expense have also changed. In general, these changes in income and expense relate to the amortization of premiums or accretion of discounts to arrive at contractual amounts due. To call attention to this lack of comparability and as required by the accounting and reporting guidance, the Company has placed a heavy black line between the Successor Company and Predecessor Company columns in the Consolidated Financial Statements and in the tables in the notes to the statements and in this discussion. The Successor Company period started on the Transaction Date or September 1, 2010 and includes the Company’s financial information and activity on and after September 1, 2010. The Predecessor Company is all of the Company’s financial information and activity up until the Transaction Date or August 31, 2010 and previous periods.
FINANCIAL HIGHLIGHTS
Successor Company
Net income applicable to common shareholders for the three months ended March 31, 2011 was $16.8 million, or $0.51 per diluted share. The significant factors impacting the Company’s net income applicable to common shareholders for the three months ended March 31, 2011 were:
| n | Improved net interest margins to 3.99% for the first quarter of 2011 compared with 3.76% for the fourth quarter of 2010 and; |
| n | Grew regulatory capital ratios to 11.1% and 17.3% for Tier 1 Leverage and Total Risk-Based Capital ratios, respectively. |
68
Table of Contents
Predecessor Company
Net loss applicable to common shareholders for the three months ended March 31, 2010 was $83.0 million or $177.32 per diluted share. The net loss from continuing operations for the three months ended March 31, 2010 was $87.4 million or $186.74 per diluted share. For the three months ended March 31, 2010, the differences between the net loss applicable to common shareholders and the net loss from continuing operations is attributable to the operating results from the discontinued operations and the accrual of dividends on outstanding shares of preferred stock
The significant factors impacting the Company’s net loss applicable to common shareholders for the three months ended March 31, 2010 were:
| n | Provision for loan losses was $99.9 million for the period as the Company’s loan portfolio continued to experience credit problems; |
| n | The Company’s decision to maintain excess cash to mitigate uncertainty to depositors generated a significant amount of negative interest spread related to the difference between interest earned on cash balances and interest paid on borrowings; |
| n | The Company sold securities realizing a gain of $4.5 million; and |
| n | The Company sold its RAL and RT Programs in January 2010 for a net gain of $8.2 million. Due to the sale, the Company was required to report the RAL and RT programs as discontinued operations. |
The impact to the Company from these items will be discussed in more detail throughout the analysis sections of the Management’s Discussion and Analysis (“MD&A”) section of this Form 10-Q.
69
Table of Contents
RESULTS OF OPERATIONS
INTEREST INCOME
The Company’s primary source of revenues is interest income. In discussing interest income for the various periods presented, the comments below about interest income from loans all pertain to the Commercial & Community Banking Segment, while comments below about interest income from securities or from deposits with other banks all pertain to the Bank’s Treasury Department activities and are included in the All Other segment. The Wealth Management segment does not earn interest income.
The following table presents a summary of interest income for the three months ended March 31, 2011 and March 31, 2010.
| Successor Company |
Predecessor Company |
|||||||||||
| (dollars in thousands) | Three Months Ended March 31, 2011 |
Three Months Ended March 31, 2010 |
||||||||||
| Loans: |
||||||||||||
| Commercial loans |
$ | 7,703 | $ | 10,243 | ||||||||
| Real estate loans - commercial |
33,739 | 35,046 | ||||||||||
| Real estate loans - residential |
16,480 | 17,976 | ||||||||||
| Consumer loans |
1,841 | 2,583 | ||||||||||
| Total |
59,763 | 65,848 | ||||||||||
| Trading assets |
— | 64 | ||||||||||
| Investment securities available for sale: |
||||||||||||
| U.S. Treasury securities |
— | 82 | ||||||||||
| U.S. Agencies |
415 | 2,677 | ||||||||||
| Asset backed securities |
61 | 34 | ||||||||||
| CMO’s and MBS |
3,460 | 2,532 | ||||||||||
| State and municipal securities |
2,160 | 3,001 | ||||||||||
| Total |
6,096 | 8,326 | ||||||||||
| Other: |
||||||||||||
| Interest and dividends on deposits in other financial institutions |
270 | 841 | ||||||||||
| FHLB and other investments |
352 | 239 | ||||||||||
| Total |
622 | 1,080 | ||||||||||
| Total interest income |
$ | 66,481 | $ | 75,318 | ||||||||
Successor Company
Interest income for the three months ended March 31, 2011 was $66.5 million. Interest income from loans was positively impacted by the application of purchase accounting adjustments, while interest income from securities was negatively impacted. The accounting for interest income for loans and securities is explained in detail in Note 1, “Summary of Significant Accounting Policies” of the Consolidated Financial Statements.
The purchase accounting adjustment that occurred in March 2011, related to individual fully charged-off commercial loans, which had no initial fair value at the Transaction Date and had significant recoveries during the four months ended December 31, 2010.
70
Table of Contents
During the three month period ended March 31, 2011, $4.2 million of recoveries were recognized in interest income. The loan portfolio also continues to be positively impacted from the purchase accounting requirement to report loans at a discount that is accreted into income over the term of the loans. At the same time, the loan portfolio has experienced a large amount of prepayments which has reduced the loan balance and related interest income. The purchase of loans at the end of March 2011, and new loan originations should result in an increase in interest income over the next several quarters.
In contrast, interest income from securities was negatively impacted by purchase accounting adjustments in the first quarter of 2011. As a result of lower interest rates at the Transaction Date versus the original purchase date of the securities, the fair values of securities were higher than the carrying values at the Transaction Date. In this situation, purchase accounting requires the recording of a premium that is amortized and reduces interest income over the terms of the various securities.
Predecessor Company
Interest income from loans was reduced by loan sales, increased nonaccrual loans, and charge-offs. The Company also restricted lending activity up until the Transaction Date to maintain the Company’s capital ratios which resulted in a decline in loan balances as maturing loans were not matched by originations. Interest income from trading and AFS securities decreased as a result of sales, calls and maturities of securities. In addition, the interest rate for some of the adjustable rate securities was reduced due to the decrease in long term interest rates.
INTEREST EXPENSE
The Company incurs interest expense from interest payments made to depositors and for other borrowings. Interest expense from deposits all pertain to the Commercial & Community Banking operating segment, while interest expense from borrowings or debt almost all pertain to the Treasury department’s activities and therefore are included in the All Other segment. Wealth Management incurs interest expense only for the capital lease on the building occupied by the Trust Department. For more information regarding leases, refer to the section titled “Leases” in Note 1, “Summary of Significant Accounting Policies” of the Consolidated Financial Statements for an explanation of the accounting for a capital lease.
71
Table of Contents
The following tables present a summary of interest expense within the interest expense line items for the three months ended March 31, 2011 and 2010:
| Successor Company |
Predecessor Company |
|||||||||||||||
| (dollars in thousands) | Three Months Ended March 31, 2011 |
Three Months Ended March 31, 2010 |
||||||||||||||
| Deposits: |
||||||||||||||||
| NOW accounts |
$ | 406 | $ | 732 | ||||||||||||
| Money market deposit accounts |
378 | 603 | ||||||||||||||
| Savings deposits |
430 | 538 | ||||||||||||||
| Time certificates of deposit |
5,892 | 15,921 | ||||||||||||||
| Total |
7,106 | 17,794 | ||||||||||||||
| Securities sold under agreements to repurchase |
2,102 | 2,006 | ||||||||||||||
| Long term debt and other borrowings: |
||||||||||||||||
| Long term debt |
2,828 | 10,747 | ||||||||||||||
| Other borrowings |
148 | 267 | ||||||||||||||
| Total |
2,976 | 11,014 | ||||||||||||||
| Total interest expense |
$ | 12,184 | $ | 30,814 | ||||||||||||
Successor Company
Interest expense for the three months ended March 31, 2011, was $12.2 million. Each of the categories of interest expense was significantly impacted by the application of purchase accounting adjustments. At the Transaction Date, market interest rates had declined from what they were when a large proportion of the Company’s fixed rate time certificate of deposits (“CDs”) and repurchase agreements were issued. This decline of interest rates caused the fair value of these liabilities to decrease and premiums were recognized for these liabilities to report them at their fair value. These premiums are accreted over the terms of the related liabilities, reducing interest expense. The weighted average duration for CDs was adjusted effective January 1, 2011, prospectively. The change in the weighted average duration extended the time frame for which the premium will be accreted.
Interest expense for long term debt was impacted during the three months ended March 31, 2011, as a result of $802.4 million of the $823.4 million of the FHLB advances held by the Predecessor Company being prepaid in September 2010. The Investment Transaction provided excess liquidity and this was used to reduce debt. The Company also retired $68 million of its subordinated debt at the Transaction Date further decreasing interest expense. The remaining subordinated debt and the Company’s trust preferred securities had a fair value less than their face values resulting in accretable discounts, which increased interest expense above the amount paid to creditors. The securities sold under agreements to repurchase had a fair value in excess of their principal amount and a premium was recognized for them; the amortization of which reduced interest expense to less than the amount paid to creditors.
Predecessor Company
Interest expense for the three months ended March 31, 2010, was impacted by declining rates paid on CDs, as maturing higher rate instruments were replaced with lower cost balances, as well as lower average balances of long term debt and other borrowings.
72
Table of Contents
NET INTEREST MARGIN
An important measure of a financial institution’s earning capacity is its net interest margin. This measure is computed by dividing the difference between interest income and interest expense, or net interest income, by average earning assets. As a financial intermediary, a bank earns money by borrowing from depositors and debt-holders and lending some of those funds to loan customers and by purchasing investments. By combining the average interest rate earned on assets with the average interest cost to hold those assets, the net interest margin measures both the institution’s ability to earn its desired rates on its assets and its efficiency in obtaining the funding that supports those assets. The net interest margin differs from the net interest spread which is the difference between the average rate earned and the average rate paid because a portion of the earning assets are funded by noninterest bearing liabilities.
The net interest margin is improved by higher rates earned on assets, lower rates paid on liabilities, funding a larger proportion of earning assets with noninterest bearing liabilities, and by lowering the amount of nonearning assets that must be funded. Interest rates earned on assets and paid on liabilities tend to move in tandem with each other as the market interest rate environment changes, but it is generally harder to improve the net interest margin in a low interest rate environment because there is a rate beyond which deposit rates cannot be decreased and still retain customers while asset rates may continue to fall. Conversely, as market interest rates rise, deposit rates will generally not rise as fast or as much and the net interest margin may thereby be improved.
73
Table of Contents
The following tables set forth the average balances and interest income and interest expense for the three months ended March 31, 2011, and 2010.
| Successor Company | Predecessor Company | |||||||||||||||||||||||
| For the Three Months Ended March 31, 2011 |
For the Three Months Ended March 31, 2010 |
|||||||||||||||||||||||
| (dollars in thousands) | Average Balance |
Income | Rate | Average Balance |
Income | Rate | ||||||||||||||||||
| Assets |
||||||||||||||||||||||||
| Interest bearing demand deposits in other financial institutions |
$ | 462,552 | $ | 270 | 0.24% | $ | 728,386 | $ | 841 | 0.47% | ||||||||||||||
| Securities: |
||||||||||||||||||||||||
| Trading assets |
— | — | — | 5,322 | 64 | 4.88% | ||||||||||||||||||
| Investment securities available for sale: |
||||||||||||||||||||||||
| Taxable |
1,057,366 | 3,936 | 1.51% | 836,815 | 5,325 | 2.58% | ||||||||||||||||||
| Non taxable |
202,109 | 2,160 | 4.27% | 247,375 | 3,001 | 4.85% | ||||||||||||||||||
| Total securities |
1,259,475 | 6,096 | 1.95% | 1,089,512 | 8,390 | 3.11% | ||||||||||||||||||
| Loans: (1) |
||||||||||||||||||||||||
| Commercial |
272,362 | 7,703 | 11.47% | 948,212 | 10,243 | 4.38% | ||||||||||||||||||
| Real estate - commercial (2) |
2,198,858 | 33,739 | 6.14% | 2,581,446 | 35,046 | 5.43% | ||||||||||||||||||
| Real estate - residential 1 to 4 family |
1,175,960 | 16,480 | 5.61% | 1,406,030 | 17,976 | 5.11% | ||||||||||||||||||
| Consumer loans |
59,254 | 1,841 | 12.60% | 158,870 | 2,583 | 6.59% | ||||||||||||||||||
| Total loans, gross |
3,706,434 | 59,763 | 6.47% | 5,094,558 | 65,848 | 5.18% | ||||||||||||||||||
| Other interest earning assets |
84,033 | 352 | 1.70% | 84,775 | 239 | 1.14% | ||||||||||||||||||
| Total interest earning assets |
5,512,494 | 66,481 | 4.84% | 6,997,231 | 75,318 | 4.32% | ||||||||||||||||||
| Noninterest earning assets |
466,885 | 329,574 | ||||||||||||||||||||||
| Total assets from discontinued operations |
— | 399,327 | ||||||||||||||||||||||
| Total assets |
$ | 5,979,379 | $ | 7,726,132 | ||||||||||||||||||||
| Liabilities and shareholders’ equity |
||||||||||||||||||||||||
| Interest bearing deposits: |
||||||||||||||||||||||||
| Savings and interest bearing transaction accounts |
$ | 1,700,883 | 1,214 | 0.29% | $ | 1,583,375 | 1,873 | 0.48% | ||||||||||||||||
| Time certificates of deposit |
2,029,495 | 5,892 | 1.18% | 2,762,011 | 15,921 | 2.34% | ||||||||||||||||||
| Total interest bearing deposits |
3,730,378 | 7,106 | 0.77% | 4,345,386 | 17,794 | 1.66% | ||||||||||||||||||
| Borrowed funds: |
||||||||||||||||||||||||
| Securities sold under agreements to repurchase |
321,573 | 2,102 | 2.65% | 313,951 | 2,006 | 2.59% | ||||||||||||||||||
| Other borrowings |
115,372 | 2,976 | 10.46% | 1,165,832 | 11,014 | 3.83% | ||||||||||||||||||
| Total borrowed funds |
436,945 | 5,078 | 4.71% | 1,479,783 | 13,020 | 3.57% | ||||||||||||||||||
| Total interest bearing liabilities |
4,167,323 | 12,184 | 1.18% | 5,825,169 | 30,814 | 2.15% | ||||||||||||||||||
| Noninterest bearing demand deposits |
1,063,080 | 1,033,618 | ||||||||||||||||||||||
| Other noninterest bearing liabilities |
94,468 | 102,430 | ||||||||||||||||||||||
| Total liabilities from discontinued operations |
— | 399,327 | ||||||||||||||||||||||
| Shareholders’ equity |
654,508 | 365,588 | ||||||||||||||||||||||
| Total liabilities and shareholders’ equity |
$ | 5,979,379 | $ | 7,726,132 | ||||||||||||||||||||
| Net interest spread |
3.66% | 2.17% | ||||||||||||||||||||||
| Net interest income/margin |
$ | 54,297 | 3.99% | $ | 44,504 | 2.58% | ||||||||||||||||||
| (1) | Nonaccrual loans are included in loan balances. Interest income includes related net deferred fee income. |
| (2) | Commercial real estate loans include multifamily residential real estate loans. |
74
Table of Contents
Successor Company
The net interest margin has increased since the Transaction Date to 3.99% for the three month period ended March 31, 2011, and was driven by several factors. Interest income from loans was positively impacted by better than expected cash flows from certain PCI loans. Interest income from investment securities was adversely impacted by the purchase accounting as premiums reduced the interest income, as described in the Interest Income section, above.
Interest bearing liabilities continue to decrease in both average balance and rates, as high interest rate time deposits continue to mature and are replaced with lower rate time deposits at a lower volume. The interest rate for other borrowings is at a higher level due to the discount on the remaining subordinated debt and trust preferred securities from the purchase accounting.
Rate and volume variance analyses allocate the change in interest income and expense between the portion which is due to changes in the rate earned or paid for specific categories of assets and liabilities and the portion which is due to changes in the average balance between the two periods. The Company is unable to provide a rate and volume variance between March 31, 2011, and March 31, 2010, because of the purchase accounting adjustments explained on page 13 of this Form 10-Q.
Predecessor Company
The net interest margin of 2.58% for the three month period ended March 31, 2010, was adversely impacted by the large amount of nonperforming loans as such loans no longer accrue interest while the outstanding loans remain a component of loan average balances. The increased cash held by the Company also adversely impacted the net interest margin as the Company retained additional cash to mitigate the uncertainty of depositor activity and to maintain liquidity to meet the needs of the Company, as the Company continued to report net losses up until the Transaction Date.
PROVISION FOR LOAN LOSSES
Quarterly, the Company determines the amount of ALLL that is adequate to provide for losses inherent in the Company’s loan portfolios. The provision for loan losses is determined by the net change in the ALLL from one period to another. For a detailed discussion of the Company’s ALLL, refer to the “Allowance for Loan and Lease Losses” section on page 19 of this Form 10-Q within Note 1, “Summary of Significant Accounting Policies”, Note 6, “Allowance for Loan and Lease Losses” on page 47 and the “Allowance for Loan and Lease Losses” section of 2010 Form 10-K, starting on page 127. Information pertaining to provision for loan losses relates to the Commercial and Community Banking operating segment.
Successor Company
Provision for loan losses for the three months ended March 31, 2011, was $1.7 million. As a result of the Investment Transaction and the application of the accounting guidance for business combinations, the ALLL for the credit impaired loans that were purchased was eliminated and the purchased credit impaired loans were recorded at their fair value at the Transaction Date as described in Note 1, “Summary of Significant Accounting Policies” of these Consolidated Financial Statements. Consequently, no allowance for loan loss is provided for PCI Loan Pools as of the Transaction Date. The $1.7 million of provision for loans losses for the three month period ended March 31, 2011, pertains to the Company’s estimate of changes in the credit quality of originated and purchased loans after the Transaction Date with a carrying balance of $236.4 million, inclusive of $188.4 million of loans purchased during the quarter.
For the loans purchased in March 2011, a separate methodology was used to calculate the ALLL, as described in Note 6, “Allowance for Loan and Lease Losses”. Based on this methodology, a $1.0 million provision for loan losses was recorded.
75
Table of Contents
The Company periodically evaluates actual cash flows to expected cash flows for PCI Term Loan Pools. To the extent that actual cash flows are lower than expected cash flows, the Company will establish an allowance for PCI Term Pools through a provision for loan losses. If actual cash flows are significantly higher than expected cash flows, the Company will reverse any allowance established for PCI Term Loan Pools with any remaining cash flows recorded to interest income through an increase in the accretable yield.
For PCI Revolving Pools, the Company will periodically evaluate credit performance to determine if there has been a further deterioration in such performance. To the extent that the credit performance is worse than expected, the Company will establish an allowance for PCI Revolving Pools through a provision for loan losses. If credit performance is significantly better than expected, the Company will begin to accrete the purchase discount for PCI Revolving Pools into interest income.
Predecessor Company
Provision for loan losses for the three months ended March 31, 2010 was $99.9 million. This provision is reflective of the increased level of net charge-offs and nonaccrual loans experienced during the quarter, as economic conditions were particularly adverse in the state of California.
NONINTEREST INCOME
Noninterest income primarily consists of fee income received from the operations of the Bank and gains or losses from sales of assets. Fee income is generated by servicing deposit relationships, trust and investment advisory fees, and fees and commissions earned on certain transactions from Bank operations.
The following table presents a summary of noninterest income for the periods presented.
| Successor Company |
Predecessor Company |
|||||||||||
| (dollars in thousands) | Three Months Ended March 31, 2011 |
Three Months Ended March 31, 2010 |
||||||||||
| Service charges and fees |
$ | 5,751 | $ | 5,739 | ||||||||
| Trust and investment advisory fees |
5,335 | 5,408 | ||||||||||
| (Loss)/ gain on securities, net |
(4) | 4,511 | ||||||||||
| Other |
1,783 | 3,680 | ||||||||||
| Total |
$ | 12,865 | $ | 19,338 | ||||||||
Successor Company
With the exception of gain or loss on securities, there was little or no effect on the components of noninterest income resulting from purchase accounting for the Investment Transaction. A significant portion of the service charges and fees is generated from service charges on deposit accounts and trust and investment advisory fees. These service charges and fees relate to the Commercial & Community Banking segment. For the three month period ended March 31, 2011, service charges on deposits were $3.3 million. Other service charges and fees include charges for a wide range of services provided to customers such as Automated Teller Machines (“ATMs”), safe deposit boxes, bank card fees, and wire transfer fees. These fees have remained relatively steady during the reported periods. Trust and investment advisory fees are generated from the Wealth Management segment, primarily from the management of customer’s assets. As the value and balance of managed assets increase, the fees will increase accordingly.
76
Table of Contents
Predecessor Company
For the three months ended March 31, 2010, the Company recognized a net gain on securities of $4.5 million. This amount resulted from the sale of $48.6 million of MBS and municipal securities from the AFS portfolio during the first quarter of 2010.
The table below discloses the largest items included in other noninterest income for the periods presented.
| Successor Company |
Predecessor Company |
|||||||||||
| (dollars in thousands) | Three Months Ended March 31, 2011 |
Three Months Ended March 31, 2010 |
||||||||||
| Gain/ (loss) on OREO Sales |
$ | 2,041 | $ | (192) | ||||||||
| Customer fee income |
1,288 | 968 | ||||||||||
| Gain on loan sales |
438 | 3,955 | ||||||||||
| Swap market value adjustment |
— | (897) | ||||||||||
| OREO valuation adjustment |
(1,740) | — | ||||||||||
| LIHTCP losses |
(1,074) | (950) | ||||||||||
| Other |
830 | 796 | ||||||||||
| Total |
$ | 1,783 | $ | 3,680 | ||||||||
NONINTEREST EXPENSE
The following table presents a summary of noninterest expense for the periods presented.
| Successor Company |
Predecessor Company |
|||||||||||
| (dollars in thousands) | Three Months Ended March 31, 2011 |
Three Months Ended March 31, 2010 |
||||||||||
| Salaries and employee benefits |
$ | 22,947 | $ | 22,078 | ||||||||
| Occupancy expense, net |
5,676 | 5,803 | ||||||||||
| Other |
19,640 | 23,439 | ||||||||||
| Total |
$ | 48,263 | $ | 51,320 | ||||||||
Successor Company
Salaries and benefits were not impacted by the purchase accounting adjustments from the Investment Transaction. The Company expects that salaries and benefits will increase in future periods as it hires staff to support the expected growth in operations in 2011.
Net occupancy expense for the three months ended March 31, 2011, was impacted by purchase accounting as lease expense decreased and depreciation expense on owned buildings increased. The Company is contractually required to pay for leased premises at a higher than current market rate as these leases were entered into during a stronger economic period with higher demand for commercial space. The revaluation of the leases resulted in the recognition of a liability for unfavorable lease payments. This amount is amortized as a reduction of lease expense over the lives of the contractual lease terms. The fair value of the Company’s owned properties was higher than the amortized cost as of the Transaction Date due to the buildings being acquired years ago when commercial properties had lower property values.
77
Table of Contents
Other expense
The table below summarizes the significant items included in other expense.
| Successor Company |
Predecessor Company |
|||||||||||||||
| (dollars in thousands) | Three Months Ended March 31, 2011 |
Three Months Ended March 31, 2010 |
||||||||||||||
| Regulatory assessments |
$ | 4,487 | $ | 3,838 | ||||||||||||
| Professional services |
3,996 | 4,072 | ||||||||||||||
| Other intangible expense |
2,199 | 233 | ||||||||||||||
| Customer deposit service and support |
1,750 | 1,911 | ||||||||||||||
| Software expense |
1,518 | 3,475 | ||||||||||||||
| Furniture, fixtures and equipment, net |
1,234 | 1,287 | ||||||||||||||
| Supplies and postage |
955 | 1,115 | ||||||||||||||
| Other real estate owned expense |
812 | 1,052 | ||||||||||||||
| Telephone and data |
656 | 1,093 | ||||||||||||||
| Reserve for off balance sheet commitments |
19 | 1,813 | ||||||||||||||
| Operating lease impairment |
— | 1,301 | ||||||||||||||
| FHLB advance prepayment penalties |
— | 864 | ||||||||||||||
| Credit risk swap market value adjustment |
(327) | (863) | ||||||||||||||
| Other |
2,341 | 2,248 | ||||||||||||||
| Total |
$ | 19,640 | $ | 23,439 | ||||||||||||
PROVISION FOR INCOME TAXES
Successor Company
For the three months ended March 31, 2011, the income tax expense was $472,000. For additional information related to the Company’s provision for income taxes, refer to Note 9, “Deferred Tax Asset and Tax Provision” of the Consolidated Financial Statements.
BALANCE SHEET ANALYSIS
CASH AND CASH EQUIVALENTS
Successor Company
The Company’s cash and cash equivalents was $333.5 million at March 31, 2011 compared to $495.9 million at December 31, 2010, a decrease of $162.3 million. The decrease in cash and cash equivalents is attributable to the purchase of $178.9 million of loans ($188.4 million in loans purchased at a discount of $9.4 million) and the purchase of $96.5 million of investment securities offset by a payment from the IRS of $50.1 million for a tax receivable related to the refiling of tax returns as disclosed in Note 9, “Deferred Tax Assets and Tax Provision” of the Consolidated Financial Statements.
78
Table of Contents
INVESTMENT SECURITIES
The Company’s security portfolio is utilized as collateral for borrowings, required collateral for public agencies and trust customers deposits, CRA support, and to manage liquidity, capital and interest rate risk.
Investment securities were $1.32 billion at March 31, 2011 compared to $1.28 billion at December 31, 2010, an increase of $42.4 million. This increase was mostly due to purchases of $46.4 million of mortgage backed securities and $50.1 million of CMOs during the three months ended March 31, 2010. These purchases were offset by principal paydowns of $37.9 million and calls of $10.7 million of securities. The securities portfolios are managed by the Bank’s Treasury Department to maximize funding and liquidity needs and are included as assets of the All Other segment.
For additional information on impairment of investment securities, credit ratings of investment securities, and the Company’s investment in the stock issued by the FHLB of San Francisco, refer to Note 3, “Investment Securities” of the Consolidated Financial Statements.
LOAN PORTFOLIO
Through the Company’s banking subsidiary, PCBNA, a full range of lending products and banking services are offered to households, professionals, and businesses. The Company offers its lending products through its Commercial and Community Banking operating segment and all comments pertaining to loans in this section refer to assets of that segment. The products offered by this segment include commercial, consumer, commercial and residential real estate loans and SBA guaranteed loans.
Successor Company
The Company’s loans are reported net of the nonaccretable difference, accretable yield, purchase discounts, deferred loan origination fees, extension, commitment fees and deferred loan origination costs. The nonaccretable difference and accretable yield were generated from the purchase accounting adjustments at the Transaction Date and reduced the carrying balance of the loans as described in Note 1, “Summary of Significant Accounting Policies” of the Consolidated Financial Statements.
79
Table of Contents
To assist the reader with understanding of the PCI Term and PCI Revolving Pools versus the loans originated and purchased since the Transaction Date the following table provides a summary of the carrying balance and unpaid principal balance of the loans held at March 31, 2011, and December 31, 2010.
| Successor Company | ||||||||||||||||
| March 31, 2011 | ||||||||||||||||
| Originated
and Purchased Since Transaction Date |
PCI Term Pools |
PCI Revolving Pools |
Total | |||||||||||||
| (dollars in thousands) | ||||||||||||||||
| Real estate: |
||||||||||||||||
| Residential - 1 to 4 family |
$ | 45,398 | $ | 771,373 | $ | 72,443 | $ | 889,214 | ||||||||
| Multifamily loans |
92,900 | 229,583 | 2,244 | 324,727 | ||||||||||||
| Commercial |
86,029 | 1,678,354 | 22,190 | 1,786,573 | ||||||||||||
| Construction |
— | 193,698 | 9,386 | 203,084 | ||||||||||||
| Revolving - 1 to 4 family |
2,449 | 5,367 | 269,219 | 277,035 | ||||||||||||
| Commercial loans |
2,477 | 104,368 | 145,044 | 251,889 | ||||||||||||
| Consumer loans |
2,447 | 31,738 | 22,833 | 57,018 | ||||||||||||
| Other loans |
4,708 | 8,142 | 6,959 | 19,809 | ||||||||||||
| Total carrying balance |
$ | 236,408 | $ | 3,022,623 | $ | 550,318 | $ | 3,809,349 | ||||||||
| Total unpaid principal balance |
$ | 241,743 | $ | 3,323,012 | $ | 646,300 | $ | 4,211,055 | ||||||||
| Successor Company | ||||||||||||||||
| December 31, 2010 | ||||||||||||||||
| Originated Since Transaction Date |
PCI Term Pools |
PCI Revolving Pools |
Total | |||||||||||||
| (dollars in thousands) | ||||||||||||||||
| Real estate: |
||||||||||||||||
| Residential - 1 to 4 family |
$ | 7,652 | $ | 814,770 | $ | 75,056 | $ | 897,478 | ||||||||
| Multifamily loans |
— | 252,379 | 2,132 | 254,511 | ||||||||||||
| Commercial |
— | 1,718,029 | 27,560 | 1,745,589 | ||||||||||||
| Construction |
— | 227,424 | 7,413 | 234,837 | ||||||||||||
| Revolving - 1 to 4 family |
1,237 | 5,451 | 274,065 | 280,753 | ||||||||||||
| Commercial loans |
2,553 | 115,799 | 148,350 | 266,702 | ||||||||||||
| Consumer loans |
1,155 | 34,491 | 25,067 | 60,713 | ||||||||||||
| Other loans |
3,807 | 9,458 | 7,669 | 20,934 | ||||||||||||
| Total carrying balance |
$ | 16,404 | $ | 3,177,801 | $ | 567,312 | $ | 3,761,517 | ||||||||
| Total unpaid principal balance |
$ | 16,376 | $ | 3,494,683 | $ | 668,988 | $ | 4,180,047 | ||||||||
Loans originated since the Transaction Date increased to $236.4 million at March 31, 2011, an increase of $220.0 million since December 31, 2010. This increase is mostly attributable to the purchase of multifamily and commercial real estate loans of $188.4 million in March 2011 as described in Note 4, “Loans” of the Consolidated Financial Statements.
As described in the Consolidated Financial Statements, the Company has elected an accounting policy to apply expected cash flows accounting guidance in ASC 310-30 for term loans subject to the business combination and
80
Table of Contents
push-down accounting requirements for loan portfolios acquired in a business combination referred to as “PCI Term Pools.” Some loans that otherwise meet the definition as credit impaired, such as revolving lines of credit, are specifically excluded from the PCI Term Pools as per the accounting guidance in ASC 310-20 and are referred to as “PCI Revolving Pools”. Management considers the PCI Revolving Pools also credit impaired and has pooled these revolving lines of credit purchased through the Investment Transaction.
At March 31, 2011, and December 31, 2010, a majority of the loans included in “Loans Held for Investment” are PCI Term and PCI Revolving Pools. The accounting for PCI Term and PCI Revolving Pools is significantly different from the accounting for loans originated and purchased since the Transaction Date. For a discussion of the accounting for PCI Term and PCI Revolving Pools, refer to Note 1, “Summary of Significant Accounting Policies,” “Note 4, “Loans” and Note 5, “Purchased Credit Impaired Pools” of the Consolidated Financial Statements.
ALLOWANCE FOR LOAN AND LEASE LOSSES
The Company establishes an estimated allowance for inherent loan losses and records the change in this estimate through charges to current period earnings.
Successor Company
The ALLL of $2.1 million and $520,000 at March 31, 2011, and December 31, 2010, respectively, is for the loans originated and purchased since the Transaction Date. The increase of ALLL of $1.6 million since December 31, 2010 is from the purchase of $188.4 million of loans in March 2011, and originated loans of $31.7 million since December 31, 2010.
The loans originated and purchased at March 31, 2011, have a carrying balance of $236.4 million and a ratio of ALLL compared to the newly originated and purchased loans of 0.9%. At December 31, 2010, the loans originated since the Transaction Date had a carrying balance of $16.4 million and a ratio of ALLL compared to the newly originated loans of 3.2%.
ALLL Model Methodology
The methodology used to calculate the ALLL is described in Note 1, “Summary of Significant Accounting Policies” of the Consolidated Financial Statements. This methodology is applied to loans originated since the Transaction Date. In March 2011, the Company purchased commercial real estate and multifamily loans of $188.4 million. For the loans purchased in March 2011, a different ALLL methodology was used. The description of this methodology is in Note 6, “Allowance for Loan and Lease Losses” of the Consolidated Financial Statements.
Loan Losses
Successor Company
Net charge-offs during the three months ended March 31, 2011, were $72,000. The net charge-offs during the three months ended March 31, 2011, by loan type is disclosed in Note 6, “Allowance for Loan and Lease Losses” of the Consolidated Financial Statements. Net charge-offs significantly decreased due to the fair valuation of the loan portfolio at the Transaction Date. All charge-off activity for PCI loans are accounted for within the nonaccretable discount for the PCI Term Pools and purchase discount for PCI Revolving Pools. The net charge-offs reflected in the Successor Company are from loans originated since the Transaction Date.
81
Table of Contents
Nonperforming Assets
Nonaccrual and Restructured Loans
Successor Company
When a borrower discontinues making payments as contractually required by the note, the Company must determine whether it is appropriate to continue to accrue interest. Generally, the Company places loans in a nonaccrual status and ceases recognizing interest income when the loan has become delinquent by more than 90 days and/or when Management determines that the repayment of principal and collection of interest is unlikely. The Company may decide that it is appropriate to continue to accrue interest on certain loans more than 90 days delinquent if they are well secured by collateral and collection is in process. If certain conditions are met, loans that are contractually past due more than 90 days may still accrue interest. Those conditions are that they are well-secured by collateral or guarantors and that the creditor is actively seeking collection. While still accruing interest, these loans are normally regarded as nonperforming.
When a loan is placed in a nonaccrual status, any accrued but uncollected interest for the loan is reversed out of interest income in the period in which the status is changed. Subsequent payments received from the customer are applied to principal and no further interest income is recognized until the principal has been made current or until circumstances have changed such that payments are again consistently received as contractually required. In the case of commercial customers, the pattern of payment must also be accompanied by a positive change in the financial condition of the borrower.
A loan may be restructured when the Bank determines that a borrower’s financial condition has deteriorated, but still has the ability to repay the loan. A loan is considered to be TDR when the original terms have been modified in favor of the borrower such that either principal or interest has been forgiven, contractual payments are deferred, or the interest rate is reduced. Once a loan has been restructured for a customer, the Bank considers the loan to be nonaccrual for a minimum of six months. Once the borrower has made their payments as contractually required for six months, the loan is reviewed and interest may again be accrued.
Note 6, “Allowance for Loan and Lease Losses” of the Consolidated Financial Statements provides an aging table of past due loans on an individual basis based on their contractual obligation. If a loan is in a PCI Term Pool and contractually past due, the loan is reported in the aging table as a past due loan but, still accruing. The aging table provides the net carrying value of all loans in a current, past due and nonaccrual status at March 31, 2011, and December 31, 2010. At March 31, 2011, $12.0 million of loans were in a nonaccrual status compared to December 31, 2010, which had $6.4 million of loans reported in a nonaccrual status.
The reporting for nonperforming loans was significantly impacted by the classification of all purchased loans as either PCI Term Pools or PCI Revolving Pools. The accounting for PCI Term Pools and PCI Revolving Pools is described in Note 1, “Summary of Significant Accounting Policies” of the Consolidated Financial Statements. All loans were written down to their fair value which is based on the cash flows for both interest and principal, net charge-offs and prepayments expected to be received. Therefore no loans recorded as of the Transaction Date are classified as nonaccrual except for loans which are in the PCI Revolving Pools and any loans originated or purchased since the Transaction Date which met the criteria as a nonperforming loan. At March 31, 2011, and December 31, 2010, there were no loans which had been originated or purchased since the Transaction Date which are considered to be nonperforming.
Except for loans in the PCI Revolving Pools and loans originated or purchased since the Transaction Date, loans that had been classified as TDRs because the Company had negotiated a concessionary payment or interest terms so the borrower could continue to make payments are not reported as TDRs after the application of purchase accounting because the process of revaluing them takes into account the probability of the borrower being able to remain current with the restructured terms.
82
Table of Contents
Foreclosed Collateral
Real estate acquired through foreclosure on a loan or by surrender of the real estate in lieu of foreclosure is called Other Real Estate Owned or “OREO”. OREO is originally recorded in the Company’s financial records at the lower of its carrying value or fair value of the property, less estimated costs to sell. If the outstanding balance of the loan is greater than the fair value of the OREO at the time of foreclosure, the difference is charged-off against the ALLL.
Once the collateral is foreclosed on and the property becomes an OREO, Management periodically obtains valuations to determine if further valuation adjustments are required. If there is a decrease in the fair value of the property on the valuation date, the decrease in value is charged to noninterest income as a valuation adjustment. During the time the property is held, all related operating and maintenance costs are expensed as incurred. All income produced from OREOs is included in noninterest income.
At the Transaction Date, the OREO portfolio was recorded at fair value, less costs to sell. The balance of OREO has remained relatively unchanged since the Transaction Date since properties are being disposed at approximately the same rate that new OREO properties are being added to the OREO held by the Company.
OTHER ASSETS
Included within other assets are bank-owned life insurance (“BOLI”), LIHTCPs, Receivables, and FHLB stock.
Successor Company
Other assets were $236.2 million at March 31, 2011 compared to $284.7 million at December 31, 2010, a decrease of $48.4 million or 17.0%. This decrease is attributed primarily to the payments of $50.1 million from the IRS which was applied against the corporate tax receivable. At December 31, 2010, the corporate tax receivable was $56.8 million, the amount estimated to be recovered through carryback of NOLs. For more information refer to Note 9, “Deferred Tax Assets and Tax Provision” of the Consolidated Financial Statements.
DEPOSITS
Successor Company
The deposit balances by category are summarized as of March 31, 2011, and December 31, 2010 in the table below.
| Successor Company | ||||||||
| March 31, 2011 |
December 31, 2010 |
|||||||
| (dollars in thousands) | ||||||||
| Noninterest bearing deposits |
$ | 1,073,219 | $ | 1,099,260 | ||||
| Interest bearing deposits: |
||||||||
| NOW accounts |
926,207 | 938,228 | ||||||
| Money market deposit accounts |
326,768 | 314,362 | ||||||
| Other savings deposits |
464,042 | 434,896 | ||||||
| Time deposits |
1,963,890 | 2,121,542 | ||||||
| Total deposits |
$ | 4,754,126 | $ | 4,908,288 | ||||
At March 31, 2011, deposits were $4.75 billion, a decrease of $154.2 million since December 31, 2010. The decrease in deposits is generally attributed to a decline in time deposits of $157.7 million. The decrease in time deposits occurred from maturing high rate time deposits which were not renewed due to lower competitive market rates being offered to improve the Company’s net interest margin. Money market deposits increased by $12.4 million to $326.8 million during the quarter as some of the matured time deposits were reinvested into money market
83
Table of Contents
accounts which have attractive interest rates and provide more liquidity than the time deposits. Similarly, other savings deposits of $464.0 million at March 31, 2011, increased by $29.1 million from December 31, 2010.
CAPITAL RESOURCES
Capital Adequacy Standards
The Company and PCBNA are subject to various regulatory capital requirements administered by the Federal banking agencies. Failure to meet minimum capital requirements as specified by the regulatory framework for prompt corrective action could cause the regulators to initiate certain mandatory or discretionary actions that, if undertaken, could have a direct material effect on the Company’s financial statements. For additional information regarding the Company’s capital refer to Note 21, “Shareholders’ Equity” and Note 23, “Regulatory Capital Requirements” of the Consolidated Financial Statements of the 2010 Form 10-K.
The Company’s and PCBNA’s capital ratios as of March 31, 2011, and December 31, 2010, were as follows:
| Total Capital |
Tier 1 Capital |
Risk-Weighted Assets |
Tangible Average Assets |
Total Capital Ratio |
Tier 1 Capital Ratio |
Tier 1 Leverage Ratio |
||||||||||||||||||||||
| (dollars in thousands) | ||||||||||||||||||||||||||||
| Successor Company |
||||||||||||||||||||||||||||
| March 31, 2011 |
||||||||||||||||||||||||||||
| PCBC (consolidated) |
$ | 670,099 | $ | 656,210 | $ | 3,864,797 | $ | 5,926,872 | 17.3% | 17.0% | 11.1% | |||||||||||||||||
| PCBNA |
599,427 | 585,538 | 3,867,534 | 5,925,149 | 15.5% | 15.1% | 9.9% | |||||||||||||||||||||
| December 31, 2010 |
||||||||||||||||||||||||||||
| PCBC (consolidated) |
$ | 646,324 | $ | 633,938 | $ | 3,909,351 | $ | 6,149,932 | 16.5% | 16.2% | 10.3% | |||||||||||||||||
| PCBNA |
575,049 | 562,663 | 3,909,482 | 6,133,212 | 14.7% | 14.4% | 9.2% | |||||||||||||||||||||
| Minimum Capital Ratios required by the Operating Agreement |
|
12.0% | N/A | 8.0% | ||||||||||||||||||||||||
| Generally required minimum ratios to be classified as well-capitalized |
|
10.0% | 6.0% | 5.0% | ||||||||||||||||||||||||
| Generally required minimum ratios to be classified as adequately capitalized |
|
8.0% | 4.0% | 4.0% | ||||||||||||||||||||||||
The minimum capital ratios required to be considered “well capitalized” and “adequately capitalized” under generally applicable regulatory guidelines are included in the table above. As of March 31, 2011 and December 31, 2010, both the Company (“PCBC (consolidated)” in the table above) and the Bank met the minimum levels for the three regulatory ratios to be considered “well capitalized.”
On September 2, 2010, the OCC issued a Modification of Existing Consent Order, pursuant to which the OCC terminated Article III of the Consent Order issued by the OCC on May 11, 2010. Article III of the Consent Order had required, among other things, that the Bank achieve and maintain total capital at least equal to 12% of risk-weighted assets and Tier 1 capital at least equal to 9% of adjusted total assets by September 8, 2010. Also on September 2, 2010, the Bank entered into the Operating Agreement with the OCC, pursuant to which, among other things, the Bank agreed to maintain total capital at least equal to 12% of risk-weighted assets and Tier 1 capital at least equal to 8% of adjusted total assets and to not pay any dividend or reduce its capital without the prior non-objection of the OCC and unless at least three years have elapsed since the effective date of the Operating Agreement. The Bank was in compliance with these minimum capital ratios at March 31, 2011, with a total risk-based capital ratio of 15.5% and a Tier 1 leverage ratio of 9.9%.
Risk-weighted assets are computed by applying a weighting factor from 0% to 100% to the carrying amount of the assets as reported in the balance sheet and to a portion of off-balance sheet items such as loan commitments and letters of credit. The definitions and weighting factors are all contained in the regulations. However, the capital
84
Table of Contents
amounts and classifications are also subject to qualitative judgments by the regulators about components, risk weightings, and other factors.
Additional Capital
In order to ensure adequate levels of capital, the Company conducts an ongoing assessment of projected sources and uses of capital in conjunction with projected increases in assets and the level of risk. As part of this ongoing assessment, the Board of Directors reviews the various components of capital, the costs, benefits and impact of raising additional capital and the availability of alternative sources of capital. Based on the Board of Directors analysis of the Company’s capital needs (including any capital needs arising out of its financial condition and results of operations or from any acquisitions it may make) and the input of it regulators, the Company could decide or be required by its regulators to raise additional capital.
The Company’s ability to raise additional capital if and when needed will depend on conditions in the capital markets, which are outside the Company’s control, and on the Company’s financial performance. Accordingly, the Company cannot be certain of its ability to raise additional capital on acceptable terms. If the Company cannot raise additional capital if and when necessary, its results of operations and financial condition could be materially and adversely affected, and it may be subject to further supervisory action. In addition, if the Company were to raise additional capital through the issuance of additional shares, its stock price could be adversely affected, depending on the terms of any shares it were to issue and the percentage ownership of existing shareholders would be reduced.
Dividends from the Bank
The principal source of funds from which Bancorp services its debt and pays its obligations and dividends is the receipt of dividends from the Bank. The availability of dividends from the Bank is limited by various statutes and regulations. Pursuant to the Operating Agreement, the Bank may not pay a dividend or make a capital distribution to Bancorp without prior approval from the OCC or until September 2, 2013. The Written Agreement also restricts the taking of dividends or any other payment representing a reduction in capital from the Bank, without the prior approval of the Reserve Bank. At March 31, 2011, Bancorp held $73.9 million in cash, which is sufficient to service its debts for the foreseeable future.
Deferral of Interest on Trust Preferred Securities
In the second quarter of 2009, the Company elected to defer regularly scheduled interest payments on its outstanding $69.4 million of junior subordinated notes relating to its trust preferred securities. During the deferral period, interest continues to accrue on the junior subordinated notes at the stated coupon rate, including the deferred interest, and the Company may not, among other things and with limited exceptions, pay cash dividends on or repurchase its common stock or preferred stock nor make any payment on outstanding debt obligations that rank equally with or are junior to the junior subordinated notes. As of March 31, 2011, the Company has accrued but not paid $4.1 million of interest expense for the junior subordinated notes.
As a result of the Company’s deferral of interest on the junior subordinated notes, it is likely that the Company will not be able to raise funds through the offering of debt securities until the Company becomes current on these obligations or these obligations are restructured. This deferral may also adversely affect the Company’s ability to obtain debt financing on commercially reasonable terms. As a result, the Company will likely have greater difficulty in obtaining financing and, thus, will have fewer sources to enhance its capital and liquidity position. In addition, if the Company defers interest payments on the junior subordinated notes for more than 20 consecutive quarters, the Company would be in default under the governing agreements for such notes and the amount due under such agreements would be immediately due and payable. Under the terms of the Written Agreement, the Company must obtain permission from the Reserve Bank to bring interest current on these notes.
85
Table of Contents
Dividends on Common Stock
In the second quarter of 2009, the Board of Directors elected to suspend the payment of cash dividends on its common stock to preserve capital and liquidity. As a result of the Written Agreement, Reserve Bank approval will be required before the Company can resume paying cash dividends on its common stock.
LIQUIDITY
Liquidity risk is the risk of an institution being unable to meet obligations when they come due and includes an inability to manage unplanned decreases or changes in funding sources. Liquidity risks can be segmented into two categories, either exogenous or endogenous risks. Exogenous risks are systematic in nature and typically outside the control of an organization and affect all market participants to varying extents (e.g. the disruptions in the overall asset securitization market). Endogenous risks are localized to a specific organization and are usually within its control (e.g. poor liquidity management or headline risk).
The Company believes that maintaining a strong liquidity position, including in stressed conditions, is imperative for it to operate in a safe and sound manner. The Company’s principal goal regarding liquidity will be to have access to cash at all times, even during a period of severe liquidity stress, to maintain a conservative and diversified funding base to the extent possible, and to hold high credit quality investment securities that can be quickly turned into cash. A key component of the Company’s liquidity risk management framework is the development of a sound and accurate process to identify and measure liquidity risk.
The Company believes that it is important to have in place comprehensive liquidity and funding policies that are intended to maintain significant flexibility to address specific liquidity events and to address broader industry or market liquidity events. The Company has policies in place regarding liquidity to ensure that the Company is following sound liquidity risk management principles. In putting together these policies, the Company has considered recent guidance provided by the Basel Committee on Banking Supervision and the Federal Deposit Insurance Corporation (“FDIC”).
The Company measures liquidity risk through the use of projected cash flow models that identify potential future net funding shortfalls by estimating expected cash inflows and outflows arising from assets, liabilities, derivatives, operations, and off-balance sheet arrangements over a variety of time horizons, under normal conditions and a range of stress scenarios, including scenarios of severe stress. This liquidity cash flow model allows the Company to effectively manage the timing of incoming cash flows with outgoing cash flows. The Company assesses liquidity risk over various time horizons to identify and remediate potential future net funding shortfalls below board approved risk tolerances.
The Company’s policy is to hold enough cash on hand to meet its daily cash needs and to withstand estimated daily cash outflows under a severe stress scenario. In addition, the Company’s policy is to meet long term cash flow needs through its available funding capacity and liquid investment securities and to withstand future cash outflows under a severe stress scenario.
Given the importance of being able to rapidly respond to negative liquidity events, the Company maintains a formal contingency funding plan (“CFP”) that clearly sets out the strategies to be taken if certain negative liquidity events were to occur. The Company’s CFP identifies negative liquidity triggering events; establishes clear lines of responsibility for action; describes the specific procedures or actions to be taken, in priority order, for the initial response; and documents the communication and escalation procedures if initial responses do not resolve the problem. The Company believes that it is currently maintaining sufficient liquidity to meet its cash needs and to withstand a severe stressed liquidity event.
86
Table of Contents
Successor Company
Current Liquidity Status
At March 31, 2011, the Bank had a total facility amount of $1.21 billion at the FHLB and unused borrowing capacity of $1.17 billion. The Bank had unused borrowing capacity with the Reserve Bank of $308.1 million at March 31, 2011. As the Company experienced deterioration in its financial conditions, certain restrictions and limitations were imposed on its borrowing arrangements. Since the completion of the Investment Transaction, most of these restrictions and limitations have been lifted. The Company expects that any remaining restrictions and limitations will be removed over time as the Company continues to show improvements in its financial condition.
Maturity of Liabilities
At March 31, 2011, the Bank had a total of $323.0 million of brokered CDs and $37.7 million of Certificate of Deposit Account Registry Service (“CDARs”) CDs. The brokered CDs have maturities from April 2011 through January 2014 with no more than $55.3 million maturing in any one month and no more than $100.5 million maturing in any one quarter.
Of the $1.60 billion in retail or non-brokered CDs at March 31, 2011, approximately $930 million will mature in 2011, with $419 million maturing in the second quarter of 2011, $262 million in the third quarter of 2011, $249 million in the fourth quarter of 2011, and $191 million in the first quarter of 2012. During the period between April 1, 2012 and December 31, 2012, $250 million of CDs are expected to mature and during the twelve months ended 2013, $148 million are expected to mature. The remaining approximately $77 million have maturities extending out as far as 2039. The Bank expects that most maturing retail CDs will roll over into new certificates.
Liquidity Ratio
A prevailing liquidity ratio used in the banking industry is the net non-core funding dependence ratio and the short term non-core funding dependence ratio as defined by regulatory practice. This ratio measures the proportion of long term assets such as loans and securities with remaining maturities of over one year that are funded by non-core funding sources and short term non-core funding sources. The Company’s net non-core funding dependence ratio was 24.89% at March 31, 2011 and 24.28% at December 31, 2010, respectively.
87
Table of Contents
| ITEM 3. | QUANTITATIVE AND QUALITATIVE DISCLOSURES ABOUT MARKET RISK |
Market risk is the risk of the change in the value of a financial instrument due to movements in market factors. The preponderance of market risk that the Company assumes is from interest rate risk. Interest rate risk is the risk to earnings or capital arising from movements in interest rates. The economic perspective for market risk focuses on the value of assets or liabilities in today’s interest rate environment and the sensitivity of that value to changes in interest rates.
Interest rate risk arises from differences between the timing of rate changes and the timing of cash flows (repricing risk); from changing rate relationships among different yield curves affecting assets or liabilities (basis risk); from changing rate relationships across the spectrum of maturities (yield curve risk); and from interest-related options embedded in assets or liabilities (option risk). The evaluation of interest rate risk must consider the potential effect on fee income that is sensitive to changes in interest rates.
For financial instruments that are recorded at fair value, these positions are marked-to-market and changes in the market value of the financial instrument are immediately identified through either earnings or other comprehensive income, both of which impact capital. As with most commercial banks, the Company records most of its financial instruments at historical cost and, therefore, another approach is needed to identify market risks. The Company uses Economic Value of Equity (“EVE”) shock simulation model to identify the impact of market risk to capital and forecasted Net Interest Income (“NII”) shock simulation to identify the impact of interest rate risk to earnings.
EVE simulates the effects of an instantaneous and sustained change in interest rates (in increments of +/- 100 basis points) on assets and liabilities and measures the resulting increase or decrease to the Company’s equity position. EVE is the discounted value of future cash flows of all interest rate sensitive assets minus all interest rate sensitive liabilities, plus the book value of tangible noninterest rate sensitive assets minus tangible noninterest rate sensitive liabilities.
NII simulates the effects of an instantaneous and sustained change in interest rates (in increments of +/- 100 basis points) on future net interest income. NII simulates the effects that repricing has on both interest rate sensitive assets and liabilities. Shock analysis is objective and facilitates comparability. It is not entirely realistic in that it assumes an instantaneous and equal impact on all market rates and not all market rates respond in a parallel fashion to rising or falling interest rates. This causes asymmetry in the magnitude of changes in net interest income and net economic value resulting from the hypothetical increases and decreases in interest rates.
The Company measures its market risk exposure by performing +/- 200 basis point EVE shock simulation and measures the increase or decrease to the Company’s EVE position. The Company’s Board of Directors (“BOD”) has set a 15% limit for the change in equity in such simulation. The Company measures interest rate risk by performing +/- 200 basis point NII shock simulation and measures the increase or decrease in NII over the next twelve months. The BOD has set a 10% limit for the change in net interest income in such simulation. At March 31, 2011, and December 31, 2010, the Company met the BOD approved limits for both EVE and NII.
Financial instruments do not respond in a parallel fashion to rising or falling interest rates given the structure of each financial instrument including the contractual term, repricing features, amortization or bullet features, expected prepayments or runoff rates, rate indices, caps, floors, etc. The mismatch of these types of features between interest rate sensitive assets versus interest rate sensitive liabilities may significantly impact market risk exposure.
88
Table of Contents
The Company reduces its exposure by changing the mix of either assets or liabilities to reduce asset-liability mismatches. This may include buying or selling financial instruments, changing the mix of repricing features as financial instruments come due, diversifying its financial instrument exposure, reducing position sizes.
The Company can also reduce its financial instrument exposure by entering into derivative contracts such as futures, forwards, swaps, or option contracts. Accordingly, the Company’s evaluation of market risk needs to consider both derivative positions along with the non-derivative positions intended to be hedged. While derivative instruments are effective hedging tools, the Company generally has been successful at maintaining its interest rate risk profile within policy limits strictly from proactive asset/liability strategies without the use of derivatives.
EVE Summary
The results of modeled EVE interest rate shock for March 31, 2011, and December 31, 2010, are as follows:
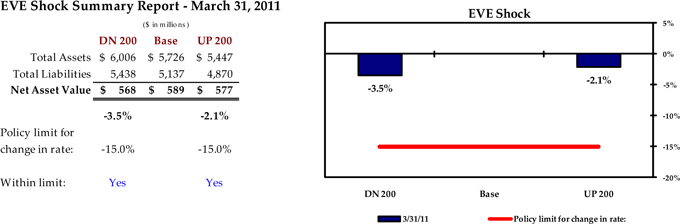
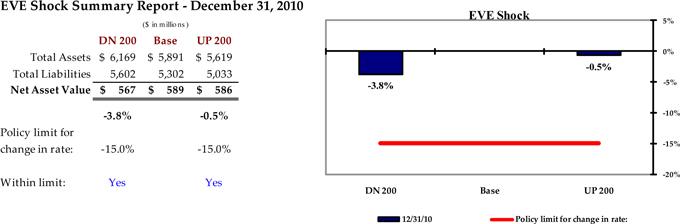
Successor Company
At March 31, 2011, and December 31, 2010, the Company’s modeled EVE was $589 million for both periods. Assuming an instantaneous 200 basis points (“bps”) increase in interest rates, the Company’s projected EVE would decrease by approximately $12 million or -2.1% from the $589 million base amount at March 31, 2011 and $3 million or -0.5% from the $589 million base amount at December 31, 2010. Assuming an instantaneous 200 bps decrease in interest rates, the Company’s projected EVE would decrease by $21 million or -3.5% at March 31, 2011, and $22 million or -3.8% at December 31, 2010. These changes are within the Company’s policy limit of a 15% decline in EVE.
89
Table of Contents
NII Summary
The results of modeled NII interest rate shock for the forward three months beginning March 31, 2011, and December 31, 2010, are as follows:
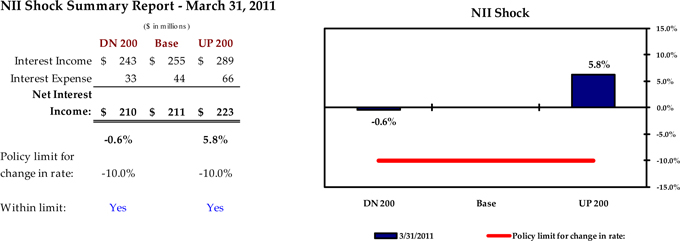
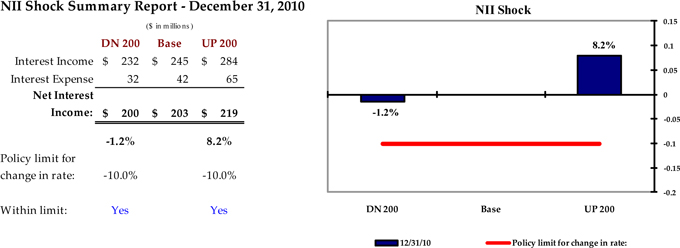
Successor Company
At March 31, 2011, the Company’s modeled projection for net interest income over the next twelve months was $211 million. Assuming an instantaneous 200 bps increase in interest rates, the Company’s projected NII would increase by approximately $12 million or 5.8% from the $211 million base amount. Assuming an instantaneous 200 bps decrease in interest rates, including a rate floor at zero percent, the Company’s projected NII would decrease by $1 million or -0.6%. These changes are within the Company’s policy limit of a 10% decline in NII.
At December 31, 2010, the Company’s modeled projection for net interest income over the next twelve months was $203 million. Assuming an instantaneous 200 bps increase in interest rates, the Company’s projected NII would increase by approximately $16 million or 8.2% from the $203 million base amount. Assuming an instantaneous 200 bps decrease in interest rates, including a rate floor at zero percent, the Company’s projected NII would decrease by $3 million or -1.2%. These changes are within the Company’s policy limit of a 10% decline in NII.
90
Table of Contents
The above factors impacted overall sensitivity of the Company’s EVE and NII to changes in interest rates by increasing the proportion of assets and liabilities that are either insensitive to rate changes or by lengthening the average maturity so that the effect of rate changes would be delayed.
The model utilizes certain assumptions that address optionality. These assumptions include the following:
| n | Customers have the option to prepay their loans or withdraw their non-maturing deposits; |
| n | Issuers have the option to prepay or call their debt, on some of the securities held by the Company; |
| n | The Company has the option to prepay or call certain types of its debt; |
| n | The Company has the option to re-price its administered deposits; and |
| n | Loans include features such as interest rate resets, imbedded caps and floors, and other aspects of loan terms and conditions. |
There are various shortcomings inherent in modeling both EVE and NII sensitivity analyses. Certain assumptions may not reflect the manner in which actual yields and costs respond to market changes. Similarly, prepayment estimates and similar assumptions are subjective in nature, involve uncertainties and therefore cannot be determined with precision. Changes in interest rates may also affect the Company’s operating environment and operating strategies as well as those of the Company’s competitors. In addition, certain adjustable rate assets have limitations on the magnitude of rate changes over specified periods of time. Accordingly, the Company’s NII sensitivity analyses may provide a strong indication of the Company’s interest rate risk exposure. However, actual performance may differ from modeled results. There are no material positions, instruments or transactions that are not included in the modeling nor do any included instruments have special features that are not included.
| ITEM 4. | CONTROLS AND PROCEDURES |
Disclosure Controls and Procedures
Based on their evaluation of the Company’s disclosure controls and procedures (as defined in Rule 13a-15(e) under the Exchange Act), the Company’s Chief Executive Officer and Chief Financial Officer have concluded that as of the end of the period covered by this Form 10-Q, such disclosure controls and procedures are effective to ensure that information required to be disclosed by the Company in reports that it files or submits under the Exchange Act is recorded, processed, summarized and reported within the time periods specified in SEC rules and forms and is accumulated and communicated to the Company’s management, including the Chief Executive Officer and Chief Financial Officer, as appropriate to allow timely decisions regarding required disclosures.
Changes in Internal Control Over Financial Reporting.
During the fiscal quarter ended March 31, 2011, there was no change in the Company’s internal control over financial reporting that has materially affected, or is reasonably likely to materially affect, the Company’s internal control over financial reporting.
91
Table of Contents
92
Table of Contents
GLOSSARY- CONTINUED
93
Table of Contents
| ITEM 1. | LEGAL PROCEEDINGS |
Information regarding legal proceedings is incorporated by reference from Note 11, “Commitments and Contingencies” of the Consolidated Financial Statements of this Form 10-Q.
| ITEM 1A. | RISK FACTORS |
There are a number of factors that may adversely affect the Company’s business, financial condition or results of operations. Refer to “Risk Factors” in the 2010 Form 10-K for discussion of these risks. Such risks have not materially changed since the filing of the 2010 Form 10-K.
| ITEM 2. | UNREGISTERED SALES OF EQUITY SECURITIES AND USE OF PROCEEDS |
None.
| ITEM 3. | DEFAULTS UPON SENIOR SECURITIES |
None.
| ITEM 4. | REMOVED AND RESERVED. |
None.
| ITEM 5. | OTHER INFORMATION |
None.
94
Table of Contents
| ITEM 6. | EXHIBITS |
| Exhibit Number |
Description | |||
|
10.1 |
Pacific Capital Bancorp 2011 Annual Incentive Plan, incorporated herein by reference to Exhibit 10.1 to the Current Report on Form 8-K of Pacific Capital Bancorp filed March 8, 2011. x | |||
|
31. |
Certifications pursuant to Section 302 of the Sarbanes-Oxley Act of 2002. | |||
| 31.1 | Certification of Carl B. Webb. | |||
| 31.2 | Certification of Mark K. Olson. | |||
|
32. |
Certifications pursuant to Section 906 of the Sarbanes-Oxley Act of 2002. | |||
| 32.1 | Certification of Carl B. Webb and Mark K. Olson. | |||
Shareholders may obtain a copy of any exhibit by writing to:
Carol Zepke, Corporate Secretary
Pacific Capital Bancorp
P.O. Box 60839
Santa Barbara, CA 93160
x - Indicates management contract or compensatory plan or arrangement.
95
Table of Contents
Pursuant to the requirements of the Securities Exchange Act of 1934, the Company has duly caused this report to be signed on its behalf by the undersigned thereunto duly authorized.
Pacific Capital Bancorp
| By /s/ Carl B. Webb |
May 12, 2011 | |||||
| Carl B. Webb Chief Executive Officer |
Date
| |||||
| By /s/ Mark K. Olson |
May 12, 2011 | |||||
| Mark K. Olson Executive Vice President and Chief Financial Officer |
Date
| |||||
96