Attached files
| file | filename |
|---|---|
| 8-K - FORM 8-K - API Technologies Corp. | d8k.htm |
 Lender Presentation
May 12, 2011
Exhibit 99.1 |
 2
Disclaimer Statement
Disclaimer Statement
API Technologies Corp. (“API Technologies” or the
“Company”) makes no express or implied representation or warranty as to the
accuracy or completeness of the information contained in this
presentation or in any additional evaluation materials, whether written
or oral, made available in connection with any further investigation of
the Company. The Company expressly disclaims any and all
liability that may be based on such information, errors therein or
omissions therefrom. In furnishing this presentation, the Company
makes no obligation to provide the recipient with access to any
additional evaluation materials or to update the information contained
herein. This presentation shall neither be deemed an indication of the
state of affairs of the Company nor constitute an indication that
there has been no change in the business affairs of the Company since
the date hereof or since the dates as of which information is
given in this presentation.
This presentation is proprietary and confidential and may not be
reproduced or distributed to others at any time without API
Technologies’ prior written consent.
This presentation may include certain forward looking
statements and projections. Any such statements and projections reflect various
estimates and assumptions concerning anticipated results. No
representations or warranties are made by the Company or any of its
affiliates or representatives as to the accuracy of any such statements
or projections. Whether or not any such forward looking
statements or projections are in fact achieved will depend upon future
events, many of which are not within the Company’s control.
Accordingly, actual results may vary from the projected results and
such variations may be material. Some of the factors that could
affect projected results are included in the Company’s filings
with the Securities and Exchange Commission. Any statements
contained herein describing documents and agreements are summaries only
and are qualified in their entirety by reference to such
documents and agreements.
In addition, this presentation sets forth certain pro forma financial
information. This pro forma financial information gives effect to the
Company’s acquisition of Spectrum Control, Inc. (“Spectrum
Control”) as well as certain other recently completed acquisitions,
including the acquisition of SenDEC Corporation
(“SenDEC”). Such pro forma financial information is based on certain assumptions
and adjustments and does not purport to present API Technologies’
actual results of operations or financial condition had the
transactions reflected in such pro forma financial information occurred
at the beginning of the relevant period, in the case of income
statement information, or at the end of such period, in the case of
balance sheet information, nor is it necessarily indicative of the
results of operations that may be achieved in the future. In addition,
the assumptions underlying certain pro forma financial
information reflect projected cost savings. API Technologies’
ability to achieve these cost savings will depend upon the Company’s
success in implementing cost reduction plans and in integrating
Spectrum Control into its business. API Technologies cannot make
any assurances that these cost savings will be realized within the time
frames expected or at all, and the Company may incur unexpected
costs in integrating Spectrum Control that offset these expected cost savings.
|
 3
Agenda
Agenda
Morgan Stanley
Transaction Overview
Vintage Capital Management
Brian Kahn, Managing Partner
Executive Summary
API Technologies
Bel Lazar, President & COO
Company Overview
API Technologies
Bel Lazar, President & COO
Key Investor Highlights
Spectrum Control
Jack Freeman, CFO
Financial Overview
Morgan Stanley
Syndication Summary
Public-Side Q&A |
 Transaction Overview
 |
 5
Transaction Overview
Transaction Overview
On March 28, 2011, API Technologies entered into a definitive agreement to acquire
Spectrum
Control
for
a
total
enterprise
value
of
approximately
$270MM
(1)
–
$20.00 per share in cash
–
9.0x
LTM
EBITDA
acquisition
multiple
(1)(2)
The acquisition of Spectrum Control will add a wide range of RF / microwave systems
and solutions products to API Technologies’
portfolio, increasing its SAM
(3)
and customer mind
share
The acquisition will be financed with a $200MM first lien term loan and $103MM in
equity from
a
recently
completed
private
placement
with
3
rd
party
investors
–
3.4x
pro
forma
leverage
including
identified
cost
reductions
(4)
–
45% pro forma Debt / Cap
The transaction is expected to close at the end of May 2011
(1)
Excludes fees and expenses
(2)
Based on LTM Adjusted EBITDA of $30.0MM as of February 28, 2011
(3)
Serviceable Addressable Market
(4)
Based
on
LTM
Pro
Forma
Adjusted
EBITDA
of
$59.8MM
as
of
February
28,
2011
including
$7.9MM
of
identified cost reductions |
 6
Transaction Details
Transaction Details
Sources & Uses (as of February 28, 2011)
Sources
$MM
Uses
$MM
Cash Flow Revolver of $20MM
–
Cash Acquisition of Spectrum Control
270.3
Term Loan B
200.0
Refinance Spectrum Control Debt
3.4
Cash
Equity
from
3
Party
Investors
102.6
Refinance API Technologies Debt
9.8
Cash from Spectrum Control
3.7
Fees and Expenses (including OID)
14.7
Cost
of
Achieving
Synergies
(1)
2.9
Cash to Balance Sheet
5.2
Total
306.3
Total
306.3
(1)
Change
of
control
payments
to
officers
and
executives
aswell
as
severance
payments
to
employees
(2)
Based
on
LTM
Pro
Forma
Adjusted
EBITDA
of
$59.8MM
as
of
February
28,
2011
including
$7.9MM
of
identified cost reductions
Pro Forma Capital Structure (as of February 28, 2011)
$MM
02/28/11
Adjustments
PF 02/28/11
Cash and Cash Equivalents
13.2
5.2
18.4
Cash Flow Revolver of $20MM
–
–
–
Term Loan B
–
200.0
200.0
Existing API Technologies Debt
11.5
(9.8)
1.7
Total Debt
11.5
201.7
Net Debt / (Cash)
(1.7)
183.3
Equity
151.9
91.6
243.5
Total Capitalization
163.4
445.2
Debt / Capitalization
45.3%
Pro Forma Coverage Ratios
(2)
Total Debt / EBITDA
3.4x
EBITDA / Interest Expense
5.2x
rd |
 Executive Summary
 |
 8
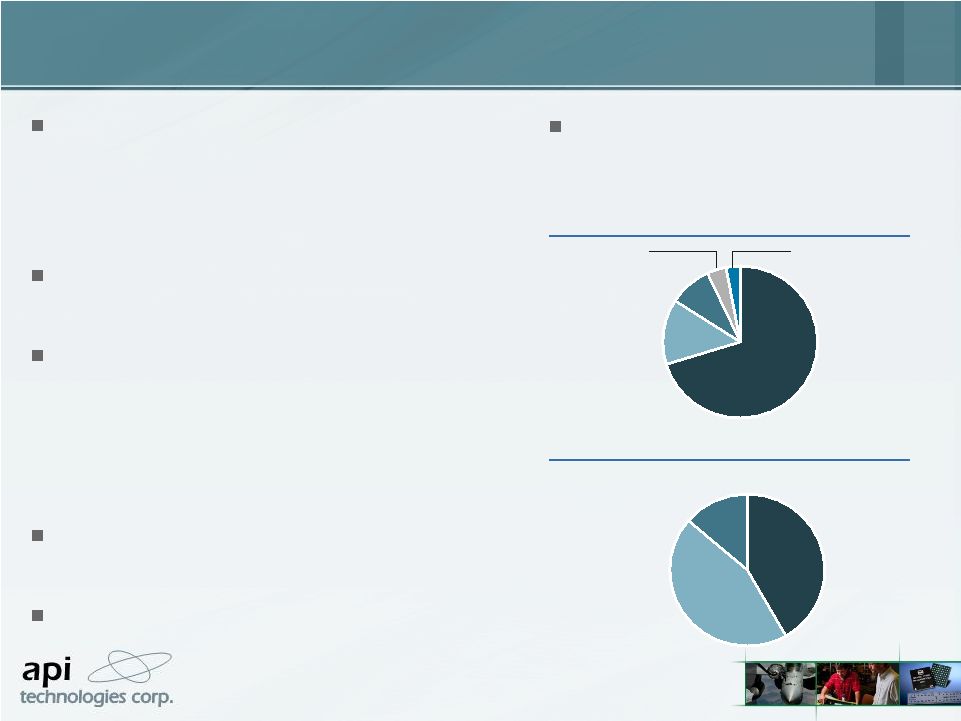
API Technologies Overview
API Technologies Overview
API Technologies designs, develops and
manufactures systems, subsystems, modules, and
secure communications for technically demanding
defense, aerospace, and commercial applications in
the U.S. and internationally
Long-standing strong relationships with all major U.S.
defense suppliers, starting at the design-in phase and
continuing throughout the product life cycle
LTM
(1)
Pro Forma Revenue of $206MM
LTM
(1)
Pro Forma Adjusted EBITDA of $22MM
–
EBITDA margin of 10.7%
6 design and 4 manufacturing facilities in the U.S.,
Canada and the U.K.
672 employees
Headquartered in Orlando, FL
45% owned by Vintage Capital Management
(1)
LTM period ending February 28, 2011
(2)
Electronics Manufacturing Services
LTM
(1)
End
Market
Mix
11%
82%
Defense
Industrial
Commercial /
Consumer
4%
LTM
(1)
Product
Mix
15%
10%
75%
EMS
(2)
Systems &
Subsystems
Solutions
Secure Communications
Aerospace
3% |
 9
Spectrum Control Overview
Spectrum Control Overview
16%
17%
5%
60%
Defense
Medical /
Industrial
Communications
Commercial
Aircraft
Consumer 2%
13%
7%
80%
RF &
Microwave
Sensors
Power Systems Management
(1)
LTM period ending February 28, 2011
LTM
(1)
End
Market
Mix
LTM
(1)
Product
Mix
Leader in the design and development of custom
electronics solutions for the defense, aerospace,
communications, industrial, and medical industries
worldwide
One of the widest ranges of RF / microwave solutions
and product offerings worldwide, combined with an
emerging portfolio of complementary products such as
sensors, measurement and power systems
management products
LTM
(1)
Revenue of $167MM
LTM
(1)
Adjusted EBITDA of $30MM
–
EBITDA margin of 17.9%
14 manufacturing sites in the U.S., China, and Mexico
and 12 R&D centers in the U.S.
1,678 employees
Headquartered in Fairview, PA |
 10
A Powerful Strategic Combination
A Powerful Strategic Combination
Transforms
API
Technologies
from
an
EMS
(1)
oriented supplier to a proprietary and
differentiated product and solutions focused
company
Adds
$2Bn
RF
/
microwave
SAM
(2)
and
creates a
scalable defense electronics platform
Broadens product offering and provides access
to new growth platforms and programs
–
Deepens value proposition and increases
customer mind share with top tier defense
companies
Provides for the realization of significant cost
savings and cross-selling opportunities
Improves stability and operating margins
44%
14%
42%
LTM
(3)
End Market Mix
LTM
(3)
Product Mix
LTM
(3)
Pro Forma Revenue and
Adjusted EBITDA of $373MM and
$60MM,
respectively
(16.0%
margin)
(4)
EMS
(1)
RF / Microwave /
Sensors / Power
Systems Management
Systems & Subsystems
Solutions
14%
9%
71%
Commercial /
Consumer 3%
Defense
Medical /
Industrial
Communications
Aerospace 4%
(1)
Electronics Manufacturing Services
(2)
Serviceable Addressable Market
(3)
LTM period ending February 28, 2011
(4)
Including $7.9MM of identified cost reductions |
 11
Investor Highlights Summary
Investor Highlights Summary
Niche, Market Leading
Positions
Experienced Management
Team
Diverse, Blue-Chip
Customer Base
Attractive End Markets
Significant Cost Reductions /
Synergies
Compelling Financial
Profile
Long-standing, deep relationships with a broad group of leading defense and
commercial companies Over 1,500 customers with exposure to multiple end
markets Diverse and attractive mix of over 350 programs / projects
Digitization of the battlefield drives favorable long-term outlook for defense
electronics manufacturers Attractive
positions
on
growth
defense
platforms
–
e.g.,
C4ISR,
Electronic
Warfare,
IPMEIR,
Missile
Defense, RADAR and UAVs
Niche, high margin opportunities in the medical, industrial, commercial and
consumer industries ~$8MM in identified cost reductions through public
company and corporate cost takeouts and low risk consolidations
Substantial cross-selling opportunities with increased customer mind
share Vertical integration provides capability to function as
self-sufficient supply chain Highly flexible, low cost production base
Strong
cash
flow
profile
driven
by
capex
requirements
below
2%
of
sales
Average industry experience / tenure of 25 years
Extensive
experience
in
the
successful
integration
of
businesses
worldwide
VCM is an operations focused owner with a history of success integrating and
streamlining assets Sole
/
long-term
design-in
or
primary
source
positions
(89%
of
LTM
(1)
sales)
One
of
the
largest
selections
of
RF
/
microwave
filters
for
high
reliability
applications
High degree of technical proficiency and well proven design systems
(1)
LTM period ending February 28, 2011 |
 Company Overview
 |
 13
Corporate History
Corporate History
Over 40 years of operating history
Organic growth supplemented with ~1 bolt-on acquisition per year
Focused on growing product content and moving up the defense electronics supply
chain in order to generate higher margins
Formation
1968
1998
Potter
Production
.
1999
AMP Signal
Conditioning
Products
1972
1999
2002
2003
2004
2006
2007
2009
2010
2011
2004
Salisbury
Engineering
(February)
REMEC
Components
(October)
2007
EMF
Systems
2009
Micro
Networks
2010
DRS Signal Solutions
(June)
Sage Laboratories
(June)
Summit Instruments
(October)
2005
JDK Controls
(October)
Amplifonix
(February)
Formation
Filtran
TM Systems
Keytronics
Cryptek
Islip
Transformer
Kuchera
SenDEC
(January)
Formation
SatCon
Electronics
2008
NHI
2006
Advanced
Thermal
Products
2002
FSY
Microwave |
 14
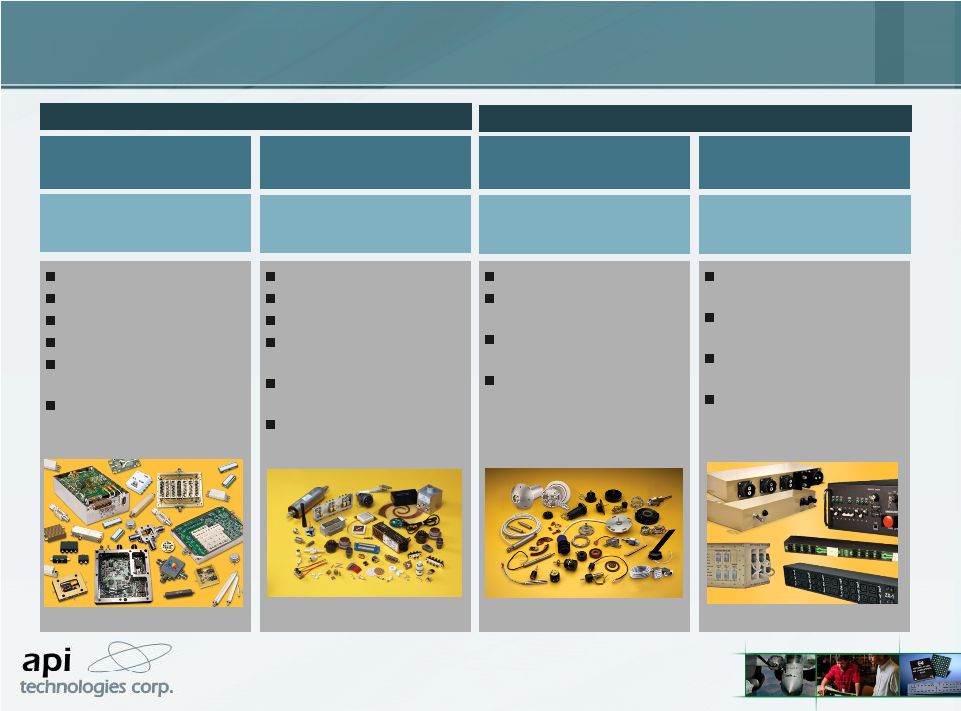
Design and manufacture of
electronics and electro-
mechanical systems
Information assurance products
and services for defense and
commercial customers
API Technologies’
Diverse Product Offering
API Technologies’
Diverse Product Offering
(1)
Electronics Manufacturing Services
(2)
LTM period ending February 28, 2011
Secure Communications
EMS
(1)
LTM
(2)
PF Revenue: $155MM
(75% of total)
LTM
(2)
PF Revenue: $20MM
(10% of total)
Custom and off-the-shelf
systems, hybrids, components
and services
Systems & Subsystems
Solutions
LTM
(2)
PF Revenue: $31MM
(15% of total)
Netgard™
Encryption Suite
Lightweight
Com Suite
ION™SA5600
Secure Appliance
TEMPEST VoIP
Phone
Raytheon Circuit
Board Re-Design
IFTE Shelter
Night Vision Test Set
CRATE Adapter
NHi-1565
Dual Transceiver
API™
Tunable
Filter
API™
Hawk i™
Video Aiming Device
Custom Magnetics |
 15
API Technologies’
Key Capabilities and
Differentiators
API Technologies’
Key Capabilities and
Differentiators
High degree of technical proficiency which allows early engagement with customers
on new products –
One in six employees is an engineer
–
Winner
of
the
2011
Edison
Award
for
Best
New
Product
and
multiple
“Top
Preferred
Supplier”
award
winner
Products are typically designed in, which ties API Technologies to the customer and
locks in future product sales
–
>95% re-compete win rate; 50% win rate on new contract bids
Decades-long relationships with key defense contractors, including Boeing,
General Dynamics, Lockheed Martin, Northrop Grumman and Raytheon
Supplier of systems and subsystems for major defense programs, including most
jamming and counter jamming programs, radar programs both transmit and
receive functions, portable electronic shelter test equipment and most major
missile programs. Also a supplier to some critical commercial applications,
including custom security devices for a major financial institution
Highly flexible production facilities that can produce quick turnaround single
product prototypes or readily scale for large volume, mil spec production
runs |
 16
API Technologies' Key Customer Relationships
API Technologies' Key Customer Relationships
Key Relationships
Top 10 Customers
Tenure
(Years)
Anaren Microwave
6
Boeing
> 20
Canadian Government
> 20
Leading Financial Institution
2
MKS Instruments
12
Northrop Grumman
16
Raytheon
> 20
Syracuse Research
7
Telephonics
6
U.S. Department of Defense
>20
Strong, long-standing relationships
Develop products collaboratively with customers
Direct supplier to the U.S., U.K., and Canadian
governments, with several cleared facilities |
 17
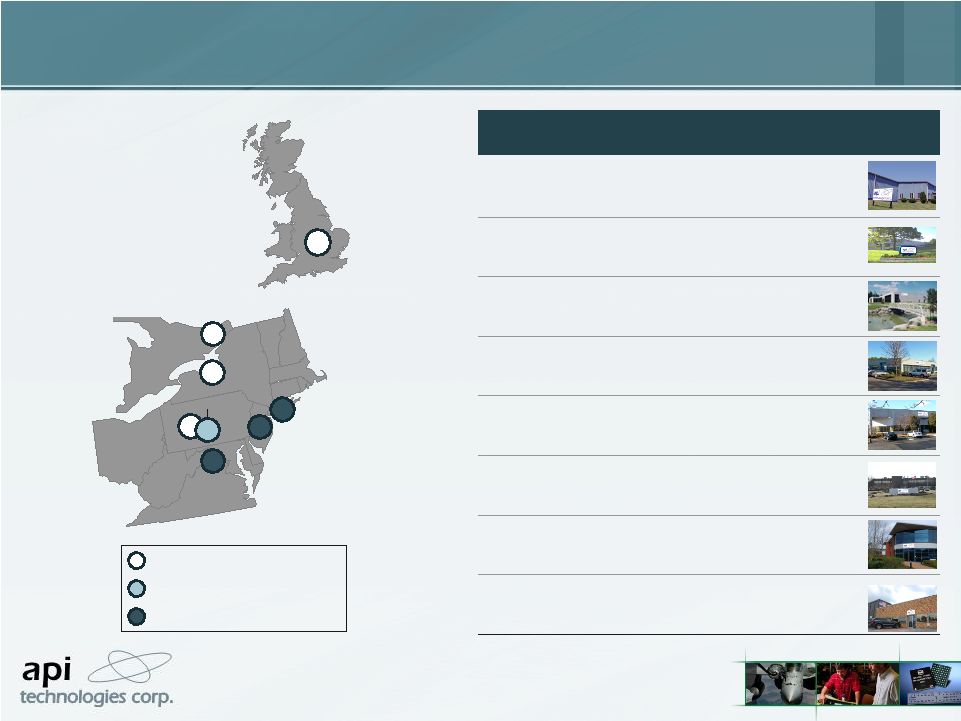
API Technologies’
Manufacturing Footprint
API Technologies’
Manufacturing Footprint
(1)
Approximately 20 miles from Windber facility
(2) Electronics Manufacturing Services
Ronkonkoma, NY
Fairport, NY
Kanata, ON
Windber, PA
Sterling, VA
South Plainfield, NJ
Design & Manufacturing
Manufacturing
Design
Facility
Size
(Sq. Ft.)
Key Products
Alum Bank, PA
(1)
10,000
Subsystems & Systems,
Magnetics
Fairport, NY
80,000
EMS
(2)
Kanata, Canada
30,000
Secure Communications,
Filters & Magnetics
Ronkonkoma, NY
4,100
Subsystems & Systems
South Plainfield, NJ
7,000
Secure Communications
Sterling, VA
17,000
Secure Communications
Waterwells, U.K.
23,000
Secure Communications
Windber, PA
107,000
Flagship Facility, EMS
(2)
,
Subsystems & Systems,
Secure Communications
Waterwells, U.K.
Alum Bank, PA |
 18
Spectrum Control’s Highly Diverse Product
Offering
Spectrum Control’s Highly Diverse Product
Offering
Thin Film Hybrids
SAW Modules
Filters and Components
High Power Amplifiers
Data Acquisition (A/D-
D/A)
Integrated Assemblies
and Subsystems
Antennas
Specialty Connectors
Power Film Modules
Filtered Interconnect
Devices
EMI Filters, Components
and Modules
Advanced Ceramics and
Assemblies
Inertia Sensors
Inertial Measurement
Systems
Precision Position
Sensors
Temperature Sensing
Probes & Assemblies
AC Power Strips and
Solutions
AC & DC Sequenced
Power Distribution
AC & DC Power
Monitoring Solutions
Customized Solutions for
Extreme Military
Applications
RF / Microwave
LTM
(1)
Revenue: $82MM
(49% of total)
Advanced Specialty
Products
Sensors
Power Systems
Management
(1)
LTM period ending February 28, 2011
LTM
(1)
Revenue: $51MM
(31% of total)
LTM
(1)
Revenue: $23MM
(14% of total)
LTM
(1)
Revenue: $11MM
(7% of total)
RF / Microwave
Non –
RF / Microwave |
 19
15%
14%
35%
14%
22%
11%
10%
13%
16%
24%
12%
14%
17%
8%
54%
11%
10%
10%
90%
Spectrum Control’s Highly Diverse End Markets
Spectrum Control’s Highly Diverse End Markets
Based on LTM
(1)
Revenue
RF / Microwave
Military Comm.
Commercial
Military
Radar
Military
Force Protection
Other
Military
Advanced Specialty Products
Military Aircraft
Military
Comm.
Comm.
Equipment
Aircraft
Comm.
Other Military
Industrial
Comm.
Other Comm.
Sensors
Military Defense
Other Commercial
Other
Military
Med Comm.
Industrial /
Control Comm.
Power Systems Management
Military
Commercial
(1)
LTM period ending February 28, 2011 |
 20
Sole / long-term design-in or primary source positions
One
of
the
largest
selections
of
RF
/
microwave
filters
for
high
reliability
applications
worldwide
and a
broad selection of custom integrated microwave assemblies
Extensive vertical integration, including self-sourcing of raw material and
packages, which drives market-leading turnaround times
Highly effective and well proven design systems
–
Team of over 165 creative innovators
–
Large percentage of proprietary processes and technologies
Highly flexible, low-cost facilities
–
Low cost manufacturing facilities in Wesson, MS, Mexico and China
–
All processes, documentation and equipment are standard throughout operations
Deep
customer
relationships
driven
by
total
involvement
early
in
product
design
cycles
and
a
dedicated
focus on customer service
Spectrum Control’s Key Capabilities and
Differentiators
Spectrum Control’s Key Capabilities and
Differentiators |
 21
Spectrum Control’s Highly Diverse Customer
Base
Spectrum Control’s Highly Diverse Customer
Base
Key Defense Relationships
Key Commercial Relationships
Top 10 Customers
Tenure
(Years)
Alcatel / Lucent
15
Ciena
10
General Dynamics
> 20
Goodrich
> 20
Harris
7
Lockheed Martin
> 20
Northrop Grumman
> 20
Raytheon
> 20
Rockwell Collins
> 20
Syracuse Research
7
Strong, long-standing relationships
No customer represents more than 10% of sales
Top 10 customers represent less than 40% of sales
Has several DoD-cleared facilities |
 22
Spectrum Control’s Highly Diverse Program
Exposure
Spectrum Control’s Highly Diverse Program
Exposure
Defense
Commercial
Communications Equipment (BGAN, CATV, Data Storage, DISA/GOVT
Comm., LNB Converters, Optical Networking, VOIP, Wireless Systems)
Aircraft (A350, A380, B737, B787, VLS)
Medical (Heart Pump, Robotic Surgery, Vascular Injection Systems)
Industrial/Control (Alternative Energy, Cattle Tracking, HVAC, Industrial
Measuring, Mercury I/II Encoder, Refrigeration)
Radar (Airport, Weather)
Missile Defense (Hell Fire, HTS, Hydra, Missile Separation Testing,
Patriot, THAAD)
Communications (AEHF, FAB-T, Falcon, JTRS, Liberty, NMT, WIN-T)
Aircraft (Eurofighter Radar, F16, F18, JSF, UAV’s)
Radar (AEGIS, ARPDD, LAMPS, MMRS, SARS)
Electronic Warfare (AIDEWS, ASPIS, ELINT, Global Hawk, IFM, Peace
Pioneer, Surveillance Receiver)
Force Protection (G/Ator, LCMR, Symphony)
Land Vehicles (DCSS Gen II) |
 23
Spectrum Control’s Long History of Revenue
Growth, Profitability and Free Cash Flow Generation
Spectrum Control’s Long History of Revenue
Growth, Profitability and Free Cash Flow Generation
57.2
63.0
80.5
98.4
125.7
136.5
130.7
132.3
163.9
167.3
0
20
40
60
80
100
120
140
160
180
2002
2003
2004
2005
2006
2007
2008
2009
2010
LTM
0
2
4
6
8
10
12
14
16
18
Revenue and Adjusted EBITDA Margin
Free Cash Flow
(1)
1.8
4.2
8.1
7.6
5.1
16.9
14.3
15.3
21.9
23.9
0
5
10
15
20
25
2002
2003
2004
2005
2006
2007
2008
2009
2010
LTM
(1)
Free
Cash
Flow
=
Adjusted
EBITDA
–
Capital
Expenditures
(2)
LTM period ending February 28, 2011
(3)
Spectrum Control no longer has a presence in New Orleans
(2)
(2)
$MM; FY 11/30
$MM; FY 11/30
% Margin
Hurricane Katrina
(3) |
 24
Spectrum Control’s Manufacturing Footprint
Spectrum Control’s Manufacturing Footprint
Manufacturing Footprint
Key
RF/Microwave
Sensors
Advanced Specialty Products
Low Cost Manufacturing Centers
Power Systems Management
Corporate
State College, PA
State College, PA
Corporate Office
Fairview, PA
RF/Microwave
Key Products
22,000
Size (Ft²)
Auburn, NY
Facility
Short Metal Fabrication, Film
Capacitor Winding, CNC Multi-
Aris Connector Machining
Key Products
55,000
Size (Ft²)
Wesson, MS
Facility
Commercial Product
Manufacturing –
All Businesses.
Able to produce defense products
under MLA’s
Key Products
50,000
Size (Ft²)
Juarez, Mexico
Facility
Sensors
Key Products
16,000
Size (Ft²)
Grass Valley, CA
Facility
Sensors
Key Products
22,000
Size (Ft²)
Saint Mary’s, PA
Facility
Facility
Key Products
Sensors
12,000
Size (Ft²)
Akron, OH
Fairview, PA
Facility
Advanced Specialty Products
Key Products
43,000
Size (Ft²)
Corporate Offices, Centralized
Services
Key Products
10,000
Size (Ft²)
Fairview, PA
Facility
RF/Microwave, Advanced
Specialty Products, Power
Systems Management
Key Products
250,000
Size (Ft²)
State College, PA
Facility
RF/Microwave
Key Products
15,000
Size (Ft²)
Delmar, DE
Facility
RF/Microwave
Key Products
20,000
Size (Ft²)
Philadelphia, PA
Facility
RF/Microwave
Key Products
43,000
Size (Ft²)
Marlborough, MA
Facility
Key Products
RF/Microwave
39,000
Size (Ft²)
Nashua, NH
Facility
RF/Microwave
Key Products
7,000
Size (Ft²)
Columbia, MD
Facility
Commercial Product
Manufacturing –
All Businesses.
Material Procurement Center for
all businesses
Key Products
70,000
Size (Ft²)
Dongguan, China
Facility
RF/Microwave
Key Products
51,000
Size (Ft²)
Palm Bay, FL
Facility
Owned Facility
*
*
*
*
*
*
*
*
*
* |
 Key
Investor Highlights Key Investor Highlights |
 26
Investor Highlights Summary
Investor Highlights Summary
Niche, Market Leading
Positions
Experienced Management
Team
Diverse, Blue-Chip
Customer Base
Attractive End Markets
Significant Cost Reductions /
Synergies
Compelling Financial
Profile
Long-standing, deep relationships with a broad group of leading defense and
commercial companies Over 1,500 customers with exposure to multiple end
markets Diverse and attractive mix of over 350 programs / products
Digitization of the battlefield drives favorable long-term outlook for defense
electronics manufacturers Attractive
positions
on
growth
defense
platforms
–
e.g.,
C4ISR,
Electronic
Warfare,
IPMEIR,
Missile
Defense,
RADAR and UAVs
Niche, high margin opportunities in the medical, industrial, commercial and
consumer industries ~$8MM in identified cost reductions through public
company and corporate cost takeouts and low risk consolidations
Substantial cross-selling opportunities with increased customer mind
share Vertical integration provides capability to function as
self-sufficient supply chain Highly flexible, low cost production base
Strong cash flow profile driven by capex requirements below 2% of
sales Sole
/
long-term
design-in
or
primary
source
positions
(89%
of
LTM
(1)
sales)
One
of
the
largest
selections
of
RF
/
microwave
filters
for
high
reliability
applications
High degree of technical proficiency and well proven design systems
(1)
LTM period ending February 28, 2011
Average industry experience / tenure of 25 years
Extensive
experience
in
the
successful
integration
of
businesses
worldwide
VCM is an operations focused owner with a history of success integrating and
streamlining assets |
 27
Secure Communications
45%
5%
50%
Other
Primary
Source
RF / Microwave
Advanced Specialty Products
28%
17%
55%
60%
6%
34%
Sensors
Power Systems Management
54%
46%
100%
Sole
Source
Primary
Source
Other
Sole
Source
Other
Primary
Source
Primary
Source
(1)
Electronics Manufacturing Services
(2)
LTM period ending February 28, 2011
One
of
the
largest
selections
of
high
reliability
RF
/
microwave
systems
and
solutions
offerings
worldwide, with 7 filter platforms
~90%
of
EMS
(1)
business
is
“Copy
Exact,”
resulting
in
high
customer
switching
costs
Differentiated products with a large percentage of sole source positions
Niche, Market Leading Positions
Niche, Market Leading Positions
Sole
Source
Sole
Source
EMS
60%
5%
35%
Other
Primary
Source
Sole
Source
Systems & Subsystems
Solutions
10%
10%
80%
Primary
Source
Other
Sole
Source
Sole
Source
API Technologies
(2)
Spectrum Control
(2) |
 28
Diverse, Blue-Chip Customer Base
Diverse, Blue-Chip Customer Base
Long-standing, deep relationships built on
customer collaboration
Over 1,500 customers
Serve all the key defense contractors and a
range of leading commercial companies
Direct supplier to the U.S., U.K and
Canadian governments
Exposed to multiple end markets
Top 10 Customers
Tenure
# of Programs / Projects
> 20
6
> 20
6
7
29
Leading Financial
Institution
2
1
> 20
22
12
21
> 20
12
> 20
38
7
7
6
3 |
 29
Pro Forma Program / Project Exposure
(1)
25.5%
1.6%
5.5%
5.5%
49.8%
Major Jamming and Anti-jamming Programs
Black Secure Communication Programs
Major U.S. DoD Air-to-Air Missile Programs
Major Financial Institution/Security Device
U.S. Government R&D Programs, 1.5%
Data Storage, 1.4%
Ship Turbine Generators Electronics, 1.3%
Major Helicopter and Fighter Jets Programs, 1.3%
Military Radios, 1.2%
Optical Network, 1.1%
Counter Mortar Radar, 1.0%
Portable Jamming Device, 0.9%
Wireless Data Storage, 0.8%
RF/SatCom Program, 0.8%
Other
HVAC, 0.8%
Diverse and Attractive Program / Project
Exposure
Diverse and Attractive Program / Project
Exposure
Over 350 programs / projects
Top 15 programs / projects represent only 50% of sales
(1)
Based on pro forma revenues for the LTM period ending February 28, 2011
|
 30
297
328
365
377
400
411
432
480
513
531
526
143
145
150
153
155
204
215
221
220
233
113
118
126
130
137
75
76
74
71
69
316
345
437
468
479
535
601
667
666
693
685
671
571
586
598
611
553
0
150
300
450
600
750
FY01
FY02
FY03
FY04
FY05
FY06
FY07
FY08
FY09
FY10
FY11
FY12E
FY13E
FY14E
FY15E
FY16E
Department of Defense Budget
Source: Department of Defense Comptroller
$Bn
Supplementals (“OCO”War Funding)
Base Discretionary Budget Authority
Construction, Housing & Other
Military Personnel
Procurement
Operation & Maintenance
RDT&E, Total Discretionary Base Budget
Attractive End Markets
Attractive End Markets
10.6
11.6
12.5
13.3
8.6
9.5
0.0
2.0
4.0
6.0
8.0
10.0
12.0
14.0
16.0
2010A
2011E
2012E
2013E
2014E
2015E
Cyber / Intel Funding Forecast
$Bn
Source: INPUT Research
Positioned to benefit from the continued digitization of the battlefield
–
High content on future platforms
–
Retrofitting and upgrade of existing equipment and technologies
Growing numbers of applications in secure data transmission and precision remote
object guidance are driving increased demand for RF and microwave
technologies Next generation communications systems are driving a critical
need for bandwidth across defense, aerospace and industrial end
markets Further diversified into growing, high margin opportunities within
the medical, industrial, commercial and consumer industries |
 31
Public Company Costs
–
Audit fees
–
Director fees
–
Financial public relations
–
D&O insurance
Corporate Head Office Costs
–
HQ operating expenses
–
President & CEO
–
CFO
Cost Reduction and Consolidation Activities
–
Segment consolidations
–
Facility consolidations
–
Transfer of commercial product
platforms to China / Mexico
–
Centralization of sales, marketing,
planning and purchasing
–
Elimination of external machining
New Corporate Staff
–
New President & COO
–
New CFO
Significant Cost Reductions / Synergies
Significant Cost Reductions / Synergies
(1)
LTM period ending February 28, 2011
Cost Reductions Summary
59.8
(1.1)
5.9
1.6
1.4
51.9
44
46
48
50
52
54
56
58
60
62
64
LTM
Adj. EBITDA
Public
Company Costs
Corporate Head
Office Costs
Cost
Reductions
& Consolidation
Activities
New
Corporate
Staff
LTM
Adj. EBITDA +
Synergies
Cost Reductions / Synergies = $7.9MM
$MM
(1)
(1) |
 32
Highly Flexible, Low Cost Production
Base
Highly Flexible, Low Cost Production
Base
Production Base
Differentiators
Description
Vertical Integration
Self-sufficient and autonomous supply chain at Spectrum Control
Extremely quick new design turnarounds
Short
product
lead-times
-
less
than
4
weeks
High Flexibility
Non-unionized work force with at will contracts
Majority of facilities operate single shifts
Low Cost
Facilities in Wesson, MS, Mexico and China
Mexico facility has certifications to produce cost-sensitive ITAR
controlled products
Low Capital Requirements
CapEx / Sales of ~1.5% |
 33
Experienced Management Team
Experienced Management Team
Jack Freeman, CFO of Spectrum Control
Appointed to the position of CFO of Spectrum Control in 1990
Previously was a Principal with the Certified Public Accounting firm of Root,
Spitznas & Smiley, Inc. Holds a B.A. in Accounting from Gannon
University and CPA and CMA certifications Ken Fiske, CEO, SenDEC
Founded SenDEC in 1972
Previously worked for Xerox Corporation as an engineer, technical specialist, and
engineering manager Completed advanced studies at both the University of
Rochester and the Rochester Institute of Technology Steve Pudles, CEO, API
Defense USA Joined API in 2008, bringing more than 25 years of electronics
industry experience Previously
was
President
and
CEO
of
Nu
Visions
Manufacturing
and
Executive
Vice
President
of
OnCore
Manufacturing
Holds a M.S. and B.S. of Engineering from Stevens Institute of Technology
Bob McKenna, Senior Vice President, Spectrum Control
Joined Spectrum Control in 1991 and became SVP of New Business Development in
2001 Has progressed through positions in administration, operations (P/L)
and global sales Holds a B.S. Degree from Gannon University and graduate
studies at St. Mary’s and Edinboro Universities Bel Lazar, President
& COO of API Technologies Over 25 years of experience in the defense,
semiconductor and technology sectors Most recently served as the Senior Vice
President of Operations at Microsemi Corporation Previously spent over 22
years at International Rectifier in expanding leadership and general management roles, culminating
as Vice President of the Company’s Aerospace & Defense business unit
Has completed over 25 consolidations within the Aerospace & Defense
electronics sector Holds a B.S. in Engineering from California State
University, Northridge, a M.S. degree in Computer Engineering from the
University of Southern California, and a Juris Doctor degree from Southwestern
University School of Law |
 Financial Overview
 |
 35
Presentation of Historical Financials
Presentation of Historical Financials
Historical results for 2010 and the LTM period ended February 28, 2011 are
presented on a combined pro forma basis for API Technologies and Spectrum
Control –
API Technologies’
results are pro forma for its acquisitions of SenDEC and the Kuchera Companies
(“Kuchera”) Historical results for 2007, 2008 and 2009 are
presented on a combined basis for API Technologies, SenDEC
and
Spectrum
Control
without
adjusting
for
API
Technologies’
acquisitions
of
Kuchera
and
Cryptek
–
For
FYE
06/30/09,
Kuchera
Defense
had
revenues
of
$48MM
and
gross
profit
of
$11MM
(1)
–
For
FYE
12/31/08,
Kuchera
Industries
had
revenues
of
$21MM
and
gross
profit
of
$7MM
(1)
–
For
FYE
12/31/08,
Cryptek
had
revenues
of
$34MM
and
gross
profit
of
$10MM
(2)
Adjusted EBITDA is presented excluding:
–
Stock based compensation
–
One-time charges including restructuring charges and acquisition related
expenses –
Discontinued operations
–
Already completed cost take-outs and consolidations at API Technologies, the
benefits of which are not fully reflected in its most recent reported
financial results –
Identified cost savings associated with the acquisition of Spectrum Control
Historicals results are presented on a November 30 fiscal year basis:
–
API Technologies results derived from filed May 30 year end 10-Ks and
10-Qs –
SenDEC
results
derived
from
monthly
accounts
(3)
–
Spectrum
Control
results
derived
from
filed
November
30
year
end
10-Ks
and
10-Qs
(1)
See
API
Technologies’
8-K
filed
on
March
2,
2010
(2)
See
API
Technologies’
8-K
filed
on
December
24,
2009
(3)
SenDEC had a financial year end of July 31 prior to its acquisition by API
Technologies |
 36
Historical Financials
Historical Financials
$MM; FYE 11/30
Not Pro Forma
(1)
2007A
2008A
2009A
2010A
PF LTM 2/28/11
API Technologies
27.2
29.9
32.8
110.0
101.1
SenDEC
47.5
32.6
47.4
107.5
104.8
Spectrum Control
136.5
130.7
132.3
163.9
167.3
Revenue
$211.2
$193.2
$212.4
$381.4
$373.1
API Technologies
7.1
4.3
8.0
28.1
24.5
SenDEC
10.3
4.6
7.9
16.3
15.5
Spectrum Control
36.4
32.8
34.4
44.1
45.4
Synergies
–
–
–
–
2.1
Gross Profit
$53.8
$41.7
$50.3
$88.5
$87.5
% Margin
25.5%
21.6%
23.7%
23.2%
23.5%
API Technologies
0.8
0.1
2.6
9.9
12.9
SenDEC
5.9
0.0
2.9
9.4
9.1
Spectrum Control
22.7
18.8
19.2
28.3
30.0
Synergies
–
–
–
–
7.9
Pro Forma Adjusted EBITDA
(2)
$29.4
$19.0
$24.7
$47.6
$59.8
% Margin
13.9%
9.8%
11.6%
12.5%
16.0%
API Technologies
0.8
0.6
0.2
2.5
2.4
SenDEC
0.5
0.9
0.6
2.0
3.6
Spectrum Control
5.8
4.4
4.0
6.4
6.1
Capex
$7.1
$5.9
$4.7
$10.9
$12.1
% Revenues
3.4%
3.0%
2.2%
2.9%
3.2%
(1)
2007
–
2009
are
not
pro
forma
for
API
Technologies’
acquisitions
of
Cryptek
and
Kuchera
(2)
See EBITDA reconciliation on page 38
Note: Information for SenDEC reflects only that portion of SenDEC’s business
acquired by API Technologies |
 37
Pro Forma Balance Sheet
Pro Forma Balance Sheet
$MM; as of 2/28/11
API Technologies
(1)
Spectrum
Control
(2)
Adjustments
Pro Forma
Assets
Current Assets
Cash
13.2
3.7
1.5
18.4
Marketable Securities
0.3
–
–
0.3
Accounts Receivable
21.1
28.6
–
49.7
Inventory
36.0
39.3
–
75.2
Prepaid Expenses and Others
1.6
4.4
–
6.0
Total Current Assets
$72.2
$76.0
$1.5
$149.6
Property and Equipment, Net
16.9
28.6
–
45.5
Other Assets
New Goodwill
–
–
150.9
150.9
Existing Goodwill
87.0
45.9
(45.9)
87.0
Intangibles
8.6
9.3
50.3
68.2
Other Assets
–
1.7
–
1.7
Transaction Costs / Financing Fees
–
–
6.7
6.7
Total Other Assets
$95.7
$56.9
$162.0
$314.6
Total Assets
$184.7
$161.5
$163.5
$509.7
Liabilities
and
Shareholders’
Equity
Current Liabilities
Accounts Payable
19.7
11.3
–
31.0
Accrued Expenses and Other
1.3
1.5
–
2.8
Total Current Liabilities
$21.0
$12.9
–
$33.9
Deferred Taxes
0.3
11.3
18.6
30.2
Other Noncurrent Liabilities
–
0.4
–
0.4
Total Debt
Existing Bank Debt
0.7
3.4
(4.1)
–
Existing Seller Note Payable
9.1
–
(9.1)
–
Mortgage Loan & Capital Lease Payable
1.7
–
–
1.7
New Senior Secured Term Loan B
–
–
200.0
200.0
Total Debt
$11.5
$3.4
$186.8
$201.7
Shareholders’
Equity
Common Stock
151.9
133.5
(41.9)
243.5
Total Shareholders’
Equity
$151.9
$133.5
($41.9)
$243.5
Total Liabilities & Shareholder’s Equity
$184.7
$161.5
$163.5
$509.7
(3)
(3)
(3)
(4)
(5)
(4)
(6)
Memo:
Liquid
assets
(7)
cover
56%
of
total
debt;
Hard
assets
(8)
cover
78%
of
total
debt |
 EBITDA
Reconciliation EBITDA Reconciliation
$MM; FY 11/30
Not Pro forma
(1)
2007A
2008A
2009A
2010A
LTM 2/28/11
API Technologies (Stand Alone)
EBITDA (Unadjusted)
(1.1)
(7.4)
(0.9)
3.5
(3.8)
+ Stock Based Compensation
1.0
0.9
1.1
1.4
0.8
+ Restructuring Charges
(2)
–
0.7
0.4
3.5
3.3
+ Acquisitions Related Charges
(3)
–
–
1.1
1.4
6.6
+ Provision for Inventory Writedown
(4)
–
2.8
–
–
–
+ Costs from NanoOpto
(Discontinued Operations)
(5)
0.9
3.1
0.9
–
–
Adjusted API Technologies EBITDA
0.8
0.1
2.6
9.9
7.0
+ Corporate Office Cost Reductions (Toronto)
(6)
–
–
–
–
1.3
+
Existing
Consolidations
Still
to
be
Realized
(7)
–
–
–
–
2.1
+ New API Cost Reduction Plan
(8)
–
–
–
–
2.5
= Pro Forma Adjusted API Technologies EBITDA
$0.8
$0.1
$2.6
$9.9
$12.9
SenDEC
(Stand Alone)
EBITDA (Unadjusted)
2.5
(0.1)
2.9
7.9
0.4
+ Stock Based Compensation
2.1
–
–
0.1
0.1
+ Extraordinary Bonus
(9)
1.2
0.1
–
1.3
1.3
+ Acquisition Related Charges
(3)
–
–
–
–
7.3
= Adjusted SenDEC
EBITDA
$5.9
$0.0
$2.9
$9.4
$9.1
Spectrum Control
EBITDA (Unadjusted)
22.7
18.5
19.3
27.3
28.9
+ Stock Based Compensation
0.0
0.3
0.4
0.6
0.7
+ Acquisition Related Charges
(10)
–
–
–
0.4
0.4
-
Gain
on
Insurance
Recovery
(11)
–
–
(0.5)
–
–
= Adjusted Spectrum Control EBITDA
$22.7
$18.8
$19.2
$28.3
$30.0
= Pro Forma Adjusted EBITDA (without synergies)
$29.4
$19.0
$24.7
$47.6
$51.9
+
Spectrum
Synergies
(Run-Rate)
(12)
–
–
–
–
7.9
= Pro Forma Adjusted EBITDA (with synergies)
$29.4
$19.0
$24.7
$47.6
$59.8
38
(1)
2007 – 2009 are not pro forma for acquisitions, of Cryptek and Kuchera
(2)
Related to cost cutting initiatives to rationalize the number of API Technologies’ facilities
from 8 to 3 following the acquisitions of Cryptek and Kuchera (3)
Fees and expenses related to the acquisitions of Cryptek, Kuchera and SenDEC
(4)
Accounting charge versus prior period regarding treatment of slow moving inventory
(5)
API Technologies sold the assets of NanoOpto on June 15, 2010
(6)
Elimination of legacy SenDEC corporate office costs post the acquisition
(7)
Run rate cost savings from completed consolidation of Long Island facility to Windber, PA
(8)
Identified headcount reductions to be completed by May 31, 2011
(9)
Distributions to former equity owners of SenDEC
(10)
Fees and expenses related to the acquisitions of Summit Instruments, Sage Laboratories and DRS –
Signal Solutions (11)
Excess of insurance recoveries over the carrying value of certain assets destroyed in two separate
involuntary conversions (12)
See page 31 for details
|
 Syndication Summary
 |
 40
Targeted Transaction Timetable
Targeted Transaction Timetable
April
Sun
Mon
Tue
Wed
Thu
Fri
Sat
1
2
3
4
5
6
7
8
9
10
11
12
13
14
15
16
17
18
19
20
21
22
23
24
25
26
27
28
29
30
May
Sun
Mon
Tue
Wed
Thu
Fri
Sat
1
2
3
4
5
6
7
8
9
10
11
12
13
14
15
16
17
18
19
20
21
22
23
24
25
26
27
28
29
30
31
March 28, 2011
API Technologies entered into a definitive agreement to acquire
Spectrum Control
May 4, 2011
Spectrum Control proxy filed with the SEC
May 7, 2011
End of Spectrum Control Go-Shop Period
May 12, 2011
Bank Meeting
May 26, 2011
Lender Commitments Due
May 27, 2011
Spectrum
Control
Shareholders’
Meeting
Week of May 30, 2011
Closing of Acquisition and Credit Facilities
Bank Holiday
End of Go-Shop Period
Key Dates |
 41
Preliminary Summary of Terms
Preliminary Summary of Terms
Summary of Indicative Terms
Borrower:
API Technologies Corp.
Facilities:
Tranche
Amount
Maturity
Pricing
Unused Fee
Revolver
$20 million
3 Years
TBD
50 bps
Term Loan B
$200 million
7 Years
TBD
N/A
Lead Arranger:
Morgan Stanley
Admin Agent:
Morgan Stanley
Guarantors:
All existing and future wholly-owned direct and indirect material U.S. and
Canadian subsidiaries Security:
First priority lien on substantially all assets of the Borrower and the
Guarantors Term Loan Amortization:
1% per annum with balance due at maturity
Optional Prepayments:
101% soft-call for Year 1; pre-payable at par thereafter
Mandatory Prepayments:
•
To include 100% of debt issuances, 100% of asset sales and 50% of excess cash flow
with step- downs to 25% and 0% based on leverage
Financial Covenants:
•
Usual and customary for transactions of this type, including the following:
(i) Maximum Total Leverage
(ii) Minimum Interest Coverage
Negative Covenants:
Usual and customary for transactions of this type, including limitations on
indebtedness, liens, asset sales, mergers and consolidation, restricted
payments, capital expenditures, sale leasebacks, investments and
acquisitions |
 Public-Side Questions & Answers
 |
 Appendix
 |
 44
Net Income to EBITDA Reconciliation
Net Income to EBITDA Reconciliation
(1)
Not
pro
forma
for
API
Technologies’
acquisitions
of
Cryptek
and
Kuchera
$MM; FY 11/30
Not Pro Forma
(1)
2007A
2008A
2009A
2010A
LTM 2/28/11
API Technologies (Stand Alone)
Net Income: (Unadjusted)
(2.2)
(7.4)
(6.4)
(6.1)
(11.8)
+ Income Taxes
0.1
(0.5)
0.1
0.0
0.2
+ Interest Expense
0.1
0.2
0.2
4.4
7.2
+ Depreciation & Amortization
0.9
1.2
0.9
1.6
1.6
+/-
Discontinued Operations
-
-
6.1
3.8
(0.2)
+/-
Other Expense (Income), Net
0.0
(0.8)
(1.7)
(0.2)
(0.9)
API Technologies Unadjusted EBITDA
$(1.1)
$(7.4)
$(0.9)
$3.5
$(3.8)
SenDEC (Stand Alone)
Net Income: (Unadjusted)
0.9
(0.9)
1.0
4.0
(1.4)
+ Income Taxes
0.4
(0.4)
0.6
2.5
0.2
+ Interest Expense
0.3
0.2
0.1
0.3
0.3
+ Depreciation & Amortization
0.9
1.1
1.2
1.2
1.3
+/-
Other Expense (Income), Net
(0.0)
(0.0)
(0.1)
0.0
0.0
SenDEC Unadjusted EBITDA
$2.5
$(0.1)
$2.9
$7.9
$0.4
Spectrum Control
Net Income: (Unadjusted)
11.1
8.9
8.6
12.8
13.7
+ Income Taxes
6.4
4.6
4.8
7.5
7.7
+ Interest Expense
0.6
0.4
0.2
0.1
0.1
+ Depreciation & Amortization
4.8
5.2
5.7
6.9
7.3
+/-
Other Expense (Income), Net
(0.3)
(0.5)
0.0
0.0
0.1
Spectrum Control Unadjusted EBITDA
$22.7
$18.5
$19.3
$27.3
$28.9
= Pro Forma Unadjusted EBITDA
$24.1
$11.1
$21.4
$38.8
$25.4 |