Attached files
| file | filename |
|---|---|
| EX-21 - EX-21 - API Technologies Corp. | d834928dex21.htm |
| EX-32.1 - EX-32.1 - API Technologies Corp. | d834928dex321.htm |
| EX-31.1 - EX-31.1 - API Technologies Corp. | d834928dex311.htm |
| EX-31.2 - EX-31.2 - API Technologies Corp. | d834928dex312.htm |
| EX-23.1 - EX-23.1 - API Technologies Corp. | d834928dex231.htm |
| EXCEL - IDEA: XBRL DOCUMENT - API Technologies Corp. | Financial_Report.xls |
| EX-32.2 - EX-32.2 - API Technologies Corp. | d834928dex322.htm |
Table of Contents
UNITED STATES
SECURITIES AND EXCHANGE COMMISSION
WASHINGTON, D.C. 20549
FORM 10-K
| x | ANNUAL REPORT PURSUANT TO SECTION 13 OR 15 (d) OF THE SECURITIES ACT OF 1934 |
For the fiscal year ended November 30, 2014
| ¨ | TRANSITION REPORT PURSUANT TO SECTION 13 OR 15(d) OF THE SECURITIES EXCHANGE ACT OF 1934 |
For the transition period from to
Commission file number 001-35214
API TECHNOLOGIES CORP.
(Exact Name of Registrant as Specified in its Charter)
| Delaware | 98-0200798 | |
| (State or Other Jurisdiction of Incorporation or Organization) |
(I.R.S. Employer Identification No.) |
| 4705 S. Apopka Vineland Rd. Suite 210 Orlando, FL |
32819 | |
| (Address of Principal Executive Offices) | (Zip Code) |
Registrant’s Telephone Number including area code: (407) 876-0279
Securities registered under Section 12 (b) of the Exchange Act:
| Title of Each Class |
Name of Each Exchange on Which Registered | |
| Common Stock, par value $0.001 | The NASDAQ Stock Market LLC |
Securities registered under Section 12 (g) of the Exchange Act:
None
(Title of Class)
Indicate by check mark if the registrant is well-known seasoned issuer, as defined in Rule 405 of the Securities Act. Yes ¨ No x
Indicate by check mark if the registrant is not required to file reports pursuant to Section 13 or Section 15(d) of the Act. Yes ¨ No x
Indicate by check mark if the registrant (1) filed all reports required to be filed by section 13 or 15 (d) of the Exchange Act during the past 12 months (or for a shorter period that the registrant was required to file such reports), and (2) has been subject to such filing requirements for the past 90 days. Yes x No ¨
Indicate by check mark whether the registrant has submitted electronically and posted on its corporate Web site, if any, every Interactive Data File required to be submitted and posted pursuant to Rule 405 of Regulation S-T (§232.405 of this chapter) during the preceding 12 months (or for such shorter period that the registrant was required to submit and post such files). Yes x No ¨
Indicate by check mark if disclosure of delinquent filers pursuant to Item 405 of Regulation S-K is not contained herein, and will not be contained, to the best of registrant’s knowledge, in definitive proxy or information statements incorporated by reference in Part III of this Form 10-K or any amendment to this Form 10-K. x
Indicate by check mark whether the registrant is a large accelerated filer, an accelerated filer, a non-accelerated filer, or a smaller reporting company. See definition of “large accelerated filer,” “accelerated filer,” and “smaller reporting company” in Rule 12b-2 of the Exchange Act. (Check one):
| Large accelerated filer ¨ |
Accelerated filer x | |
| Non-accelerated filer ¨ (do not check if a smaller reporting company) |
Smaller reporting company ¨ |
Indicate by check mark whether the issuer is a shell company (as defined in Rule 12b-2 of the Act). Yes ¨ No x
As of May 31, 2014, the aggregate market value of the registrant’s common stock held by non-affiliates of the registrant was $60,560,646. For the purpose of the foregoing calculation only, all directors and executive officers of the registrant and owners of more than 10% of the registrant’s common stock are assumed to be affiliates of the registrant. This determination of affiliate status is not necessarily conclusive for any other purpose.
As of February 3, 2015, the Company had 55,397,384 shares of common shares issued and outstanding.
DOCUMENTS INCORPORATED BY REFERENCE
Portions of the registrant’s definitive proxy statement to be filed with the Securities and Exchange Commission within 120 days of the end of our fiscal year ended November 30, 2014 are incorporated by reference into Part III.
Table of Contents
Table of Contents
PART I
| ITEM 1. | BUSINESS |
FORWARD LOOKING STATEMENTS
This document and the documents incorporated in this document by reference contain forward-looking statements that are subject to risks and uncertainties. All statements other than statements of historical fact contained in this document and the materials accompanying this document are forward-looking statements.
The forward-looking statements are based on the beliefs of our management, as well as assumptions made by and information currently available to our management. Frequently, but not always, forward-looking statements are identified by the use of the future tense and by words such as “believes,” “expects,” “anticipates,” “intends,” “will,” “may,” “could,” “would,” “projects,” “continues,” “estimates” or similar expressions. Forward-looking statements are not guarantees of future performance and actual results could differ materially from those indicated by the forward-looking statements. Forward-looking statements involve known and unknown risks, uncertainties, and other factors that may cause our or our industry’s actual results, levels of activity, performance or achievements to be materially different from any future results, levels of activity, performance or achievements expressed or implied by the forward-looking statements.
The forward-looking statements contained or incorporated by reference in this document are forward-looking statements within the meaning of Section 27A of the Securities Act of 1933 (“Securities Act”) and Section 21E of the Securities Exchange Act of 1934 (“Exchange Act”) and are subject to the safe harbor created by the Private Securities Litigation Reform Act of 1995. These statements include declarations regarding our plans, intentions, beliefs or current expectations.
Among the important factors that could cause actual results to differ materially from those indicated by forward-looking statements are the risks and uncertainties described under “Risk Factors” and elsewhere in this document and in our other filings with the SEC.
Forward-looking statements are expressly qualified in their entirety by this cautionary statement. The forward-looking statements included in this document are made as of the date of this document and we do not undertake any obligation to update forward-looking statements to reflect new information, subsequent events or otherwise.
Overview of the Company
API Technologies Corp. (“we,” “us,” “our,” the “Company,” or “API”) is a leading provider of high performance Radio Frequency (“RF”) microwave, microelectronic, power, and security solutions. We offer one of the most comprehensive selections of RF, microwave, millimeterwave and microelectronics products in the industry, ranging from components to complete system solutions. We operate through our three business segments—Systems, Subsystems & Components (SSC), Electronic Manufacturing Services (EMS) and Secure Systems & Information Assurance (SSIA).
Our primary end markets are defense, high- reliability commercial and industrial, and non-defense government. Our products may be found in a variety of applications including commercial aircraft systems, mobile and wireless systems, radar and imaging systems, missile systems, unmanned systems, spectrum warfare technology, commercial and military satellites, space vehicles, medical devices, and oil and gas industrial systems.
We sell our products through direct sales force and applications engineering staff, a network of independent sales representatives, and distributors, as well as through our web site.
1
Table of Contents
We currently have business offices throughout North America, the United Kingdom, and Germany. Our executive corporate office is located at 4705 S. Apopka Vineland Rd. Suite 210, Orlando, FL 32819, and our telephone number at that location is (407) 876-0279.
Our website address is www.apitech.com. In our web site’s “Investor Relations” section, we make available, free of charge, our annual reports on Form 10-K, quarterly reports on Form 10-Q, current reports on Form 8-K, and amendments to those reports filed or furnished pursuant to Section 13(a) or Section 15(d) of the Securities Exchange Act of 1934, as well as proxy statements, as soon as reasonably practicable after we file electronically such material with, or furnish it to, the SEC. The content on our website is available for information purposes only and is not incorporated by reference. Our common stock trades on the NASDAQ Capital Market under the symbol “ATNY.”
2014 Product Highlights
| • | RF/Microwave & Microelectronics: We introduced over 10 new platforms and key products, including a new line of GaN pulsed power amplifiers in May 2014 and a line of radiation hardened power products for space and satellites in June 2014. We expanded the availability of standard and configurable products and added new, online design tools in August 2014. We continue to achieve major technical milestones with our AESA (“Active Electronically Scanned Array”) subsystem product line. |
| • | Electromagnetic Integrated Solutions (EIS): In September 2014, we introduced a new line of transient energy suppressant High-Altitude Electromagnetic Pulse (“HEMP”) filter products. Additionally, we expanded our line of EIS products for space. In November 2014, we announced the expansion of our filtered circular connectors to Great Yarmouth, UK, which offers broader product access to customers worldwide. |
| • | Power Solutions: The U.S. Department of Defense broadened its adoption of our award-winning Tactical Power Supply product line for use on maritime programs. |
| • | Secure Systems & Information Assurance (SSIA): In November 2014, API, Dell, Inc., ViaSat Inc., Microsoft Corp., and Intel Corp. jointly announced the launch of the Secure Venue Tablet, a mobile computing solution principally for government users. We also extended the capabilities of our ION™ SA5600 secure access platform with FIPS 104-2 validation in February 2014. |
Recent Developments and Financial Highlights
During fiscal 2014, we completed the following transactions:
On March 21, 2014, we entered into Amendment No. 2 to Credit Agreement (the “Amendment No. 2”), by and among the Company, as borrower, the lenders party thereto and Guggenheim Corporate Funding, LLC, as administrative agent (the “Agent”). Amendment No. 2 amends the Credit Agreement, dated as of February 6, 2013, by and among the Company, as borrower, the lenders party thereto and Agent (as amended, supplemented or modified from time to time, the “Term Loan Agreement”) to provide for an incremental term loan facility in an aggregate principal amount equal to $55.0 million (the “Incremental Term Loan Facility”). The Incremental Term Loan Facility is subject to substantially the same terms and conditions, including the applicable interest rate and the maturity date of February 6, 2018, as the $165.0 million term loan facility provided upon the initial closing of the Term Loan Agreement. In addition, Amendment No. 2 amends the Term Loan Agreement to reduce the minimum interest coverage ratio and increase the maximum leverage ratio, among other things. As of November 30, 2014, we have borrowed $121.7 million under the Term Loan Agreement.
The proceeds of the Incremental Term Loan Facility were used (i) to pay in full the amounts due under a Credit Agreement (the “Revolving Loan Agreement”), by and among the Company and certain of its U.S. subsidiaries, as borrowers, the lenders from time to time party thereto and Wells Fargo Bank, National
2
Table of Contents
Association, as administrative agent and U.K. security trustee, which Revolving Loan Agreement was then terminated; (ii) to redeem all 26,000 shares of the Company’s Series A Mandatorily Redeemable Preferred Stock that were outstanding (as described below); (iii) to pay fees, costs and expenses associated with the Incremental Term Loan Facility and related transactions; and (iv) for general corporate purposes.
As of March 21, 2014, we redeemed all 26,000 shares of our Series A Mandatorily Redeemable Preferred Stock that were outstanding. We paid the holder of the Series A Mandatorily Redeemable Preferred Stock an aggregate of $27.6 million to effect the redemption. Following redemption, all shares of Series A Mandatorily Redeemable Preferred Stock were cancelled and such shares were returned to authorized but undesignated shares of preferred stock.
On December 31, 2013, we completed the sale and leaseback (the “Sale/Leaseback”) of the Company’s facility located in State College, Pennsylvania. We sold the facility to an unaffiliated third party for a gross purchase price of approximately $15.5 million and will lease the property from the buyer for approximately $1.3 million per year, subject to annual adjustments. We used $14.2 million of the proceeds of the Sale/Leaseback to reduce our outstanding indebtedness under the Term Loan Agreement.
During fiscal 2013, we completed the following transactions:
On July 5, 2013, we entered into an agreement (the “APA”) with ILC Industries, LLC (“Parent”) and Data Device Corporation, a Delaware corporation and a wholly owned subsidiary of Parent (the “Purchaser”) pursuant to which we sold to the Purchaser certain assets comprising the Company’s data bus business (“Data Bus”) in the U.S. and the U.K., including substantially all of the assets of the Company’s wholly owned subsidiary, National Hybrid, Inc., a New York corporation (the “Asset Sale”). The Purchaser paid us approximately $32.2 million in cash for the assets, after certain adjustments based on closing inventory values as set forth in the APA and customary indemnification provisions. Substantially all of the proceeds from the Asset Sale were used to prepay certain of our outstanding debt.
On April 17, 2013 we sold all of the issued and outstanding shares of capital stock or other equity interests of Spectrum Sensors and Controls, Inc., a Pennsylvania corporation (“Sub 1”), Spectrum Sensors and Controls, LLC, a California limited liability company (“Sub 2”), and Spectrum Sensors and Controls, Inc., an Ohio corporation (“Sub 3” and together with Sub 1 and Sub 2, “Sensors”), for gross cash proceeds of approximately $51.4 million. Of this amount, $1.5 million was placed into an escrow account for 12 months to secure any indemnification claims made by the purchaser against the sellers, API and Spectrum Control, Inc. (“Spectrum”), a wholly owned subsidiary of API.
On February 6, 2013, we refinanced substantially all of our indebtedness. We entered into (i) a Credit Agreement (the “Term Loan Agreement”), by and among the Company, as borrower, the lenders from time to time party thereto and Guggenheim Corporate Funding, LLC, as administrative agent, that provides for a $165.0 million term loan facility; and (ii) a Credit Agreement (the “Revolving Loan Agreement”), by and among the Company and certain of its U.S. subsidiaries, as borrowers, the lenders from time to time party thereto and Wells Fargo Bank, National Association, as administrative agent and U.K. security trustee, that provides for a $50.0 million revolving borrowing base credit facility, with a $10.0 million subfacility (or the Sterling equivalent) for a revolving borrowing base credit facility that is available to certain of the Company’s United Kingdom subsidiaries, a $10.0 million sub-facility for letters of credit and a $5.0 million sub-facility for swingline loans. The proceeds of both loan facilities were used to refinance and pay in full the Company’s existing credit facility by and among the lenders from time to time party thereto and Morgan Stanley Senior Funding, Inc., as administrative agent, lead arranger and sole book-runner, to payoff the term loan facility with Lockman Electronics Holdings Limited, and to pay fees, costs and expenses associated with the refinancing.
3
Table of Contents
During fiscal 2012, we completed the following transactions:
Purchase of C-MAC—On March 22, 2012, we, through our subsidiary API Technologies (UK) Limited (“API UK”), acquired the entire issued share capital of C-MAC Aerospace Limited (“C-MAC”) for a total purchase price of £21.0 million (approximately $33.0 million), including the assumption of C-MAC’s loan facility. C-MAC is a leading provider of high-reliability R/F Microwave, and other electronic systems, modules, and components to the defense, aerospace, space, industrial and energy sectors.
After closing the purchase of C-MAC, we raised $16.0 million of capital in a private placement through the form of a $26.0 million convertible subordinated note (the “Note”).
Series A Mandatorily Redeemable Preferred Stock—On March 22, 2012, our Board approved an amendment to our Amended and Restated Certificate of Incorporation (the “Charter”) to (i) increase the number of our shares of common stock from 100,000,000 to 250,000,000 shares, and (ii) authorize the issuance by the Company’s Board of Directors of up to 10,000,000 shares of Preferred Stock, in one or more series. Our Board of Directors also authorized, subject to the effectiveness of such amendment to the Charter, the creation of a class of Preferred Stock designated as “Series A Mandatorily Redeemable Preferred Stock” (which we also refer to as Series A Preferred Stock) pursuant to a Certificate of Designation (“Certificate of Designation”). Pursuant to the Certificate of Designation, we are authorized to issue 1,000,000 shares of Series A Preferred Stock. Shareholders owning a majority of our common stock on March 22, 2012 approved such actions by a written consent and on May 16, 2012, we filed the amendment to the Charter and filed the Certificate of Designation with the Secretary of State of the State of Delaware, at which time they became effective. At such time, the Note, in accordance with its terms, converted into 26,000 shares of Series A Preferred Stock. As discussed above, the Series A Preferred Stock was subsequently redeemed in March 2014.
Purchase of RTI Electronics—On March 19, 2012 we completed the acquisition of substantially all of the assets of RTI Electronics (“RTIE”) for a total purchase price of approximately $2.3 million, with $1.5 million payable in cash at closing and the remainder pursuant to a Promissory Note of approximately $0.8 million payable in 24 equal monthly installments. Based in Anaheim, California, RTIE is a leading manufacturer of passive electronic components, including thermistors, film capacitors, magnetic transformers and inductors, and audio power conditioning units. RTIE had revenues in the year ended December 31, 2011 of approximately $5.3 million from a diverse Fortune 500 customer base spanning the audio, defense, aerospace, and industrial markets.
Business Strategy
Our business strategy is to increase shareholder value by providing differentiated products to address our customers’ high reliability requirements for the RF/Radio Frequency and microwave, power, and security solutions.
Our strategies to achieve our objectives include:
| • | Broaden International Customer Footprint. Given our expanded availability of standard and configurable products, we are able to execute a targeted sales effort aimed at expanding our presence in international growth markets. The breadth of our product line positions us favorably against competitors, as does our ability to manufacture products in China and Europe. |
| • | Expand Within Customer Base by Leveraging Our Status as a Strategic Supplier to Major OEM Customers. We are an incumbent strategic supplier with products designed-in across a wide range of defense and commercial programs. We intend to leverage our relationships with our Tier 1 and government customers by our performance on existing contracts and actively working with them on new contracts. Our status as a strategic supplier, with many decades of successful heritage, presents us with opportunities to develop and design new products for these OEM customers on a collaborative, solutions-oriented basis giving us an advantage over many of our competitors. |
4
Table of Contents
| • | Leverage Intellectual Property and New Product Introductions to Expand Customer Reach. We believe through our acquisitions of Spectrum Control, Inc. (“Spectrum”), Commercial Microwave Technology, Inc. (“CMT”), C-MAC and RTIE, we have amassed significant body of intellectual property, which we continue to channel into the development and launch of new products. By leveraging our current market position and existing customer relationships, we are able to win adjacent, higher margin, highly engineered products to a global customer audience. |
| • | Target Customers’ Applications Affected by Limited RF Spectrum Availability/Allocation. While available RF spectrum is limited, demand continues to increase, driven primarily by the growing use of mobile and wireless communications technology. API intends to capitalize on its technology expertise in this area of RF filtering technology to introduce new solutions to meet continuously growing customer demand. |
| • | Capitalize on Evolving Defense Requirements. In recent years global government budgets, including the Department of Defense (“DoD”) budget, have reflected increased focus on command, control, communications, computers, collaboration and intelligence, surveillance and reconnaissance, precision -guided weapons, Unmanned Aerial Vehicles (“UAV”) and other electro-mechanical robotic capabilities, networked information technologies, special operations forces, and missile defense. The emphasis on systems interoperability, advances in intelligence gathering, and the provision of real-time relevant data to battle commanders, often referred to as the Common Operating Picture (COP), have increased the electronic content of nearly all major military procurement and research programs. Therefore, we expect that global government budgets for information technologies and defense electronics will be relatively strong, in comparison to other segments of the defense market. We believe our Systems, Subsystems & Components segment, which manufactures components for these items, is well positioned to benefit from the expected focus in those areas. |
| • | Target High Growth Industrial and Commercial Sectors. We intend to actively pursue opportunities in adjacent, high-growth industrial and commercial market sectors that require high-reliability electronics. These sectors include commercial aerospace, mobile communications, satellites, and oil and gas. We believe our technology heritage, differentiated high-reliability portfolio of standard and custom products, and industry certifications, positions us well in this market. Furthermore, the high barrier of entry associated with new competitors entering these market sectors offers fertile ground for us to organically grow our industrial and commercial customer base. |
| • | Continuously Improve our Cost Structure and Business Processes. We intend to continue to aggressively improve and reduce our direct contract and overhead costs, including general and administrative costs, as well as real estate. Effective management of labor, material, subcontractor and other direct costs is a primary element of favorable contract performance. We have taken steps to reduce assembly direct labor costs by locating plants in areas with relatively low-cost labor, including our manufacturing centers in Mexico and China. We believe continuous cost improvement will enable us to increase our cost competitiveness, expand our operating margin and selectively invest in new product development, bids and proposals and other business development activities to organically grow sales and effectively compete in a global marketplace. |
| • | Pursue Strategic Acquisitions, Divestitures and Business Combinations. We periodically review and evaluate potential strategic acquisitions, and we may selectively acquire businesses that add new products, technologies, programs and contracts, or provide access to select customers and provide attractive returns on investment. Furthermore, we periodically consider divestiture and business combination opportunities as a potential means to better align our product portfolio to meet current and future market demands, as well as address strategic business needs and provide shareholder value. |
| • | Developing and Retaining Highly Qualified Management and Technical Employees. The success of our businesses, including our ability to retain existing business and to successfully compete for new business is primarily dependent on the management, marketing and business development, contracting, engineering and technical skills, and knowledge of our employees. We intend to retain and develop our |
5
Table of Contents
| existing employees and recruit and hire new qualified and skilled employees through training, competitive compensation, and organizational and staff development, as well as effective recruiting. |
Corporate Organization and History
API was incorporated on February 2, 1999 under the laws of the State of Delaware under the name Rubincon Ventures Inc. On November 6, 2006, we completed the business combination among API, API Nanotronics Sub, Inc., which we refer to as API Sub, and API Electronics Group Corp., which we refer to as API Ontario. In this business combination, which occurred under Ontario law, API combined with API Ontario, and API Ontario became API’s wholly-owned indirect subsidiary. The holders of common shares of API Ontario were given the right to receive either 0.83 API common shares (which number reflects a subsequent share split and reverse share splits), or if the shareholder elected and was a Canadian taxpayer, 0.83 Exchangeable Shares of API Sub (which number reflects a subsequent share split and reverse share splits). Any API Ontario common shares not exchanged into Exchangeable Shares or API common shares may be cancelled on November 6, 2016.
On November 6, 2006, API changed its name to “API Nanotronics Corp,” and subsequently changed its name to API Technologies Corp. on October 22, 2009.
Operational Restructuring
Commencing in 2010, we began various cost reduction initiatives, including an EMS restructuring that commenced in the third quarter of fiscal 2012, to rationalize the number of our facilities and personnel, which has resulted in us consolidating certain parts of our manufacturing operations. Following the acquisition of Spectrum in June 2011, we implemented further cost reduction initiatives to reduce the number of facilities and personnel that resulted in us consolidating certain of our manufacturing operations, in St. Mary’s, Pennsylvania, Palm Bay, Florida and three other Pennsylvania facilities into other existing locations in the U.S. During the year ended November 30, 2012, we also consolidated certain parts of our C-MAC operations.
On May 31, 2012, we approved a restructuring plan (the “EMS restructuring”) for our EMS lines within our EMS business segment in order to improve the profitability of the EMS businesses. The actions taken as part of the EMS restructuring were intended to realize synergies from our combined EMS operations, contain costs, reduce our exposure to low margin and unprofitable revenue streams within the EMS businesses, and streamline our operations. Elements of the EMS restructuring included management re-alignment, workforce reductions and write-downs and charges related to inventory, fixed assets, and long-term leases. The EMS restructuring was substantially complete at the end of fiscal 2012.
In November 2013, the Company commenced the restructuring of a portion of its Ottawa, Ontario, Canada business (“Ottawa restructuring”) which included the movement of its magnetics operations to its State College, PA and Fairview, PA facilities, in order to improve operating efficiency and ultimately improve profitability. The actions taken as part of the Ottawa restructuring are intended to realize synergies from our combined SSC operations, contain costs and streamline our operations. Elements of the Ottawa restructuring include management re-alignment, workforce reductions and write-downs and charges related to inventory, long-term leases and relocation costs. The Ottawa restructuring was substantially completed by the end of the fourth quarter of fiscal 2014. As a result of the Ottawa restructuring, we reduced our SSC workforce by approximately 4%, which represents approximately 3% of our global workforce.
The collective impact of these changes has resulted in a net reduction of costs of approximately $44.1 million on an annualized basis.
Products
We provide our products to our customers through three principal business segments—Systems, Subsystems & Components, Electronic Manufacturing Services and Secure Systems & Information Assurance.
6
Table of Contents
Systems, Subsystems & Components (SSC)
The Systems, Subsystems & Components segment includes the products of several of our operating subsidiaries, including Spectrum, API Defense Inc., API Defense USA Inc., API Systems Inc., API Microwave Ltd. (formerly RF2M Microwave Ltd.), API Microelectronics Ltd. (formerly RF2M Microelectronics Ltd.), API Electronics, Inc., TM Systems, Keytronics, Filtran Limited, and CMT.
Products offered in the SSC segment include:
| • | RF, Microwave and Millimeterwave Products |
We develop and offer high-performance RF, microwave and millimeter wave solutions for defense, space, commercial and military aircraft, and industrial applications. In addition to offering one of the world’s largest selections of RF and microwave filters for high reliability applications, we specialize in the development of Active Antenna Array Unit (AAAU) subsystems for AESA radar, datalink and satcom applications; high power amplifiers; and custom Integrated Microwave Assemblies (IMAs). Other featured products include active components, antennas, single function assemblies, agile frequency sources, transponders and multi-channel Transmit/Receive modules.
| • | Microcircuits and Microelectronics |
We develop microelectronics products for a broad range of space, defense, commercial, and industrial applications. Products span digital and mixed signal microcircuits, optical data bus products, Multi Chip Modules (MCM), Low Temperature Co-Fired Ceramics (LTCC), power and general purpose hybrids and modules.
| • | Electromagnetic Integrated Solutions (EIS) |
We offer one of the world’s largest selections of high reliability custom and off-the-shelf components for EMC compliance, energy efficiency, and power management, used in defense, aerospace, medical, and industrial applications. The product line features a broad range of EMI filters, power filters, magnetics, thin film capacitors, coaxial filters, specialty connectors, and advanced ceramics.
| • | Power Solutions |
We develop and offer power control and distribution products which cover AC and DC power control and distribution, circuit protection systems, power supplies, Explosive Ordnance Disposal (EOD) products, along with visual landing aids and glide slope indicators.
The SSC product offerings are sold to defense, commercial, and industrial customers, both domestic and international.
Secure Systems & Information Assurance (SSIA)
The Secure Systems & Information Assurance segment includes the products of our operating subsidiaries Emcon Emanation Control Inc., Secure Systems and Technologies Ltd., API Cryptek Inc. and the ION Networks division.
We develop and offer various secure network and hardware solutions spanning TEMPEST and Emanation Security, ruggedized systems, secure access, information assurance products, as well as TEMPEST certification. Products are marketed under the EMCON®, SST™, Cryptek™, ION™, and Netgard® brand names. These product offerings are sold to U.S. and international U.S. friendly governments and military organizations and Fortune 500 firms for which security and information assurance is of paramount importance.
Electronic Manufacturing Services (EMS)
The Electronic Manufacturing Services segment includes the products of our operating subsidiaries API Defense Inc., API Systems Inc. and SenDEC.
7
Table of Contents
We deliver award-winning Electronics Manufacturing Services (EMS) for high-reliability applications to defense, commercial, and medical customers. Offerings span New Product Introductions (NPI) and prototypes, turnkey manufacturing, Printed Circuit Board (PCB) assembly, electro-mechanical assembly, systems integration, test engineering, turnkey box build, and supply chain management.
Financial Information About Segments and Geographical Data
For financial information concerning our reportable segments and geographic regions, refer to note 22 of our consolidated financial statements found in Part II, Item 8 of this Form 10-K.
Sales and Marketing
We use an integrated sales approach across all of our business segments to closely manage relationships at multiple levels of the customers’ organizations, including management, engineering and purchasing personnel. At November 30, 2014 our sales, marketing and customer support team consists of approximately 64 people. Our use of experienced engineers as part of the sales effort facilitates close technical collaboration with our customers during the design and qualification phase of the engagement. We believe that close customer collaboration is critical to ensuring our products are incorporated into our customers’ systems and platforms. Products are sold through direct sales representatives and a network of independent sales representatives, distributors, and agents, with the exception of the Secure Systems and Information Assurance (SSIA) segment. SSIA products are sold almost exclusively by direct sales representatives.
The sales cycle can be long in nature with a protracted design phase. However, once a product is designed into a defense or commercial system, we may be the sole-source or primary source supplier. Due to the extensive qualification process and potential redesign required for using an alternative source, customers are often reluctant to change the incumbent supplier. We attempt to become the incumbent supplier by supporting customers’ early design and engineering efforts, thereby positioning us to realize long-term, recurring revenue throughout the lifecycle of our customers’ products.
In the commercial market, we target industries with high-reliability applications (e.g. communications, space, medical, alternative energy). This enables us to parlay our defense engineering experience into producing products for customers who place a premium on performance, quality, and reliability.
Backlog and Orders
Our sales backlog at November 30, 2014 was approximately $120.7 million compared to approximately $131.0 million at November 30, 2013. Our backlog figures represent confirmed customer purchase orders that we had not shipped at the time the figures were calculated. We anticipate that approximately $86.0 million of our backlog orders will be filled in fiscal 2015. We lack control over the timing of new purchase orders, as such, the backlog can increase or decrease significantly based on timing of customer purchase orders.
| (dollar amounts in thousands) As at November 30 |
||||||||||||
| 2014 | 2013 | % Change |
||||||||||
| Backlog by segments: |
||||||||||||
| SSC |
$ | 98,111 | $ | 96,493 | 1.7 | % | ||||||
| EMS |
19,077 | 25,028 | (23.8 | )% | ||||||||
| SSIA |
3,481 | 9,489 | (63.3 | )% | ||||||||
|
|
|
|
|
|
|
|||||||
| $ | 120,669 | $ | 131,010 | (7.9 | )% | |||||||
|
|
|
|
|
|
|
|||||||
The backlog decrease at November 30, 2014 compared to November 30, 2013 primarily related to our EMS and SSIA segments. The decreases in our EMS and SSIA segments resulted from lower bookings in the year
8
Table of Contents
ended November 30, 2014, and were partially offset by increased SSC bookings in the year ended November 30, 2014.
Seasonality
Revenues for our Secure Systems and Information Assurance (SSIA) segment are typically slightly higher in the three months ended May relative to other quarters, partially related to the fiscal year end of the Canadian and U.K. Governments. Revenues from our Systems, Subsystems & Components (SSC) and Electronic Manufacturing Services (EMS) segment typically do not demonstrate consistent seasonal patterns. Various factors can affect the distribution of our revenue between accounting periods, including the timing of government contract awards and the ensuing subcontracts, the availability of government funding, product deliveries and customer acceptance.
Customers
Our customers consist mainly of military prime contractors and the subcontractors who work for them in the United States, Canada, the United Kingdom and various other countries in the world. Approximately 45%, 47% and 45% of total consolidated revenues for the years ended November 30, 2014, 2013 and 2012, were derived directly or indirectly from defense contracts for end use by the U.S. government and its agencies. The Canadian and United Kingdom Governments’ Departments of Defense (directly and through subcontractors) account for approximately 2% and 9% of our revenues for the year ended November 30, 2014, 2% and 9% of our revenues for the year ended November 30, 2013, and 2% and 9% of our revenues for the year ended November 30, 2012, respectively.
| 2014 | 2013 | 2012 | ||||||||||
| Revenue |
||||||||||||
| United States Department of Defense Direct |
0 | % | 1 | % | 1 | % | ||||||
| United States Department of Defense Prime & Subcontractors |
45 | % | 46 | % | 44 | % | ||||||
One of the U.S. customers, a defense prime contractor, represented approximately 8% of revenues for the year ended November 30, 2014 (8% – 2013 and 7% – 2012). The same customer represented 7%, 5% and 6% of accounts receivable as of November 30, 2014, 2013 and 2012, respectively.
Revenue from such customer primarily derives from our Systems Subsystems & Components (SSC) and Electronic Manufacturing Services (EMS) segments. The loss of such customer could have a material adverse effect on such reporting segments.
Research and Development
We conduct research and development to maintain and advance our technology base. Our research and development efforts are funded by both internal sources and customer-funded development contracts.
Our research and development efforts primarily involve engineering and design relating to: developing new products, improving existing products and adapting existing products to new applications and programs.
A portion of our product development costs are recoverable under contractual arrangements; while the balance of these costs are self-funded. Our self-funded research and development expenditures for continuing operations were approximately $8.3 million, $9.2 million, and $9.6 million, for the years ended November 30, 2014, 2013 and 2012, respectively.
We believe that strategic investment in product development is essential for us to remain competitive in the markets we serve. We are committed to maintaining appropriate levels of expenditures for product development.
9
Table of Contents
Competition
We are engaged in a competitive industry that is characterized by technological change and product life cycles. We face competition from large and mid-tier defense contractors, large semiconductor and electronic component companies to small specialized firms, electronic contract manufacturers, and other companies. Sole and primary source supplier positions provide us a measure of protection against impending competition. This is particularly true of the Systems, Subsystems & Components (SSC) and Secure Systems & Information Assurance (SSIA) segments, where products are designed into programs and platforms that may continue for many years.
In the SSC segment, we are considered one of the world’s largest merchant suppliers of RF microwave and millimeterwave products to the defense and commercial high reliability end markets. We also hold a significant portion, nearly 50%, of the total market share for EMI filtering coaxial and interconnect products. Some of our principal competitors in the SSC segment include Aeroflex Incorporated (NYSE:ARX), Amphenol (NYSE: APH), Cobham plc, DRS.Finmeccanica, K&L Microwave, Kratos Defense & Security Solutions, Inc. (NASDAQ: KTOS), M/A-COM Technology Solutions Inc., and Schaffner Group. In the EMS segment, API is one of a select group of providers to hold ISO-9001:2008, AS9100 and ISO-13485 certifications. Competitors include Ducommun Incorporated (NYSE: DCO) and regional contract manufacturing providers. In the SSIA segment, API Technologies selling through EMCON and SST brand names currently holds approximately 20% of the addressable worldwide market share for TEMPEST products; principal competitors include CIS Secure Computing, Eurotempest, and Advanced Programs, Inc.
The extent of competition in each segment for any single project generally varies according to the complexity of the product and the dollar value of the anticipated award. We believe that we compete on the basis of:
| • | the performance, adaptability and competitive price of our products; |
| • | reputation for prompt and responsive contract performance with a high quality product; |
| • | accumulated technical knowledge and expertise; |
| • | breadth of our product lines; and |
| • | the capabilities of our facilities, equipment and personnel to undertake the programs for which we compete. |
Our future success will depend in large part upon our ability to improve existing product lines and to develop new products and technologies in the same or related fields. Since a number of consolidations and mergers of defense suppliers has occurred, the number of participants in the defense industry has decreased in recent years. We expect this consolidation trend to continue. As the industry consolidates, the large defense contractors are narrowing their supplier base, awarding increasing portions of projects to strategic mid- and lower-tier suppliers, and, in the process, are becoming oriented more toward systems integration. We believe that we have and expect to continue to benefit from this defense industry trend.
Intellectual Property
We rely upon trade secrets, technical know-how and continuing technological innovation to develop and maintain our competitive position. We have certain registered trademarks, none of which we consider to be material to our current operations. We own numerous United States and foreign patents and have certain patents pending, but do not believe that the conduct of our business as a whole or any single business segment is materially dependent on any single patent, trademark or copyright.
The products we sell require a large amount of engineering design and manufacturing expertise. We have patents on certain Secure Systems & Components (SSC) segment products and technologies, including our electronic components, circuits, filters, connectors, optocouplers, and antennas, and Secure Systems & Information Assurance (SSIA) segment products and technologies, including secure network systems, virtual
10
Table of Contents
data labeling systems, and secure access management systems. However, the majority of our technological capabilities are not protected by patents and licenses. We rely on the expertise of our employees and our learned experiences in both the design and manufacture of our products. It is possible that a competitor may also learn to design and produce products with similar performance capabilities as our products, which may result in increased competition and a reduction of sales for our products. We intend to file patent applications to protect future material proprietary technology, inventions and improvements. While we intend to protect our intellectual property rights vigorously, there can be no assurance that any of our patents will not be challenged, invalidated or circumvented, or the rights granted thereunder will provide competitive advantage to us.
Our trade secret protection for our technology in all segments is based in large part on confidentiality agreements that we enter into with our employees, consultants and other third parties. It is possible that these parties may breach these agreements. Since many agreements are made with companies much larger than us, we may not have adequate financial resources to adequately enforce our rights which could adversely impact our ability to protect our trade secrets and lead to a reduction of sales for our products. In addition, the laws of certain territories in which we develop, manufacture or sell our products may not protect our intellectual property rights to the same extent as the laws of the United States, Canada or the U.K.
Regulatory Matters
Government Contracting Regulations
A significant portion of our Electronic Manufacturing Services (EMS) and Systems, Subsystems & Components (SSC) business is derived from subcontracts with prime contractors of the U.S. government. As a U.S. government subcontractor, we are subject to federal contracting laws and regulations, including the U.S. Federal Acquisition Regulation (FAR) and the False Claims Act, that: (1) impose various profit and cost controls, (2) regulate the allocations of costs, both direct and indirect, to contracts, and (3) provide for the non-reimbursement of unallowable costs. Our extensive experience in the defense industry enables us to handle the strict requirements that accompany these contracts.
Under federal contracting regulations, the U.S. government is entitled to examine all of our cost records with respect to certain negotiated contracts or contract modifications for three years after final payment on such contracts to determine whether we furnished complete, accurate, and current cost or pricing data in connection with the negotiation of the price of the contract or modification.
As is common in the U.S. defense industry, we are subject to business risks, including changes in the U.S. government’s procurement policies (such as greater emphasis on competitive procurement), governmental appropriations, national defense policies or regulations, service modernization plans, and availability of funds. Each of our business segments could be materially adversely affected by a) a reduction in expenditures by the U.S. Government for products of the type we manufacture and provide, b) lower margins resulting from increasingly competitive procurement policies, c) a reduction in the volume of contracts or subcontracts awarded to us or d) the incurrence of substantial contract cost overruns.
All of our U.S. Government prime and subcontracts, in all of our operating segments, can be terminated by the U.S. Government either for its convenience or if we default by failing to perform under the contract. Termination for convenience provisions provide only for our recovery of costs incurred or committed settlement expenses and profit on the work completed prior to termination. Termination for default provisions provide for the contractor to be liable for excess costs incurred by the U.S. Government in procuring undelivered items from another source. Our contracts and subcontracts with foreign governments generally contain similar provisions relating to termination at the convenience of the customer. Because government sales account for a material portion of our business, any such cancellations or renegotiations could have a material adverse effect on our business.
In connection with our U.S. government business, we are also subject to government audits and reviews of our accounting procedures, business practices and procedures, and internal controls for compliance with
11
Table of Contents
procurement regulations and applicable laws. We also could be subject to an investigation as a result of private party whistleblower lawsuits. We may be subject to downward contract price adjustments, refund obligations or civil and criminal penalties. In certain circumstances in which a contractor has not complied with the terms of a contract or with regulations or statutes, the contractor might be debarred or suspended from obtaining future contracts for a specified period of time. Since defense sales account for a significant portion of our business, any such suspension or debarment would have a material adverse effect on our business. It is our policy to cooperate with the government in any investigations of which we have knowledge, but the outcome of any such government investigation cannot be predicted with certainty. We believe we have complied in all material respects with applicable government requirements. We are not aware of any current government investigations of our policies, procedures, and internal controls for compliance with procurement regulations and applicable laws.
A significant portion of our Secure Systems & Information Assurance (SSIA) business is derived from subcontracts with prime contractors of Canadian and United Kingdom government agencies. In instances where the Company is a sole-source provider, certain government agencies may reserve the right to review costs and impose various profit and cost controls. These government agencies also have the right to require its prime and subcontractors to comply with relevant laws and regulations. Non-compliance with these requirements could lead to contract termination. Our extensive experience in the defense industry has enabled us to handle the strict requirements that accompany these contracts.
Some of our activities, in the SSC and SSIA segments, require security clearances from the Defense Industrial Security Clearance Office, which is part of the Defense Security Service, an agency of the DoD, as well as comparable clearances in Canada and the United Kingdom. A security clearance is a determination by the United States and international government agencies that a person or company is eligible for access to classified information. There are two types of clearances: Personnel Security Clearances and Facility Security Clearance. We have sufficient security clearances for our activities.
In order to qualify as an approved supplier of products for use in equipment purchased by military or aerospace programs, we are required to meet the applicable portions of the quality specifications and performance standards designed by the Air Force, the Army, and the Navy. Our products must also conform to the specifications of the Defense Electronic Supply Center for replacement parts supplied to the military. To the extent required, we currently meet or exceed all of these specifications.
Our products are often incorporated into wireless communications systems that are subject to various FCC regulations, as well as regulation internationally by other foreign government agencies. Regulatory changes, including changes in the allocation of available frequency spectrum, could significantly impact our operations by restricting development efforts by our customers, making current products obsolete or increasing the opportunity for additional competition, which may affect our Systems, Subsystems & Components (SSC) segment. Changes in, or the failure by us to comply with, applicable domestic and international regulations could have an adverse effect on our business, operating results and financial condition. In addition, the increasing demand for wireless communications has exerted pressure on regulatory bodies worldwide to adopt new standards for such products, generally following extensive investigation of and deliberation over competing technologies. The delays inherent in this government approval process may cause the cancellation, postponement or rescheduling of the installation of communications systems by our customers, which in turn may have a material adverse effect on the sale of products by us to such customers.
Environmental Matters
Our operations are regulated under a number of federal, state and local environmental laws and regulations, which govern, among other things, the discharge of hazardous materials into the air and water as well as the handling, storage and disposal of such materials and the use of restricted substances, including “conflict minerals.” We currently use limited quantities of hazardous materials common to our industry in connection with the production of our products. In addition, because of our use of such hazardous materials, we may be subject to potential financial exposure for costs associated with an investigation and remediation of sites at which we have
12
Table of Contents
arranged for the disposal of hazardous wastes, if such sites become contaminated. This is true even if we fully comply with applicable environmental laws.
Through the Spectrum acquisition on June 1, 2011, we owned certain land and manufacturing facilities in State College, Pennsylvania. The property, which was acquired by Spectrum from Murata Electronics North America (“Murata”) in December 2005, consists of approximately 53 acres of land and 250,000 square feet of manufacturing facilities. Among other uses, the acquired facilities have become the design and manufacturing center for our ceramic operations. We completed the Sale/Leaseback of our facility located in State College, Pennsylvania on December 31, 2013.
Spectrum’s purchase price for the acquired property included the assumption of, and indemnification of Murata against, all environmental liabilities related to the property. The acquired property had known environmental conditions that required remediation, and certain hazardous materials previously used on the property have migrated into neighboring third party areas. These environmental issues arose from the use of chlorinated organic solvents including tetrachloroethylene (“PCE”) and trichloroethylene (“TCE”). As a condition to the purchase, Spectrum entered into an agreement with the Pennsylvania Department of Environmental Protection (“PADEP”) pursuant to which: (a) Spectrum agreed to remediate all known environmental conditions relating to the property to a specified industrial standard, with the costs for remediating such conditions being capped at $4.0 million; (b) PADEP released Murata from further claims by Pennsylvania under specified state laws for the known environmental conditions; and (c) Spectrum purchased an insurance policy providing clean-up cost cap coverage (for known and unknown pollutants) with a combined coverage limit of approximately $8.2 million, and pollution legal liability coverage (for possible third party claims) with an aggregate coverage limit of $25.0 million. The total premium cost for the insurance policy, which has a ten year term commencing 2005 and an aggregate deductible of approximately $0.7 million, was $4.8 million. The cost of the insurance associated with the environmental clean-up ($3.6 million) is being charged to general and administrative expense in direct proportion to the actual remediation costs incurred. The cost of the insurance associated with the pollution legal liability coverage ($1.2 million) is being charged to general and administrative expense on a pro rata basis over the ten-year policy term.
Based upon Spectrum’s environmental review of the property, Spectrum recorded a liability of $2.9 million to cover probable future environmental expenditures related to the remediation, the cost of which is expected to be entirely covered by the insurance policy. As of November 30, 2012, remediation expenditures of $2.4 million were incurred and charged against the environmental liability, with all such expenditures being reimbursed by the insurance carrier. In the second quarter of fiscal 2012, PADEP issued a site specific standard for the State College facility announcing that it meets specific industrial standards necessary to allow the discontinuance of further cleanup efforts. No reimbursements were provided by the insurance carrier thereafter; and subsequent cleanup, monitoring and decommissioning expenses were recorded as restructuring charges under administrative costs at $0.1 million in fiscal 2013 and $0.1 million in fiscal 2014. In the fourth quarter of fiscal 2014, the Company decommissioned all monitoring wells and water treatment equipment and anticipates no further material testing or cleanup requirements with respect to this matter.
International Operating and Export Sales
We currently sell several of our products internationally. The export of defense articles and data for military and satellite purposes from the United States is covered under International Traffic in Arms Regulations promulgated under the Arms Export Control Act.
We are registered with the U.S. Department of State and renew our registration annually. We currently hold several licenses that allow us to export technical data and product to certain foreign companies.
In addition, international sales of our U.S. products are in many cases subject to export licenses granted on a case-by-case basis by the U.S. Department of State and Department of Commerce. In certain cases, the U.S. government prohibits or restricts the export of some of our products.
13
Table of Contents
We use two principal contracting methods for export sales: Direct Foreign Sales (DFS) and the U.S. government’s Foreign Military Sales (FMS). In a DFS transaction, the contractor sells directly to the foreign entity and assumes all the risks in the transaction. In an FMS transaction, the sale is funded by a U.S. prime contractor who in turn sells the product to the foreign entity.
Our international operations involve additional risks for us, such as exposure to currency fluctuations, future investment obligations and changes in international economic and political environments. In addition, international transactions frequently involve increased financial and legal risks arising from stringent contractual terms and conditions and widely different legal systems, customs and practices in foreign countries.
Manufacturing and Source of and Availability of Materials
Our manufacturing processes for most of our products in all of our segments include the assembly of purchased components and testing of products at various stages in the assembly process. Purchased components include integrated circuits, circuit boards, sheet metal fabricated into cabinets, resistors, capacitors, semiconductors, silicon wafers and other conductive materials, and insulated wire and cables. In addition, many of our products use machine castings and housings, motors, and recording and reproducing media.
The most significant raw materials that we purchase for our SSC and EMS segment operations are integrated circuits in silicon wafers, die forms and packaged devices. As is the case with all of our business segments, materials and purchased components are generally available from a number of suppliers, several suppliers are our sole source of certain components. We are also dependent on certain suppliers for particular customers due to their product specifications. If a supplier should cease to deliver such components, other sources probably would be available; however, added cost and manufacturing delays might result. Despite the risks associated with purchasing from a limited number of sources, we have made the strategic decision to select limited source suppliers in order to obtain lower pricing, receive more timely delivery and maintain quality control. We are subject to rules promulgated by the SEC pursuant to the Dodd-Frank Wall Street Reform and Consumer Protection Act regarding the use of certain materials (tantalum, tin, gold and tungsten), known as conflict minerals, which are mined form the Democratic Republic of the Congo and adjoining countries. These rules have and may continue to impose costs and may introduce new risks related to our ability to verify the origin of any conflict minerals used in our products.
We have long-standing strategic relationships with world class semiconductor suppliers. Because of these capabilities and relationships, we believe we can continue to meet our customers’ requirements. We do not have specific long-term contractual arrangements with our suppliers, however, we have good and long standing relationships with them.
Employees
As of November 30, 2014, we had approximately 1,862 full-time employees, including 1,277 in manufacturing, 224 in general and administrative, 181 in engineering and research and development, 88 in quality assurance, 64 in sales and marketing and 28 in contracts and customer service. With the exception of approximately 80 employees from our C-MAC acquisition, none of our employees are currently subject to a collective bargaining agreement.
There is a continuing demand for qualified technical personnel, and we believe that our future growth and success will depend upon our ability to attract, train and retain such personnel. We believe that our relations with our employees generally are satisfactory.
14
Table of Contents
Executive Officers of the Registrant
The following table lists as of February 1, 2015, the name, age, and position of each of our executive officers.
| Name |
Age | Position Held |
Term Commenced |
|||||||
| Brian R. Kahn |
41 | Chairman and Director | 2011 | |||||||
| Bel Lazar |
54 | Chief Executive Officer and President | 2011 | |||||||
| Claudio Mannarino |
44 | Senior Vice President and Chief FinancialOfficer |
2014 | |||||||
Set forth below is certain biographical information regarding each of our executive officers.
Brian R. Kahn
Brian R. Kahn became our Chairman of the Board and Chief Executive Officer on January 21, 2011. Mr. Kahn continued to serve as Chief Executive Officer until August 1, 2012 and he continues to serve as Chairman of the Board. Mr. Kahn founded and has served as the investment manager of Vintage Capital Management, LLC (“Vintage”), and its predecessor, Kahn Capital Management, LLC since 1998. Vintage focuses on public and private market investments in the consumer, manufacturing, and defense industries. Mr. Kahn also was the former Chairman of the Board of White Electronic Designs Corporation, where he served on the Governance, Compensation and Strategic Alternatives committees. Additionally, he recently served as a director of Integral Systems, Inc. where he served on the Nominating and Governance, Strategic Growth and Special Litigation committees. Currently, Mr. Kahn serves as a director of Aaron’s, Inc. (NYSE: AAN), where he is a member of the Nominating & Governance Committee and the Operational & Financial Advisory Committee. Mr. Kahn graduated cum laude and holds a Bachelor of Arts degree in Economics from Harvard University.
Bel Lazar
Bel Lazar became our President and Chief Operating Officer on March 1, 2011, and was promoted to President and Chief Executive Officer on August 1, 2012, at which time he ceased serving as Chief Operating Officer. Prior to joining the Company, Mr. Lazar was Senior Vice President of Operations at Microsemi Corporation (NASDAQ: MSCC) and a member of their executive team. Microsemi is a provider of semiconductor technology. Microsemi’s products include high-performance, high-reliability analog and RF devices, mixed signal integrated circuits, FPGAs and customizable SoCs, and subsystems solutions. Microsemi serves leading system manufacturers around the world in the defense, homeland security, aerospace, enterprise, commercial, and industrial markets. Prior to Microsemi, Mr. Lazar spent over 22 years at International Rectifier (NYSE: IRF), which specializes in power management technology, from digital, analog and mixed-signal ICs to advanced circuit devices, power systems and components. Mr. Lazar served as International Rectifier’s Vice President of Aerospace & Defense Operations and R&D from July 2003 to September 2007 and Vice President of the Aerospace & Defense business unit from September 2007 to February 2008. Mr. Lazar holds a Bachelor of Science degree in Engineering from California State University, Northridge, a Master of Science Degree in Computer Engineering from the University of Southern California, and a Juris Doctor degree from Southwestern University School of Law.
15
Table of Contents
Claudio Mannarino B.Com,
Claudio A. Mannarino, B.Com, has been with API since 2000 and has over 20 years of finance and professional accounting experience. Appointed to the Senior Vice President and Chief Financial Officer role in June 2014, Mr. Mannarino previously served as Senior Vice President (since January 2010) and, as Chief Financial Officer and Vice President of Finance (November 2006 – January 2010). Prior to that, he served in various, senior-level management roles throughout the company’s finance organization. Before joining the company, Mr. Mannarino served as Controller for two divisions of Transcontinental, Inc., a Canadian publicly traded company on the Toronto Stock Exchange. After three years in roles with progressively more responsibility at GTC he joined a project management company as a senior accountant, whose role centered on developing long-term business strategies and improving business practices. Mr. Mannarino holds a Bachelor of Commerce Degree from the University of Ottawa and attained his Certified Management Accountant certification in 1996.
16
Table of Contents
| ITEM 1A. | RISK FACTORS |
Additional Risk Factors to Consider:
An investment in our securities involves a high degree of risk. You should carefully consider the risk factors described below, together with the other information included in this Annual Report on Form 10-K before you decide to invest in our securities. The risks described below are the material risks of which we are currently aware; however, they may not be the only risks that we may face. Additional risks and uncertainties not currently known to us or that we currently view as immaterial may also impair our business. If any of these risks develop into actual events, it could materially and adversely affect our business, financial condition, results of operations and cash flows, the trading price of your shares could decline and you may lose all or part of your investment.
Risks Related to Our Business
We are highly reliant on defense spending
Our current orders from defense-related companies account for a material portion of our overall net sales and defense spending levels depend on factors that are outside of our control. For each of the fiscal years ended November 30, 2014 and 2013, U.S. defense revenue represented approximately 47% of our total consolidated sales. Reductions or changes in defense spending, including as a result of new U.S. government budget reductions, could have a material adverse effect on our sales and profits. The loss or significant curtailment of government contracts or subcontracts, or failure to exercise renewal options or enter into new contracts or subcontracts, could have a material adverse effect on our business, results of operations and financial condition. Changes in federal government spending could directly affect our financial performance. Among the factors that could impact federal government spending and which would reduce our federal government contracting and subcontracting business are a significant decline in, or reapportioning of, spending by the federal government, changes or cancellations of federal government programs or requirements, and shutdowns or other delays in the government appropriations process. In addition, a difference in philosophy or the worsening economic climate of the country could reduce or change appropriations.
The current administration and Congress are under increasing pressure to reduce the federal budget deficit. This could result in a general decline in U.S. defense spending and could cause federal government agencies to reduce their purchases under contracts, exercise their rights to terminate contracts in whole or in part, to issue temporary stop work orders or decline to exercise options to renew contracts, all of which could harm our operations and significantly reduce our future revenues.
In particular, defense spending may be negatively impacted by the Budget Control Act of 2011, or the Budget Act, which was passed in August 2011, and the related American Taxpayer Relief Act of 2012, or the Relief Act, which was passed in January 2013. The Budget Act called for a $917.0 billion reduction in discretionary spending over the next decade, and also created a joint committee of Congress, or the Super Committee, that was responsible for identifying up to an additional $1.5 trillion in deficit reductions by November 23, 2011. The Super Committee failed to reach an agreement by the November 23, 2011 deadline. As a result, $1.2 trillion in automatic spending cuts over a nine-year period, split between defense and non-defense programs, which we collectively refer to as Sequestration, were scheduled to be triggered beginning in January 2013. The threat of Sequestration, along with the expiration of certain tax cuts on December 31, 2012, was collectively referred to as the “Fiscal Cliff.” On January 2, 2013, President Obama signed the Relief Act, which partially resolved the Fiscal Cliff, but did not eliminate the threat of Sequestration, instead moving the applicable trigger date to March 1, 2013, which we refer to as the Sequester Deadline. No alternative resolution was reached prior to the Sequester Deadline, and as a result, Sequestration went into effect at that time. On January 17, 2014, Congress approved, and the President signed, the Omnibus Appropriations Act which removed the threat of future government shutdowns during calendar 2014. The Omnibus Appropriations Act funds the Department of Defense at $499 billion and replaces the across-the-board sequestration cuts with specific reductions across most Department of Defense accounts. Total funding, and funding for most programs, remains flat at 2013 levels. Sequestration remains a long-term concern and we are unable to predict the outcome of future budget
17
Table of Contents
deliberations. Sequestration, or other budgetary cuts in lieu of sequestration, could materially negatively affect our revenues, financial condition and results of operation.
Future congressional appropriation and authorization of defense spending and the application of sequestration remain marked by significant debate and an uncertain schedule. The debt ceiling continues to be actively debated as plans for long-term national fiscal policy are discussed. The outcome of these debates could have a significant impact on defense spending broadly and programs we support in particular. As a result of the Budget Act and deficit reduction pressures, it appears likely that discretionary spending by the federal government may remain constrained for several years.
Such occurrences are beyond our control. For instance, government contracts are conditioned upon the continuing availability of Congressional appropriations. Congress typically appropriates funds for a given program on a fiscal-year basis even though contract performance may take more than one year. As a result, at the beginning of a major program, a contract is typically only partially funded, and additional monies are normally committed to the contract by the procuring agency only as Congress makes appropriations available for future fiscal years. Also, the specific programs in which we participate, or in which we may seek to participate in the future, must compete with other programs for consideration during the budget formulation and appropriation processes.
We are subject to unique business risks as a result of supplying products to the U.S. government directly and as a subcontractor, which could lead to a reduction in our net sales from, or the profitability of our arrangements with, the U.S. Government
Companies engaged in supplying defense-related products to U.S. government agencies are subject to business risks specific to the defense industry. We contract directly with the U.S. government and as a subcontractor to customers contracting with the U.S. government. These risks include the ability of the U.S. government to unilaterally suspend or prohibit us from receiving new contracts pending resolution of alleged violations of procurement laws or regulations, reduce the value of existing contracts and audit our contract- related costs and fees. In addition, most of our U.S. and international government contracts and subcontracts can be terminated by the U.S. or foreign government or the contracting party, as applicable, at its convenience. Termination for convenience provisions provide only for our recovery of costs incurred or committed, settlement expenses and profit on the work completed prior to termination.
In addition, the U.S. government may seek to review our costs to determine whether our pricing is “fair and reasonable.” Such a review could be costly and time consuming for our management and could distract from our ability to effectively manage the business. As a result of such a review, we could be required to provide a refund to the U.S. government or we could be asked to enter into an arrangement whereby our prices would be based on cost or the DoD could seek to pursue alternative sources of supply for our parts. Any of those occurrences could lead to a reduction in our net sales from, or the profitability of certain of our arrangements with, certain agencies and buying organizations of the U.S. government.
Our business may be adversely affected by global economic conditions
The continuing turmoil in the global economy and, in the U.S., the Congressional deadlock over the federal debt ceiling and government spending restrictions, has had, and may continue to have, a significant negative impact on our business, financial condition, and future results of operations. Specific risk factors related to these overall economic and credit conditions include the following: customer or potential customers may reduce or delay their procurement or new product development; key suppliers may become insolvent resulting in delays for our material purchases; vendors and other third parties may fail to perform their contractual obligations; customers may be unable to obtain credit to finance purchases of our products; and certain customers may become insolvent. These risk factors could reduce our product sales, increase our operating costs, impact our ability to manage inventory levels and collect customer receivables, lengthen our cash conversion cycle and increase our need for cash, which would ultimately decrease our profitability and negatively impact our financial
18
Table of Contents
condition. In addition, defense budgets generally are under pressure. Reduced defense spending may affect products purchased by those governments or their prime contractors from us and may materially adversely affect our operations and financial condition.
We are reliant on certain security clearances for some of our business
We have Facility Security Clearances from the Defense Industrial Security Clearance Office, which is part of the Defense Security Service, or DSS, for several of our U.S. facilities and comparable clearances at several of our U.K. and Canadian facilities. If we do not maintain the Facility Security Clearances we would be prevented from continuing those business activities that require access to classified information. Our ability to maintain our Facility Security Clearances has a direct impact on our ability to bid on or win new contracts, complete existing contracts, or effectively re-bid on expiring contracts either directly through the U.S. government or through U.S. defense contractors. The inability to obtain and maintain our Facility Security Clearances would have a material adverse effect on our business, financial condition and operating results.
We currently maintain approximately $128.3 million of debt and our failure to service such indebtedness may adversely affect our financial and operating activities
At February 1, 2015, we had approximately $128.3 million (November 30, 2014 – $128.3 million), in aggregate principal amount of outstanding debt, which was secured by substantially all of our assets.
Our ability to make scheduled payments of principal and interest on our indebtedness and to refinance our existing debt depends on our future financial performance as well as our ability to access the capital markets, and the relative attractiveness of available financing terms. We do not have complete control over our future financial performance because it is subject to economic, political, financial (including credit market conditions), competitive, regulatory and other factors affecting the aerospace and defense industry, as well as commercial industries in which we operate. It is possible that in the future our business may not generate sufficient cash flow from operations to allow us to service our debt and make necessary capital expenditures. If this situation occurs, we may have to reduce costs and expenses, sell assets, restructure debt or obtain additional equity capital. We may not be able to do so in a timely manner or upon acceptable terms in accordance with the restrictions contained in our debt agreements. Our level of indebtedness has important consequences to us. These consequences may include:
| • | requiring a substantial portion of our net cash flow from operations to be used to pay interest and principal on our debt and therefore be unavailable for other purposes, including acquisitions, capital expenditures, paying dividends to our shareholders, repurchasing shares of our common stock, research and development and other investments; |
| • | limiting our ability to obtain additional financing for acquisitions, working capital, investments or other expenditures, which, in each case, may limit our ability to introduce new technologies and products or exploit business opportunities; |
| • | heightening our vulnerability to downturns in our business or in the general economy and restricting us from making acquisitions, introducing new technologies and products or exploiting business opportunities; and |
| • | limiting our organic growth and ability to hire additional personnel. |
Our credit facilities contain certain restrictions that may limit our ability to operate our business
Our credit facilities contain a number of restrictive covenants that affect our business and restrict our ability to, among other things, incur indebtedness, issue guarantees, grant liens, dispose of assets and pay dividends or make distributions to stockholders.
In addition, as a result of the covenants and restrictions contained in our credit facilities, we are limited in how we conduct our business and we may be unable to make capital expenditures or raise additional debt or
19
Table of Contents
equity financing to compete effectively or to take advantage of new business opportunities either through acquisitions or internal expansion. The terms of any future indebtedness could include more restrictive covenants.
The amount available for borrowing under our asset-based revolving loan facility is subject to a borrowing base, which is determined by the lenders at their discretion, taking into account, among other things, our accounts receivable, inventory and machinery and equipment. Fluctuations in our borrowing base impact our ability to borrow funds pursuant to the Revolving Loan Agreement. Some of the components of our borrowing base, such as accounts receivable, are outside of our control.
We cannot assure that we will be able to remain in compliance with the covenants in our credit facilities in the future and, if we fail to do so, that we will be able to obtain waivers from the appropriate parties and/or amend the covenants. Our ability to comply with these covenants is dependent on our future performance, which will be subject to many factors, some of which are beyond our control, including prevailing economic conditions. If we are not able to comply with all of these covenants for any reason and we have debt outstanding at the time of such failure, some or all of our outstanding debt could become due and payable and the incurrence of additional debt under the credit facilities would not be allowed. If our cash is utilized to repay any outstanding debt, depending on the amount of debt outstanding, we could experience an immediate and significant reduction in working capital available to operate our business.
Net sales could decline significantly if we lose a major customer or a major program
Historically, a large portion of our net sales have been derived from sales to a small number of our customers and we expect this trend to continue for the foreseeable future. The U.S., Canadian and United Kingdom governments’ Departments of Defense (directly and through subcontractors) account for approximately, 45% and 2% and 9%, respectively of our revenues for the fiscal year ended November 30, 2014, 47% and 2% and 9%, respectively, of our revenues for the fiscal year ended November 30, 2013, and 45% and 2% and 9%, respectively, of our revenues for the fiscal year ended November 30, 2012. One of the U.S. customers, a defense prime contractor, represented approximately 8% of revenues for each of the years ended November 30, 2014 and 2013. A loss of a significant customer could materially adversely impact the future operations of our Company.
In many cases, our customers are not subject to any minimum purchase requirements and can discontinue the purchase of our products at any time. In the event one or more of our major customers reduces, delays or cancels orders with us, and we are not able to sell our products to new customers at comparable levels, our net sales could decline significantly, which could adversely affect our financial condition and results of operations. In addition, any difficulty in collecting amounts due from one or more key customers would negatively impact our results of operations, cash flows and financial position.
Our operations are subject to numerous laws, regulations and restrictions, and failure to comply with these laws, regulations and restrictions could subject us to fines, penalties, suspension or debarment
Our contracts and operations are subject to various laws and regulations. Prime contracts with various agencies of the U.S. government, and subcontracts with other prime contractors, are subject to numerous procurement regulations, including Federal Acquisition Regulation and the International Traffic in Arms Regulations promulgated under the Arms Export Control Act, with noncompliance found by any one agency possibly resulting in fines, penalties, debarment, or suspension from receiving additional contracts with all U.S. government agencies. We are also subject to the federal False Claims Act, which provides for substantial civil penalties and treble damages where a contractor presents a false or fraudulent claim to the government for payment. Actions under the False Claims Act may be brought by the government or by other persons on behalf of the government (who may then share in any recovery). Given our dependence on U.S. government business, suspension or debarment could have a material adverse effect on our financial results.
20
Table of Contents
In addition, our international business subjects us to numerous U.S. and foreign laws and regulations, including, without limitation, regulations relating to import-export control, technology transfer restrictions, repatriation of earnings, exchange controls, the Foreign Corrupt Practices Act and the anti-boycott provisions of the U.S. Export Administration Act. Changes in regulations or political environments may affect our ability to conduct business in foreign markets including investment, procurement and repatriation of earnings. Failure by us or our sales representatives or consultants to comply with these laws and regulations could result in certain liabilities and could possibly result in suspension or debarment from government contracts or suspension of our export privileges, which could have a material adverse effect on our financial results.
The possibility of goodwill impairment exists
As a result of our business acquisitions, including SenDEC, Spectrum, CMT, RTIE and C-MAC, goodwill is a significant part of our total assets. At November 30, 2014, our total assets were approximately $282.8 million, which included approximately $116.8 million of goodwill. Goodwill reflects the excess of the purchase price of each of our acquisitions over the fair value of the net assets of the business acquired. We perform annual evaluations, or more frequently if impairment indicators arise, for potential impairment of the carrying value of goodwill in accordance with current accounting standards. We wrote down goodwill by $107.5 million in fiscal 2012, primarily from our EMS segment, as described in Note 9 of our consolidated financial statements included in this Annual Report on Form 10-K.
Major factors that influence our analyses of fair value are our estimates for future revenue and expenses associated with the reporting units. Other factors considered in our fair value calculations include assumptions as to the business climate, industry and economic conditions. These assumptions are subjective and different estimates could have a significant impact on the results of our analyses. While management, based on current forecasts and outlooks, believes that the assumptions and estimates are reasonable, we can make no assurances that future actual operating results will be realized as planned and that there will not be additional material impairment charges as a result. Any write-down of goodwill or intangible assets resulting from future periodic evaluations would, as applicable, either decrease our net income or increase our net loss and those decreases or increases could be material.
The concentration of our share ownership among our current officers, directors and their affiliates may limit our shareholders’ ability to influence corporate matters
Our officers and directors as a group beneficially own a large percentage of our shares. Therefore, directors and officers, acting together may have a controlling influence on (i) matters submitted to our shareholders for approval (including the election and removal of directors and any merger, consolidation or sale of all or substantially all of our assets) and (ii) our management and affairs. This concentration of ownership also may have the effect of delaying, deferring or preventing a change in control, impeding a merger, consolidation, takeover or other business combination or discouraging a potential acquirer from making a tender offer or otherwise attempting to obtain control of us, which in turn could materially adversely affect the market price of our shares.
We have a history of net losses, and may not be profitable in the future
Prior to the transition period, we incurred net losses for each of the five fiscal years preceding the transition period and incurred a loss in our past three fiscal years. We cannot assure you that we will be profitable in the future. Even if we achieve profitability, we may experience significant fluctuations in our revenues and we may incur net losses from period to period. The impact of the foregoing may cause our operating results to be below the expectations of securities analysts and investors, which may result in a decrease in the market value of our common shares.
21
Table of Contents
Our inability to retain and attract employees with key technical or operational expertise may adversely affect our business
The products that we sell require a large amount of engineering design, manufacturing and operational expertise. However, the majority of our technological capabilities are not protected by patents and licenses. We rely on the expertise of our employees and our learned experiences in both the design and manufacture of our products. Competition for personnel in our industry is intense and there are a limited number of persons, especially engineers, with knowledge of and experience in our technologies. Our design and development efforts depend on hiring and retaining qualified technical personnel. An inability to attract or maintain a sufficient number of technical personnel could have a material adverse effect on our operating performance or on our ability to capitalize on market opportunities. In addition, if we were to lose one or more of our key employees, then we would likely lose some portion of our institutional knowledge and technical know-how, which could adversely affect our business.
Failure to maintain adequate internal controls could adversely affect our business
Under Section 404 of the Sarbanes-Oxley Act of 2002, we are required to include in this Annual Report and each of our Annual Reports on Form 10-K, a report containing our management’s assessment of the effectiveness of our internal control over financial reporting. These laws, rules and regulations continue to evolve and could become increasingly stringent in the future. We have undertaken actions to enhance our ability to comply with the requirements of the Sarbanes-Oxley Act of 2002, including, but not limited to, the engagement of consultants, the documentation of existing controls and the implementation of new controls or modification of existing controls as deemed appropriate.
We continue to devote substantial time and resources to the documentation and testing of our controls. If we fail to maintain the adequacy of our internal controls, as such standards are modified, supplemented or amended from time to time, we could be subject to regulatory actions, civil or criminal penalties or shareholder litigation. In addition, failure to maintain adequate internal controls could result in financial statements that do not accurately reflect our financial condition, results of operations and cash flows.
We are dependent on key personnel
We are dependent upon a small number of key personnel. The loss of the services of such key personnel could have a material adverse effect on our business because we believe our success will depend in large part on the efforts of these individuals. While we have entered into employment letter agreements with certain key personnel, such letter agreements provide that their employment is at-will. We do not currently have, or propose to have, any long-term employment agreements with key personnel, nor do we intend to obtain key-man insurance in respect of such key personnel.
The defense, semiconductor and electronic components industries are highly competitive and increased competition could adversely affect our operating results
The areas of the defense, semiconductor and electronic component industries in which we do business are highly competitive. We expect intensified competition from existing competitors and new entrants. Competition is based on price, product performance, product availability, quality, reliability and customer service. Even in strong markets, pricing pressures may emerge. For instance, competitors may attempt to gain a greater market share by lowering prices. The market for commercial products is characterized by declining selling prices. We anticipate that average selling prices for our products will continue to decrease in future periods, although the timing and amount of these decreases cannot be predicted with any degree of certainty. We compete in various markets with companies of various sizes, many of which are larger and have greater financial and other resources than we have, and thus may be better able to pursue acquisition opportunities and to withstand adverse economic or market conditions. In addition, companies not currently in direct competition with us may introduce competing products in the future. We may not be able to compete successfully in the future and such competitive pressures may harm our financial condition and/or operating results.
22
Table of Contents
We are required to comply with the “conflict minerals” rules promulgated by the SEC, which will impose costs on us and could raise reputational and other risks
As required under the Dodd-Frank Wall Street Reform and Consumer Protection Act, in August 2012, the SEC promulgated final rules regarding disclosure of the use of certain minerals, known as “conflict minerals,” which are mined from the Democratic Republic of the Congo and adjoining countries, as well as procedures regarding manufacturers’ efforts to discover the origin of such minerals and metals produced from those minerals. These conflict minerals are commonly referred to as “3TG” and include tin, tantalum, tungsten, and gold. The conflict minerals rules required us to engage in due diligence efforts for the 2013 calendar year and such efforts are ongoing. Disclosures are required no later than May 31 of each year. We have, and we expect that we will continue to, incur additional costs and expenses, which may be significant in order to comply with these rules, including for (i) due diligence to determine whether conflict minerals are necessary to the functionality or production of any of our products and, if so, verify the sources of such conflict minerals; and (ii) any changes that we may desire to make to our products, processes, or sources of supply as a result of such diligence and verification activities. Since our supply chain is complex, ultimately we may not be able to sufficiently discover the origin of the conflict minerals used in our products through the due diligence procedures that we implement, which may adversely affect our reputation with our customers, shareholders, and other stakeholders. In such event, we may also face difficulties in satisfying customers who require that all of our products are certified as conflict mineral free. If we are not able to meet such requirements, customers may choose not to purchase our products, which could adversely affect our sales and the value of portions of our inventory. Further, there may be only a limited number of suppliers offering conflict free minerals and, as a result, we cannot be sure that we will be able to obtain metals, if necessary, from such suppliers in sufficient quantities or at competitive prices. Any one or a combination of these various factors could harm our business, reduce market demand for our products, and adversely affect our profit margins, net sales, and overall financial results.
We depend on limited suppliers for certain critical raw materials
Our manufacturing operations require raw materials that must meet exacting standards. Additionally, certain customers require us to buy from particular vendors due to their product specifications. We rely heavily on our ability to maintain access to steady sources of these raw materials at favorable prices. We do not have specific long-term contractual arrangements, but we believe we are on good terms with our suppliers. We cannot be certain that we will continue to have access to our current sources of supply at favorable prices, or at all, or that we will not encounter supply problems in the future. Any interruption in our supply of raw materials could reduce our sales in a given period, and possibly cause a loss of business to a competitor, if we could not reschedule the deliveries of our product to our customers. In addition, our gross profits could suffer if the prices for raw materials increase, especially with respect to sales associated with military contracts where prices are typically fixed.
Precious metals are subject to price fluctuations
Raw materials used in the manufacture of certain ceramic capacitors include silver, palladium, and platinum. Certain of our microwave components and systems require gold plating. Precious metals are available from many sources; however, their prices may be subject to significant fluctuations and such fluctuations may have a material and adverse effect on our operating results. Historically, the Company has been able to pass on precious metal price increase to its customers, in the form of precious metal price adders or direct sales price increases. However, there can be no assurance that customers will continue to accept these selling price adjustments and, as a result, there may be a material adverse effect on our operating margins and overall operating results.
We may not be able to develop new products to satisfy changes in demand
The industries in which we operate are dynamic and constantly evolving. We cannot provide any assurance that we will successfully identify new product opportunities and develop and bring products to market in a timely
23
Table of Contents
and cost-effective manner, or those products or technologies developed by others will not render our products or technologies obsolete or noncompetitive.
The introduction of new products presents significant business challenges because product development commitments and expenditures must be made well in advance of product sales. The success of a new product depends on accurate forecasts of long-term market demand and future technological developments, as well as on a variety of specific implementation factors, including:
| • | timely and efficient completion of process design and development; |
| • | timely and efficient implementation of manufacturing and assembly processes; |
| • | product performance; |
| • | the quality and reliability of the product; |
| • | effective marketing, sales and customer service; and |
| • | sufficient demand for the product at an acceptable price. |
The failure of our products to achieve market acceptance due to these or other factors could harm our business.
Cancellation or changes or delays in orders could materially reduce our net sales and operating results
We generally do not receive firm, long-term purchase commitments from our customers. Customers may cancel their orders, change production quantities or delay production for a number of reasons. Cancellations, reductions or delays by a significant customer or by a group of customers would seriously harm our results of operations for a period by reducing our net sales in that period. In addition, because many of our costs and operating expenses are fixed, a reduction in customer demand could harm our gross profit and operating income.
Our lengthy sales cycle may increase the likelihood that our quarterly net sales will fluctuate which may adversely affect the market price of our shares of common stock
Due to the complexity of our technology and the types of end uses for our products, our customers perform, and require us to perform, extensive process and product evaluation and testing, which results in a lengthy sales cycle. Our sales cycles can often last for several months, and may last for up to a year or more. Additionally, as we are a tier three supplier, our orders are dependent on funding and contract negotiations through multiple parties which can affect our receipt of orders due to matters outside of our control. Our business is moving towards a business base driven more by larger orders on major defense programs. As a result of these factors, our net sales and operating results may vary unpredictably from period to period. This fact makes it more difficult to forecast our quarterly results and can cause substantial variations in operating results from quarter to quarter that are unrelated to the long-term trends in our business. This lack of predictability in our results could adversely affect the market price of our common shares in particular periods.
We depend on military prime contractors for the sale of our products
We sell a substantial portion of our products to military prime contractors and the contract manufacturers who work for them. The timing and amount of sales to these customers ultimately depend on sales levels and shipping schedules for the products into which our components are incorporated. We have no control over the volume and timing of products shipped by our military prime contractors and the contract manufacturers who work for them, and we cannot be certain that our military prime contractors or the contract manufacturers who work for them will continue to ship products that incorporate our components at current levels, or at all. Our business will be harmed if our military prime contractors or the contract manufacturers who work for them fail to achieve significant sales of products incorporating our components or if fluctuations in the timing or reductions in the volume of such sales occur. Failure of these customers to inform us of changes in their production needs in a timely manner could also hinder our ability to effectively manage our business.
24
Table of Contents
Our failure to comply with U.S. government laws, regulations and manufacturing facility certifications would reduce our ability to be awarded future military business
We must comply with laws, regulations and certifications relating to the formation, administration and performance of federal government contracts as passed down to us by our customers in their purchase orders, which affects our military business and may impose added cost on our business. We are subject to government audits and reviews of our accounting procedures, business practices, procedures, and internal controls for compliance with procurement regulations and applicable laws. We also could be subject to an investigation as a result of private party whistleblower lawsuits. Such audits could result in adjustments to our contract costs and profitability. If a government investigation uncovers improper or illegal activities, we may be subject to civil and criminal penalties and administrative sanctions, including the termination of our contracts, the forfeiture of profits, the suspension of payments owed to us, fines, and our suspension or debarment from doing business with federal government agencies. In addition, we could expend substantial amounts defending against such charges and incur damages, fines and penalties if such charges are proven or result in negotiated settlements. Since defense sales account for a significant portion of our business, any debarment or suspension of our ability to obtain military sales would greatly reduce our overall net sales and profits, and would likely affect our ability to continue as a going concern.
Our products may be found to be defective, product liability claims may be asserted against us and we may not have sufficient liability insurance
One or more of our products may be found to be defective after shipment, requiring a product replacement, recall or repair which would cure the defect but impede performance of the product. We may also be subject to product returns, which could impose substantial costs and harm to our business.
Product liability claims may be asserted with respect to our technology or products. Although we currently have insurance, there can be no assurance that we have obtained a sufficient amount of insurance coverage, that asserted claims will be within the scope of coverage of the insurance, or that we will have sufficient resources to satisfy any asserted claims.
We typically provide a one-year product defect warranty from the date of sale. Historically, warranty costs have been nominal and have been within management’s expectations. We continually assess the necessity for a warranty provision and accrue amounts deemed necessary.
Our inability to protect our intellectual property rights or our infringement of the intellectual property rights of others could adversely affect our business
We principally rely on our skill in the manufacture of our products and not on any proprietary technologies that we develop or license on an exclusive basis. Our manufacturing know-how is primarily embodied in our drawings and specifications, and information about the manufacture of these products purchased from others. Our future success and competitive position may depend in part upon our ability to obtain licenses of certain proprietary technologies used in principal products from the original manufacturers of such products. Our reliance upon protection of some of our production technology as “trade secrets” will not necessarily protect us from other parties independently obtaining the ability to manufacture our products. In addition, there may be circumstances in which “know how” is not documented, but exists within the heads of various employees who may leave the Company or disclose our know how to third parties. We cannot assure you that we will be able to maintain the confidentiality of our production technology, dissemination of which could have a material adverse effect on our business.
Patents of third parties may have an important bearing on our ability to offer certain of our products. Our major competitors as well as other third parties may obtain and may have obtained patents related to the types of products we offer or plan to offer. We cannot assure you that we are or will be aware of all patents containing claims that may pose a risk of infringement by our products. In addition, some patent applications in the United States are confidential until a patent is issued and, therefore, we cannot evaluate the extent to which technology
25
Table of Contents
concerning our products may be covered or asserted to be covered by claims contained in pending patent applications. In general, if one or more of our products were found by a court to infringe patents held by others, we may be required to stop developing or marketing the products, to obtain licenses to develop and market the products from the holders of the patents or to redesign the products in such a way as to avoid infringing those patents. An adverse ruling arising out of any intellectual property dispute could also subject us to significant liability for damages.
We cannot assess the extent to which we may be required in the future to obtain licenses with respect to patents held by others, whether such license would be available or, if available, whether we would be able to obtain such licenses on commercially reasonable terms. If we are unable to obtain licenses with respect to patents held by others, and are unable to redesign our products to avoid infringement of any such patents, this could materially adversely affect our business, financial condition and operating results.
Also, we hold various patents and licenses relating to certain of our products. We cannot assure you as to the breadth or degree of protection that existing or future patents, if any, may afford us, that our patents will be upheld, if challenged, or that competitors will not develop similar or superior methods or products outside the protection of any patent issued to us. It is possible that our existing patent rights may not be valid. We may have to expend resources to protect our patents in the event a third party infringes our patents, although we cannot assure you that we will have the resources to prosecute all or any patent violations by third parties.
We must commit resources to product manufacturing prior to receipt of purchase commitments and could lose some or all of the associated investment
We sell many of our products pursuant to purchase orders for current delivery, rather than pursuant to long-term supply contracts. This makes long-term planning difficult. Further, many of these purchase orders may be revised or canceled prior to shipment without penalty. As a result, we must commit resources to the production of products without advance purchase commitments from customers. The cancellation or deferral of product orders, the return of previously sold products, or overproduction due to the failure of anticipated orders to materialize, could result in our holding excess or obsolete inventory. This could cause inventory write-downs. Our inability to sell products after we have devoted significant resources to them could have a material adverse effect on our business, financial condition and results of operations.
Variability of our manufacturing yields may affect our gross margins
Our manufacturing yields vary significantly among products, depending on the complexity of a particular product. The difficulties that may be experienced in the production process include: defects in subcontractors components, impurities in the materials used, equipment failure, and unreliability of a subcontractor. From time to time, we have experienced difficulties in achieving planned yields, which have adversely affected our gross margins. Yield decreases can result in substantially higher unit costs, which could materially and adversely affect our operating results and have done so in the past. Moreover, we cannot assure you that we will be able to continue to improve yields in the future or that we will not suffer periodic yield problems, particularly during the early production of new products or introduction of new process technologies. In either case, our results of operations could be materially and adversely affected.
Our inventories may become obsolete
The life cycles of some of our products depend heavily upon the life cycles of the end products into which these products are designed. Products with short life cycles require us to manage closely our production and inventory levels. Inventory may also become obsolete. The life cycles for electronic components have been shortening over time at an accelerated pace. We may be adversely affected in the future by obsolete or excess inventories which may result from unanticipated changes in the estimated total demand for our products or the estimated life cycles of the end products into which our products are designed.
26
Table of Contents
Interruptions, delays or cost increases affecting our materials, parts, equipment or subcontractors may impair our competitive position
Some of our product are sometimes tested and plated using a third-party test and plating house. We do not have any long-term agreements with these subcontractors. As a result, we may not have assured control over our product delivery schedules or product quality. Due to the amount of time typically required to qualify assemblers and testers, we could experience delays in the shipment of our products if we are forced to find alternative third parties to assemble or test them. Any product delivery delays in the future could have a material adverse effect on our operating results and financial condition. Our operations and ability to satisfy customer obligations could be adversely affected if our relationships with these subcontractors is disrupted or terminated.
Environmental liabilities could adversely impact our financial position
United States, Canadian, and United Kingdom laws and regulations impose various restrictions and controls on the discharge of materials, chemicals and gases used in our semiconductor and other manufacturing processes or in our finished goods. Under environmental regulations, we are responsible for determining whether certain toxic metals or chemicals are present in any given components we purchase and in each product we sell. These environmental regulations have required us to expend a portion of our resources and capital on relevant compliance programs. In addition, under other laws and regulations, we could be held financially responsible for remedial measures if our current or former properties are contaminated or if we send waste to a landfill or recycling facility that becomes contaminated, even if we did not cause the contamination. Also, we may be subject to additional common law claims if we release substances that damage or harm third parties. Further, future changes in environmental laws or regulations may require additional investments in capital equipment or the implementation of additional compliance programs in the future. Any failure to comply with environmental laws or regulations could subject us to significant liabilities and could have material adverse effects on our operating results, cash flows and financial condition.
In the conduct of our manufacturing operations, we have handled and do handle materials that are considered hazardous, toxic or volatile under applicable laws. The risk of accidental release of such materials cannot be completely eliminated. In addition, we operate or own facilities located on or near real property that was formerly owned and operated by others. These properties were used in ways that may have involved hazardous materials. Contaminants may migrate from, or within or through any such property. These risks may give rise to claims. Where third parties are responsible for contamination, the third parties may not have funds, or not make funds available when needed, to pay remediation costs imposed upon us jointly with third parties under environmental laws and regulations.
Risks Relating to Our Shares of Common Stock
Our stock market price and trading volume is volatile
The market for our common stock is volatile. Our share price is subject to volatility in both price and volume arising from market expectations, announcements and press releases regarding our business, and changes in estimates and evaluations by securities analysts or other events or factors.
Over the years, the securities markets in the United States have experienced a high level of price and volume volatility, and the market price of securities of many companies, particularly smaller-capitalization companies like us, have experienced wide fluctuations that have not necessarily been related to the operations, performances, underlying asset values, or prospects of such companies. For these reasons, our shares of common stock are subject to significant volatility resulting from purely market forces over which we will have no control. Further, the market for our common stock has been very thin. As a result, our shareholders may be unable to sell significant quantities of common stock in the public trading markets without a significant reduction in the price of our common shares.
27
Table of Contents
Shareholders may experience dilution if a significant proportion of our outstanding options and warrants are exercised
Because our success is highly dependent upon our employees, directors and consultants, we have and intend in the future to grant to some or all of our key employees, directors and consultants options to purchase shares of our Common Stock as non-cash incentives. We have adopted an equity incentive plan for this purpose. To the extent that significant numbers of such options may be exercised when the exercise price is below the then current market price for our common shares, the interests of the other shareholders of the company may be diluted. As of November 30, 2014, we have outstanding options to purchase 1,328,310 shares of Common Stock that were granted to directors, officers, employees and consultants that have a weighted average price of $4.52 and 48,334 restricted stock units.
We do not expect to pay dividends
We intend to invest all available funds to finance our growth and/or pay down debt. Therefore our shareholders cannot expect to receive any dividends on our shares of common stock in the foreseeable future. Even if we were to determine that a dividend could be declared, we could be precluded from paying dividends by restrictive provisions of loans, leases or other agreements or by legal prohibitions under applicable corporate law.
Our failure to comply with The NASDAQ Stock Market’s continued listing standards may adversely affect the price and liquidity of our shares of common stock as well as our ability to raise capital in the future
Our common stock commenced trading on the NASDAQ Capital Market on June 27, 2011, under the symbol ATNY. Until we became listed on NASDAQ, our common stock was quoted and traded on the OTC Bulletin Board. NASDAQ requires listed companies to maintain minimum financial thresholds and comply with certain corporate governance regulations to remain listed. If we are unsuccessful in maintaining compliance with the continued listing requirements of NASDAQ, then our common stock could be delisted and may trade only in the secondary markets such as OTC Bulletin Board. Delisting from NASDAQ could adversely affect our liquidity and price of our common stock as well as our ability to raise capital in the future.
| ITEM 1B. | UNRESOLVED STAFF COMMENTS |
None.
28
Table of Contents
| ITEM 2. | PROPERTIES |
We operate from leased facilities in the following locations:
| Location |
Description and Segments that Use the Properties |
Approximate Square Footage (excludes subleased space) |
||||
| State College, Pennsylvania* |
Engineering/Design, Sales, Administration and Manufacturing: - Systems, Subsystems & Components |
275,000 | ||||
| Windber, Pennsylvania (Includes two facilities) |
Engineering/Design, Sales and Manufacturing: - Electronic Manufacturing Services |
123,800 | ||||
| Guong Dong Province, China |
Manufacturing: - Systems, Subsystems & Components |
70,000 | ||||
| Fairport, New York |
Sales and Manufacturing: - Electronic Manufacturing Services |
60,000 | ||||
| Juarez, Mexico |
Manufacturing: - Systems, Subsystems & Components |
50,000 | ||||
| Marlborough, Massachusetts |
Engineering/Design, Sales and Manufacturing: - Systems, Subsystems & Components |
43,000 | ||||
| Hudson, New Hampshire |
Engineering/Design, Sales and Manufacturing: - Systems, Subsystems & Components |
39,000 | ||||
| Milton Keynes, United Kingdom |
Engineering/Design, Sales, Administration and Manufacturing: - Systems, Subsystems & Components |
38,500 | ||||
| Kanata (Ottawa), Ontario |
Engineering/Design, Sales, Administration and Manufacturing: - Secure Systems & Information Assurance - Systems, Subsystems & Components |
17,800 | ||||
| Rancho Cordova, California |
Engineering/Design, Sales and Manufacturing: - Systems, Subsystems & Components |
16,000 | ||||
| Melbourne, Florida |
Engineering/Design, Sales and Manufacturing: - Systems, Subsystems & Components |
16,000 | ||||
| Girard, Pennsylvania |
Storage: - Systems, Subsystems & Components |
8,700 | ||||
| Columbia, Maryland |
Engineering/Design and Sales: - Systems, Subsystems & Components |
7,000 | ||||
| South Plainfield, New Jersey |
Engineering/Design, Sales and Manufacturing: - Secure Systems & Information Assurance |
4,300 | ||||
| Great Yarmouth, United Kingdom |
Storage: - Systems, Subsystems & Components |
4,200 | ||||
| Schwabach, Germany |
Sales Office: - Systems, Subsystems & Components |
3,000 | ||||
| * | Property sold/leased back on December 13, 2013 |
29
Table of Contents
We also operate from owned facilities in the following locations:
| Location |
Description |
Approximate Square Footage |
Principal Balance Outstanding at November 30, 2014 on Related Mortgage |
|||||||
| Great Yarmouth, United Kingdom |
Engineering/Design, Sales, Administration and Manufacturing: - Systems, Subsystems & Components |
112,000 | N/A | |||||||
| Fairview, Pennsylvania (includes two facilities) |
Engineering/Design, Sales, Administration and Manufacturing: - Systems, Subsystems & Components |
53,000 | N/A | |||||||
| Wesson, Mississippi |
Manufacturing: - Systems, Subsystems & Components |
50,000 | N/A | |||||||
| Gloucester, United Kingdom |
Engineering/Design, Sales, Administration and Manufacturing: - Secure Systems & Information Assurance |
24,300 | $ | 1,151,000 | ||||||
| Auburn, New York |
Engineering/Design, Sales and Manufacturing: - Systems, Subsystems & Components |
21,000 | N/A | |||||||
| Philadelphia, Pennsylvania |
Engineering/Design, Sales and Manufacturing: - Systems, Subsystems & Components |
20,000 | N/A | |||||||
| Ogdensburg, New York |
Building Held for Sale | 16,000 | N/A | |||||||
| Delmar, Delaware |
Engineering/Design, Sales and Manufacturing: - Systems, Subsystems & Components |
15,000 | N/A | |||||||
Our executive corporate offices are located at 4705 S. Apopka Vineland Rd. Suite 210, Orlando, Florida.
All of the owned facilities are subject to liens to secure the amounts owed under our Term Loan Agreement.
We believe that our facilities are suitable and adequate to meet our needs. We will continue to consolidate certain of our operations that will result in reduced overhead expenses and greater overall efficiencies and profitability.
| ITEM 3. | LEGAL PROCEEDINGS |
Information with respect to legal proceedings can be found in Note 20 “Commitments and Contingencies” to the Consolidated Financial Statements contained in this Annual Report on Form 10-K, and such information is incorporated herein by reference.
| ITEM 4. | MINE SAFETY DISCLOSURES |
Not applicable.
30
Table of Contents
PART II
| ITEM 5. | MARKET FOR REGISTRANT’ S COMMON EQUITY, RELATED STOCKHOLDER MATTERS AND ISSUER PURCHASES OF EQUITY SECURITIES |
Our shares of common stock trade on the NASDAQ Capital Market under the ticker symbol ANTY. None of the shares of our subsidiaries are publicly traded.
The following table lists the reported high and low common stock sales prices on the NASDAQ Capital Market.
| High | Low | |||||||
| Year ended November 30, 2014 |
||||||||
| Fourth Quarter (11/30/14) |
$ | 2.69 | $ | 1.91 | ||||
| Third Quarter (8/31/14) |
$ | 2.85 | $ | 1.82 | ||||
| Second Quarter (5/31/14) |
$ | 3.15 | $ | 2.20 | ||||
| First Quarter (2/28/14) |
$ | 3.86 | $ | 2.75 | ||||
| Year ended November 30, 2013 |
||||||||
| Fourth Quarter (11/30/13) |
$ | 3.80 | $ | 2.73 | ||||
| Third Quarter (8/31/13) |
$ | 3.18 | $ | 2.50 | ||||
| Second Quarter (5/31/13) |
$ | 2.90 | $ | 2.31 | ||||
| First Quarter (2/28/13) |
$ | 3.08 | $ | 2.45 | ||||
Registered Holders of our Common Stock
As of February 3, 2015, we had approximately 131 common shareholders of record, although there are a larger number of beneficial owners.
Dividends
Since our inception, we have not paid any dividends on our shares of common stock. In addition, our loan documents limit our ability to pay dividends or distributions subject to customary exceptions. We do not anticipate that we will pay dividends on our common stock in the foreseeable future. API Sub has not and does not intend to pay any dividends on its common shares. Dividends on Exchangeable Shares will only be paid to the extent that dividends, if any, are paid on our common shares.
Recent Sales of Unregistered Securities
We did not sell any unregistered equity securities in fiscal 2014.
Recent Repurchases of our Shares
We did not repurchase any shares of our common stock during the three months ended November 30, 2014.
31
Table of Contents
Performance Graph
The following graph compares the cumulative 5-year total return provided shareholders on our common stock relative to the cumulative total returns of the NASDAQ Composite index and the NASDAQ Electronic Components index. An investment of $100 (with reinvestment of all dividends) is assumed to have been made in our common stock and in each of the indexes on November 30, 2009 and its relative performance is tracked through November 30, 2014. The stock price performance included in this graph is not necessarily indicative of future stock price performance.
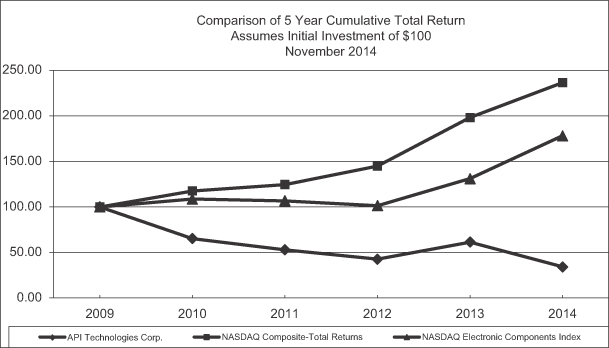
| 11/30/09 | 11/30/10 | 11/30/11 | 11/30/12 | 11/30/13 | 11/30/14 | |||||||||||||||||||
| API Technologies Corp. |
100.00 | 65.16 | 52.90 | 42.42 | 61.29 | 34.03 | ||||||||||||||||||
| NASDAQ Composite – Total Returns |
100.00 | 117.58 | 124.53 | 144.88 | 198.08 | 236.57 | ||||||||||||||||||
| NASDAQ Electronic Components Index |
100.00 | 108.63 | 106.66 | 101.34 | 130.99 | 178.05 | ||||||||||||||||||
32
Table of Contents
| ITEM 6. | SELECTED FINANCIAL DATA |
The operating and balance sheet data included in the following selected financial data table have been derived from the consolidated financial statements of API Technologies Corp. and its subsidiaries. The selected financial data presented below should be read in conjunction with the consolidated financial statements included in Item 8 of this Annual Report on Form 10-K and with Item 7. “Management’s Discussion and Analysis of Financial Condition and Results of Operations.”
| Operating Data: |
Year Ended Nov. 30, 2014 |
Year Ended Nov. 30, 2013 |
Year Ended Nov. 30, 2012 |
Six Months Ended Nov. 30, 2011 |
Year
Ended May 31, 2011 (A) |
Year Ended May 31, 2010 (A) |
||||||||||||||||||
| Revenue |
$ | 226,857 | $ | 244,300 | $ | 242,381 | $ | 124,317 | $ | 96,045 | $ | 56,072 | ||||||||||||
| Cost of revenues |
||||||||||||||||||||||||
| Cost of revenues |
173,697 | 192,279 | 186,209 | 94,702 | 77,538 | 41,493 | ||||||||||||||||||
| Restructuring charges |
1,064 | 1,405 | 9,742 | 130 | 1,731 | 220 | ||||||||||||||||||
|
|
|
|
|
|
|
|
|
|
|
|
|
|||||||||||||
| Total cost of revenues |
174,761 | 193,684 | 195,951 | 94,832 | 79,269 | 41,713 | ||||||||||||||||||
|
|
|
|
|
|
|
|
|
|
|
|
|
|||||||||||||
| Gross profit |
52,096 | 50,616 | 46,430 | 29,485 | 16,776 | 14,359 | ||||||||||||||||||
|
|
|
|
|
|
|
|
|
|
|
|
|
|||||||||||||
| Operating expenses |
||||||||||||||||||||||||
| General and administrative |
23,069 | 25,873 | 24,957 | 11,478 | 15,499 | 8,755 | ||||||||||||||||||
| Selling expenses |
14,541 | 15,015 | 14,440 | 7,169 | 5,569 | 1,901 | ||||||||||||||||||
| Research and development |
8,270 | 9,190 | 9,610 | 4,596 | 1,885 | 1,256 | ||||||||||||||||||
| Business acquisition and related charges |
479 | 849 | 4,027 | 638 | 12,798 | 2,454 | ||||||||||||||||||
| Restructuring |
1,153 | 1,212 | 7,337 | 1,628 | 2,802 | 414 | ||||||||||||||||||
| Goodwill impairment |
— | — | 107,495 | — | — | — | ||||||||||||||||||
|
|
|
|
|
|
|
|
|
|
|
|
|
|||||||||||||
| 47,512 | 52,139 | 167,866 | 25,509 | 38,553 | 14,780 | |||||||||||||||||||
|
|
|
|
|
|
|
|
|
|
|
|
|
|||||||||||||
| Operating income (loss) |
4,584 | (1,523 | ) | (121,436 | ) | 3,976 | (21,777 | ) | (421 | ) | ||||||||||||||
| Other expense (income) net |
||||||||||||||||||||||||
| Interest expense (income), net |
11,765 | 14,208 | 16,209 | 6,987 | 3,281 | 2,069 | ||||||||||||||||||
| Amortization of note discounts and deferred financing costs |
10,940 | 13,020 | 15,684 | 1,125 | 2,776 | — | ||||||||||||||||||
| Other expense (income), net |
(477 | ) | (14 | ) | 813 | 179 | (1,175 | ) | (1,792 | ) | ||||||||||||||
|
|
|
|
|
|
|
|
|
|
|
|
|
|||||||||||||
| 22,228 | 27,214 | 32,706 | 8,291 | 4,882 | 277 | |||||||||||||||||||
| Loss from continuing operations before income taxes |
(17,644 | ) | (28,737 | ) | (154,142 | ) | (4,315 | ) | (26,659 | ) | (698 | ) | ||||||||||||
| Expense (benefit) for income taxes |
1,270 | (5,335 | ) | (5,307 | ) | (10,987 | ) | (2,680 | ) | 13 | ||||||||||||||
|
|
|
|
|
|
|
|
|
|
|
|
|
|||||||||||||
| Income (loss) from continuing operations, net of income taxes |
(18,914 | ) | (23,402 | ) | (148,835 | ) | 6,672 | (23,979 | ) | (711 | ) | |||||||||||||
| Income (loss) from discontinued operations, net of income taxes |
— | 16,174 | 132 | 1,212 | (2,238 | ) | (8,304 | ) | ||||||||||||||||
|
|
|
|
|
|
|
|
|
|
|
|
|
|||||||||||||
| Net income (loss) |
$ | (18,914 | ) | $ | (7,228 | ) | $ | (148,703 | ) | $ | 7,884 | $ | (26,217 | ) | $ | (9,015 | ) | |||||||
| Accretion on preferred stock |
(393 | ) | (1,057 | ) | — | — | — | — | ||||||||||||||||
|
|
|
|
|
|
|
|
|
|
|
|
|
|||||||||||||
| Net income (loss) attributable to common shareholders |
$ | (19,307 | ) | $ | (8,285 | ) | $ | (148,703 | ) | $ | 7,884 | $ | (26,217 | ) | $ | (9,015 | ) | |||||||
|
|
|
|
|
|
|
|
|
|
|
|
|
|||||||||||||
| Income (loss) per share from continuing operations – Basic and diluted |
$ | (0.35 | ) | $ | (0.44 | ) | $ | (2.69 | ) | $ | 0.13 | $ | (1.16 | ) | $ | (0.08 | ) | |||||||
| Income (loss) per share from discontinued operations – Basic and diluted |
$ | 0.00 | $ | 0.29 | $ | 0.00 | $ | 0.02 | $ | (0.11 | ) | $ | (0.96 | ) | ||||||||||
|
|
|
|
|
|
|
|
|
|
|
|
|
|||||||||||||
| Net income (loss) per share– Basic and diluted |
$ | (0.35 | ) | $ | (0.15 | ) | $ | (2.69 | ) | $ | 0.15 | $ | (1.27 | ) | $ | (1.04 | ) | |||||||
|
|
|
|
|
|
|
|
|
|
|
|
|
|||||||||||||
| Weighted average shares outstanding |
||||||||||||||||||||||||
| Basic |
55,448,862 | 55,405,764 | 55,314,263 | 53,790,766 | 20,657,757 | 8,693,498 | ||||||||||||||||||
| Diluted |
55,448,862 | 55,405,764 | 55,314,263 | 53,802,763 | 20,657,757 | 8,693,498 | ||||||||||||||||||
| Balance Sheet Data: |
||||||||||||||||||||||||
| Total assets |
$ | $282,840 | $ | 304,578 | $ | 392,715 | $ | 506,447 | $ | 273,172 | $ | 68,944 | ||||||||||||
| Long-term debt (including capital lease obligations) |
$ | $128,311 | $ | 104,761 | $ | 181,831 | $ | 167,184 | $ | 1,932 | $ | 22,708 | ||||||||||||
| Asset retirement obligations |
$ | $1,154 | $ | 1,135 | $ | 1,048 | $ | — | $ | — | $ | — | ||||||||||||
| Redeemable preferred stock |
$ | — | $ | 26,326 | $ | 25,581 | $ | — | $ | — | $ | — | ||||||||||||
| Total shareholders’ equity |
$ | $110,764 | $ | 131,103 | $ | 138,973 | $ | 281,464 | $ | 241,726 | $ | 18,938 | ||||||||||||
| (A) | Adjusted for the discontinued operations of Data Bus |
33
Table of Contents
| ITEM 7. | MANAGEMENT’S DISCUSSION AND ANALYSIS OF FINANCIAL CONDITION AND RESULTS OF OPERATIONS |
Introduction
This section is provided as a supplement to, and should be read in conjunction with, the audited Consolidated Financial Statements and Notes thereto and the other financial information that appears elsewhere in this Annual Report to help provide an understanding of our financial condition, changes in financial condition and results of our operations.
As discussed below, in fiscal 2013 we sold Data Bus and Sensors. The results of Data Bus and Sensors are presented as discontinued operations for all periods presented.
Business Overview of API Technologies Corp.
We design, develop and manufacture high reliability RF microwave, millimeterwave, microelectronics, power, and security products and solutions to the defense, aerospace, industrial, satellite, and commercial end markets. In addition, we provide electronics manufacturing services to such markets. We own and operate several state-of-the-art manufacturing facilities in the United States, the United Kingdom, Canada, China and Mexico.
Operating through our three segments, Systems, Subsystems & Components (SSC), Electronic Manufacturing Services (EMS) and Secure Systems & Information Assurance (SSIA), we are positioned as a differentiated solution provider to U.S. and U.S. friendly governments, military, defense, aerospace and homeland security contractors, and leading industrial and commercial firms. With a focus on high-reliability products and solutions, our product portfolio spans RF/microwave and microelectronics, electromagnetics, power products, and security products. We also offer a wide range of electronic manufacturing services from prototyping to high volume production.
On March 21, 2014, we entered into Amendment No. 2 to Credit Agreement (the “Amendment No. 2”), by and among the Company, as borrower, the lenders party thereto and Guggenheim Corporate Funding, LLC, as administrative agent (the “Agent”). Amendment No. 2 amends the Credit Agreement, dated as of February 6, 2013, by and among the Company, as borrower, the lenders party thereto and Agent (as amended, supplemented or modified from time to time, the “Term Loan Agreement”) to provide for an incremental term loan facility in an aggregate principal amount equal to $55.0 million (the “Incremental Term Loan Facility”). The Incremental Term Loan Facility is subject to substantially the same terms and conditions, including the applicable interest rate and the maturity date of February 6, 2018, as the $165.0 million term loan facility provided upon the initial closing of the Term Loan Agreement. In addition, Amendment No. 2 amends the Term Loan Agreement to reduce the minimum interest coverage ratio and increase the maximum leverage ratio, among other things.
The proceeds of the Incremental Term Loan Facility were used (i) to pay in full the amounts due under a Credit Agreement (the “Revolving Loan Agreement”), by and among the Company and certain of its U.S. subsidiaries, as borrowers, the lenders from time to time party thereto and Wells Fargo Bank, National Association, as administrative agent and U.K. security trustee, which Revolving Loan Agreement was then terminated; (ii) to redeem all 26,000 shares of the Company’s Series A Mandatorily Redeemable Preferred Stock that were outstanding (as described below); (iii) to pay fees, costs and expenses associated with the Incremental Term Loan Facility and related transactions; and (iv) for general corporate purposes.
As of March 21, 2014, we redeemed all 26,000 shares of our Series A Mandatorily Redeemable Preferred Stock that were outstanding. We paid the holder of the Series A Mandatorily Redeemable Preferred Stock an aggregate of $27.6 million to effect the redemption. Following redemption, all shares of Series A Mandatorily Redeemable Preferred Stock were cancelled and such shares were returned to authorized but undesignated shares of preferred stock.
34
Table of Contents
On December 31, 2013, we completed the sale and leaseback (the “Sale/Leaseback”) of the Company’s facility located in State College, Pennsylvania. We sold the facility to an unaffiliated third party for a gross purchase price of approximately $15.5 million and lease the property from the buyer for approximately $1.3 million per year, subject to annual adjustments. We used $14.2 million of the proceeds of the Sale/Leaseback to prepay a portion of our outstanding indebtedness under the Term Loan Agreement.
On July 5, 2013, we entered into an agreement (the “APA”) with ILC Industries, LLC (“Parent”) and Data Device Corporation, a Delaware corporation and a wholly owned subsidiary of Parent (the “Purchaser”) pursuant to which we sold to the Purchaser certain assets comprising the Company’s data bus business (“Data Bus”) in the U.S. and the U.K., including substantially all of the assets of the Company’s wholly owned subsidiary, National Hybrid, Inc., a New York corporation (the “Asset Sale”). The Purchaser paid us approximately $32.2 million in cash for the assets, after certain adjustments based on closing inventory values as set forth in the APA and customary indemnification provisions. Substantially all of the proceeds from the Asset Sale were used to repay certain of our outstanding debt.
On April 17, 2013 we sold all of the issued and outstanding shares of capital stock or other equity interests of Spectrum Sensors and Controls, Inc., a Pennsylvania corporation (“Sub 1”), Spectrum Sensors and Controls, LLC, a California limited liability company (“Sub 2”), and Spectrum Sensors and Controls, Inc., an Ohio corporation (“Sub 3” and together with Sub 1 and Sub 2, “Sensors”), for gross cash proceeds of approximately $51.4 million. Of this amount, $1.5 million was placed into an escrow account for 12 months to secure any indemnification claims made by the purchaser against the sellers, API and Spectrum Control, Inc. (“Spectrum”), a wholly owned subsidiary of API, which was paid in April 2014.
Commencing in 2010, we began various cost reduction initiatives to rationalize the number of our facilities and personnel, which has resulted in us consolidating certain parts of our manufacturing operations. During the year ended November 30, 2013, we also began the consolidation of certain parts of our Ottawa, Canada operations to State College, Pennsylvania. The collective impact of these changes has resulted in a net reduction of costs of approximately $43.9 million on an annualized basis.
Operating Revenues
We derive operating revenues from our three principal business segments: Systems, Subsystems & Components (SSC); Electronic Manufacturing Services (EMS); and Secure Systems & Information Assurance (SSIA). We sell our products to customers throughout the world, with a concentration in North America, western Europe, and the Asia-Pacific region.
Systems, Subsystems & Components (SSC) Revenue includes high-performance RF/microwave, microelectronics, millimeter wave, electromagnetic, power, and microelectronics solutions used in high-reliability defense, space, industrial and commercial applications, including missile systems, radar systems, electronic warfare systems (e.g. counter-IED RF jamming devices), unmanned air, ground and robotic systems, satellites, as well as industrial, medical, energy and telecommunications products. The main demand today for our SSC products come from U.S. friendly governments, including militaries, defense organizations, commercial aerospace, space, homeland security, prime defense contractors and manufacturers of industrial products.
Electronic Manufacturing Services (EMS) Revenue includes high speed surface mount circuit card assemblies using both surface mount and thru-hole processes, electromechanical assemblies, system and integrated level solutions used in high-reliability defense, industrial, and commercial applications. The main demand today for our EMS products come from various defense organizations, aerospace, prime defense contractors and manufacturers of industrial, medical and commercial products.
Secure Systems & Information Assurance (SSIA) Revenue includes revenues derived from the manufacturing of TEMPEST and Emanation control products, ruggedized computers and peripherals, secure mobile devices, secure access and information assurance products. The principal market for these products are the defense
35
Table of Contents
industries of the United States, Canada and the United Kingdom and other U.S. friendly governments, Fortune 500 companies and telecommunication service providers
Cost of Revenues
We conduct all of our design and manufacturing efforts in the United States, Canada, United Kingdom, Mexico and China. Cost of goods sold primarily consists of costs that were incurred to manufacture, test and ship the products and some design costs for customer funded research and development (“R&D”). These costs include raw materials, including freight, direct labor, subcontractor services, tooling required to design and build the parts, and the cost of testing (labor and equipment) the products throughout the manufacturing process and final testing before the parts are shipped to the customer. Other costs include provision for obsolete and slow moving inventory, and restructuring charges related to the consolidation of operations.
Operating Expenses
Operating expenses consist of selling, general, administrative expenses, research and development, business acquisition and related charges and other income or expenses.
Selling, General and Administrative Expenses
Selling, general and administrative (“SG&A”) expenses include compensation and benefit costs for all employees, including sales and customer service, sales commissions, executive, finance and human resource personnel. Also included in SG&A is compensation related to stock-based awards to employees and directors, professional services for accounting, legal and tax, information technology, rent and general corporate expenditures.
Research and Development Expenses
R&D expenses represent the cost of our development efforts. R&D expenses include salaries of engineers, technicians and related overhead expenses, the cost of materials utilized in research, and additional engineering or consulting services. R&D costs are expensed as incurred.
Business Acquisition and Related Charges
Business acquisition charges primarily represent costs of engaging outside legal, accounting, due diligence, business valuation consultants and accelerated stock option expenses related to business combinations or divestitures. Related charges include costs incurred related to our efforts to consolidate operations of recently acquired and legacy businesses and expenses associated with divestitures.
Other Expenses (Income)
Other expenses (income) consists of interest expense on term loans, notes payable, operating loans and capital leases, interest income on cash and cash equivalents and marketable securities, amortization of note discounts and deferred financing costs, gains or losses on disposal of property and equipment, and gains or losses on foreign currency transactions.
Backlog
Our sales backlog at November 30, 2014 was approximately $120.7 million compared to approximately $131.0 million at November 30, 2013. Our backlog figures represent confirmed customer purchase orders that we had not shipped at the time the figures were calculated. We anticipate that approximately $86.0 million of our backlog orders will be filled in fiscal 2015. We lack control over the timing of new purchase orders, as such, the backlog can increase or decrease significantly based on timing of customer purchase orders.
36
Table of Contents
| (dollar amounts in
thousands) As at November 30, |
||||||||||||
| 2014 | 2013 | % Change |
||||||||||
| Backlog by segments: |
||||||||||||
| SSC |
$ | 98,111 | $ | 96,493 | 1.7 | % | ||||||
| EMS |
19,077 | 25,028 | (23.8 | )% | ||||||||
| SSIA |
3,481 | 9,489 | (63.3 | )% | ||||||||
|
|
|
|
|
|
|
|||||||
| $ | 120,669 | $ | 131,010 | (7.9 | )% | |||||||
|
|
|
|
|
|
|
|||||||
The decrease at November 30, 2014 compared to November 30, 2013 was primarily related to our EMS segment as a result of lower bookings in the year ended November 30, 2014, our SSIA segment as a result of higher SSIA revenues and lower bookings in the year ended November 30, 2014, partially offset by increased SSC bookings in the year ended November 30, 2014.
Results of Operations
Year Ended November 30, 2014 Compared to Year Ended 2013
The following discussion of results of operations is a comparison of our year ended November 30, 2014 and 2013.
Segment Operating Revenue and Adjusted EBITDA
Financial information for each of our segments is set forth in Part II- Item 8, Financial Statements and Supplementary Data, Note 22 “Segment Information and Geographical Data” to our audited consolidated financial statements included in this Annual Report on Form 10-K. In deciding how to allocate resources and assess performance, our chief operating decision maker regularly evaluates the performance of our reportable segments on the basis of revenue and adjusted EBITDA. Segment adjusted EBITDA assists us in comparing our segment performance over various reporting periods because it removes from our operating results the impact of items that our management believes do not reflect our core operating performance. Our reportable segment measure of adjusted EBITDA is not a recognized measure under GAAP and should not be considered an alternative to, or more meaningful than, net income (loss) or other measures of financial performance derived in accordance with GAAP. Our segment adjusted EBITDA may not be comparable to similarly titled measures of other companies because other entities may not calculate segment adjusted EBITDA in the same manner.
Our segment Adjusted EBITDA is defined as income from continuing operations before income taxes, interest, depreciation and amortization, and excluding other items. Such items include stock-based compensation expense, non-cash inventory provisions, corporate franchise taxes, acquisition related charges, restructuring charges, financing related costs, foreign exchange losses, reversal of contingency accruals, change in benefit liability and lease payments related to the Sale/Leaseback.
| (dollar amounts in
thousands) Year ended November 30, |
||||||||||||
| 2014 | 2013 | % Change |
||||||||||
| Revenues by segments: |
||||||||||||
| SSC |
$ | 162,454 | $ | 170,685 | (4.8 | )% | ||||||
| EMS |
42,404 | 55,315 | (23.3 | )% | ||||||||
| SSIA |
21,999 | 18,300 | 20.2 | % | ||||||||
|
|
|
|
|
|
|
|||||||
| $ | 226,857 | $ | 244,300 | (7.1 | )% | |||||||
|
|
|
|
|
|
|
|||||||
37
Table of Contents
Consolidated revenues for the year ended November 30, 2014 decreased 7.1% over the year ended November 30, 2013. The decrease was due primarily to lower revenues in our EMS segment. The SSC segment decreased by less than 5.0% primarily due to the timing of certain key defense programs. The decrease in the EMS and SSC segments was partially offset by an increase in revenues at the SSIA segment. The SSIA revenues increased primarily due to new customer programs.
| (dollar amounts in thousands) Year ended November 30, |
||||||||||||
| 2014 | 2013 | % Change |
||||||||||
| Segment Adjusted EBITDA: |
||||||||||||
| SSC |
$ | 22,372 | $ | 22,601 | (1.0 | )% | ||||||
| EMS |
(245 | ) | 467 | (152.5 | )% | |||||||
| SSIA |
3,614 | 4,064 | (11.1 | )% | ||||||||
The SSC segment adjusted EBITDA for the year ended November 30, 2014 was comparable to 2013, although adjusted EBITDA margin increased compared to fiscal 2013 as a result of improved product mix and increased efficiencies. During the year ended November 30, 2014, the decrease in our EMS segment adjusted EBITDA was primarily due to lower revenues, partially offset by cost reductions in the year ended November 30, 2014 compared to the prior year. The SSIA segment has lower adjusted EBITDA compared to the prior year as a result of a change in product mix in the year ended November 30, 2014, due primarily to the completion of a contract in the year ended November 30, 2014 with a low margin profile.
Operating Expenses
Cost of Revenues and Gross Margin
| Year ended November 30, | ||||||||
| 2014 | 2013 | |||||||
| Gross margin by segments: |
||||||||
| SSC |
27.0 | % | 24.8 | % | ||||
| EMS |
4.6 | % | 2.9 | % | ||||
| SSIA |
28.5 | % | 36.0 | % | ||||
| Overall |
23.0 | % | 20.7 | % | ||||
Our consolidated gross margin for the year ended November 30, 2014 increased 2.3 percentage points compared to the prior year. Gross profit margin varies from period to period and can be affected by a number of factors, including product mix, new product introduction, production efficiency, inventory obsolescence and restructuring activities. Overall cost of revenues from continuing operations as a percentage of sales decreased for the year ended November 30, 2014 to 77.0% compared to 79.3% for the same period in 2013. The SSC segment cost of revenues for fiscal 2014 decreased 2.2 percentage points compared to fiscal 2013, mainly as a result of a change in product mix in fiscal 2014, as we shipped products on certain programs with lower costs of revenues. The EMS segment cost of revenues in fiscal 2014 decreased by 1.7 percentage points compared to fiscal 2013 primarily as a result of cost reductions realized in fiscal 2014 compared to fiscal 2013. The cost of revenues for the SSIA segment increased 7.5 percentage points in fiscal 2014 compared to fiscal 2013 as a result of an unfavorable product mix in the year ended November 30, 2014, due primarily to the completion of a contract with a lower margin profile. Consolidated restructuring costs recorded in cost of revenues in fiscal 2014 decreased to approximately $1.1 million from approximately $1.4 million for the year ended November 30, 2013.
General and Administrative Expenses
Consolidated general and administrative expenses from continuing operations decreased to approximately $23.1 million for the year ended November 30, 2014 from $25.9 million for the year ended November 30, 2013. The decrease is primarily a result of lower salaries, lower amortization of intangibles and professional fees for
38
Table of Contents
the full year of fiscal 2014 and reduced stock based compensation. As a percentage of sales, general and administrative expenses were 10.2% for the year ended November 30, 2014, compared to 10.6% for the year ended November 30, 2013.
The major components of general and administrative expenses are as follows:
| (dollar amounts in thousands) Year ended November 30, |
||||||||||||||||
| 2014 | % of sales |
2013 | % of sales |
|||||||||||||
| Depreciation and Amortization |
$ | 9,681 | 4.3 | % | $ | 10,662 | 4.4 | % | ||||||||
| Payroll expense—General and Administrative |
$ | 7,298 | 3.2 | % | $ | 8,649 | 3.5 | % | ||||||||
| Professional Services (including Audit and Legal) |
$ | 1,784 | 0.8 | % | $ | 2,377 | 1.0 | % | ||||||||
| Stock based compensation—general and administrative |
$ | (16 | ) | 0.0 | % | $ | 928 | 0.4 | % | |||||||
Selling Expenses
Selling expenses from continuing operations decreased to approximately $14.5 million for the year ended November 30, 2014 from approximately $15.0 million for the year ended November 30, 2013. The decrease was largely due to lower sales subject to commissions and lower sales salaries. As a percentage of sales, consolidated selling expenses were 6.4% for the year ended November 30, 2014, compared to 6.1% for the year ended November 30, 2013.
The major components of selling expenses are as follows:
| (dollar amounts in thousands) Year ended November 30, |
||||||||||||||||
| 2014 | % of sales |
2013 | % of sales |
|||||||||||||
| Payroll Expense—Sales |
$ | 8,142 | 3.6 | % | $ | 8,034 | 3.3 | % | ||||||||
| Commissions |
$ | 4,077 | 1.8 | % | $ | 4,535 | 1.9 | % | ||||||||
| Advertising |
$ | 1,118 | 0.5 | % | $ | 1,033 | 0.4 | % | ||||||||
Research and Development Expenses
Research and development costs from continuing operations decreased to approximately $8.3 million for the year ended November 30, 2014 compared to approximately $9.2 million for the year ended November 30, 2013. The decrease was primarily due to more engineering time spent supporting manufacturing than on research and development. As a percentage of sales, research and development expenses were 3.6% for the year ended November 30, 2014, compared to 3.8% for the year ended November 30, 2013.
Business acquisition and related charges
Business acquisition charges primarily represent costs of engaging outside legal, accounting, due diligence, and business valuation consultants and accelerated stock option expenses related to business combinations or divestitures. For the year ended November 30, 2014, business acquisition charges of approximately $0.5 million compared to approximately $0.8 million for the year ended November 30, 2013, which related primarily to the sale of Data Bus and Sensors operations.
Operating Income (Loss)
We recorded operating income from continuing operations for the year ended November 30, 2014 of approximately $4.6 million compared to an operating loss of approximately $1.5 million for the year ended November 30, 2013. The increase in operating income of approximately $6.1 million is attributed to improved financial results in our SSC segment due largely to (1) improved product mix in fiscal 2014, as we shipped products on certain programs with lower costs of revenues and (2) lower operating and restructuring expenses.
39
Table of Contents
Other Expense (Income), net
Total other expense for the year ended November 30, 2014 was approximately $22.2 million, compared to other expense of $27.2 million for the year ended November 30, 2013.
The decrease in other expense is largely attributable to a decrease in interest expense of approximately $2.4 million largely due to lower debt levels throughout the year ended November 30, 2014 compared to the prior year, and the lower write-off of approximately $2.1 million of discounts and deferred financing costs following the March 21, 2014 debt extinguishment during the year ended November 30, 2014 compared to fiscal 2013.
Income Taxes
Income taxes from continuing operations is a net expense of approximately $1.3 million for the year ended November 30, 2014, compared to an income tax benefit of approximately $5.3 million for the year ended November 30, 2013. The current provision is less than the statutory tax rate due to non-deductible expenses, as well as the recording of a valuation allowance against deferred tax assets due to a history of cumulative losses and the federal and state benefit of current losses from continuing operations. The prior year benefit primarily related to the Company’s prior year end tax losses.
Income From Discontinued Operations (net of tax)
We recorded no income from discontinued operations for the year ended November 30, 2014, compared to income from discontinued operations of approximately of approximately $16.2 million in fiscal 2013. This decrease in income is attributable to the operations of and the gain on the sales of our Data Bus assets and Sensors operations in fiscal 2013. During the year ended November 30, 2013, we recorded pre-tax gains on the sales of Data Bus and Sensors of approximately $10.0 million and $11.8 million, respectively.
Net loss
We recorded a net loss for the year ended November 30, 2014 of approximately $18.9 million, compared to a net loss of approximately $7.2 million for the year ended November 30, 2013. The increase in net loss is largely due to the $16.2 million income from discontinued operations in fiscal 2013, partially offset by the lower write-off of approximately $2.1 million of discounts and deferred financing costs in fiscal 2014, a decrease in interest expense of approximately $2.5 million from lower debt levels throughout fiscal 2014, lower restructuring and business acquisition and related charges in fiscal 2014, and higher overall financial results in our SSC segment in fiscal 2014 as a result of a change in product mix.
Year Ended November 30, 2013 Compared to Year Ended 2012
The following discussion of results of operations is a comparison of our year ended November 30, 2013 and 2012.
Operating Revenue
| (dollar amounts in
thousands) Year ended November 30, |
||||||||||||
| 2013 | 2012 | % Change |
||||||||||
| Revenues by segments: |
||||||||||||
| SSC |
$ | 170,685 | $ | 160,579 | 6.3 | % | ||||||
| EMS |
55,315 | 59,300 | (6.7 | )% | ||||||||
| SSIA |
18,300 | 22,502 | (18.7 | )% | ||||||||
|
|
|
|
|
|
|
|||||||
| $ | 244,300 | $ | 242,381 | 0.8 | % | |||||||
|
|
|
|
|
|
|
|||||||
40
Table of Contents
We recorded a 0.8% increase in consolidated revenues for the year ended November 30, 2013 over the year ended November 30, 2012. The increase is attributed to the SSC segment primarily as a result of the acquisition of C-MAC on March 22, 2012. The impact of a full year of operations of C-MAC represented approximately $6.6 million of incremental revenue for the SSC segment in fiscal 2013. The increase in the SSC segment was partially offset by a decrease in revenues at the EMS segment and SSIA segment. During the year ended November 30, 2013, our EMS revenue decreased primarily from lower revenues to the defense end market. The SSIA revenue decrease of 18.7% primarily resulted from decreased revenue generated by our subsidiaries in the United States ($0.7 million), Canada ($1.0 million) due to lower revenue from several existing customers and in the United Kingdom ($2.5 million) due to the completion of a significant program in 2012. During fiscal 2013, some of our customer orders and associated revenue were impacted by the U.S. government budget Sequestration. Some of our customers delayed placing orders and some placed orders in smaller increments than historical rates given the uncertainty about which programs would be funded.
For a discussion of our definition of adjusted EBITDA, how management uses it to evaluate the performance of our reportable segments and the material limitations on its usefulness, refer to “Segment Operating Revenue and Adjusted EBITDA” on page 37.
| (dollar amounts in thousands) Year ended November 30, |
||||||||||||
| 2013 | 2012 | % Change |
||||||||||
| Segment Adjusted EBITDA: |
||||||||||||
| SSC |
$ | 22,601 | $ | 27,822 | (18.8 | )% | ||||||
| EMS |
467 | (508 | ) | 191.9 | % | |||||||
| SSIA |
4,064 | 4,488 | (9.4 | )% | ||||||||
The SSC segment adjusted EBITDA for the year ended November 30, 2013 was lower than 2012, primarily due to the impact of changes in product mix in the year ended November 30, 2013 compared to fiscal 2012, partially offset by the impact of higher revenues following a full year of operations of C-MAC following the March 22, 2012 acquisition. During the year ended November 30, 2013, the increase in our EMS segment adjusted EBITDA was primarily due to improved product mix in the year ended November 30, 2013 compared to the prior year. The SSIA segment has lower adjusted EBITDA compared to fiscal 2012, as a result of lower revenues in the year ended November 30, 2013 compared to fiscal 2012, partially offset by realized benefits from consolidation efforts and cost cutting measures.
Operating Expenses
Cost of Revenues and Gross Margin
| Year ended November 30, | ||||||||
| 2013 | 2012 | |||||||
| Gross margin by segments: |
||||||||
| SSC |
24.8 | % | 28.7 | % | ||||
| EMS |
2.9 | % | (12.4 | )% | ||||
| SSIA |
36.0 | % | 34.4 | % | ||||
| Overall |
20.7 | % | 19.2 | % | ||||
Our consolidated gross margin for the year ended November 30, 2013 increased 1.5 percentage points compared to the prior year. Gross profit margin varies from period to period and can be affected by a number of factors, including product mix, new product introduction, production efficiency, inventory obsolescence and restructuring activities. Overall cost of revenues from continuing operations as a percentage of sales slightly decreased for the year ended November 30, 2013 to 79.3% compared to 80.8% for the same period in 2012. The SSC segment cost of revenues for fiscal 2013 increased 3.9 percentage points compared to the same period in
41
Table of Contents
2012, mainly as a result of a change in product mix in fiscal 2013, as we shipped products on certain programs with higher costs of revenues. The EMS segment cost of revenues in fiscal 2013 decreased by 15.3 percentage points compared to fiscal 2012 primarily as a result of restructuring charges taken in the prior year related to the EMS restructuring, including inventory and fixed asset impairments. The cost of revenues for the SSIA segment decreased 1.6 percentage points in fiscal 2013 compared to the same period of fiscal 2012 as a result of realized benefits from consolidation efforts and cost cutting measures partially offset by the impact of reduced revenues of approximately $4.2 million. Consolidated restructuring costs recorded in cost of revenues in fiscal 2013 were approximately $1.4 million compared to approximately $9.7 million for the year ended November 30, 2012.
General and Administrative Expenses
Consolidated general and administrative expenses from continuing operations increased to approximately $25.9 million for the year ended November 30, 2013 from $25.0 million for the year ended November 30, 2012. The increase is primarily a result of the addition of C-MAC, including the amortization of intangibles, for the full year of fiscal 2013 compared to March to November 2012 in fiscal 2012, which increased general and administrative expenses by approximately $1.1 million, partially offset by reduced stock based compensation. As a percentage of sales, general and administrative expenses were 10.6% for the year ended November 30, 2013, compared to 10.3% for the year ended November 30, 2012.
The major components of general and administrative expenses are as follows:
| (dollar amounts in thousands) Year ended November 30, |
||||||||||||||||
| 2013 | % of sales |
2012 | % of sales |
|||||||||||||
| Depreciation and Amortization |
$ | 10,662 | 4.4 | % | $ | 9,602 | 4.0 | % | ||||||||
| Payroll expense—General and Administrative |
$ | 8,649 | 3.5 | % | $ | 9,366 | 3.9 | % | ||||||||
| Professional Services (including Audit and Legal) |
$ | 2,377 | 1.0 | % | $ | 1,900 | 0.8 | % | ||||||||
| Stock based compensation—general and administrative |
$ | 928 | 0.4 | % | $ | 2,039 | 0.8 | % | ||||||||
Selling Expenses
Selling expenses from continuing operations increased to approximately $15.0 million for the year ended November 30, 2013 from approximately $14.4 million for the year ended November 30, 2012. The increase was largely due to the inclusion of selling expenses related to the acquisition of C-MAC on March 22, 2012, for the full year of fiscal 2013, which increased selling expenses by $0.5 million. As a percentage of sales, consolidated selling expenses were 6.1% for the year ended November 30, 2013, compared to 6.0% for the year ended November 30, 2012.
The major components of selling expenses are as follows:
| (dollar amounts in thousands) Year ended November 30, |
||||||||||||||||
| 2013 | % of sales |
2012 | % of sales |
|||||||||||||
| Payroll Expense—Sales |
$ | 8,034 | 3.3 | % | $ | 6,761 | 2.8 | % | ||||||||
| Commissions |
$ | 4,535 | 1.9 | % | $ | 4,315 | 1.8 | % | ||||||||
| Advertising |
$ | 1,033 | 0.4 | % | $ | 1,095 | 0.5 | % | ||||||||
Research and Development Expenses
Research and development costs from continuing operations decreased to approximately $9.2 million for the year ended November 30, 2013 compared to approximately $9.6 million for the year ended November 30, 2012. The decrease was largely due to cost reductions following restructuring initiatives, partially offset by the
42
Table of Contents
inclusion of research and development expenses related to the acquisition of C-MAC, on March 22, 2012, for the full year of fiscal 2013 which increased research and development expenses by $1.0 million. As a percentage of sales, research and development expenses were 3.8% for the year ended November 30, 2013, compared to 4.0% for the year ended November 30, 2012.
Business acquisition and related charges
Business acquisition charges primarily represent costs of engaging outside legal, accounting, due diligence, and business valuation consultants and accelerated stock option expenses related to business combinations or divestitures. For the year ended November 30, 2013, business acquisition charges of approximately $0.9 million related primarily to the sale of Data Bus and Sensors operations compared to approximately $4.0 million for the year ended November 30, 2012, which related primarily to the completion of the C-MAC, RTIE and CMT acquisitions.
Operating Loss
We posted an operating loss from continuing operations for the year ended November 30, 2013 of approximately $1.5 million compared to an operating loss of approximately $121.4 million for the year ended November 30, 2012. The reduction in operating losses of approximately $119.9 million is attributed to the $107.5 million goodwill impairment in fiscal 2012, which was primarily related to the EMS segment, lower restructuring expenses and business acquisition and related charges, partially offset by lower overall financial results in our SSC segment as a result of a change in product mix in fiscal 2013, as we shipped products on certain programs with higher costs of revenues.
Other Expense (Income)
Total other expense for the year ended November 30, 2013 was approximately $27.2 million, compared to other expense of $32.7 million for the year ended November 30, 2012.
The decrease in other expense is largely attributable to a decrease in interest expense of approximately $2.0 million from lower debt levels throughout the year ended November 30, 2013 compared to the prior year, and the lower write-off of approximately $2.4 million of discounts and deferred financing costs during the year ended November 30, 2013 compared to the prior year.
Income Taxes
Income taxes from continuing operations amounted to a net benefit of approximately $5.3 million for the year ended November 30, 2013, which was consistent with the income tax benefit for the year ended November 30, 2012. The benefit during the year ended November 30, 2013 is primarily related to current year tax losses. The current provision is less than the statutory tax rate due to non-deductible expenses, as well as the recording of a valuation allowance against deferred tax assets due to a history of cumulative losses and the federal and state benefit of current losses from continuing operations. The prior year benefit primarily related to the Company’s prior year end tax losses.
Income From Discontinued Operations (net of tax)
We recorded income from discontinued operations of approximately $16.2 million for the year ended November 30, 2013, compared to income from discontinued operations of approximately $0.1 million in the same period of fiscal 2012. This increase in income is attributable to the operations of and the gain on the sales of our Data Bus assets and Sensors operations. During the year ended November 30, 2013 we recorded pre-tax gains on the sales of Data Bus and Sensors of approximately $10.0 million and $11.8 million, respectively.
43
Table of Contents
Net loss
We recorded a net loss for the year ended November 30, 2013 of approximately $7.2 million, compared to a net loss of approximately $148.7 million for the year ended November 30, 2012. The decrease in net loss is largely due to the $107.5 million goodwill impairment in fiscal 2012, which was primarily related to the EMS segment, the lower write-off of approximately $2.4 million of discounts and deferred financing costs in fiscal 2013, a decrease in interest expense of approximately $2.0 million from lower debt levels throughout fiscal 2013, lower restructuring and business acquisition and related charges in fiscal 2013, partially offset by lower overall financial results in our SSC segment in fiscal 2013 as a result of a change in product mix.
Liquidity and Capital Resources
Overview and Summary
Our principal sources of liquidity include cash flows from operations, funds from borrowings and existing cash on hand.
At November 30, 2014, we held cash and cash equivalents of approximately $8.3 million compared to $6.4 million at November 30, 2013. We believe that our available cash and cash equivalents and future cash flows from operations will be sufficient to satisfy our anticipated cash requirements for the next twelve months, including scheduled debt repayments, lease commitments, planned capital expenditures, and research and development expenses. There can be no assurance, however, that unplanned capital replacements or other future events will not require us to seek additional debt or equity financing and, if so required, that it will be available on terms acceptable to us, if at all. Any issuance of additional equity could dilute our current stockholders’ ownership interests.
On March 21, 2014, we entered into Amendment No. 2, which, among other things, amends the Term Loan Agreement to provide for the Incremental Term Loan Facility. The Incremental Term Loan Facility is subject to substantially the same terms and conditions, including the applicable interest rate and the maturity date of February 6, 2018, as the $165.0 million term loan facility provided upon the initial closing of the Term Loan Agreement. As of March 21, 2014, we had borrowed $126.7 million under the Term Loan Agreement. As of November 30, 2014, we had borrowed $121.7 million under the Term Loan Agreement.
The proceeds of the Incremental Term Loan Facility were used (i) to pay in full and terminate the Revolving Loan Agreement; (ii) to redeem all 26,000 shares of our Series A Mandatorily Redeemable Preferred Stock that were outstanding; (iii) to pay fees, costs and expenses associated with the Incremental Term Loan Facility and related transactions; and (iv) for general corporate purposes.
Term Loan Agreement
The term loans incurred pursuant to the Term Loan Agreement, as amended, including the term loans incurred pursuant to the Incremental Term Loan Facility (collectively, the “Term Loans”), bear interest, at our option, at the base rate plus 6.50% or an adjusted LIBOR rate (based on one, two or three-month interest periods) plus 7.50%. For purposes of the Term Loan Agreement, the “base rate” means the highest of Wells Fargo Bank, National Association’s prime rate, the federal funds rate plus a margin equal to 0.50% and the adjusted LIBOR rate for a 3-month interest period plus a margin equal to 1.00%.
Interest is due and payable in arrears monthly for Term Loans bearing interest at the base rate and at the end of an interest period (or at each three month interval in the case of Term Loans with interest periods greater than three months) in the case of Term Loans bearing interest at the adjusted LIBOR rate. Principal payments of the Term Loans are paid at the end of each of our fiscal quarters, with the balance of any outstanding Term Loans due and payable in full on February 6, 2018. The quarterly principal payments will amortize at 1.875% for the fiscal quarters through the end of our 2015 fiscal year and at 2.50% for each of the fiscal quarters thereafter.
44
Table of Contents
Under certain circumstances, we are required to prepay the Term Loans upon the receipt of cash proceeds of certain asset sales, cash proceeds of certain extraordinary receipts and cash proceeds of certain debt or equity financings, and based on a calculation of annual excess cash flow. Mandatory prepayments resulting from assets sales or certain debt financings may require the payment of certain prepayment premiums.
The Term Loans are secured by a security interest in substantially all of the assets owned by the Company and the subsidiary guarantors.
The Term Loan Agreement contains customary affirmative and negative covenants, including covenants that limit or restrict the Company and its subsidiaries’ ability to, among other things, incur indebtedness, grant liens, dispose of assets and pay dividends or make distributions to stockholders, in each case subject to customary exceptions for a term loan of this size and type.
Pursuant to the Term Loan Agreement, we are required to maintain compliance with an interest coverage ratio and a leverage ratio and to limit our annual capital expenditures to $4.0 million per fiscal year (subject to carry-over rights). The interest coverage ratio is defined as the ratio of Consolidated EBITDA to cash Interest Expense (as each term as defined in the Term Loan Agreement), as at the end of each fiscal quarter. For each of the first three fiscal quarters during the fiscal year ending November 30, 2015, the interest coverage ratio must be not less than the ratio of 2.20:1.00 and for the fourth quarter end November 30, 2015, it must not be less that the ratio of 2.30:1.00. The leverage ratio is defined as the ratio of Funded Debt to Consolidated EBITDA (as each term as defined in the Term Loan Agreement), as at the end of each fiscal quarter. For each of the fiscal quarters during the fiscal year ending November 30, 2015, the leverage ratio must be not greater than 5.25:1.00.
As at November 30, 2014, we were in compliance with our financial covenants under the Term Loan Agreement.
The Term Loan Agreement includes customary events of default including, among other things, non-payment defaults, inaccuracy of representations and warranties, covenant defaults, cross default to material indebtedness, bankruptcy and insolvency defaults, non-compliance with ERISA laws and regulations, defaults under the security documents or guaranties, material judgment defaults, and a change of control default, in each case subject to certain exceptions for a term loan of this type. The occurrence of an event of default could result in an increased interest rate equal to 2.0% above the applicable interest rate for loans, the acceleration of our obligations pursuant to the Term Loan Agreement and an obligation of the subsidiary guarantors to repay the full amount of our borrowings under the Term Loan Agreement. If we were unable to obtain a waiver for a breach of covenant and the lenders accelerated the payment of any outstanding amounts, such acceleration may cause our cash position to deteriorate or, if cash on hand were insufficient to satisfy the payment due, may require us to obtain alternate financing to satisfy the accelerated payment. If our cash is utilized to repay any outstanding debt, we could experience an immediate and significant reduction in working capital available to operate our business.
Year Ended November 30, 2014 Compared to November 30, 2013
Cash generated by continuing operating activities of approximately $5.3 million for the year ended November 30, 2014, increased by $10.2 million from cash used by continuing operations of approximately $4.9 million for the year ended November 30, 2013. The increase in cash generated by continuing operating activities resulted primarily from lower interest payments in fiscal 2014 and a decrease in the net cash used by changes in operating assets and liabilities during fiscal 2014, primarily related to inventory and accounts payable, and higher margin SSC segment product sales during the year ended November 30, 2014 compared to the same period in 2013.
Cash generated by investing activities for the year ended November 30, 2014 was approximately $15.3 million, which consisted primarily of the $15.1 million proceeds from the sale of the State College facility, $1.5 million related to the release of restricted cash from the sale of Sensors and $1.8 million of tax refunds related to the SenDEC acquisition, partially offset by the acquisition of fixed and intangible assets of
45
Table of Contents
$3.1 million. Cash generated by investing activities for the year ended November 30, 2013 was approximately $74.8 million, due primarily to net proceeds from asset sales of approximately $80.5 million, which consisted primarily of the net proceeds of $31.4 million for the sale of the Data Bus assets, $49.1 million for the sale of the Sensors operations, $0.8 million net proceeds for the sale of certain land and building in Palm Bay, Florida and net proceeds of $0.1 million from a negotiated reduction in the final payment made in fiscal 2013 for the CMT acquisition that was previously held as restricted cash. These proceeds were partially offset by cash used for the acquisition of $3.2 million of fixed assets and intangibles and restricted cash of $1.5 million related to the sale of the Sensors operations.
Cash used by financing activities for the year ended November 30, 2014 totaled approximately $18.4 million, which resulted from $55.7 million of repayments of long-term debt, mainly related to term loans under the Term Loan Agreement, the repayment and termination of the Revolving Loan Agreement and the $27.6 million redemption of preferred shares, partially offset by $64.9 million of net proceeds associated with the Revolving Loan Agreement. Cash used by financing activities for the year ended November 30, 2013 totaled approximately $87.2 million, and resulted from the repayment of long-term debt, mainly related to the term loans under the Term Loan Agreement using the majority of the proceeds from the sale of Data Bus and Sensors, and the Lockman Electronic Holdings Limited loan, partially offset by the net proceeds associated with the loans under the Term Loan Agreement and the Revolving Loan Agreement.
Year Ended November 30, 2013 Compared to November 30, 2012
Cash used by continuing operating activities of approximately $4.9 million for the year ended November 30, 2013, was lower than cash generated by continuing operations of approximately $2.8 million for the year ended November 30, 2012. The increase in cash used by continuing operating activities resulted primarily from an increase in the net cash used by changes in operating assets and liabilities during fiscal 2013, primarily related to accounts payable, and lower margin SSC segment product sales during the year ended November 30, 2013 compared to the same period in 2012. The increase was partially offset by lower interest payments in fiscal 2013.
Cash generated by investing activities for the year ended November 30, 2013 was approximately $74.8 million, due primarily to net proceeds from asset sales of approximately $80.5 million, which consisted primarily of the net proceeds of $31.4 million for the sale of the Data Bus assets, $49.1 million for the sale of the Sensors operations, $0.8 million net proceeds for the sale of certain land and building in Palm Bay, Florida and net proceeds of $0.1 million from a negotiated reduction in the final payment made in fiscal 2013 for the CMT acquisition that was previously held as restricted cash. These proceeds were partially offset by cash used for the acquisition of $3.2 million of fixed assets and intangibles and restricted cash of $1.5 million related to the sale of the Sensors operations. Cash used by investing activities for fiscal 2012 was approximately $31.1 million, which consisted of $29.1 million for the purchase of C-MAC and RTIE net of cash acquired, and $2.5 million for the acquisition of fixed and intangible assets, partially offset by proceeds on the sale of fixed assets of approximately $0.5 million from the sale of the St. Mary’s, Pennsylvania land and building.
Cash used by financing activities for the year ended November 30, 2013 totaled approximately $87.2 million, and resulted from the repayment of long-term debt, mainly related to the term loans under the Term Loan Agreement using the majority of the proceeds from the sale of Data Bus and Sensors, and the Lockman Electronic Holdings Limited loan, partially offset by the net proceeds associated with the loans under the Term Loan Agreement and the Revolving Loan Agreement. Cash flow generated by financing activities for the year ended November 30, 2012 totaled approximately $27.0 million, and resulted from the net proceeds associated with an aggregate principal amount of $16.0 million in new term loans under the Credit Agreement and the Note that converted to shares of Series A Preferred Stock, partially offset by the repayment of long-term debt, mainly related to the term loans under the Credit Agreement.
46
Table of Contents
Contractual Obligations
Future cash payments required under debt arrangements, operating leases, unconditional purchase obligations pursuant to material contracts entered into by the Company in the normal course of business, and capital leases as of November 30, 2014 are summarized in the following table.
| (in thousands) Payments Due by Period |
||||||||||||||||||||||||||||
| Total | 2015 | 2016 | 2017 | 2018 | 2019 | Thereafter | ||||||||||||||||||||||
| Operating lease obligations (a) |
$ | 40,078 | $ | 4,116 | $ | 4,355 | $ | 3,917 | $ | 4,008 | $ | 3,689 | $ | 19,993 | ||||||||||||||
| Long-term debt obligations (b) |
128,311 | 10,028 | 13,281 | 13,249 | 85,742 | 172 | 5,839 | |||||||||||||||||||||
| Estimated interest payments |
45,646 | 11,786 | 10,723 | 9,546 | 3,249 | 1,388 | 8,954 | |||||||||||||||||||||
| Asset retirement obligations (c) |
1,154 | — | — | — | — | — | 1,154 | |||||||||||||||||||||
|
|
|
|
|
|
|
|
|
|
|
|
|
|
|
|||||||||||||||
| Total |
$ | 215,189 | $ | 25,930 | $ | 28,359 | $ | 26,712 | $ | 92,999 | $ | 5,249 | $ | 35,940 | ||||||||||||||
|
|
|
|
|
|
|
|
|
|
|
|
|
|
|
|||||||||||||||
Note: Deferred tax liabilities are omitted from this schedule because their ultimate payoff date cannot be reasonably established given the long-term nature of this obligation.
| (a) | As described in Note 20 (a) to the consolidated financial statements included in this Annual Report on Form 10-K. |
| (b) | As described in Note 12 to the consolidated financial statements included in this Annual Report on Form 10-K, including capital lease obligations. |
| (c) | As described in Note 13 to the consolidated financial statements included in this Annual Report on Form 10-K. |
Off-Balance Sheet Arrangements
The Company has no off-balance sheet arrangements.
Summary of Critical Accounting Policies and Estimates
Our significant accounting policies are fully described in the notes to our consolidated financial statements. Some of our accounting policies involved estimates that required management’s judgment in the use of assumptions about matters that were uncertain at the time the estimate was made. Different estimates, with respect to key variables used for the calculations, or changes to estimates, could potentially have had a material impact on our financial position or results of operations. The development and selection of the critical accounting estimates are described below. Dollar amounts are presented in thousands of USD.
Accounting estimates
The preparation of financial statements in conformity with generally accepted accounting principles in the United States of America requires management to make certain estimates and assumptions that affect the reported amounts in the consolidated financial statements, and the disclosures made in the accompanying notes. Examples of estimates include the provisions made for bad debts and obsolete inventory, estimates associated with annual goodwill impairment tests, and estimates of deferred income tax and liabilities. The Company also uses estimates when assessing fair values of assets and liabilities acquired in business acquisitions as well as any fair value and any related impairment charges related to the carrying value of machinery and equipment, other long-lived assets, fixed assets held for sale and discontinued operations. The Company also uses estimates in determining the remaining economic lives of long-lived assets. In addition, the Company uses assumptions when employing the Black-Scholes valuation model to estimate the fair value of share options. Despite the Company’s intention to establish accurate estimates and use reasonable assumptions, actual results may differ from these estimates.
47
Table of Contents
Cash and Cash Equivalents
Cash and cash equivalents consist of cash on hand, bank balances and investments in money market instruments with original maturities of three months or less.
Inventories
Inventories, which include materials, labor, and manufacturing overhead, are stated at the lower of cost (on a first-in, first-out basis) or net realizable value. On a quarterly basis, the Company evaluates inventories for potential write-down for identifiable obsolescence and slow moving items. The evaluation includes analysis of future demand, product mix and possible alternative uses. The Company records a provision for both excess and obsolete inventory when write-downs or write-offs are identified. Any write-down of inventory at the close of a fiscal period creates a new cost basis that subsequently would not be marked up based on changes in underlying facts and circumstances.
Fixed Assets
Fixed assets are recorded at cost less accumulated depreciation and are depreciated using the straight-line method over the following periods:
| Straight line basis |
||
| Buildings and leasehold improvements |
5-40 years | |
| Computer equipment |
3-5 years | |
| Furniture and fixtures |
5-8 years | |
| Machinery and equipment |
5-10 years | |
| Vehicles |
3 years |
Betterments are capitalized and amortized by the Company, using the same amortization basis as the underlying assets over the remaining useful life of the original asset. Betterments include renovations, major repairs and upgrades that increase the service of a fixed asset and extend the useful life. Gains and losses on depreciable assets retired or sold are recognized in the consolidated statements of operations in the year of disposal. Repairs and maintenance expenditures are expensed as incurred.
Fixed Assets Held for Sale
Certain fixed assets held for sale from within our SSC segment have been classified as held for sale in the consolidated balance sheets. The Company estimated the fair value of the net assets to be sold at approximately $150 at November 30, 2014. This land and building were part of the fixed assets held for sale reported at November 30, 2013.
Discontinued Operations
Components of the Company that have been disposed of are reported as discontinued operations. The results of operations of Data Bus and Sensors for prior periods are reported as discontinued operations (Note 5) and not included in the continuing operations.
Goodwill and Intangible Assets
Goodwill and intangible assets result primarily from business acquisitions accounted for under the purchase method. Goodwill and intangible assets with indefinite lives are not amortized but are subject to impairment by applying a fair value based test. The Company completes an annual (or more often if impairment indicators arise under the applicable accounting guidance) impairment assessment of its goodwill on a reporting unit level. The Company’s annual impairment test for goodwill is September 1st.
48
Table of Contents
The Company has three reporting units: (i) SSC, (ii) EMS, and (iii) SSIA. The goodwill in the consolidated financial statements relates to the acquisition of RTIE in March 2012, C-MAC in March 2012, Commercial Microwave Technology, Inc. (“CMT”) in November 2011, Spectrum in June 2011, and SenDEC Corp. (“SenDEC”) in January 2011. All of the goodwill relates to our SSC reporting unit, except for the goodwill associated with SenDEC, which relates to the EMS reporting unit. Goodwill represents the excess of the purchase price of acquired companies over the estimated fair value assigned to the individual assets acquired and liabilities assumed.
A two-step test is performed to assess goodwill impairment. First, the fair value of each reporting unit is compared to its carrying value. The fair value is determined based on a market approach as well as the discounted future cash flows of the subsidiary carrying the goodwill. If the calculated fair value exceeds the carrying value of the assets, goodwill is not impaired and no further testing is performed. The second step is performed if the carrying value exceeds the fair value of the goodwill. If the carrying value of the reporting unit’s goodwill exceeds its implied fair value, an impairment loss equal to the difference is recorded.
As at May 31, 2012, given lower than projected revenues and the Company’s outlook for the EMS segment, the Company determined that the appropriate triggers had been reached to perform an impairment test beyond the annual goodwill impairment test. The Company performed the first step of the goodwill impairment assessment and the carrying value of the assets exceeded the fair value. As a result of the analysis, the Company recorded a write-down of $107,495.
As at April 17, 2013, given the sale of Sensors, which was part of the SSC segment, the Company determined that the appropriate triggers had been reached to perform an impairment test beyond the annual goodwill impairment test. The Company performed the first step of the goodwill impairment assessment and the fair value of the assets exceeded the carrying value of the assets and determined that an impairment of goodwill had not occurred.
As at July 5, 2013, given the sale of Data Bus, which also was part of the SSC segment, the Company determined that the appropriate triggers had been reached to perform an impairment test beyond the annual goodwill impairment test. The Company performed the first step of the goodwill impairment assessment and the fair value of the assets exceeded the carrying value of the assets and determined that an impairment of goodwill had not occurred.
Following the required accounting guidance, the Company performed the first step of the two-step test method based on an income approach and a market approach on September 1, 2014. The respective reporting units’ future cash flows exceeded the carrying value of the underlying assets and therefore goodwill was not at risk of impairment and no further testing was required for the year ending November 30, 2014.
Intangible assets that have a finite life are amortized using the following basis over the following period:
| Non-compete agreements |
Straight line over 5 years | |
| Computer software |
Straight line over 3-5 years | |
| Customer related intangibles |
Straight line or the pattern in which the economic benefits are expected to be realized, over an estimated life of 4-15 years | |
| Marketing related intangibles |
The pattern in which the economic benefits are expected to be realized, over an estimated life of 3-10 years | |
| Technology related intangibles |
The pattern in which the economic benefits are expected to be realized, over an estimated life of 10 years |
49
Table of Contents
Long-Lived Assets
The Company periodically evaluates the net realizable values of long-lived assets, principally identifiable intangibles and capital assets, for potential impairment when events or changes in circumstances indicate that the carrying amount of such assets may not be recoverable, as determined based on the estimated future undiscounted cash flows. If such assets were considered to be impaired, the carrying value of the related assets would be reduced to their estimated fair value.
Income taxes
Deferred income tax assets and liabilities are recognized for the future tax consequences attributable to differences between financial reporting and tax bases of assets and liabilities and available net operating loss carry forwards. A valuation allowance is established to reduce tax assets if it is more likely than not that all or some portions of such tax assets will not be realized.
The Company’s valuation allowance was recorded on the deferred tax assets to provide for a reasonable provision, which in the Company’s estimation is more likely than not that all or some portions of such tax assets will not be realized. In determining the adequacy of the valuation allowance, the Company applied the authoritative guidance, and considered such factors as (i) which subsidiaries were producing income and which subsidiaries were producing losses and (ii) temporary differences occurring from depreciation and amortization which the Company expects to increase the taxable income over future periods.
The Company follows the guidance concerning accounting for uncertainty in income taxes, which clarifies the accounting and disclosure for uncertainty in tax positions. The guidance requires that the Company determine whether it is more likely than not that a tax position will not be sustained upon examination by the appropriate taxing authority. If a tax position does not meet the more likely than not recognition criterion, the guidance requires that the tax position be measured at the largest amount of benefit greater than 50 percent not likely of being sustained upon ultimate settlement.
Based on the Company’s evaluation, management has concluded that there are no significant uncertain tax positions requiring recognition in the consolidated financial statements or adjustments to deferred tax assets and related valuation allowance. Open tax years include the tax years ended May 31, 2010 through November 30, 2014.
The Company from time to time has been assessed interest or penalties by major tax jurisdictions, however such assessments historically have been minimal and immaterial to our financial results. If the Company receives an assessment for interest and/or penalties, it would be classified in the consolidated financial statements as general and administrative expense.
Revenue Recognition
The Company recognizes non-contract revenue when it is realized and earned. The Company considers non-contract revenue realized or realizable and earned when it has persuasive evidence of an arrangement, delivery has occurred, the sales price is fixed or determinable, and collectability is reasonably assured. Delivery is not considered to have occurred until products have been shipped and risk of loss and ownership has transferred to the client. Revenue from production-type contracts, which represents less than one per cent of total revenue, is recognized using the percentage of completion method. The degree of completion is determined based on costs incurred, excluding costs that are not representative of progress to completion, as a percentage of total costs anticipated for each contract. A provision is made for losses on contracts in progress when such losses first become known. Revisions in cost and profit estimates, which can be significant, are reflected in the accounting period in which the relevant facts become known. Revenue from contracts under the percentage of completion method is not significant to the financial statements.
50
Table of Contents
Deferred Revenue
The Company defers revenue when payment is received in advance of the service or product being shipped or delivered, including transition services agreements related to discontinued operations. For some of the larger government contracts, the Company will bill upon meeting certain milestones. These milestones are established by the customer and are specific to each contract. Unearned revenue is recorded as deferred revenue. The Company recognizes revenue on these larger government contracts when items are shipped or upon agreed milestones.
Warranty
The Company provides up to a one-year product defect warranty on various products from the date of sale. Historically, warranty costs have been nominal and have been within management’s expectations. The Company has accrued approximately $325 and $415, in warranty liability as of November 30, 2014 and 2013, respectively, which has been included in accounts payable and accrued expenses.
Shipping and Handling
Shipping and handling costs are expensed as incurred and included in cost of revenues.
Sales Taxes
The Company records sales tax on the sale of its products as a liability, and does not include such amounts in revenue.
Research and Development
Research and development costs are expensed when incurred.
Advertising Costs
Advertising costs are expensed as incurred and were $1,118, $1,033, and $1,095 for the years ended November 30, 2014, 2013, and 2012, respectively.
Stock-Based Compensation
The Company follows the authoritative guidance for accounting for stock-based compensation. The guidance requires that new, modified and unvested stock-based payment transactions with employees, such as grants of stock options, restricted stock units (“RSUs”) and restricted stock, be recognized in the financial statements based on their fair value at the grant date and recognized as compensation expense over their vesting periods. Stock-based compensation cost for RSUs is measured based on the closing fair market value of the Company’s common stock on the date of grant. The fair value of each option granted is estimated on the grant date using the Black-Scholes option pricing model which takes into account as of the grant date the exercise price and expected life of the option, the current price of the underlying shares and its expected volatility, expected dividends on the shares and the risk-free interest rate for the term of the option.
Foreign Currency Translation and Transactions
The Company’s functional currency is United States dollars and the consolidated financial statements are stated in United States dollars, “the reporting currency.” Integrated operations have been translated from various foreign currencies (Canadian dollars, British Pounds Sterling, Chinese Yuan, Euros, and Mexican Pesos) into United States dollars at the period-end exchange rate for monetary balance sheet items, the historical rate for fixed assets and shareholders’ equity, and the average exchange rate for the year for revenues, expenses, gains and losses. The gains or losses on translation are included as a component of other comprehensive income (loss) for the period.
51
Table of Contents
Receivables and Credit Policies
Accounts receivable are non-interest bearing, uncollateralized customer obligations. Accounts receivable are stated at the amounts billed to the customer. Customer account balances with invoices over 90 days old are considered delinquent. Payments of accounts receivable are allocated to the specific invoices identified on the customer’s remittance advice or, if unspecified, are applied to the earliest unpaid invoices. The carrying amount of accounts receivable is reduced by a valuation allowance that reflects management’s estimate of the amounts that will not be collected.
Financial Instruments
The fair values of financial instruments including cash and cash equivalents, accounts receivable, accounts payable, and short-term borrowings approximate their carrying values due to the short-term nature of these instruments. Unless otherwise noted, it is management’s opinion that the Company is not exposed to significant interest rate, currency or credit risks arising from its financial instruments. The recorded value of long-term debt approximates the fair value of the debt as the terms and rates approximate market rates.
In the ordinary course of business, the Company carries out transactions in various foreign currencies (Canadian Dollars, British Pounds Sterling, Chinese Yuan, Euros, and Mexican Pesos) included in the Company’s cash, accounts receivable, accounts payable, bank indebtedness, as well as a mortgage loan. The translation adjustments related to these accounts have been reflected as a component of comprehensive income. Currently, the Company does not maintain a foreign currency hedging program.
Derivative Liabilities
Fair value accounting requires bifurcation of embedded derivative instruments of convertible debt or equity instruments, and measurement of their fair value for accounting purposes. The Company’s embedded derivative instruments such as put and call features, make whole provisions and default interest and dividend rates in the convertible note and convertible preferred stock were measured at fair value using the discounted cash flows model by taking the present value of probability weighted cash flow scenarios. Derivative liabilities were adjusted to reflect fair value at the end of each reporting period, with any change in the fair value being recorded in results of operations as Other expense (income), net.
Debt Issuance Costs and Long-term Debt Discount
Fees paid to obtain debt financing or amendments under such debt financing are treated as debt issuance costs and are capitalized and amortized over the life of the debt using the effective interest method. These payments are shown as a financing activity on the consolidated statement of cash flows and are shown as other non-current assets in the consolidated balance sheets.
In accordance with accounting standards the Company recognized the value of detachable warrants issued in conjunction with the issuance of the secured promissory notes and the modification of the convertible promissory notes. The Company valued the warrants using the Black-Scholes pricing model. The Company recorded the warrant relative fair value as an increase to additional paid-in capital and a discount against the related debt. The discount attributed to the value of the warrants was being amortized over the term of the underlying debt using the effective interest method and was written off when the related debt was extinguished.
The Company may record debt and equity discounts in connection with raising funds through the issuance of convertible notes or equity instruments. These discounts may arise from (i) the receipt of proceeds less than the face value of the convertible notes or equity instruments, (ii) beneficial conversion features and/or (iii) recording derivative liabilities related to embedded features. These costs are amortized over the life of the debt to interest expense utilizing the effective interest method. If a conversion of the underlying debt occurs, a proportionate share of the unamortized discount is immediately expensed.
52
Table of Contents
Concentration of Credit Risk
The Company maintains cash balances, at times, with financial institutions, which are in excess of amounts insured by the Federal Deposit Insurance Corporation (FDIC), Canadian Deposit Insurance Corporation (CDIC) and Financial Services Compensation Scheme (FSCS in the United Kingdom). Management monitors the soundness of these institutions and has not experienced any collection losses with these institutions.
The US, Canadian and United Kingdom Governments’ Departments of Defense (directly and through subcontractors) accounts for approximately 45%, 2% and 9% of the Company’s revenues for the year ended November 30, 2014, 47%, 2% and 9% of the Company’s revenues for the year ended November 30, 2013, and 45%, 2% and 9% of the Company’s revenues for the year ended November 30, 2012. One of the U.S. customers, a defense prime contractor, represented approximately 8% of revenues for the year ended November 30, 2014 (8% of revenues for the year ended November 30, 2013 and 7% for the year ended November 30, 2012, respectively). The same customer represented 7%, 5% and 6% of accounts receivable as of November 30, 2014, 2013 and 2012, respectively. A loss of a significant customer could adversely impact the future operations of the Company.
Earnings (Loss) per Share of Common Stock
Basic earnings per share of common stock is computed by dividing income by the weighted average number of shares of common stock outstanding during the period. Diluted earnings per share of common stock gives effect to all dilutive potential shares of common stock outstanding during the period. The computation of diluted earnings per share does not assume conversion, exercise or contingent exercise of securities that would have an anti-dilutive effect on earnings per share.
Comprehensive Income (Loss)
Comprehensive income (loss), which includes foreign currency translation adjustments, is shown in the Consolidated Statement of Operations and Comprehensive Income (Loss).
Comparative Reclassifications
The Company identified a misclassification of the goodwill impairment charge recorded for the year ended November 30, 2012. This change in classification had no impact on income (loss) from continuing operations or net income. The goodwill impairment charge was recorded as a separate line item within other expense (income), net as opposed to a component of expenses included within the determination of operating income (loss). The Company has corrected this misclassification by reclassifying the goodwill impairment charge of $107,495 to a component of operating expenses in arriving at operating income (loss) in the accompanying Consolidated Statements of Operations and Comprehensive Income (Loss) for the year ended November 30, 2012. This reclassification changed operating income (loss) as previously reported for the year ended November 30, 2012 from a loss of $13,941 to a loss of $121,436.
Recently Issued Accounting Pronouncements
In February 2013, the FASB issued guidance which requires entities to provide information about the amounts reclassified out of accumulated other comprehensive income by component. In addition, entities are required to present, either on the face of the statement where net income is presented or in the notes, significant amounts reclassified out of accumulated other comprehensive income by the respective line items of net income but only if the amount is required under GAAP to be reclassified to net income in its entirety in the same reporting period. For other amounts that are not required under GAAP to be reclassified in their entirety to net income, entities are required to cross-reference to other disclosures required under GAAP that provide additional detail on these amounts. This standard is effective prospectively for reporting periods beginning after December 15, 2013. The Company adopted this standard in the quarter ended May 31, 2014, which did not have a material impact on its consolidated financial statements.
53
Table of Contents
In July 2013, the FASB issued guidance which states that an unrecognized tax benefit, or a portion of an unrecognized tax benefit, should be presented in the financial statements as a reduction to a deferred tax asset for a net operating loss carryforward, a similar tax loss, or a tax credit carryforward, except as follows. To the extent a net operating loss carryforward, a similar tax loss, or a tax credit carryforward is not available at the reporting date under the tax law of the applicable jurisdiction to settle any additional income taxes that would result from the disallowance of a tax position or the tax law of the applicable jurisdiction does not require the entity to use, and the entity does not intend to use, the deferred tax asset for such purpose, the unrecognized tax benefit should be presented in the financial statements as a liability and should not be combined with deferred tax assets. The amendments in this ASU are effective for fiscal years, and interim periods within those years, beginning after December 15, 2013. The Company adopted this standard in the quarter ended May 31, 2014, which did not have a material impact on its consolidated financial statements.
In May 2014, the FASB issued guidance which affects any entity using GAAP that either enters into contracts with customers to transfer goods or services or enters into contracts for the transfer of nonfinancial assets unless those contracts are within the scope of other standards (e.g., insurance contracts or lease contracts). The new guidance will supersede the existing revenue recognition requirements, and most industry-specific guidance. For a public entity, the amendments in this guidance are effective for annual reporting periods beginning after December 15, 2016, including interim periods within that reporting period. Early application is not permitted. The guidance permits companies to either apply the requirements retrospectively to all prior periods presented or apply the requirements in the year of adoption, through a cumulative adjustment. The Company has not yet selected a transition method nor has it determined the impact of adoption on its condensed consolidated financial statements.
| ITEM 7A. | QUANTITATIVE AND QUALITATIVE DISCLOSURES ABOUT MARKET RISK |
Foreign Currency
Certain of our European sales and related selling expenses are denominated in Euros, British Pounds Sterling, and other local currencies. In addition, certain of our operating expenses are denominated in Canadian dollars, Mexican Pesos and Chinese Yuan. As a result, fluctuations in currency exchange rates may positively or negatively affect our operating results and cash flows. For each of the periods presented herein, currency exchange rate gains and losses were not material and we do not anticipate that exposure to foreign currency rate fluctuations will be material for the fiscal year ending November 30, 2015.
Interest Rate Exposure
We have market risk exposure relating to possible fluctuations in interest rates under our credit facility. We may utilize interest rate hedging products in the future to minimize the risks and costs associated with variable rate debt, however, we have not done so to date. We do not enter into derivative financial instruments for trading or speculative purposes. As of November 30, 2014, the Company has borrowed $121.7 million under its Term Loan Agreement. The loan amounts under the Term Loan Agreement bear interest at adjusted LIBOR plus 7.50%, all of which is subject to variable interest rates. The adjusted LIBOR, as defined in the Term Loan Agreement, has a floor of 1.50%. Based on LIBOR at November 30, 2014, an increase of 100 basis points in the interest rate would result in a 0.1% increase in our overall annual interest expense, due to the 1.50% floor. A 100 basis point increase in the interest rate above the 1.5% floor would result in a $1.2 million increase in our annual interest expense on the term loan borrowings, assuming the entire $121.7 million was outstanding. Such potential increases or decreases are based on certain simplified assumptions, including minimum quarterly principal repayments made on variable-rate debt for all maturities and an immediate, across-the-board increase or decrease in the level of interest rates with no other subsequent changes for the remainder of the periods. Any debt we incur in the future may also bear interest at floating rates.
54
Table of Contents
Inflation Risk.
Inflation has not had a material impact on our results of operations or financial condition during the preceding three years.
| ITEM 8. | FINANCIAL STATEMENTS AND SUPPLEMENTARY DATA |
Our financial statements are included in this Annual Report on Form 10-K immediately following the signature page.
| ITEM 9. | CHANGES IN AND DISAGREEMENTS WITH ACCOUNTANTS ON ACCOUNTING AND FINANCIAL DISCLOSURE |
None.
| ITEM 9A. | CONTROLS AND PROCEDURES |
Controls and Procedures
We maintain “disclosure controls and procedures,” as such term is defined in Rule 13a-15(e) of the Securities Exchange Act of 1934, as amended (the “Exchange Act”). We have carried out an evaluation under the supervision and with the participation of our management, including our Chief Executive Officer and Chief Financial Officer, of the effectiveness of the design and operation of our disclosure controls and procedures as of November 30, 2014. Based on that evaluation, our Chief Executive Officer and Chief Financial Officer concluded that our disclosure controls and procedures were effective as of November 30, 2014.
Management’s Report on Internal Control Over Financial Reporting
The Company’s management is responsible for establishing and maintaining adequate internal control over financial reporting. Our internal control over financial reporting is designed to provide reasonable assurance regarding the reliability of financial reporting and the preparation of financial statements for external purposes in accordance with generally accepted accounting principles. Because of its inherent limitations, internal control over financial reporting may not prevent or detect misstatements.
With the participation of the Company’s Chief Executive Officer and Chief Financial Officer, management conducted an evaluation of the effectiveness of our internal control over financial reporting as of November 30, 2014, based on the framework and criteria established in Internal Control—Integrated Framework, issued by the Committee of Sponsoring Organizations of the Treadway Commission. Based on that evaluation, management has concluded that our internal control over financial reporting was effective as of November 30, 2014.
The effectiveness of our internal control over financial reporting as of November 30, 2014 has been audited by Ernst & Young LLP, an independent registered public accounting firm; their report is included in this Item 9A.
Changes in Internal Control over Financial Reporting
During our most recent fiscal quarter, there have been no changes in our internal control over financial reporting that have materially affected or are reasonably likely to materially affect our internal control over financial reporting.
55
Table of Contents
Report of Independent Registered Public Accounting Firm
The Board of Directors and Shareholders of API Technologies Corp.
We have audited API Technologies Corp. internal control over financial reporting as of November 30, 2014, based on criteria established in Internal Control—Integrated Framework issued by the Committee of Sponsoring Organizations of the Treadway Commission (1992 framework) (the COSO criteria). API Technologies Corp.’s management is responsible for maintaining effective internal control over financial reporting, and for its assessment of the effectiveness of internal control over financial reporting included in the accompanying Management’s Report on Internal Control Over Financial Reporting. Our responsibility is to express an opinion on the company’s internal control over financial reporting based on our audit.
We conducted our audit in accordance with the standards of the Public Company Accounting Oversight Board (United States). Those standards require that we plan and perform the audit to obtain reasonable assurance about whether effective internal control over financial reporting was maintained in all material respects. Our audit included obtaining an understanding of internal control over financial reporting, assessing the risk that a material weakness exists, testing and evaluating the design and operating effectiveness of internal control based on the assessed risk, and performing such other procedures as we considered necessary in the circumstances. We believe that our audit provides a reasonable basis for our opinion.
A company’s internal control over financial reporting is a process designed to provide reasonable assurance regarding the reliability of financial reporting and the preparation of financial statements for external purposes in accordance with generally accepted accounting principles. A company’s internal control over financial reporting includes those policies and procedures that (1) pertain to the maintenance of records that, in reasonable detail, accurately and fairly reflect the transactions and dispositions of the assets of the company; (2) provide reasonable assurance that transactions are recorded as necessary to permit preparation of financial statements in accordance with generally accepted accounting principles, and that receipts and expenditures of the company are being made only in accordance with authorizations of management and directors of the company; and (3) provide reasonable assurance regarding prevention or timely detection of unauthorized acquisition, use, or disposition of the company’s assets that could have a material effect on the financial statements.
Because of its inherent limitations, internal control over financial reporting may not prevent or detect misstatements. Also, projections of any evaluation of effectiveness to future periods are subject to the risk that controls may become inadequate because of changes in conditions, or that the degree of compliance with the policies or procedures may deteriorate.
In our opinion, API Technologies Corp. maintained, in all material respects, effective internal control over financial reporting as of November 30, 2014, based on the COSO criteria.
We also have audited, in accordance with the standards of the Public Company Accounting Oversight Board (United States), the consolidated balance sheets of API Technologies Corp. as of November 30, 2014 and 2013, and the related consolidated statements of operations and comprehensive income (loss), changes in redeemable preferred stock and shareholders’ equity, and cash flows for each of the three years in the period ended November 30, 2014 of API Technologies Corp. and our report dated February 10, 2015 expressed an unqualified opinion thereon.
Ernst & Young LLP
Pittsburgh, Pennsylvania
February 10, 2015
| ITEM 9B. | OTHER INFORMATION |
None.
56
Table of Contents
PART III
| ITEM 10. | DIRECTORS, EXECUTIVE OFFICERS, AND CORPORATE GOVERNANCE |
Directors, Executive Officers and Corporate Governance
The information called for by this Item 10 of Part III of Form 10-K is incorporated by reference to the information set forth in our definitive proxy statement relating to our 2015 Annual Meeting of Stockholders (the “Proxy Statement”) to be filed pursuant to Regulation 14-A under the Exchange Act within 120 days from 2014 fiscal year end. Reference is also made to the information appearing in Item 1 of Part I of this Annual Report on Form 10-K under the caption “Business—Executive Officers of the Registrant.”
Code of Ethics
We have adopted a Code of Ethics that applies to our directors and employees (including our principal executive officer, principal financial officer, principal accounting officer and controller and persons performing similar functions). The Code of Ethics is posted on our website at www.apitech.com on the Investor Relations section. We will post on our website any amendments to or waivers of the Code of Ethics for executive officers or directors in accordance with applicable laws and regulations.
| ITEM 11. | EXECUTIVE COMPENSATION |
The information called for by this Item 11 of Part III of Form 10-K is incorporated by reference to our Proxy Statement, which will be filed with the Securities and Exchange Commission within 120 days from 2014 fiscal year end.
| ITEM 12. | SECURITY OWNERSHIP OF CERTAIN BENEFICIAL OWNERS AND MANAGEMENT AND RELATED STOCKHOLDER MATTERS |
The information called for by this Item 12 of Part III of Form 10-K is incorporated by reference to the information set forth in our Proxy Statement, which will be filed with the Securities and Exchange Commission within 120 days from 2014 fiscal year end.
| ITEM 13. | CERTAIN RELATIONSHIPS AND RELATED TRANSACTIONS, AND DIRECTOR INDEPENDENCE |
The information called for by this Item 13 of Part III of Form 10-K is incorporated by reference to our Proxy Statement, which will be filed with the Securities and Exchange Commission within 120 days from 2014 fiscal year end.
| ITEM 14. | PRINCIPAL ACCOUNTANT FEES AND SERVICES |
The information required to be disclosed by this Item 14 of Part III of Form 10-K is incorporated by reference to our Proxy Statement, which will be filed with the Securities and Exchange Commission within 120 days from 2014 fiscal year end.
57
Table of Contents
PART IV
| ITEM 15. | EXHIBITS AND FINANCIAL STATEMENT SCHEDULES |
1. Financial statements are set forth in this report following the signature page of this report. See index on page F-1.
2. Consolidated financial statement schedule
Except for Schedule II – Valuation and Qualifying Accounts, included as a schedule following the financial statements herein, all financial statement schedules are omitted because they are not applicable or because the required information is shown in the financial statements or in the notes thereto.
3. Exhibit Index. The exhibits listed below, as part of this Annual Report on Form 10-K, are numbered in conformity with the numbering used in Item 601 of Regulation S-K of the Securities and Exchange Commission.
| Exhibit Number |
Exhibit Title | |
| *2.1 | Stock Purchase Agreement, dated as of April 17, 2013, between API Technologies Corp., Spectrum Control, Inc. and Measurement Specialties, Inc. (incorporated by reference to Exhibit 2.1 to the Company’s Current Report on Form 8-K filed with the SEC on April 23, 2013). | |
| 3.1 | Amended and Restated Certificate of Incorporation (incorporated by reference to Exhibit 3.1 to the Company’s Current Report on Form 8-K filed with the SEC on October 27, 2009). | |
| 3.2 | Certificate of Amendment of Amended and Restated Certificate of Incorporation of the Company (incorporated by reference to Exhibit 3.1 to the Company’s Current Report on Form 8-K filed with the SEC on January 4, 2011). | |
| 3.3 | Certificate of Amendment of Amended and Restated Certificate of Incorporation of API Technologies Corp. (incorporated by reference to Exhibit 3.1 to the Company’s Current Report on Form 8-K filed with the SEC on May 18, 2012). | |
| 3.4 | Certificate of Designation of Series A Mandatorily Redeemable Preferred Stock of API Technologies Corp. (incorporated by reference to Exhibit 3.2 to the Company’s Current Report on Form 8-K filed with the SEC on May 18, 2012). | |
| 3.5 | Certificate of Elimination of Series A Mandatorily Redeemable Preferred Stock of API Technologies Corp. (incorporated by reference to Exhibit 3.1 to the Company’s Form 8-K filed with the SEC on March 26, 2014). | |
| 3.5 | Amended and Restated By-laws (incorporated by reference to Exhibit 3.2 to the Company’s Current Report on Form 8-K filed with the SEC on October 27, 2009). | |
| 10.1 | Support Agreement dated November 6, 2006 among API Nanotronics Corp. k/n/a API Technologies Corp. and RVI Sub, Inc. k/n/a API Nanotronics Sub, Inc. (incorporated by reference to Exhibit 10.9 to the Company’s Amendment No. 2 to Registration Statement on Form S-1 filed with the SEC on November 6, 2006). | |
| 10.2 | Voting and Exchange Agreement dated November 6, 2006 among API Nanotronics Corp. k/n/a API Technologies Corp. and RVI Sub, Inc. k/n/a API Nanotronics Sub, Inc. and Equity Transfer & Trust Company (incorporated by reference to Exhibit 10.10 to the Company’s Amendment No. 2 to Registration Statement on Form S-1 filed with the SEC on November 6, 2006). | |
| 10.3 | Share Capital and Other Provisions included in the Articles of Incorporation of API Nanotronics Sub, Inc. f/k/a RVI Sub, Inc. (incorporated by reference to Exhibit 10.11 to the Company’s Amendment No. 2 to Registration Statement on Form S-1 filed with the SEC on November 6, 2006). | |
58
Table of Contents
| Exhibit Number |
Exhibit Title | |
| 10.4 | Form of Warrant issued January 20, 2010 and January 22, 2010 to investors under Regulation D (incorporated by reference to Exhibit 10.5 to the Company’s Form 10-Q filed with the SEC on April 13, 2010). | |
| 10.5 | Form of Warrant issued January 20, 2010 and January 22, 2010 to investors under Regulation S (incorporated by reference to Exhibit 10.6 to the Company’s Form 10-Q filed with the SEC on April 13, 2010). | |
| 10.6 | Registration Rights Agreement dated January 21, 2011 by and between the Company and Vintage Albany Acquisition, LLC (incorporated by reference to Exhibit 10.2 to the Company’s Form 8-K filed with the SEC on January 27, 2011). | |
| **10.7 | Management Bonus Plan dated January 21, 2011 (incorporated by reference to Exhibit 10.3 to the Company’s Form 8-K filed with the SEC on January 27, 2011). | |
| **10.8 | Employment letter agreement with Bel Lazar (incorporated by reference to Exhibit 10.6 to the Company’s Form 10-Q filed with the SEC on April 14, 2011). | |
| **10.9 | Amended and Restated API Technologies Corp. 2006 Equity Incentive Plan (incorporated by reference to Exhibit 10.16 to the Company’s 10-K/T filed with the SEC on February 9, 2012). | |
| **10.10 | Form of Incentive Option Agreement (incorporated by reference to Exhibit 10.4 to the Company’s Form 10-Q filed with the SEC October 15, 2009). | |
| **10.11 | Form of Non-Statutory Stock Option Agreement (incorporated by reference to Exhibit 10.5 to the Company’s Form 10-Q filed with the SEC October 15, 2009.) | |
| **10.12 | Form of Restricted Stock Unit Award Agreement (incorporated by reference to Exhibit 10.6 to the Company’s Current Report on Form 8-K filed with the SEC on June 6, 2011). | |
| **10.13 | Form of Indemnification Agreement (incorporated by reference to Exhibit 10.7 to the Company’s Current Report on Form 8-K filed with the SEC on June 6, 2011). | |
| 10.14 | Registration Rights Agreement dated as of March 18, 2011 by and among the Company, the persons and entities listed on Exhibit A, and, with respect to Section 8(l) only, Vintage Albany Acquisition, LLC (incorporated by reference to Exhibit 10.2 to the Company’s Form 8-K filed with the SEC on March 21, 2011). | |
| 10.15 | Registration Rights Agreement dated as of June 27, 2011 by and among the Company, the persons and entities listed on Exhibit A, and, with respect to Section 8(1) only, Vintage Albany Acquisition, LLC (incorporated by reference to Exhibit 10.31 to the Company’s 10-K filed with the SEC on August 26, 2011). | |
| 10.16 | Credit Agreement, dated February 6, 2013, by and among API Technologies Corp. as borrower, the lenders from time to time party thereto, and Guggenheim Corporate Funding, LLC, as administrative agent (incorporated by reference to Exhibit 10.1 to the Company’s Form 8-K filed with the SEC on February 8, 2013). | |
| 10.17 | U.S. Guaranty and Security Agreement, dated February 6, 2013, by and among API Technologies Corp. and certain of its domestic subsidiaries, as grantors, the guarantors party thereto, and Guggenheim Corporate Funding, LLC, as agent (incorporated by reference to Exhibit 10.2 to the Company’s Form 8-K filed with the SEC on February 8, 2013). | |
| 10.18 | Canadian Guarantee and Security Agreement, dated February 6, 2013, by and among certain Canadian subsidiaries of API Technologies Corp., as grantors and guarantors, and Guggenheim Corporate Funding, LLC, as agent (incorporated by reference to Exhibit 10.3 to the Company’s Form 8-K filed with the SEC on February 8, 2013). | |
59
Table of Contents
| Exhibit Number |
Exhibit Title | |
| 10.19 | Amendment No. 1 to Credit Agreement, dated October 10, 2013, by and among API Technologies Corp. as borrower, the lenders party thereto and Guggenheim Corporate Funding, LLC, as administrative agent (incorporated by reference to Exhibit 10.1 to the Company’s Current Report on Form 8-K filed with the SEC on October 19, 2013). | |
| 10.20 | Consent Agreement, dated as of December 31, 2013, by and between API Technologies Corp., the lenders party thereto and Guggenheim Corporate Funding, LLC, as administrative agent (incorporated by reference to Exhibit 10.1 to the Company’s Current Report on Form 8-K filed with the SEC on January 6, 2014). | |
| 10.21 | Amendment No. 2 to Credit Agreement, dated March 21, 2014, by and among API Technologies Corp. as borrower, the lenders from time to time party thereto, and Guggenheim Corporate Funding, LLC, as administrative agent (incorporated by reference to Exhibit 10.1 to the Company’s Form 8-K filed with the SEC on March 26, 2014). | |
| 10.22 | Lease Agreement between Store SPE State College 2013-8, LLC and Spectrum Control, Inc. dated as of December 31, 2013 (incorporated by reference to Exhibit 10.3 to the Company’s Form 8-K filed with the SEC on April 9, 2014). | |
| 21 | Subsidiaries of the Company (filed herewith). | |
| 23.1 | Consent of Ernst & Young LLP (filed herewith). | |
| 31.1 | Rule 13a-14(a)/15(d)-14(a) Certification by Chief Executive Officer (filed herewith). | |
| 31.2 | Rule 13a-14(a)/15(d)-14(a) Certification by Chief Financial Officer (filed herewith). | |
| 32.1 | Certification of the Chief Executive Officer Pursuant to Section 906 of the Sarbanes Oxley Act of 2002 (filed herewith). | |
| 32.2 | Certification of the Chief Financial Officer Pursuant to Section 906 of the Sarbanes Oxley Act of 2002 (filed herewith). | |
| 101.INS | XBRL Instance Document | |
| 101.SCH | XBRL Taxonomy Extension Schema Document | |
| 101.CAL | XBRL Taxonomy Extension Calculation Linkbase Document | |
| 101.DEF | XBRL Taxonomy Extension Definition Linkbase Document | |
| 101.LAB | XBRL Taxonomy Extension Label Linkbase Document | |
| 101.PRE | XBRL Taxonomy Extension Presentation Linkbase Document | |
| * | Schedules have been omitted pursuant to Item 601(b)(2) of Regulation S-K. The Company undertakes to furnish supplementally copies of any of the omitted schedules upon request made by the Securities and Exchange Commission. |
| ** | Management contracts, compensation plans or arrangements. |
60
Table of Contents
SIGNATURES
Pursuant to the requirements of Section 13 or 15(d) of the Exchange Act of 1934, the registrant has duly caused this report to be signed on its behalf by the undersigned, thereunto duly authorized.
| API TECHNOLOGIES CORP. |
| /S/ BEL LAZAR |
| Bel Lazar, |
| President and Chief Executive Officer |
| Dated: February 10, 2015 |
In accordance with the Exchange Act, this report has been signed below by the following persons on behalf of the registrant and in the capacities and on the dates indicated.
| Principal Executive Officer |
||
| /S/ BEL LAZAR Bel Lazar, President and Chief Executive Officer |
February 10, 2015 | |
| Principal Financial and Accounting Officer |
||
| /S/ CLAUDIO MANNARINO Claudio Mannarino Senior Vice President and Chief Financial Officer |
February 10, 2015 | |
| /S/ BRIAN R. KAHN Brian R. Kahn, Chairman and Director |
February 10, 2015 | |
| /S/ MATTHEW E. AVRIL Matthew E. Avril, Director |
February 10, 2015 | |
| /S/ KENTON W. FISKE Kenton W. Fiske, Director |
February 10, 2015 | |
| /S/ MELVIN L. KEATING Melvin L. Keating, Director |
February 10, 2015 | |
| /S/ KENNETH J. KRIEG Kenneth J. Krieg, Director |
February 10, 2015 | |
61
Table of Contents
Consolidated Financial Statements
| Page | ||||
| F-2 | ||||
| Consolidated Balance Sheets as at November 30, 2014 and 2013 |
F-3 | |||
| F-4 | ||||
| F-5 | ||||
| Consolidated Statements of Cash Flows for the years ended November 30, 2014, 2013 and 2012 |
F-8 | |||
| F-9 | ||||
F-1
Table of Contents
Report of Independent Registered Public Accounting Firm
The Board of Directors and Shareholders
API Technologies Corp.
We have audited the accompanying consolidated balance sheets of API Technologies Corp. as of November 30, 2014 and 2013, and the related consolidated statements of operations and comprehensive income (loss), changes in redeemable preferred stock and shareholders’ equity, and cash flows for each of the three years in the period ended November 30, 2014. Our audits also included the financial statement schedule listed in the Index at item 15. These financial statements and schedule are the responsibility of the Company’s management. Our responsibility is to express an opinion on these consolidated financial statements and schedule based on our audits.
We conducted our audits in accordance with the standards of the Public Company Accounting Oversight Board (United States). Those standards require that we plan and perform the audit to obtain reasonable assurance about whether the financial statements are free of material misstatement. An audit includes examining, on a test basis, evidence supporting the amounts and disclosures in the financial statements. An audit also includes assessing the accounting principles used and significant estimates made by management, as well as evaluating the overall financial statement presentation. We believe that our audits provide a reasonable basis for our opinion.
In our opinion, the consolidated financial statements referred to above present fairly, in all material respects, the consolidated financial position of API Technologies Corp. as of November 30, 2014 and 2013, and the consolidated results of their operations and their cash flows for each of the three years in the period ended November 30, 2014, in conformity with U.S. generally accepted accounting principles. Also, in our opinion, the related financial statement schedule, when considered in relation to the basic financial statements taken as a whole, presents fairly in all material respects the information set forth therein.
We also have audited, in accordance with the standards of the Public Company Accounting Oversight Board (United States), API Technologies Corp.’s internal control over financial reporting as of November 30, 2014, based on criteria established in Internal Control-Integrated Framework issued by the Committee of Sponsoring Organizations of the Treadway Commission (1992 framework) and our report dated February 10, 2015 expressed an unqualified opinion thereon.
/s/ Ernst & Young LLP
Pittsburgh, Pennsylvania
February 10, 2015
F-2
Table of Contents
Consolidated Balance Sheets
(In thousands of dollars, except share data)
| November 30, 2014 |
November 30, 2013 |
|||||||
| Assets | ||||||||
| Current | ||||||||
| Cash and cash equivalents |
$ | 8,258 | $ | 6,351 | ||||
| Restricted cash (note 4c and 5b) |
— | 1,500 | ||||||
| Accounts receivable, less allowance for doubtful accounts of $716 and $697 at November 30, 2014 and 2013, respectively |
38,657 | 39,751 | ||||||
| Inventories, less provision for obsolescence of $8,990 and $12,571 at November 30, 2014 and 2013, respectively (note 7) |
54,718 | 58,218 | ||||||
| Deferred income taxes |
561 | 2,426 | ||||||
| Prepaid expenses and other current assets |
1,592 | 2,445 | ||||||
|
|
|
|
|
|||||
| 103,786 | 110,691 | |||||||
| Fixed assets, net (note 8) |
30,424 | 35,231 | ||||||
| Fixed assets held for sale (note 2) |
150 | 150 | ||||||
| Goodwill (note 9) |
116,770 | 116,770 | ||||||
| Intangible assets, net |
29,848 | 38,780 | ||||||
| Other non-current assets |
1,862 | 2,956 | ||||||
|
|
|
|
|
|||||
| Total assets |
$ | 282,840 | $ | 304,578 | ||||
|
|
|
|
|
|||||
| Liabilities, Redeemable Preferred Stock and Shareholders’ Equity |
||||||||
| Current |
||||||||
| Accounts payable and accrued expenses |
$ | 27,907 | $ | 32,217 | ||||
| Deferred revenue |
2,279 | 3,519 | ||||||
| Current portion of long-term debt (note 12) |
10,097 | 8,155 | ||||||
|
|
|
|
|
|||||
| 40,283 | 43,891 | |||||||
| Deferred income taxes |
4,575 | 5,517 | ||||||
| Other long-term liabilities (note 13) |
1,216 | 1,135 | ||||||
| Long-term debt, net of current portion and discount of $0 and $8,100 at November 30, 2014 and 2013, respectively (note 12) |
118,214 | 96,606 | ||||||
| Deferred gain (note 12d) |
7,788 | — | ||||||
|
|
|
|
|
|||||
| 172,076 | 147,149 | |||||||
|
|
|
|
|
|||||
| Commitments and contingencies (note 20) |
||||||||
| Redeemable Preferred Stock |
||||||||
| Preferred stock (Series A Mandatorily Redeemable Preferred Stock, $0 and $1,042 liquidation preference and 1,000,000 authorized shares, 0 and 26,000 shares issued and outstanding at November 30, 2014 and 2013, respectively) (note 14) |
— | 26,326 | ||||||
| Shareholders’ equity |
||||||||
| Common shares ($0.001 par value, 250,000,000 authorized shares, 55,397,320 and 54,846,071 shares issued and outstanding at November 30, 2014 and 2013, respectively) |
55 | 55 | ||||||
| Special voting stock ($0.01 par value, 1 share authorized, issued and outstanding at November 30, 2014 and 2013, respectively) |
— | — | ||||||
| Additional paid-in capital |
327,846 | 327,901 | ||||||
| Common stock subscribed but not issued |
2,373 | 2,373 | ||||||
| Accumulated deficit |
(220,105 | ) | (200,798 | ) | ||||
| Accumulated other comprehensive income |
595 | 1,572 | ||||||
|
|
|
|
|
|||||
| 110,764 | 131,103 | |||||||
|
|
|
|
|
|||||
| Total Liabilities, Redeemable Preferred Stock and Shareholders’ Equity |
$ | 282,840 | $ | 304,578 | ||||
|
|
|
|
|
|||||
The accompanying notes are an integral part of these consolidated financial statements.
F-3
Table of Contents
Consolidated Statements of Operations and Comprehensive Income (Loss)
(In thousands of dollars, except share data)
| Year ended November 30, 2014 |
Year ended November 30, 2013 |
Year ended November 30, 2012 |
||||||||||
| Revenue, net |
$ | 226,857 | $ | 244,300 | $ | 242,381 | ||||||
| Cost of revenues |
||||||||||||
| Cost of revenues |
173,697 | 192,279 | 186,209 | |||||||||
| Restructuring charges (note 21) |
1,064 | 1,405 | 9,742 | |||||||||
|
|
|
|
|
|
|
|||||||
| Total cost of revenues |
174,761 | 193,684 | 195,951 | |||||||||
|
|
|
|
|
|
|
|||||||
| Gross profit |
52,096 | 50,616 | 46,430 | |||||||||
|
|
|
|
|
|
|
|||||||
| Operating expenses |
||||||||||||
| General and administrative |
23,069 | 25,873 | 24,957 | |||||||||
| Selling expenses |
14,541 | 15,015 | 14,440 | |||||||||
| Research and development |
8,270 | 9,190 | 9,610 | |||||||||
| Business acquisition and related charges |
479 | 849 | 4,027 | |||||||||
| Restructuring charges (note 21) |
1,153 | 1,212 | 7,337 | |||||||||
| Goodwill impairment |
— | — | 107,495 | |||||||||
|
|
|
|
|
|
|
|||||||
| Total operating expenses |
47,512 | 52,139 | 167,866 | |||||||||
|
|
|
|
|
|
|
|||||||
| Operating income (loss) |
4,584 | (1,523 | ) | (121,436 | ) | |||||||
| Other expense (income), net |
||||||||||||
| Interest expense, net |
11,765 | 14,208 | 16,209 | |||||||||
| Amortization of note discounts and deferred financing costs |
10,940 | 13,020 | 15,684 | |||||||||
| Other expense (income), net |
(477 | ) | (14 | ) | 813 | |||||||
|
|
|
|
|
|
|
|||||||
| 22,228 | 27,214 | 32,706 | ||||||||||
|
|
|
|
|
|
|
|||||||
| Loss from continuing operations before income taxes |
(17,644 | ) | (28,737 | ) | (154,142 | ) | ||||||
| Expense (benefit) for income taxes |
1,270 | (5,335 | ) | (5,307 | ) | |||||||
|
|
|
|
|
|
|
|||||||
| Loss from continuing operations |
(18,914 | ) | (23,402 | ) | (148,835 | ) | ||||||
| Income from discontinued operations, net of tax |
— | 16,174 | 132 | |||||||||
|
|
|
|
|
|
|
|||||||
| Net loss |
$ | (18,914 | ) | $ | (7,228 | ) | $ | (148,703 | ) | |||
| Accretion on preferred stock |
(393 | ) | (1,057 | ) | — | |||||||
|
|
|
|
|
|
|
|||||||
| Net loss attributable to common shareholders |
$ | (19,307 | ) | $ | (8,285 | ) | $ | (148,703 | ) | |||
|
|
|
|
|
|
|
|||||||
| Loss per share from continuing operations—Basic and diluted |
$ | (0.35 | ) | $ | (0.44 | ) | $ | (2.69 | ) | |||
| Income per share from discontinued operations—Basic and diluted |
$ | 0.00 | $ | 0.29 | $ | 0.00 | ||||||
|
|
|
|
|
|
|
|||||||
| Net loss per share—Basic and diluted |
$ | (0.35 | ) | $ | (0.15 | ) | $ | (2.69 | ) | |||
|
|
|
|
|
|
|
|||||||
| Weighted average shares outstanding |
||||||||||||
| Basic |
55,448,862 | 55,405,764 | 55,314,263 | |||||||||
| Diluted |
55,448,862 | 55,405,764 | 55,314,263 | |||||||||
| Comprehensive income (loss) |
$ | (977 | ) | $ | (513 | ) | $ | 1,914 | ||||
|
|
|
|
|
|
|
|||||||
| Other comprehensive income (loss) |
(977 | ) | (513 | ) | 1,914 | |||||||
|
|
|
|
|
|
|
|||||||
| Comprehensive income (loss) |
$ | (19,891 | ) | $ | (7,741 | ) | $ | (146,789 | ) | |||
|
|
|
|
|
|
|
|||||||
The accompanying notes are an integral part of these consolidated financial statements.
F-4
Table of Contents
Consolidated Statements of Changes in Redeemable Preferred Stock and Shareholders’ Equity—continued
(In thousands of dollars, except share data)
| Preferred Stock-number of shares |
Preferred stock amount |
Common stock-number of shares |
Common stock amount |
Additional paid-in capital |
Common stock subscribed but not issued |
Accumulated deficit |
Accumulated other comprehensive income |
Total shareholders’ equity |
||||||||||||||||||||||||||||
| Balance at November 30, 2011 |
— | $ |
— |
|
54,568,384 | $ | 55 | $ | 322,675 | $ | 2,373 | $ | (43,810 | ) | $ | 171 | $ | 281,464 | ||||||||||||||||||
| Series A Mandatorily Redeemable Preferred Stock (see Note 14) |
26,000 | 26,268 | — | — | — | — | — | — | — | |||||||||||||||||||||||||||
| Accrued dividend in kind (effective) on Series A Mandatorily Redeemable Preferred Stock (see Note 14) |
— | (687 | ) | — | — | — | — | — | — | — | ||||||||||||||||||||||||||
| Stock exchanged for subsidiary exchangeable shares and stock subject to issuance in connection with plan of arrangement (see Note 16) |
— | — | 20,833 | — | — | — | — | — | — | |||||||||||||||||||||||||||
| Stock-based compensation expense |
— | — | — | — | 1,550 | — | — | — | 1,550 | |||||||||||||||||||||||||||
| Stock issued as compensation |
— | — | 227,477 | — | 674 | — | — | — | 674 | |||||||||||||||||||||||||||
| Stock withheld for taxes |
— | — | (52,141 | ) | — | (198 | ) | — | — | — | (198 | ) | ||||||||||||||||||||||||
| Amounts related to beneficial conversion features and embedded derivatives on Convertible Notes and Preferred stock (note 14) |
— | — | — | — | 2,272 | — | — | — | 2,272 | |||||||||||||||||||||||||||
| Net loss for the period |
— | — | — | — | — | — | (148,703 | ) | — | (148,703 | ) | |||||||||||||||||||||||||
| Foreign currency translation adjustment |
— | — | — | — | — | — | — | 1,914 | 1,914 | |||||||||||||||||||||||||||
|
|
|
|
|
|
|
|
|
|
|
|
|
|
|
|
|
|
|
|||||||||||||||||||
| Balance at November 30, 2012 |
26,000 | $ | 25,581 | 54,764,553 | $ | 55 | $ | 326,973 | $ | 2,373 | $ | (192,513 | ) | $ | 2,085 | $ | 138,973 | |||||||||||||||||||
|
|
|
|
|
|
|
|
|
|
|
|
|
|
|
|
|
|
|
|||||||||||||||||||
The accompanying notes are an integral part of these consolidated financial statements.
F-5
Table of Contents
API Technologies Corp.
Consolidated Statements of Changes in Redeemable Preferred Stock and Shareholders’ Equity—continued
(In thousands of dollars, except share data)
| Preferred Stock-number of shares |
Preferred stock amount |
Common stock-number of shares |
Common stock amount |
Additional paid-in capital |
Common stock subscribed but not issued |
Accumulated deficit |
Accumulated other comprehensive income |
Total shareholders’ equity |
||||||||||||||||||||||||||||
| Balance at November 30, 2012 |
26,000 | $ | 25,581 | 54,764,553 | $ | 55 | $ | 326,973 | $ | 2,373 | $ | (192,513 | ) | $ | 2,085 | $ | 138,973 | |||||||||||||||||||
| Accretion on Redeemable Preferred Stock (Dividends see Note 14) |
— | (312 | ) | — | — | — | — | — | — | — | ||||||||||||||||||||||||||
| Accrued dividend in kind (effective) on Series A Mandatorily Redeemable Preferred Stock (see Note 14) |
— | 1,057 | — | — | — | — | (1,057 | ) | — | (1,057 | ) | |||||||||||||||||||||||||
| Stock exchanged for subsidiary exchangeable shares and stock subject to issuance in connection with plan of arrangement (see Note 16) |
— | — | 22,916 | — | — | — | — | — | — | |||||||||||||||||||||||||||
| Stock-based compensation expense |
— | — | — | — | 928 | — | — | — | 928 | |||||||||||||||||||||||||||
| Stock issued as compensation |
— | — | 72,333 | — | — | — | — | — | — | |||||||||||||||||||||||||||
| Stock withheld for taxes |
— | — | (13,731 | ) | — | — | — | — | — | — | ||||||||||||||||||||||||||
| Net loss for the period |
— | — | — | — | — | — | (7,228 | ) | — | (7,228 | ) | |||||||||||||||||||||||||
| Foreign currency translation adjustment |
— | — | — | — | — | — | — | (513 | ) | (513 | ) | |||||||||||||||||||||||||
|
|
|
|
|
|
|
|
|
|
|
|
|
|
|
|
|
|
|
|||||||||||||||||||
| Balance at November 30, 2013 |
26,000 | $ | 26,326 | 54,846,071 | $ | 55 | $ | 327,901 | $ | 2,373 | $ | (200,798 | ) | $ | 1,572 | $ | 131,103 | |||||||||||||||||||
|
|
|
|
|
|
|
|
|
|
|
|
|
|
|
|
|
|
|
|||||||||||||||||||
The accompanying notes are an integral part of these consolidated financial statements.
F-6
Table of Contents
API Technologies Corp.
Consolidated Statements of Changes in Redeemable Preferred Stock and Shareholders’ Equity—continued
(In thousands of dollars, except share data)
| Preferred Stock-number of shares |
Preferred stock amount |
Common stock-number of shares |
Common stock amount |
Additional paid-in capital |
Common stock subscribed but not issued |
Accumulated deficit |
Accumulated other comprehensive income |
Total shareholders’ equity |
||||||||||||||||||||||||||||
| Balance at November 30, 2013 |
26,000 | $ | 26,326 | 54,846,071 | $ | 55 | $ | 327,901 | $ | 2,373 | $ | (200,798 | ) | $ | 1,572 | $ | 131,103 | |||||||||||||||||||
| Stock issued as compensation |
— | — | 48,333 | — | — | — | — | — | — | |||||||||||||||||||||||||||
| Stock withheld for taxes |
— | — | (13,751 | ) | — | (39 | ) | — | — | — | (39 | ) | ||||||||||||||||||||||||
| Accretion on Redeemable Preferred Stock (Dividends see Note 14) |
— | 393 | — | — | — | — | (393 | ) | — | (393 | ) | |||||||||||||||||||||||||
| Accrued dividend in kind (effective) on Series A Mandatorily Redeemable Preferred Stock (see Note 14) |
— | 42 | — | — | — | — | — | — | — | |||||||||||||||||||||||||||
| Redemption of Preferred Stock (see Note 10) |
(26,000 | ) | (26,761 | ) | — | — | — | — | — | — | — | |||||||||||||||||||||||||
| Stock-based compensation expense |
— | — | — | — | (16 | ) | — | — | — | (16 | ) | |||||||||||||||||||||||||
| Stock exchanged for subsidiary exchangeable shares and stock subject to issuance in connection with plan of arrangement (see Note 16) |
— | — | 516,667 | — | — | — | — | — | — | |||||||||||||||||||||||||||
| Net loss for the period |
— | — | — | — | — | — | (18,914 | ) | — | (18,914 | ) | |||||||||||||||||||||||||
| Other comprehensive loss |
— | — | — | — | — | — | — | (977 | ) | (977 | ) | |||||||||||||||||||||||||
|
|
|
|
|
|
|
|
|
|
|
|
|
|
|
|
|
|
|
|||||||||||||||||||
| Balance at November 30, 2014 |
— | $ | — | 55,397,320 | $ | 55 | $ | 327,846 | $ | 2,373 | $ | (220,105 | ) | $ | 595 | $ | 110,764 | |||||||||||||||||||
|
|
|
|
|
|
|
|
|
|
|
|
|
|
|
|
|
|
|
|||||||||||||||||||
The accompanying notes are an integral part of these consolidated financial statements.
F-7
Table of Contents
Consolidated Statements of Cash Flows
(In thousands of dollars, except share data)
| Year Ended Nov. 30, 2014 |
Year Ended Nov. 30, 2013 |
Year Ended Nov. 30, 2012 |
||||||||||
| Cash flows from operating activities |
||||||||||||
| Net loss |
$ | (18,914 | ) | $ | (7,228 | ) | $ | (148,703 | ) | |||
| Less: Income from discontinued operations |
— | (16,174 | ) | (132 | ) | |||||||
| Adjustments to reconcile net loss to net cash used by operating activities: |
||||||||||||
| Depreciation and amortization |
15,965 | 17,130 | 16,945 | |||||||||
| Amortization of note discounts and deferred financing costs |
728 | 2,743 | 3,040 | |||||||||
| Amortization of note discounts due to debt extinguishment |
10,212 | 10,277 | 12,644 | |||||||||
| Goodwill impairment |
— | — | 107,495 | |||||||||
| Write down of fixed assets |
— | — | 2,821 | |||||||||
| Stock based compensation, net |
(16 | ) | 928 | 2,224 | ||||||||
| Accrued income tax- discontinued operations |
— | (9,189 | ) | — | ||||||||
| Gain on sale of fixed assets, net |
(252 | ) | — | (93 | ) | |||||||
| Deferred income taxes |
668 | 927 | (3,274 | ) | ||||||||
| Changes in operating assets and liabilities, net of business acquisitions |
||||||||||||
| Accounts receivable |
(915 | ) | 1,847 | 12,623 | ||||||||
| Inventories |
2,996 | (457 | ) | 9,809 | ||||||||
| Prepaid expenses and other current assets |
829 | 113 | (913 | ) | ||||||||
| Accounts payable and accrued expenses |
(4,263 | ) | (4,663 | ) | (9,805 | ) | ||||||
| Deferred revenue |
(1,739 | ) | (1,196 | ) | (1,863 | ) | ||||||
|
|
|
|
|
|
|
|||||||
| Net cash provided (used) by continuing activities |
5,299 | (4,942 | ) | 2,818 | ||||||||
| Net cash provided by discontinued operations |
— | 2,639 | 6,158 | |||||||||
|
|
|
|
|
|
|
|||||||
| Net cash provided (used) by operating activities |
5,299 | (2,303 | ) | 8,976 | ||||||||
| Cash flows from investing activities |
||||||||||||
| Purchase of fixed assets |
(2,733 | ) | (2,473 | ) | (1,139 | ) | ||||||
| Purchase of intangible assets |
(381 | ) | (732 | ) | (1,296 | ) | ||||||
| Proceeds from disposal of fixed assets |
15,108 | 739 | 32 | |||||||||
| Net proceeds disposal of discontinued operations (note 5) |
— | 80,497 | — | |||||||||
| Business acquisitions net of cash acquired of $nil, $nil, and $3,045 (note 4 and 18) |
1,816 | (2,413 | ) | (29,052 | ) | |||||||
| Restricted cash (note 4c and 5b) |
1,500 | (800 | ) | — | ||||||||
| Discontinued operations (note 5) |
— | (17 | ) | 358 | ||||||||
|
|
|
|
|
|
|
|||||||
| Net cash provided (used) by investing activities |
15,310 | 74,801 | (31,097 | ) | ||||||||
| Cash flows from financing activities |
||||||||||||
| Redemption of preferred shares (Note 14) |
(27,600 | ) | — | — | ||||||||
| Repayment of long-term debt |
(55,716 | ) | (317,622 | ) | (2,192 | ) | ||||||
| Net proceeds—long-term debt (note 12) |
64,877 | 230,381 | 29,161 | |||||||||
| Discontinued operations (note 5) |
— | — | 4 | |||||||||
|
|
|
|
|
|
|
|||||||
| Net cash provided by (used by) financing activities |
(18,439 | ) | (87,241 | ) | 26,973 | |||||||
| Effect of exchange rate on cash and cash equivalents |
(263 | ) | 559 | (7 | ) | |||||||
|
|
|
|
|
|
|
|||||||
| Net change in cash and cash equivalents |
1,907 | (14,184 | ) | 4,845 | ||||||||
| Cash and cash equivalents, beginning of period—continuing operations |
6,351 | 20,550 | 15,628 | |||||||||
| Cash and cash equivalents, beginning of period—discontinued operations |
— | (15 | ) | 62 | ||||||||
|
|
|
|
|
|
|
|||||||
| Cash and cash equivalents, beginning of period |
6,351 | 20,535 | 15,690 | |||||||||
| Cash and cash equivalents, end of period |
$ | 8,258 | $ | 6,351 | $ | 20,535 | ||||||
| Less: cash and cash equivalents of discontinued operations, end of period |
— | — | (15 | ) | ||||||||
|
|
|
|
|
|
|
|||||||
| Cash and cash equivalents of continuing operations, end of period |
$ | 8,258 | $ | 6,351 | $ | 20,550 | ||||||
|
|
|
|
|
|
|
|||||||
The accompanying notes are an integral part of these consolidated financial statements.
F-8
Table of Contents
API Technologies Corp.
Notes to Consolidated Financial Statements
Dollar Amounts in Thousands, Except Per Share Data
1. NATURE OF BUSINESS AND BASIS OF PRESENTATION
Nature of Business
API Technologies Corp. (“API”, and together with its subsidiaries, the “Company”) designs, develops, and manufactures systems, subsystems, modules, and components for RF microwave, millimeterwave, electromagnetic, power, and security applications, as well as provides electronics manufacturing for technically demanding, high-reliability applications.
On December 31, 2013, the Company completed the sale and leaseback (the “Sale/Leaseback”) of the Company’s facility located in State College, Pennsylvania. The Company sold the facility to an unaffiliated third party for a purchase price of approximately $15,500 and will lease the property from the buyer for approximately $1,279 per year, subject to annual adjustments. The Company used $14,200 of the proceeds of the Sale/Leaseback to prepay a portion of its outstanding term loan indebtedness.
On July 5, 2013, the Company entered into an agreement (the “APA”) with ILC Industries, LLC (“Parent”) and Data Device Corporation, a Delaware corporation and a wholly owned subsidiary of Parent (the “Purchaser”) pursuant to which the Company sold to the Purchaser certain assets comprising the Company’s data bus business (“Data Bus”) in the U.S. and the U.K., including substantially all of the assets of the Company’s wholly owned subsidiary, National Hybrid, Inc., a New York corporation (the “Asset Sale”). The Purchaser paid the Company approximately $32,150 in cash for the assets, after certain adjustments based on closing inventory values as set forth in the APA and customary indemnification provisions. Substantially all of the proceeds from the Asset Sale were used to repay certain of the Company’s outstanding debt.
On April 17, 2013, the Company sold all of the issued and outstanding shares of capital stock or other equity interests of Spectrum Sensors and Controls, Inc., a Pennsylvania corporation (“Sub 1”), Spectrum Sensors and Controls, LLC, a California limited liability company (“Sub 2”), and Spectrum Sensors and Controls, Inc., an Ohio corporation (“Sub 3” and together with Sub 1 and Sub 2, “Sensors”), for gross cash proceeds of approximately $51,350. Of this amount, $1,500 was initially placed into an escrow account for 12 months to secure any indemnification claims made by the purchaser against the sellers, API and Spectrum Control, Inc. (“Spectrum”), a wholly owned subsidiary of API and was paid in April 2014.
On March 22, 2012, API completed the acquisition, through its UK-based subsidiary API Technologies (UK) Limited (“API UK”), of the entire issued share capital of C-MAC Aerospace Limited (“C-MAC”), for a total purchase price of £20,950 pounds sterling (approximately $33,000 USD), including the assumption of C-MAC’s loan facility (see Note 4a). C-MAC is a leading provider of high-reliability electronic systems, modules, and components to the defense, aerospace, space, industrial and energy sectors.
On March 19, 2012 API completed the acquisition of substantially all of the assets of RTI Electronics (“RTIE”) for a total purchase price of $2,295, with $1,500 payable in cash at closing and the remainder pursuant to a $795 Promissory Note payable in 24 equal monthly installments (see Note 4b). Based in Anaheim, California, RTIE is a leading manufacturer of passive electronic components, including thermistors, film capacitors, magnetic transformers and inductors, and audio power conditioning units. RTIE had revenues for the year ended December 31, 2011 of approximately $5,300 from a diverse Fortune 500 customer base spanning the audio, defense, aerospace, and industrial markets.
Basis of Presentation
The audited consolidated financial statements include the accounts of API and its wholly owned subsidiaries. All significant intercompany balances and transactions have been eliminated in consolidation. There
F-9
Table of Contents
API Technologies Corp.
Notes to Consolidated Financial Statements
Dollar Amounts in Thousands, Except Per Share Data
are no other entities controlled by the Company, either directly or indirectly. The financial statements are presented in conformity with United States generally accepted accounting principles.
2. SUMMARY OF SIGNIFICANT ACCOUNTING POLICIES
Accounting estimates
The preparation of financial statements in conformity with generally accepted accounting principles in the United States of America requires management to make certain estimates and assumptions that affect the reported amounts in the consolidated financial statements, and the disclosures made in the accompanying notes. Examples of estimates include the provisions made for bad debts and obsolete inventory, estimates associated with annual goodwill impairment tests, and estimates of deferred income tax and liabilities. The Company also uses estimates when assessing fair values of assets and liabilities acquired in business acquisitions as well as any fair value and any related impairment charges related to the carrying value of machinery and equipment, other long-lived assets, fixed assets held for sale and discontinued operations. The Company also uses estimates in determining the remaining economic lives of long-lived assets. In addition, the Company uses assumptions when employing the Black-Scholes valuation model to estimate the fair value of share options. Despite the Company’s intention to establish accurate estimates and use reasonable assumptions, actual results may differ from these estimates.
Cash and Cash Equivalents
Cash and cash equivalents consist of cash on hand, bank balances and investments in money market instruments with original maturities of three months or less.
Inventories
Inventories, which include materials, labor, and manufacturing overhead, are stated at the lower of cost (on a first-in, first-out basis) or net realizable value. On a quarterly basis, the Company evaluates inventories for potential write-down for identifiable obsolescence and slow moving items. The evaluation includes analysis of future demand, product mix and possible alternative uses. The Company records a provision for both excess and obsolete inventory when write-downs or write-offs are identified. Any write-down of inventory at the close of a fiscal period creates a new cost basis that subsequently would not be marked up based on changes in underlying facts and circumstances.
Fixed Assets
Fixed assets are recorded at cost less accumulated depreciation and are depreciated using the straight-line method over the following periods:
| Straight line basis |
||
| Buildings and leasehold improvements |
5-40 years | |
| Computer equipment |
3-5 years | |
| Furniture and fixtures |
5-8 years | |
| Machinery and equipment |
5-10 years | |
| Vehicles |
3 years |
F-10
Table of Contents
API Technologies Corp.
Notes to Consolidated Financial Statements
Dollar Amounts in Thousands, Except Per Share Data
Betterments are capitalized and amortized by the Company, using the same amortization basis as the underlying assets over the remaining useful life of the original asset. Betterments include renovations, major repairs and upgrades that increase the service of a fixed asset and extend the useful life. Gains and losses on depreciable assets retired or sold are recognized in the consolidated statements of operations in the year of disposal. Repairs and maintenance expenditures are expensed as incurred.
Fixed Assets Held for Sale
Certain fixed assets held for sale from within our SSC segment have been classified as held for sale in the consolidated balance sheets. The Company estimated the fair value of the net assets to be sold at approximately $150 at November 30, 2014 and 2013.
Discontinued Operations
Components of the Company that have been disposed of are reported as discontinued operations. The results of operations of Data Bus and Sensors for prior periods are reported as discontinued operations (Note 5) and not included in the continuing operations.
Goodwill and Intangible Assets
Goodwill and intangible assets result primarily from business acquisitions accounted for under the purchase method. Goodwill and intangible assets with indefinite lives are not amortized but are subject to impairment by applying a fair value based test. The Company completes an annual (or more often if impairment indicators arise under the applicable accounting guidance) impairment assessment of its goodwill on a reporting unit level. The Company’s annual impairment test for goodwill is September 1st.
The Company has three reporting units: (i) SSC, (ii) EMS, and (iii) SSIA. The goodwill in the consolidated financial statements relates to the acquisition of RTIE in March 2012, C-MAC in March 2012, Commercial Microwave Technology, Inc. (“CMT”) in November 2011, Spectrum in June 2011, and SenDEC Corp. (“SenDEC”) in January 2011. All of the goodwill relates to our SSC reporting unit, except for the goodwill associated with SenDEC, which relates to the EMS reporting unit. Goodwill represents the excess of the purchase price of acquired companies over the estimated fair value assigned to the individual assets acquired and liabilities assumed.
A two-step test is performed to assess goodwill impairment. First, the fair value of each reporting unit is compared to its carrying value. The fair value is determined based on a market approach as well as the discounted future cash flows of the subsidiary carrying the goodwill. If the calculated fair value exceeds the carrying value of the assets, goodwill is not impaired and no further testing is performed. The second step is performed if the carrying value exceeds the fair value of the goodwill. If the carrying value of the reporting unit’s goodwill exceeds its implied fair value, an impairment loss equal to the difference is recorded.
As at May 31, 2012, given lower than projected revenues and the Company’s outlook for the EMS segment, the Company determined that the appropriate triggers had been reached to perform an impairment test beyond the annual goodwill impairment test. The Company performed the first step of the goodwill impairment assessment and the carrying value of the assets exceeded the fair value. As a result of the analysis, the Company recorded a write-down of $107,495.
As at April 17, 2013, given the sale of Sensors, which was part of the SSC segment, the Company determined that the appropriate triggers had been reached to perform an impairment test beyond the annual
F-11
Table of Contents
API Technologies Corp.
Notes to Consolidated Financial Statements
Dollar Amounts in Thousands, Except Per Share Data
goodwill impairment test. The Company performed the first step of the goodwill impairment assessment and the fair value of the assets exceeded the carrying value of the assets and determined that an impairment of goodwill had not occurred.
As at July 5, 2013, given the sale of Data Bus, which also was part of the SSC segment, the Company determined that the appropriate triggers had been reached to perform an impairment test beyond the annual goodwill impairment test. The Company performed the first step of the goodwill impairment assessment and the fair value of the assets exceeded the carrying value of the assets and determined that an impairment of goodwill had not occurred.
Following the required accounting guidance, the Company performed the first step of the two-step test method based on an income approach and a market approach on September 1, 2014. The respective reporting units’ future cash flows exceeded the carrying value of the underlying assets and therefore goodwill was not at risk of impairment and no further testing was required for the year ending November 30, 2014.
Intangible assets that have a finite life are amortized using the following basis over the following period:
| Non-compete agreements |
Straight line over 5 years | |
| Computer software |
Straight line over 3-5 years | |
| Customer related intangibles | Straight line or the pattern in which the economic benefits are expected to be realized, over an estimated life of 4-15 years | |
| Marketing related intangibles | The pattern in which the economic benefits are expected to be realized, over an estimated life of 3-10 years | |
| Technology related intangibles | The pattern in which the economic benefits are expected to be realized, over an estimated life of 10 years | |
Long-Lived Assets
The Company periodically evaluates the net realizable values of long-lived assets, principally identifiable intangibles and capital assets, for potential impairment when events or changes in circumstances indicate that the carrying amount of such assets may not be recoverable, as determined based on the estimated future undiscounted cash flows. If such assets were considered to be impaired, the carrying value of the related assets would be reduced to their estimated fair value.
Income taxes
Deferred income tax assets and liabilities are recognized for the future tax consequences attributable to differences between financial reporting and tax bases of assets and liabilities and available net operating loss carry forwards. A valuation allowance is established to reduce tax assets if it is more likely than not that all or some portions of such tax assets will not be realized.
The Company’s valuation allowance was recorded on the deferred tax assets to provide for a reasonable provision, which in the Company’s estimation is more likely than not that all or some portions of such tax assets will not be realized. In determining the adequacy of the valuation allowance, the Company applied the authoritative guidance, and considered such factors as (i) which subsidiaries were producing income and which
F-12
Table of Contents
API Technologies Corp.
Notes to Consolidated Financial Statements
Dollar Amounts in Thousands, Except Per Share Data
subsidiaries were producing losses and (ii) temporary differences occurring from depreciation and amortization which the Company expects to increase the taxable income over future periods.
The Company follows the guidance concerning accounting for uncertainty in income taxes, which clarifies the accounting and disclosure for uncertainty in tax positions. The guidance requires that the Company determine whether it is more likely than not that a tax position will not be sustained upon examination by the appropriate taxing authority. If a tax position does not meet the more likely than not recognition criterion, the guidance requires that the tax position be measured at the largest amount of benefit greater than 50 percent not likely of being sustained upon ultimate settlement.
Based on the Company’s evaluation, management has concluded that there are no significant uncertain tax positions requiring recognition in the consolidated financial statements or adjustments to deferred tax assets and related valuation allowance. Open tax years include the tax years ended May 31, 2010 through November 30, 2014.
The Company from time to time has been assessed interest or penalties by major tax jurisdictions, however such assessments historically have been minimal and immaterial to our financial results. If the Company receives an assessment for interest and/or penalties, it would be classified in the consolidated financial statements as general and administrative expense.
Revenue Recognition
The Company recognizes non-contract revenue when it is realized and earned. The Company considers non-contract revenue realized or realizable and earned when it has persuasive evidence of an arrangement, delivery has occurred, the sales price is fixed or determinable, and collectability is reasonably assured. Delivery is not considered to have occurred until products have been shipped and risk of loss and ownership has transferred to the client. Revenue from production-type contracts, which represents less than one per cent of total revenue, is recognized using the percentage of completion method. The degree of completion is determined based on costs incurred, excluding costs that are not representative of progress to completion, as a percentage of total costs anticipated for each contract. A provision is made for losses on contracts in progress when such losses first become known. Revisions in cost and profit estimates, which can be significant, are reflected in the accounting period in which the relevant facts become known. Revenue from contracts under the percentage of completion method is not significant to the financial statements.
Deferred Revenue
The Company defers revenue when payment is received in advance of the service or product being shipped or delivered, including transition services agreements related to discontinued operations. For some of the larger government contracts, the Company will bill upon meeting certain milestones. These milestones are established by the customer and are specific to each contract. Unearned revenue is recorded as deferred revenue. The Company recognizes revenue on these larger government contracts when items are shipped or upon agreed milestones.
Warranty
The Company provides up to a one-year product defect warranty on various products from the date of sale. Historically, warranty costs have been nominal and have been within management’s expectations. The Company
F-13
Table of Contents
API Technologies Corp.
Notes to Consolidated Financial Statements
Dollar Amounts in Thousands, Except Per Share Data
has accrued approximately $325 and $415, in warranty liability as of November 30, 2014 and 2013, respectively, which has been included in accounts payable and accrued expenses.
Shipping and Handling
Shipping and handling costs are expensed as incurred and included in cost of revenues.
Sales Taxes
The Company records sales tax on the sale of its products as a liability, and does not include such amounts in revenue.
Research and Development
Research and development costs are expensed when incurred.
Advertising Costs
Advertising costs are expensed as incurred and were $1,118, $1,033, and $1,095 for the years ended November 30, 2014, 2013, and 2012, respectively.
Stock-Based Compensation
The Company follows the authoritative guidance for accounting for stock-based compensation. The guidance requires that new, modified and unvested stock-based payment transactions with employees, such as grants of stock options, restricted stock units (“RSUs”) and restricted stock, be recognized in the financial statements based on their fair value at the grant date and recognized as compensation expense over their vesting periods. Stock-based compensation cost for RSUs is measured based on the closing fair market value of the Company’s common stock on the date of grant. The fair value of each option granted is estimated on the grant date using the Black-Scholes option pricing model which takes into account as of the grant date the exercise price and expected life of the option, the current price of the underlying shares and its expected volatility, expected dividends on the shares and the risk-free interest rate for the term of the option.
Foreign Currency Translation and Transactions
The Company’s functional currency is United States dollars and the consolidated financial statements are stated in United States dollars, “the reporting currency.” Integrated operations have been translated from various foreign currencies (Canadian dollars, British Pounds Sterling, Chinese Yuan, Euros, and Mexican Pesos) into United States dollars at the period-end exchange rate for monetary balance sheet items, the historical rate for fixed assets and shareholders’ equity, and the average exchange rate for the year for revenues, expenses, gains and losses. The gains or losses on translation are included as a component of other comprehensive income (loss) for the period.
Receivables and Credit Policies
Accounts receivable are non-interest bearing, uncollateralized customer obligations. Accounts receivable are stated at the amounts billed to the customer. Customer account balances with invoices over 90 days old are considered delinquent. Payments of accounts receivable are allocated to the specific invoices identified on the
F-14
Table of Contents
API Technologies Corp.
Notes to Consolidated Financial Statements
Dollar Amounts in Thousands, Except Per Share Data
customer’s remittance advice or, if unspecified, are applied to the earliest unpaid invoices. The carrying amount of accounts receivable is reduced by a valuation allowance that reflects management’s estimate of the amounts that will not be collected.
Financial Instruments
The fair values of financial instruments including cash and cash equivalents, accounts receivable, accounts payable, and short-term borrowings approximate their carrying values due to the short-term nature of these instruments. Unless otherwise noted, it is management’s opinion that the Company is not exposed to significant interest rate, currency or credit risks arising from its financial instruments. The recorded value of long-term debt approximates the fair value of the debt as the terms and rates approximate market rates.
In the ordinary course of business, the Company carries out transactions in various foreign currencies (Canadian Dollars, British Pounds Sterling, Chinese Yuan, Euros, and Mexican Pesos) included in the Company’s cash, accounts receivable, accounts payable, bank indebtedness, as well as a mortgage loan. The translation adjustments related to these accounts have been reflected as a component of comprehensive income. Currently, the Company does not maintain a foreign currency hedging program.
Derivative Liabilities
Fair value accounting requires bifurcation of embedded derivative instruments of convertible debt or equity instruments, and measurement of their fair value for accounting purposes. The Company’s embedded derivative instruments such as put and call features, make whole provisions and default interest and dividend rates in the convertible note and convertible preferred stock were measured at fair value using the discounted cash flows model by taking the present value of probability weighted cash flow scenarios. Derivative liabilities were adjusted to reflect fair value at the end of each reporting period, with any change in the fair value being recorded in results of operations as Other expense (income), net.
Debt Issuance Costs and Long-term Debt Discount
Fees paid to obtain debt financing or amendments under such debt financing are treated as debt issuance costs and are capitalized and amortized over the life of the debt using the effective interest method. These payments are shown as a financing activity on the consolidated statement of cash flows and are shown as other non-current assets in the consolidated balance sheets.
In accordance with accounting standards the Company recognized the value of detachable warrants issued in conjunction with the issuance of the secured promissory notes and the modification of the convertible promissory notes. The Company valued the warrants using the Black-Scholes pricing model. The Company recorded the warrant relative fair value as an increase to additional paid-in capital and a discount against the related debt. The discount attributed to the value of the warrants was being amortized over the term of the underlying debt using the effective interest method and was written off when the related debt was extinguished.
The Company may record debt and equity discounts in connection with raising funds through the issuance of convertible notes or equity instruments. These discounts may arise from (i) the receipt of proceeds less than the face value of the convertible notes or equity instruments, (ii) beneficial conversion features and/or (iii) recording derivative liabilities related to embedded features. These costs are amortized over the life of the debt to interest expense utilizing the effective interest method. If a conversion of the underlying debt occurs, a proportionate share of the unamortized discount is immediately expensed.
F-15
Table of Contents
API Technologies Corp.
Notes to Consolidated Financial Statements
Dollar Amounts in Thousands, Except Per Share Data
Concentration of Credit Risk
The Company maintains cash balances, at times, with financial institutions, which are in excess of amounts insured by the Federal Deposit Insurance Corporation (FDIC), Canadian Deposit Insurance Corporation (CDIC) and Financial Services Compensation Scheme (FSCS in the United Kingdom). Management monitors the soundness of these institutions and has not experienced any collection losses with these institutions.
The US, Canadian and United Kingdom Governments’ Departments of Defense (directly and through subcontractors) accounts for approximately 45%, 2% and 9% of the Company’s revenues for the year ended November 30, 2014, 47%, 2% and 9% of the Company’s revenues for the year ended November 30, 2013, and 45%, 2% and 9% of the Company’s revenues for the year ended November 30, 2012. One of the U.S. customers, a defense prime contractor, represented approximately 8% of revenues for the year ended November 30, 2014 (8% of revenues for the year ended November 30, 2013 and 7% for the year ended November 30, 2012, respectively). The same customer represented 7%, 5% and 6% of accounts receivable as of November 30, 2014, 2013 and 2012, respectively. A loss of a significant customer could adversely impact the future operations of the Company.
Earnings (Loss) per Share of Common Stock
Basic earnings per share of common stock is computed by dividing income by the weighted average number of shares of common stock outstanding during the period. Diluted earnings per share of common stock gives effect to all dilutive potential shares of common stock outstanding during the period. The computation of diluted earnings per share does not assume conversion, exercise or contingent exercise of securities that would have an anti-dilutive effect on earnings per share (Note 19).
Comprehensive Income (Loss)
Comprehensive income (loss), which includes foreign currency translation adjustments, is shown in the Consolidated Statement of Operations and Comprehensive Income (Loss).
Comparative Reclassifications
The Company identified a misclassification of the goodwill impairment charge recorded for the year ended November 30, 2012. This change in classification had no impact on income (loss) from continuing operations or net income. The goodwill impairment charge was recorded as a separate line item within other expense (income), net as opposed to a component of expenses included within the determination of operating income (loss). The Company has corrected this misclassification by reclassifying the goodwill impairment charge of $107,495 to a component of operating expenses in arriving at operating income (loss) in the accompanying Consolidated Statements of Operations and Comprehensive Income (Loss) for the year ended November 30, 2012. This reclassification changed operating income (loss) as previously reported for the year ended November 30, 2012 from a loss of $13,941 to a loss of $121,436.
3. EFFECTS OF RECENT ACCOUNTING PRONOUNCEMENTS
Recently Issued Accounting Pronouncements
In February 2013, the FASB issued guidance which requires entities to provide information about the amounts reclassified out of accumulated other comprehensive income by component. In addition, entities are
F-16
Table of Contents
API Technologies Corp.
Notes to Consolidated Financial Statements
Dollar Amounts in Thousands, Except Per Share Data
required to present, either on the face of the statement where net income is presented or in the notes, significant amounts reclassified out of accumulated other comprehensive income by the respective line items of net income but only if the amount is required under GAAP to be reclassified to net income in its entirety in the same reporting period. For other amounts that are not required under GAAP to be reclassified in their entirety to net income, entities are required to cross-reference to other disclosures required under GAAP that provide additional detail on these amounts. This standard is effective prospectively for reporting periods beginning after December 15, 2013. The Company adopted this standard in the quarter ended May 31, 2014, which did not have a material impact on its consolidated financial statements.
In July 2013, the FASB issued guidance which states that an unrecognized tax benefit, or a portion of an unrecognized tax benefit, should be presented in the financial statements as a reduction to a deferred tax asset for a net operating loss carryforward, a similar tax loss, or a tax credit carryforward, except as follows. To the extent a net operating loss carryforward, a similar tax loss, or a tax credit carryforward is not available at the reporting date under the tax law of the applicable jurisdiction to settle any additional income taxes that would result from the disallowance of a tax position or the tax law of the applicable jurisdiction does not require the entity to use, and the entity does not intend to use, the deferred tax asset for such purpose, the unrecognized tax benefit should be presented in the financial statements as a liability and should not be combined with deferred tax assets. The amendments in this ASU are effective for fiscal years, and interim periods within those years, beginning after December 15, 2013. The Company adopted this standard in the quarter ended May 31, 2014, which did not have a material impact on its consolidated financial statements.
In April 2014, the FASB issued guidance which changes the threshold for reporting discontinued operations and adds additional disclosures. The guidance updates the definition of discontinued operations to include the disposal of a component or group of components that is disposed of or is classified as held for sale and represents a strategic shift that has (or will have) a major effect on an entity’s operations and financial results. The guidance is effective prospectively for all disposals of components of an entity that occur with annual periods beginning on or after December 15, 2014, and interim periods therein. The Company is currently assessing the impact of this guidance on our consolidated financial position and results of operations.
In May 2014, the FASB issued guidance which affects any entity using GAAP that either enters into contracts with customers to transfer goods or services or enters into contracts for the transfer of nonfinancial assets unless those contracts are within the scope of other standards (e.g., insurance contracts or lease contracts). The new guidance will supersede the existing revenue recognition requirements, and most industry-specific guidance. For a public entity, the amendments in this guidance are effective for annual reporting periods beginning after December 15, 2016, including interim periods within that reporting period. Early application is not permitted. The guidance permits companies to either apply the requirements retrospectively to all prior periods presented or apply the requirements in the year of adoption, through a cumulative adjustment. The Company has not yet selected a transition method nor has it determined the impact of adoption on its condensed consolidated financial statements.
4. ACQUISITIONS
a) C-MAC
On March 22, 2012, the Company completed the acquisition, through its UK-based subsidiary API UK, of the entire issued share capital of C-MAC, for a total purchase price of £20,950 pounds sterling (approximately $33,000 USD), consisting of i) the payment at closing of £19,250 pounds sterling (approximately $30,300 USD) and ii) the assumption of C-MAC’s term loan facility of £1,700 pounds sterling (approximately $2,700 USD)
F-17
Table of Contents
API Technologies Corp.
Notes to Consolidated Financial Statements
Dollar Amounts in Thousands, Except Per Share Data
(see Note 12c). C-MAC is a leading provider of high-reliability electronic systems, modules, and components to the defense, aerospace, space, industrial and energy sectors. The acquisition expands the Company’s RF and Microwave and microelectronics capabilities and the Company believes that additional revenue opportunities will be generated through cross selling, C-MAC’s European based operation and API’s expansion into international markets. These factors contributed to a purchase price resulting in the recognition of goodwill.
The Company accounted for the acquisition using the purchase method of accounting in accordance with the guidance on business combinations. The Company also incurred legal costs, reorganization charges and professional fees in connection with the acquisition of approximately $1,586 as of November 30, 2012. These expenses were accounted for as operating expenses. The results of operations of C-MAC were included in the Company’s results of operations beginning on March 22, 2012.
Accounting guidance requires that identifiable assets acquired and liabilities assumed be reported at fair value as of the acquisition date of a business combination. Assets and liabilities acquired were as follows:
| Cash |
$ | 3,045 | ||
| Accounts receivable and other current assets |
6,182 | |||
| Inventory |
7,235 | |||
| Fixed assets |
5,432 | |||
| Customer, marketing and technology related intangible assets |
7,848 | |||
| Goodwill |
11,364 | |||
| Current liabilities |
(4,614 | ) | ||
| Long-term liabilities |
(3,265 | ) | ||
|
|
|
|||
| Fair value of net assets acquired |
$ | 33,227 | ||
|
|
|
The fair value of C-MAC exceeded the underlying fair value of all net assets acquired, giving rise to the goodwill. The resulting goodwill is non-deductible for tax purposes. Customer, marketing and technology related intangibles are amortized based on the pattern in which the economic benefits are expected to be realized, over estimated lives of three to ten years.
Revenues and net loss of C-MAC for the year ended November 30, 2014 were approximately $30,476 and $(1,972), respectively. Revenues and net loss of C-MAC for the year ended November 30, 2013 were approximately $30,549 and $(2,188), respectively. Revenues and net loss of C-MAC for the period from the acquisition of March 22, 2012 to November 30, 2012 were approximately $25,336 and $(1,403), respectively.
Fixed assets acquired in this transaction consist of the following:
| Land |
$ | 155 | ||
| Buildings and leasehold improvements |
1,415 | |||
| Computer equipment |
280 | |||
| Furniture and fixtures |
70 | |||
| Machinery and equipment |
3,504 | |||
| Vehicles |
8 | |||
|
|
|
|||
| Total fixed assets acquired |
$ | 5,432 | ||
|
|
|
F-18
Table of Contents
API Technologies Corp.
Notes to Consolidated Financial Statements
Dollar Amounts in Thousands, Except Per Share Data
b) RTIE
On March 19, 2012 the Company completed the acquisition of substantially all of the assets of RTIE for a total purchase price of $2,295, with $1,500 payable in cash at closing and the remainder pursuant to a $795 Promissory Note payable in 24 equal monthly installments. Based in Anaheim, California, RTIE is a leading manufacturer of passive electronic components, including thermistors, film capacitors, magnetic transformers and inductors, and audio power conditioning units. RTIE had revenues for the year ended December 31, 2011 of approximately $5,300 from a diverse Fortune 500 customer base spanning the audio, defense, aerospace, and industrial markets. The acquisition expands the Company’s RF and Microwave capabilities and the Company believes that its low-cost manufacturing capabilities and established sales channels will provide additional revenue opportunities and improved profitability for RTIE products. These factors contributed to a purchase price resulting in the recognition of goodwill.
The Company accounted for the acquisition using the purchase method of accounting in accordance with the guidance on business combinations. The Company also incurred legal, travel and relocation costs, reorganization charges and professional fees in connection with the acquisition of approximately $769 as of November 30, 2012. These expenses were accounted for as operating expenses. The results of operations of RTIE were included in the Company’s results of operations beginning on March 19, 2012.
Accounting guidance requires that identifiable assets acquired and liabilities assumed be reported at fair value as of the acquisition date of a business combination. Assets and liabilities acquired were as follows:
| Inventory |
$ | 275 | ||
| Fixed assets |
82 | |||
| Goodwill |
2,177 | |||
| Current liabilities |
(225 | ) | ||
| Deferred revenue |
(14 | ) | ||
|
|
|
|||
| Fair value of net assets acquired |
$ | 2,295 | ||
|
|
|
The fair value of RTIE exceeded the underlying fair value of all net assets acquired, giving rise to the goodwill. The resulting goodwill is deductible for tax purposes.
Revenues and net income of RTIE for year ended November 30, 2014 were approximately $503 and $80, respectively. Revenues and net income of RTIE for year ended November 30, 2013 were approximately $1,937 and $308, respectively. Revenues and net income of RTIE for the period from March 19, 2012 to November 30, 2012 were approximately $2,088 and $568, respectively.
Fixed assets acquired in this transaction consist entirely of machinery and equipment.
F-19
Table of Contents
API Technologies Corp.
Notes to Consolidated Financial Statements
Dollar Amounts in Thousands, Except Per Share Data
The following unaudited pro forma summary presents the combined results of operations as if the C-MAC and RTIE acquisitions described above and Sensors and Data Bus discontinued operations described in Note 5 had occurred at the beginning of the year ended November 30, 2012.
| Year ended November 30, |
||||
| 2012 | ||||
| Revenues |
$ | 253,532 | ||
| Net income (loss) from continuing operations |
$ | (149,210 | ) | |
| Net income (loss) |
$ | (149,210 | ) | |
| Net income (loss) from continuing operations per share—basic and diluted |
$ | (2.70 | ) | |
| Net income (loss) per share—basic and diluted |
$ | (2.70 | ) | |
5. DISCONTINUED OPERATIONS
a) Data Bus
On July 5, 2013, the Company entered into the APA with Parent and the Purchaser, pursuant to which the Company sold to the Purchaser certain assets comprising the Company’s Data Bus business in the U.S. and the U.K., including substantially all of the assets of the Company’s wholly owned subsidiary, National Hybrid, Inc., a New York corporation. The Purchaser paid the Company approximately $32,150 in cash for the assets, after certain adjustments based on closing inventory values as set forth in the APA and customary indemnification provisions.
The operating results of Data Bus are summarized as follows:
| Year ended Nov. 30, 2014 |
Year ended Nov. 30, 2013 |
Year ended Nov. 30, 2012 |
||||||||||
| Revenue, net |
$ | — | $ | 7,571 | $ | 12,191 | ||||||
| Cost of revenues |
— | 4,435 | 9,070 | |||||||||
| Restructuring charges |
— | — | 591 | |||||||||
|
|
|
|
|
|
|
|||||||
| Gross Profit |
— | 3,136 | 2,530 | |||||||||
| General and administrative |
— | 484 | 1,064 | |||||||||
| Selling expenses |
— | 82 | 19 | |||||||||
| Research and development |
— | — | 41 | |||||||||
| Restructuring charges |
— | — | 24 | |||||||||
| Provision for income taxes |
— | 428 | 33 | |||||||||
| Provision for income taxes—Gain on sale of Data Bus |
— | 4,190 | — | |||||||||
| Other expenses (income) |
— | (10,002 | ) | — | ||||||||
|
|
|
|
|
|
|
|||||||
| Income (loss) from discontinued operations, net of tax |
$ | — | $ | 7,954 | $ | 1,349 | ||||||
|
|
|
|
|
|
|
|||||||
Other income in the year ended November 30, 2013 primarily relates to the gain on sale of Data Bus, net of approximately $705 transaction expenses and deferred revenue of $2,544. The Company had a transition services agreement with the Purchaser, where the Company manufactured products in the United States for a period of up to 12 months and could manufacture certain products in the United Kingdom for a period of up to 4 years. The Company determined that the U.K. transition services agreement did not result in the Company having a significant continuing involvement in these discontinued operations following the assessment period.
F-20
Table of Contents
API Technologies Corp.
Notes to Consolidated Financial Statements
Dollar Amounts in Thousands, Except Per Share Data
b) Sensors
On April 17, 2013 the Company sold all of the issued and outstanding shares of capital stock or other equity interests of the Sensors companies for gross cash proceeds of approximately $51,350. Of this amount, $1,500 was placed into an escrow account for 12 months to secure any indemnification claims made by the purchaser against the sellers, API and Spectrum. The amount in escrow of $1,500 is included in Restricted Cash in the Consolidated Balance Sheet at November 30, 2013.
The operating results of Sensors are summarized as follows:
| Year ended Nov. 30, 2014 |
Year ended Nov. 30, 2013 |
Year ended Nov. 30, 2012 |
||||||||||
| Revenue, net |
$ | — | $ | 9,270 | $ | 26,247 | ||||||
| Cost of revenues |
— | 7,155 | 19,181 | |||||||||
| Restructuring charges |
— | — | 3 | |||||||||
|
|
|
|
|
|
|
|||||||
| Gross Profit |
— | 2,115 | 7,063 | |||||||||
| General and administrative |
— | 366 | 804 | |||||||||
| Selling expenses |
— | 497 | 1,294 | |||||||||
| Research and development |
— | 180 | 646 | |||||||||
| Restructuring charges |
— | — | 5 | |||||||||
| Provision for income taxes |
— | 258 | 1,642 | |||||||||
| Provision for income taxes—Gain on sale of Sensors |
— | 4,408 | — | |||||||||
| Other expenses (income) |
— | (11,814 | ) | 3,889 | ||||||||
|
|
|
|
|
|
|
|||||||
| Income (loss) from discontinued operations, net of tax |
$ | — | $ | 8,220 | $ | (1,217 | ) | |||||
|
|
|
|
|
|
|
|||||||
Other income in the year ended November 30, 2013 primarily relates to the gain on sale of Sensors, net of approximately $2,131 transaction expenses and deferred revenue of $1,780. Pursuant to a transition services agreement, the Company manufactured products for a period of up to 9 months and provided certain administrative services to the purchaser over a period of up to 18 months. The Company determined that the transition services agreement did not result in the Company having a significant continuing involvement in these discontinued operations following the assessment period.
F-21
Table of Contents
API Technologies Corp.
Notes to Consolidated Financial Statements
Dollar Amounts in Thousands, Except Per Share Data
6. OTHER FAIR VALUE MEASUREMENTS
The following table summarizes assets, which have been accounted for at fair value, along with the basis for the determination of fair value.
| November 30, 2014 | November 30, 2013 | |||||||||||||||||||||||
| 2014 Total |
Unobservable Measurement Criteria (Level 3) |
Impairment | 2013 Total |
Unobservable Measurement Criteria (Level 3) |
Impairment | |||||||||||||||||||
| Fixed assets held for sale |
$ | 150 | $ | 150 | $ | — | $ | 150 | $ | 150 | $ | — | ||||||||||||
| Derivative liabilities – Redeemable Preferred Stock (Note 14) |
— | — | — | (179 | ) | (179 | ) | — | ||||||||||||||||
|
|
|
|
|
|
|
|
|
|
|
|
|
|||||||||||||
| Total |
$ | 150 | $ | 150 | $ | — | $ | (29 | ) | $ | (29 | ) | $ | — | ||||||||||
|
|
|
|
|
|
|
|
|
|
|
|
|
|||||||||||||
The following is a summary of activity for the years ended November 30, 2014 and 2013 for assets and liabilities measured at fair value based on unobservable measure criteria:
| Fixed Assets Held for Sale |
Derivative Liabilities – Preferred Stock |
|||||||
| Balance as at November 30, 2012 |
$ | 900 | $ | (267 | ) | |||
| Less: Fixed assets sold |
(750 | ) | — | |||||
| Less: Adjustment to fair value of derivative liabilities |
— | 88 | ||||||
|
|
|
|
|
|||||
| Balance as at November 30, 2013 |
$ | 150 | $ | (179 | ) | |||
| Less: Redemption of Preferred Stock |
— | 179 | ||||||
|
|
|
|
|
|||||
| Balance as at November 30, 2014 |
$ | 150 | $ | — | ||||
|
|
|
|
|
|||||
The fair value of the fixed assets held for sale was determined using a market approach by using prices and other relevant information generated by market transactions involving comparable assets. The Series A Preferred Stock (Note 14) also contained an embedded feature for a default dividend rate. The Company determined the fair value of the derivative liabilities related to the preferred stock by using the present value of probability weighted cash flow scenarios.
7. INVENTORIES
Inventories consisted of the following at November 30:
| 2014 | 2013 | |||||||
| Raw materials |
$ | 30,509 | $ | 26,015 | ||||
| Work in progress |
16,130 | 23,425 | ||||||
| Finished goods |
8,079 | 8,778 | ||||||
|
|
|
|
|
|||||
| Total |
$ | 54,718 | $ | 58,218 | ||||
|
|
|
|
|
|||||
F-22
Table of Contents
API Technologies Corp.
Notes to Consolidated Financial Statements
Dollar Amounts in Thousands, Except Per Share Data
8. FIXED ASSETS
Fixed assets consisted of the following:
| As of November 30, 2014 | ||||||||||||
| Cost | Accumulated Depreciation |
Net Book Value |
||||||||||
| Land |
$ | 2,489 | $ | — | $ | 2,489 | ||||||
| Buildings and leasehold improvements |
18,832 | (3,706 | ) | 15,126 | ||||||||
| Computer equipment |
4,643 | (2,925 | ) | 1,718 | ||||||||
| Furniture and fixtures |
1,166 | (817 | ) | 349 | ||||||||
| Machinery and equipment |
28,619 | (17,896 | ) | 10,723 | ||||||||
| Vehicles |
99 | (80 | ) | 19 | ||||||||
|
|
|
|
|
|
|
|||||||
| Fixed assets, net |
$ | 55,848 | $ | (25,424 | ) | $ | 30,424 | |||||
|
|
|
|
|
|
|
|||||||
| As of November 30, 2013 | ||||||||||||
| Cost | Accumulated Depreciation |
Net Book Value |
||||||||||
| Land |
$ | 3,084 | $ | — | $ | 3,084 | ||||||
| Buildings and leasehold improvements |
20,267 | (3,557 | ) | 16,710 | ||||||||
| Computer equipment |
2,688 | (1,545 | ) | 1,143 | ||||||||
| Furniture and fixtures |
1,482 | (948 | ) | 534 | ||||||||
| Machinery and equipment |
28,551 | (14,826 | ) | 13,725 | ||||||||
| Vehicles |
98 | (63 | ) | 35 | ||||||||
|
|
|
|
|
|
|
|||||||
| Fixed assets, net |
$ | 56,170 | $ | (20,939 | ) | $ | 35,231 | |||||
|
|
|
|
|
|
|
|||||||
Buildings and leasehold improvements for November 30, 2014, includes assets from capital leases with cost of $5,225, accumulated depreciation of $(319) and net book value of $4,906 (November 30, 2013—$0, $(0) and $0, respectively). Machinery and equipment for November 30, 2014, includes assets from capital leases with cost of $558, accumulated depreciation of $(227) and net book value of $331 (November 30, 2013—$558, $(168) and $390, respectively).
Depreciation expense amounted to $6,652 for the year ended November 30, 2014, and $7,310 for the year ended November 30, 2013. Included in these amounts are $378 and $58 of amortization of assets under capital lease for the year ended November 30, 2014, November 30, 2013, respectively.
9. GOODWILL AND INTANGIBLE ASSETS
The goodwill in the consolidated financial statements relates to the acquisition of RTIE in March 2012, C-MAC in March 2012, CMT in November 2011, Spectrum in June 2011, and SenDEC in January 2011. All of the goodwill relates to our SSC and EMS reporting units.
Following the required accounting guidance, the Company performed the first step of the two-step test method based on discounted future cash flows on September 1, 2014. The respective reporting units’ future cash flows exceeded the carrying value of the underlying assets and therefore goodwill was not at risk of impairment and no further testing was required for the year ending November 30, 2014.
F-23
Table of Contents
API Technologies Corp.
Notes to Consolidated Financial Statements
Dollar Amounts in Thousands, Except Per Share Data
As at May 31, 2012, given lower than projected revenues, primarily as a result of an overall decline in the defense market, and the Company’s outlook for the EMS segment, the Company determined that the appropriate triggers had been reached to perform an impairment test beyond the annual goodwill impairment test. The Company performed the first step of the goodwill impairment assessment and the carrying value of the assets exceeded the fair value. During the quarter ended May 31, 2012, the Company determined that an impairment of goodwill was probable, determined a reasonable estimate and therefore recorded a write-down of $87,000. During the quarter ended August 31, 2012, the Company completed its impairment analysis and determined that an additional $20,495 write-down of goodwill was required.
Goodwill and intangible assets consisted of the following at November 30:
| 2014 | 2013 | |||||||
| Goodwill not subject to amortization: |
||||||||
| Beginning balance, net |
$ | 116,770 | $ | 116,770 | ||||
|
|
|
|
|
|||||
| Ending balance, net |
$ | 116,770 | $ | 116,770 | ||||
|
|
|
|
|
|||||
Intangible assets consisted of the following:
| November 30, 2014 | ||||||||||||||||
| Weighted Average Useful Life (years) |
Cost | Accumulated Amortization |
Net Book Value |
|||||||||||||
| Non-compete agreements |
2.0 | $ | 484 | $ | (484 | ) | $ | — | ||||||||
| Customer contracts |
8.6 | 33,548 | (14,979 | ) | 18,569 | |||||||||||
| Technology |
7.6 | 19,027 | (9,465 | ) | 9,562 | |||||||||||
| Tradenames |
3.3 | 7,376 | (7,280 | ) | 96 | |||||||||||
| Computer software |
3.0 | 2,848 | (1,397 | ) | 1,451 | |||||||||||
| Patents |
242 | (72 | ) | 170 | ||||||||||||
|
|
|
|
|
|
|
|
|
|||||||||
| Intangible assets, net |
7.3 | $ | 63,525 | $ | (33,677 | ) | $ | 29,848 | ||||||||
|
|
|
|
|
|
|
|
|
|||||||||
| November 30, 2013 | ||||||||||||||||
| Weighted Average Useful Life (years) |
Cost | Accumulated Amortization |
Net Book Value |
|||||||||||||
| Non-compete agreements |
2.0 | $ | 484 | $ | (403 | ) | $ | 81 | ||||||||
| Customer contracts |
8.1 | 33,485 | (10,798 | ) | 22,687 | |||||||||||
| Technology |
7.5 | 18,965 | (6,636 | ) | 12,329 | |||||||||||
| Tradenames |
3.3 | 7,376 | (5,623 | ) | 1,753 | |||||||||||
| Computer software |
3.0 | 2,798 | (1,015 | ) | 1,783 | |||||||||||
| Patents |
166 | (19 | ) | 147 | ||||||||||||
|
|
|
|
|
|
|
|
|
|||||||||
| Intangible assets, net |
7.1 | $ | 63,274 | $ | (24,494 | ) | $ | 38,780 | ||||||||
|
|
|
|
|
|
|
|
|
|||||||||
F-24
Table of Contents
API Technologies Corp.
Notes to Consolidated Financial Statements
Dollar Amounts in Thousands, Except Per Share Data
Changes in the carrying amount of Intangible assets were as follows:
| November 30, 2014 |
November 30, 2013 |
|||||||
| Intangible assets: |
||||||||
| Beginning balance, net |
$ | 38,780 | $ | 47,934 | ||||
| Patents and Computer software purchased |
381 | 732 | ||||||
| Less: Amortization |
(9,313 | ) | (9,886 | ) | ||||
|
|
|
|
|
|||||
| Ending balance, net |
$ | 29,848 | $ | 38,780 | ||||
|
|
|
|
|
|||||
Amortization expense amounted to $9,313 for the year ended November 30, 2014 and $9,886 for the year ended November 30, 2013. Amortization expense related to existing intangible assets is expected to be approximately $6,928, $6,094, $5,125, $4,273 and $4,152 for the years ending November 30, 2015, 2016, 2017, 2018 and 2019, respectively. At November 30, 2014, computer software includes net capitalized computer software development costs of $1,164 ($1,431 at November 30, 2013).
10. SHORT-TERM DEBT
The Company has a credit facility in place for its U.K. subsidiaries for approximately $394 (250 GBP), which renews in July 2015. This line of credit is tied to the prime rate in the United Kingdom and is secured by the subsidiaries’ assets. This facility was undrawn as of November 30, 2014 and 2013.
11. ACCOUNTS PAYABLE AND ACCRUED EXPENSES
Accounts payable and accrued expenses consisted of the following at November 30:
| 2014 | 2013 | |||||||
| Trade accounts payable |
$ | 16,843 | $ | 20,714 | ||||
| Accrued expenses |
6,497 | 6,586 | ||||||
| Wage and vacation accrual |
4,567 | 4,917 | ||||||
|
|
|
|
|
|||||
| Total |
$ | 27,907 | $ | 32,217 | ||||
|
|
|
|
|
|||||
12. LONG-TERM DEBT
The Company was obligated under the following debt instruments at November 30:
| 2014 | 2013 | |||||||
| Term loans, due February 6, 2018, base rate plus 6.50% interest or LIBOR plus 7.50%, (a) |
$ | 121,730 | $ | 86,810 | ||||
| Asset based loans, due February 6, 2018, base rate plus a margin between 1.50% and 2.00%, or LIBOR plus a margin between 2.50% and 3.00%, (a) |
— | 24,345 | ||||||
| Mortgage loan, due 2027, 1.35% above Barclays fixed bank rate (b) |
1,151 | 1,318 | ||||||
| Note payable – RTIE acquisition (c) |
— | 139 | ||||||
| Capital leases payable (d) |
5,430 | 249 | ||||||
|
|
|
|
|
|||||
| $ | 128,311 | $ | 112,861 | |||||
| Less: Current portion of long-term debt |
(10,097 | ) | (8,155 | ) | ||||
| Discount and deferred financing charges on term loans |
— | (8,100 | ) | |||||
|
|
|
|
|
|||||
| Long-term portion |
$ | 118,214 | $ | 96,606 | ||||
|
|
|
|
|
|||||
F-25
Table of Contents
API Technologies Corp.
Notes to Consolidated Financial Statements
Dollar Amounts in Thousands, Except Per Share Data
| a) | On February 6, 2013, the Company refinanced its credit facilities and entered into (i) a credit agreement (the “Term Loan Agreement”) with various lenders and Guggenheim Corporate Funding, LLC, as agent (the “Agent”) that provides for a $165,000 term loan facility and (ii) a credit agreement with various lenders and Wells Fargo Bank, National Association (the “Revolving Loan Agreement”) that provides for a $50,000 asset-based revolving borrowing base credit facility, with a $10,000 subfacility (or the Sterling equivalent) for certain of our United Kingdom subsidiaries, a $10,000 subfacility for letters of credit and a $5,000 subfacility for swingline loans. |
On February 6, 2013, in connection with entering into the Term Loan Agreement and the Revolving Loan Agreement, the Amended and Restated Credit Agreement, dated as of June 27, 2011 and amended on January 6, 2012 and March 22, 2012, by and among the lenders from time to time party thereto and Morgan Stanley Senior Funding, Inc., as administrative agent, lead arranger and sole book-runner, which had an outstanding balance of $183,400 was paid off and terminated, which resulted in the write-off of approximately $10,300 of deferred financing costs and note discounts.
On December 31, 2013, the Company repaid $14,200 of its term loans from the proceeds of the Sale/Leaseback, (see d) below) of the Company’s facility located in State College, Pennsylvania. On July 5, 2013 and April 17, 2013, the Company sold Data Bus and Sensors (Note 5) and repaid approximately $28,780 and $44,919, respectively, of its term loans from the proceeds of these sales, in accordance with the Term Loan Agreement. In addition, the Company repaid a portion of its term loans using the net proceeds of $739 from the March 14, 2013, sale of certain land and a building in Palm Bay, Florida.
On May 22, 2013, the Company entered into a First Amendment to the Revolving Loan Agreement that amends certain cash management and reporting requirements.
On October 10, 2013, the Company entered into an Amendment No. 1 to Credit Agreement (the “Amendment No. 1”) by and among the Company, as borrower, the lenders party thereto and the Agent. Amendment No. 1, among other things, amends the Term Loan Agreement to reduce the minimum interest coverage ratio, increase the maximum leverage ratio, reduce the interest rate on the term loans and modify the terms of the prepayment premium, which the Company is required to pay upon voluntary prepayments or certain mandatory prepayments of the term loans.
On March 21, 2014, the Company entered into Amendment No. 2 to Credit Agreement (the “Amendment No. 2”), by and among the Company, as borrower, the lenders party thereto and the Agent.
Amendment No. 2 amends the Term Loan Agreement to provide for an incremental term loan facility in an aggregate principal amount equal to $55,000 (the “Incremental Term Loan Facility”), which Incremental Term Loan Facility is subject to substantially the same terms and conditions, including the applicable interest rate and the maturity date of February 6, 2018, as the $165,000 term loan facility provided upon the initial closing of the Term Loan Agreement. In addition, Amendment No. 2 amends the Term Loan Agreement to reduce the minimum interest coverage ratio and increase the maximum leverage ratio, among other things.
The proceeds of the Incremental Term Loan Facility were used (i) to pay in full and terminate the Company’s Revolving Loan Agreement; (ii) to redeem all 26,000 shares of the Company’s Series A Preferred Stock that were outstanding (as defined and described in Note 10); (iii) to pay fees, costs and expenses associated with the Incremental Term Loan Facility and related transactions; and (iv) for general corporate purposes. This resulted in the write-off of approximately $10,212 of deferred financing costs and note discounts in the quarter ended May 31, 2014.
F-26
Table of Contents
API Technologies Corp.
Notes to Consolidated Financial Statements
Dollar Amounts in Thousands, Except Per Share Data
Term Loan Agreement
The term loans incurred pursuant to the Term Loan Agreement, as amended, bear interest, at the Company’s option, at the base rate plus 6.50% or an adjusted LIBOR rate (based on one, two or three-month interest periods) plus 7.50% for the first year and at the base rate plus 7.50% or an adjusted LIBOR rate (based on one, two or three-month interest periods) plus 10.75% thereafter, with a LIBOR floor of 1.50%. For purposes of the Term Loan Agreement, the “base rate” means the highest of Wells Fargo Bank, National Association’s prime rate, the federal funds rate plus a margin equal to 0.50% and the adjusted LIBOR rate for a 3-month interest period plus a margin equal to 1.00%.
Interest is due and payable in arrears monthly for term loans bearing interest at the base rate and at the end of an interest period (or at each three month interval in the case of term loans with interest periods greater than three months) in the case of term loans bearing interest at the adjusted LIBOR rate. Principal payments of the term loans are paid at the end of each of the Company’s fiscal quarters, commencing for the fiscal quarter ending May 31, 2013, with the balance of any outstanding term loans due and payable in full on February 6, 2018. The quarterly principal payments will amortize at 1.25% for the fiscal quarters through the end of the Company’s 2014 fiscal year, at 1.875% for the fiscal quarters through the end of the Company’s 2015 fiscal year and at 2.50% for each of the fiscal quarters thereafter.
Under certain circumstances, the Company is required to prepay the term loans upon the receipt of cash proceeds of certain asset sales, cash proceeds of certain extraordinary receipts and cash proceeds of certain debt or equity financings, and based on a calculation of annual excess cash flow. Mandatory prepayments resulting from assets sales or certain debt financings may require the payment of certain prepayment premiums.
The term loans are secured by a first priority security interest in accounts receivable, inventory, machinery, equipment and certain other personal property relating to the foregoing, and any proceeds from any of the foregoing, subject to certain exceptions and liens, and a first priority security position on substantially all other real and personal property, in each case that are owned by the Company and the subsidiary guarantors.
The Term Loan Agreement contains customary affirmative and negative covenants, including covenants that limit or restrict the Company and its subsidiaries’ ability to, among other things, incur indebtedness, grant liens, dispose of assets and pay dividends or make distributions to stockholders, in each case subject to customary exceptions for a term loan of this size and type.
Pursuant to the Term Loan Agreement, the Company is required to maintain compliance with an interest coverage ratio and a leverage ratio and to limit its annual capital expenditures to $4,000 per fiscal year (subject to carry-over rights).
Revolving Loan Agreement
On March 21, 2014, approximately $25,136 of the proceeds of the Incremental Term Loan Facility were used to pay in full and terminate the Company’s Revolving Loan Agreement.
The revolving loans incurred pursuant to the Revolving Loan Agreement bore interest, at the Company’s option, at the base rate plus a margin between 1.50% and 2.00% or an adjusted LIBOR rate (based on one, two, three or six-month interest periods) plus a margin between 2.50% and 3.00%, in each case with such margin being determined based on the Company’s average daily excess availability under the revolving
F-27
Table of Contents
API Technologies Corp.
Notes to Consolidated Financial Statements
Dollar Amounts in Thousands, Except Per Share Data
credit facility for the preceding fiscal quarter. For purposes of the Revolving Loan Agreement, the “base rate” means the highest of Wells Fargo Bank, National Association’s prime rate, the federal funds rate plus a margin equal to 0.50% and the adjusted LIBOR rate for a 3-month interest period plus a margin equal to 1.00%.
Interest was due and payable in arrears monthly for revolving loans bearing interest at the base rate and at the end of an interest period (or at each three month interval in the case of loans with interest periods greater than three months) in the case of revolving loans bearing interest at the adjusted LIBOR rate. Principal, together with all accrued and unpaid interest, was due and payable on February 6, 2018. The Company was permitted to prepay the revolving loans and terminate the commitments, in whole or in part, at any time without premium or penalty. Under certain circumstances, the Company was required to prepay the revolving loans upon the receipt of cash proceeds of certain asset sales.
All borrowings under the Revolving Loan Agreement were limited by amounts available pursuant to a borrowing base calculation, which was based on percentages of eligible accounts receivable, inventory, machinery and equipment, in each case subject to reductions for applicable reserves.
The Revolving Loan Agreement contained customary affirmative and negative covenants, including covenants that limited or restricted the Company and its subsidiaries’ ability to, among other things, incur indebtedness, grant liens, dispose of assets and pay dividends or make distributions to stockholders, in each case subject to customary exceptions for a credit facility of this size and type.
Pursuant to the Revolving Loan Agreement, the Company was also required to maintain compliance with a fixed charge coverage ratio and to limit its annual capital expenditures to $4,000 per fiscal year (subject to carry-over rights) at such times that it failed to maintain excess availability under the revolving credit facility above a specified level.
| b) | A subsidiary of the Company in the United Kingdom entered into a 20 year term mortgage agreement in 2007, under which interest is charged at a margin of 1.35% over Barclays Fixed Base Rate of 0.5% at November 30, 2014. The mortgage is secured by the subsidiary’s assets. |
| c) | On March 19, 2012 the Company completed the acquisition of substantially all of the assets of RTIE Electronics for a total purchase price of $2,295, with $1,500 payable in cash at closing and the remainder pursuant to a $795 Promissory Note payable in 24 equal monthly installments. This Promissory Note payable was fully repaid as of November 30, 2014. |
| d) | On December 31, 2013, the Company completed the Sale/Leaseback. The Company sold the facility to an unaffiliated third party for a gross purchase price of approximately $15,500 and will lease the property from the buyer for 15 years for approximately $1,279 per year, subject to annual adjustments. As a result of this transaction the Company initially recorded a capital lease obligation of $5,225. The gain on the sale has been deferred and is being recognized over the 15 year lease term. |
The Company is also the lessee of equipment under various capital leases with monthly payments of $9 and $9 for November 30, 2014 and 2013, respectively, including interest ranging from approximately 6 to 8%, secured by the leased assets that expire by May 2016. The assets and liabilities under the capital leases are recorded at the fair value of the asset. The assets are amortized over the lower of their related lease terms or its estimated productive life.
F-28
Table of Contents
API Technologies Corp.
Notes to Consolidated Financial Statements
Dollar Amounts in Thousands, Except Per Share Data
At November 30, 2014 and 2013, $5,237 and $390 of assets from capital leases were included in fixed assets, net.
Future principal payments of long-term debt and capital leases for the next five years are as follows:
| Year |
Long-term debt |
Capital leases |
Total | |||||||||
| 2015 |
$ | 9,982 | $ | 1,417 | $ | 11,399 | ||||||
| 2016 |
13,266 | 1,390 | 14,656 | |||||||||
| 2017 |
13,266 | 1,364 | 14,630 | |||||||||
| 2018 |
85,733 | 1,392 | 87,125 | |||||||||
| 2019 |
130 | 1,419 | 1,549 | |||||||||
| Thereafter |
504 | 14,265 | 14,769 | |||||||||
|
|
|
|
|
|
|
|||||||
| $ | 122,881 | $ | 21,247 | $ | 144,128 | |||||||
| Less: imputed interest |
— | (15,817 | ) | (15,817 | ) | |||||||
|
|
|
|
|
|
|
|||||||
| $ | 122,881 | $ | 5,430 | $ | 128,311 | |||||||
|
|
|
|
|
|
|
|||||||
13. OTHER LONG-TERM LIABILITIES
Other long-term liabilities primarily consist of asset retirement obligations, relating to leasehold improvements associated with land and a building at one of the Company’s facilities in the United Kingdom under lease until December 2021.
As a result of the C-MAC acquisition (note 4a), the Company initially recorded an asset retirement obligation of approximately $967. During the years ended November 30, 2014 and 2013 and the period from the March 22, 2012 acquisition of C-MAC to the year ended November 30, 2012, the Company recorded accretion expense of approximately $66, $63 and $42 and foreign exchange revaluation of ($47), $24 and $39, respectively.
Other long-term liabilities also includes $62 of deferred rent liabilities, relating to land and a building at one of the Company’s facilities in the United States under lease until November 2024.
14. REDEEMABLE PREFERRED STOCK
The Company, as of March 21, 2014, redeemed all 26,000 shares of its outstanding Series A Preferred Stock. The Company paid the holder of the Series A Preferred Stock an aggregate of $27,600 to effect the redemption. This resulted in a gain of $549, which is recorded in Other expenses (income) on the Consolidated Statement of Operations. Following the redemption, all shares of Series A Preferred Stock were cancelled and such shares were returned to authorized but undesignated shares of the Company’s preferred stock.
On March 22, 2012, following the acquisition of C-MAC Aerospace Limited (“C-MAC”), the Company entered into a Note Purchase Agreement by and among the Company and the purchaser referred to therein (the “Note Purchase Agreement”). Pursuant to the Note Purchase Agreement, the Company sold an aggregate initial principal amount of $26,000 of convertible subordinated notes (the “Note”) to a single purchaser in a private placement exempt from the registration requirements of the Securities Act of 1933, as amended. The Company received aggregate gross proceeds of $16,000 from the private placement, all of which will be used for working
F-29
Table of Contents
API Technologies Corp.
Notes to Consolidated Financial Statements
Dollar Amounts in Thousands, Except Per Share Data
capital purposes. The purchaser of the Note is an affiliate of Senator Investment Group LP. At the time of the issuance of the Note, the purchaser of the Note was the beneficial owner of approximately 10.7% of our outstanding common stock, without giving effect to the transactions contemplated by the Note Purchase Agreement.
Upon the filing of the amendment to the Charter and the Certificate of Designation (as described and defined below), the Note converted into 26,000 shares of Series A Mandatorily Redeemable Preferred Stock of API (“Series A Preferred Stock”). The holder had the option to convert all or any portion of the amount of the liquidation preference (“Liquidation Preference”) (initially $1,000 per share and $1,058 per share as of February 28, 2014) of the Series A Preferred Stock plus the amount of unpaid and accrued dividends into common stock of API at $6.00 per share.
On March 22, 2012, certain stockholders of the Company took action by written consent (the “Written Consent”), as permitted pursuant to the Company’s bylaws and Amended and Restated Certificate of Incorporation, as amended (the “Charter”), to amend the Charter to (i) increase the number of shares of common stock, par value $0.001 per share, issuable by the Company to 250,000,000 shares from 100,000,000 shares; and (ii) authorize the issuance by the Company’s Board of Directors, from time to time, of up to 10,000,000 shares of preferred stock, par value $0.001 per share (the “Preferred Stock”), in one or more series. The Written Consent also approved the issuance of shares of API common stock in connection with the conversion of the Note and Series A Preferred Stock as contemplated by the Note Purchase Agreement for all purposes, including pursuant to the rules and regulations of The NASDAQ Stock Market.
On March 22, 2012, subject to the effectiveness of the amendments to the Charter described above, the Company’s Board of Directors also authorized the creation of a class of Preferred Stock designated as “Series A Mandatorily Redeemable Preferred Stock” pursuant to a Certificate of Designation (the “Certificate of Designation”).
The Company received aggregate gross proceeds of $16,000 from the issuance of the Note. The Company recorded a debt discount of $10,000 representing the difference between the principal amount of the Note and the proceeds received. The Note contained embedded features for a default interest rate and make whole provisions. Accordingly, the Company evaluated these embedded features and recorded an additional debt discount in the amount of $588. The Company also recorded $2,272 of additional discount resulting from the beneficial conversion feature of the Notes. The total debt discount was amortized over the contracted life of the Notes using the effective interest method. Up to the date of conversion this resulted in interest expense of $218.
On May 16, 2012, the Company filed the amendments to the Charter and the Certificate of Designation with the Secretary of State of the State of Delaware, at which time they became effective. Pursuant to the Certificate of Designation, the Company is authorized to issue 1,000,000 shares of Series A Preferred Stock. As described above, the Note converted into 26,000 shares of Series A Preferred Stock.
Upon conversion of the Note, the remaining unamortized discount of $12,644 was recorded as interest expense and the $26,000 face value of the Note was recorded as Series A Preferred Stock.
The Series A Preferred Stock ranked, with respect to dividend rights, redemption rights and rights upon liquidation, dissolution or wind-up (i) senior to the common stock and each other class of capital stock or series of Preferred Stock established by the Board of Directors, the terms of which expressly provided that such class or series ranks junior to the Series A Preferred Stock; (ii) junior to all capital stock or series of Preferred Stock
F-30
Table of Contents
API Technologies Corp.
Notes to Consolidated Financial Statements
Dollar Amounts in Thousands, Except Per Share Data
established by the Board, the terms of which expressly provided that such class or series will rank senior to the Series A Preferred Stock; and (iii) on parity with all other classes of capital stock or series of Preferred Stock established by the Board of Directors, the terms of which expressly provided that such class or series will rank on parity with the Series A Preferred Stock.
The holders of Series A Preferred Stock were entitled to vote on all matters voted on by holders of the common stock, voting together as a single class with the other shares entitled to vote. The holders of Series A Preferred Stock had the right to cast the number of votes equal to the total number of votes which could be cast in such vote by a holder of the number of shares of common stock into which the shares of Series A Preferred Stock could be converted.
Commencing on March 22, 2013, holders of Series A Preferred Stock were entitled to receive cumulative dividends on the Liquidation Preference, computed on the basis of a 360-day year of twelve 30-day months at a rate equal to 6% per annum, compounded quarterly on the last day of each March, June, September and December. Accrued and unpaid dividends also would have had to been paid on the date of any redemption or on any liquidation, dissolution or winding-up of the Company. Dividends were paid in kind each quarter, by adding the amount of the accrued and unpaid dividend to the Liquidation Preference amount of each share of Series A Preferred Stock (the “Accreted Dividend Amount”). The Accreted Dividend Amount constituted part of the Liquidation Preference of each share of Series A Preferred Stock as of each applicable quarterly dividend payment date and dividends began to accrue on each Accreted Dividend Amount beginning on the date on which such amount was added to the Liquidation Preference amount of each share of Series A Preferred Stock. However, all dividends due and payable on the date that the Liquidation Preference of a share of Series A Preferred Stock became due and payable would have been payable in cash on such date. Upon an Early Redemption Event, dividends would accrue while such event was continuing at the rate equal to the rate for the most recently issued actively traded ten year U.S. Treasury security, plus 10.0%. An “Early Redemption Event” meant if (a) the Company (i) defaulted in its obligation to pay the amounts in connection with a redemption of the Series A Preferred Stock and such default continues unremedied for three business days; (ii) breached in material respect any of its representations or warranties contained in the Note Purchase Agreement, the Note or other document delivered in connection therewith; (iii) breached certain covenants under the Note Purchase Agreement or other document delivered in connection therewith (subject to applicable grace periods); (iv) defaulted (A) in any payment of any indebtedness in excess of $5,500 or (B) defaulted in the observance of any condition or agreement in respect of any such indebtedness, and as a consequence of such default, such indebtedness would become due and payable prior to its stated maturity; (v) commenced certain bankruptcy or similar proceedings or had a bankruptcy or similar proceeding commenced against it that was not dismissed within the applicable grace period; or (b) a material provision of the Note Purchase Agreement, the Note or other agreement delivered in connection therewith ceased to be effective.
The Series A Preferred Stock would have been convertible at any time at the discretion of the holders into that number of shares of common stock equal to the Liquidation Preference being converted (plus any accrued dividends that have not yet been accreted to the Liquidation Preference), divided by the initial conversion price of $6.00 per share, which initial conversion price was subject to adjustments as described below. In addition, upon a Change of Control (as defined in the Note Purchase Agreement), the sale of all or substantially all of the assets of the Company or the occurrence of certain dilution events (a “Mandatory Redemption Event”), then the holders of Series A Preferred Stock would have had the right to receive upon conversion, in lieu of the common stock otherwise issuable, such shares of stock, securities or other property as would have been issued or payable upon such Mandatory Redemption Event had the shares of Series A Preferred Stock been converted into common stock immediately prior to such Mandatory Redemption Event.
F-31
Table of Contents
API Technologies Corp.
Notes to Consolidated Financial Statements
Dollar Amounts in Thousands, Except Per Share Data
On or before March 22, 2019, all of the outstanding shares of Series A Preferred Stock were to be redeemed by the Company for the amount of the Liquidation Preference, plus any and all amounts owing to the holder of such redeemed shares pursuant to the terms of the Note Purchase Agreement, the Note or any other document delivered in connection therewith. The Company was required to offer to redeem all of the shares of Series A Preferred Stock upon a Mandatory Redemption Event. A holder of Series A Mandatorily Redeemable Preferred Stock could have accepted or rejected such offer of redemption.
15. INCOME TAXES
The geographical sources of loss from continuing operations before income taxes for the years ended November 30, 2014 and 2013, and 2012 were as follows:
| Year ended November 30, 2014 |
Year ended November 30, 2013 |
Year ended November 30, 2012 |
||||||||||
| Income (loss) before income taxes: |
||||||||||||
| United States |
$ | (19,065 | ) | $ | (29,550 | ) | $ | (155,954 | ) | |||
| Non-United States |
1,421 | 813 | 1,812 | |||||||||
|
|
|
|
|
|
|
|||||||
| Total |
$ | (17,644 | ) | $ | (28,737 | ) | $ | (154,142 | ) | |||
|
|
|
|
|
|
|
|||||||
The income tax expense (benefit) for continuing operations is summarized as follows:
| Year ended November 30, 2014 |
Year ended November 30, 2013 |
Year ended November 30, 2012 |
||||||||||
| Current: |
||||||||||||
| United States |
$ | 295 | $ | (6,441 | ) | $ | (2,105 | ) | ||||
| Non-United States |
307 | 274 | 146 | |||||||||
|
|
|
|
|
|
|
|||||||
| 602 | (6,167 | ) | (1,959 | ) | ||||||||
|
|
|
|
|
|
|
|||||||
| Deferred: |
||||||||||||
| United States |
319 | 617 | (3,445 | ) | ||||||||
| Non-United States |
349 | 215 | 97 | |||||||||
|
|
|
|
|
|
|
|||||||
| 668 | 832 | (3,348 | ) | |||||||||
|
|
|
|
|
|
|
|||||||
| Income tax expense (benefit) |
$ | 1,270 | $ | (5,335 | ) | $ | (5,307 | ) | ||||
|
|
|
|
|
|
|
|||||||
F-32
Table of Contents
API Technologies Corp.
Notes to Consolidated Financial Statements
Dollar Amounts in Thousands, Except Per Share Data
The consolidated effective tax benefit/(expense) rate (as a percentage of income (loss) before income taxes and cumulative effect of change in accounting principle) for continuing operations is reconciled to the U.S. federal statutory tax rate as follows:
| Year ended Nov. 30, 2014 |
Year ended Nov. 30, 2013 |
Year ended Nov. 30, 2012 |
||||||||||
| U.S. federal statutory tax rate |
34.0 | % | 34.0 | % | 34.0 | % | ||||||
| Non-deductible expenses |
(1.7 | ) | (0.6 | ) | (3.5 | ) | ||||||
| Effect of foreign tax rates |
0.5 | 0.2 | 0.1 | |||||||||
| State income taxes, net of federal tax effect |
8.0 | 7.3 | 2.0 | |||||||||
| Change in valuation allowance |
(44.2 | ) | (45.2 | ) | (9.0 | ) | ||||||
| Change in tax rates |
1.0 | 0.4 | 0.6 | |||||||||
| Share based compensation |
(3.7 | ) | — | — | ||||||||
| Utilization of continuing operations losses by discontinued operations |
— | 22.2 | — | |||||||||
| Impairment of goodwill |
— | — | (22.5 | ) | ||||||||
| Other |
(1.1 | ) | 0.3 | 1.7 | ||||||||
|
|
|
|
|
|
|
|||||||
| Effective tax rate benefit/(expense) |
(7.2 | )% | 18.6 | % | 3.4 | % | ||||||
|
|
|
|
|
|
|
|||||||
The components of deferred taxes are as follows as at November 30:
| 2014 | 2013 | |||||||
| Future income tax assets |
||||||||
| Loss carryforwards |
$ | 15,879 | $ | 16,728 | ||||
| Deferred Gain |
2,896 | — | ||||||
| Share based compensation |
918 | 1,652 | ||||||
| Inventory |
2,397 | 3,226 | ||||||
| Capital assets |
— | — | ||||||
| Accruals |
959 | 453 | ||||||
| Tax credits |
1,424 | 965 | ||||||
| Valuation Allowance |
(20,657 | ) | (12,271 | ) | ||||
|
|
|
|
|
|||||
| 3,816 | 10,753 | |||||||
|
|
|
|
|
|||||
| Future income tax liabilities |
||||||||
| Capital assets |
(2,577 | ) | (3,761 | ) | ||||
| Intangible assets |
(1,518 | ) | (6,816 | ) | ||||
| Deferred tax on unremitted earnings |
(521 | ) | — | |||||
| Deferred tax on export sales |
(2,944 | ) | (2,666 | ) | ||||
| Other |
— | (587 | ) | |||||
|
|
|
|
|
|||||
| (7,560 | ) | (13,830 | ) | |||||
|
|
|
|
|
|||||
| $ | (3,744 | ) | $ | (3,077 | ) | |||
|
|
|
|
|
|||||
| 2014 | 2013 | |||||||
| Balance sheet presentation |
||||||||
| Deferred income tax assets—current |
$ | 561 | $ | 2,426 | ||||
| Deferred income tax assets—long-term (in Other non-current assets) |
270 | 14 | ||||||
| Deferred income tax liability—current |
— | — | ||||||
| Deferred tax liabilities—long-term |
(4,575 | ) | (5,517 | ) | ||||
|
|
|
|
|
|||||
| Net deferred tax liabilities |
$ | (3,744 | ) | $ | (3,077 | ) | ||
|
|
|
|
|
|||||
F-33
Table of Contents
API Technologies Corp.
Notes to Consolidated Financial Statements
Dollar Amounts in Thousands, Except Per Share Data
The valuation allowance as of November 30, 2014, 2013 and 2012 totaled approximately $20,657, $12,271 and $16,051, respectively, which consisted principally of established reserves for deferred tax assets on carry forward losses from our entities in the United States of America and of foreign entities.
A valuation allowance is established when it is more likely than not that a portion of the deferred tax assets will not be realized. The valuation allowance is adjusted based on the changing facts and circumstances, such as the expected expiration of an operating loss carryforward. The total change in valuation allowance for the year ended November 30, 2014 was approximately $8,386, which primarily relates to the increase in deferred tax assets, partially offset by a utilization of loss carryforwards.
The Company and its subsidiaries have U.S. federal net operating loss carryforwards of approximately $24,723, to apply against future taxable income. These losses will expire as follows: $62, $68, $360, $396, $12, $23,408, $414, and $41 in 2024, 2025, 2028, 2029, 2030, 2032, 2033 and 2034, respectively. Due to recent acquisitions, these loss carryforwards, and other tax credits, may be subject to certain limitations.
The Company and its subsidiaries have state net operating loss carryforwards of approximately $115,714 to apply against future state taxable income. These losses will expire as follows: $56, $62, $68, $3,210, $3,591, $4,058, $18,704, $48,613, $22,579 and $14,774 in 2024, 2026, 2027, 2028, 2029, 2030, 2031, 2032, 2033 and 2034, respectively.
The Company and its subsidiaries have foreign net operating loss carryforwards of approximately $1,695 to apply against future taxable income. These losses will expire as follows: $122, $523, $6, $115, $11, $436 and $482 in 2028, 2029, 2030, 2031, 2032, 2033 and 2034, respectively.
With the exception of a deferred tax liability of $521 recorded on its German operations, the Company has not recorded deferred income taxes on the undistributed earnings of its foreign subsidiaries in fiscal 2014 because of management’s intent to indefinitely reinvest such earnings. At November 30, 2014 the aggregate undistributed earnings of the foreign subsidiaries amounted to $24,962. Upon distribution of these earnings in the form of dividends or otherwise, the Company may be subject to U.S. income taxes and foreign withholding taxes. It is not practical, however, to estimate the amount of taxes that may be payable on the eventual remittance of these earnings.
The Company has foreign investment credits of approximately $72 as of November 30, 2014 and $72 as of November 30, 2013. These credits expire as follows: $72 in 2018.
The Company and its subsidiaries have research and development credits of approximately $620, and $240 as of November 30, 2014, and November 30, 2013, respectively which expire in 2031 through 2033. The Company does not have any foreign tax credits as of November 30, 2014, and November 30, 2013.
The Company recognizes the financial statement benefit of a tax position only after determining that the relevant tax authority would more-likely-than-not sustain the position following an audit. For tax positions meeting the more-likely-than-not threshold, the amount recognized in the consolidated financial statements is the largest benefit that has a greater than fifty percent likelihood of being realized upon ultimate settlement with the relevant tax authority.
F-34
Table of Contents
API Technologies Corp.
Notes to Consolidated Financial Statements
Dollar Amounts in Thousands, Except Per Share Data
For the years ended November 30, 2014 and November 30, 2013, a reconciliation of beginning and ending unrecognized tax benefits is as follows:
| Balance at November 30, 2013 |
$ | 134 | ||
| Increases related to China transfer pricing matters |
113 | |||
| Decreases related to US state matters |
(23 | ) | ||
|
|
|
|||
| Balance at November 30, 2014 |
$ | 224 | ||
|
|
|
The Company’s unrecognized tax benefits relate to certain U.S. tax credits and state income tax matters, as well as Canadian tax and Chinese transfer pricing matters. As of November 30, 2014, the Company’s unrecognized tax benefits of approximately $224 would affect the Company’s effective tax rate if recognized.
The Company records interest and penalties related to tax matters within other expense on the accompanying Consolidated Statement of Operations. These amounts are not material to the consolidated financial statements for the periods presented. The Company’s U.S. tax returns are subject to examination by federal and state taxing authorities. Generally, tax years 2010-2014 remain open to examination by the Internal Revenue Service or other tax jurisdictions to which the Company is subject. The Company’s Canadian tax returns are subject to examination by federal and provincial taxing authorities in Canada. Generally, tax years 2010-2014 remain open to examination by the Canadian Customs and Revenue Agency or other tax jurisdictions to which the Company is subject.
16. SHAREHOLDERS’ EQUITY
On January 20, 2010 the Company agreed to issue 800,000 shares of API common stock payable as part of the compensation to Kuchera Defense Systems, Inc. (“KDS”), KII, Inc. (“KII”) and Kuchera Industries, LLC (“KI Industries” and collectively with KDS and KII, the “KGC Companies”) or their designees. 250,000 shares were issued and delivered at closing, 250,000 shares were to be issued and delivered on the first anniversary of the closing and 300,000 shares were to be issued and delivered on the second anniversary of the closing. The Company has issued 126,250 shares in escrow from the remaining 550,000 shares. Three API subsidiaries have claimed a right of set off against the escrowed shares under the asset purchase agreement with respect to claimed amounts due to the Company under the indemnification provisions of the asset purchase agreement. The unissued shares have been accounted for as common shares subscribed but not issued. In addition, on January 20, 2010 and January 22, 2010, we issued warrants to purchase an aggregate of 892,862 shares of common stock with an exercise price of $5.60 per share, which expired on January 20, 2015 and January 22, 2015.
In connection with the Plan of Arrangement that occurred on November 6, 2006, the Company was obligated to issue 2,354,505 shares of either API common stock or exchangeable shares of API Nanotronics Sub, Inc. in exchange for the API Electronics Group Corp. common shares previously outstanding. As of November 30, 2014, API is obligated to issue a remaining approximately 63,886 shares of its common stock under the Plan of Arrangement either directly for API common shares or in exchange for API Nanotronics Sub, Inc. exchangeable shares not held by API or its affiliates. There are 22,617 exchangeable shares outstanding (excluding exchangeable shares held by the Company) as of November 30, 2014. Exchangeable shares are substantially equivalent to our common shares.
On November 6, 2006, API amended its certificate of incorporation to allow it to issue one special voting share. This special voting share was issued to a trustee in connection with a Plan of Arrangement and allows the trustee to have at meetings of stockholders of API the number of votes equal to the number of exchangeable
F-35
Table of Contents
API Technologies Corp.
Notes to Consolidated Financial Statements
Dollar Amounts in Thousands, Except Per Share Data
shares not held by API or subsidiaries of API. (The trustee is charged with obtaining the direction of the holders of exchangeable shares on how to vote at meetings of API stockholders.) The API Nanotronics Sub, Inc. exchangeable shares are convertible into shares of API common stock at any time at the option of the holder. API may force the conversion of API Nanotronics Sub., Inc. exchangeable shares into shares of API common stock on the tenth anniversary of the date of the Plan of Arrangement or sooner upon the happening of certain events.
The Company issued 245,000, 15,000 and 1,340,477 options and RSUs during the years ended November 30, 2014, 2013 and November 30, 2012, respectively (Note 17).
17. STOCK-BASED COMPENSATION
On October 26, 2006, the Company adopted its 2006 Equity Incentive Plan (the “Equity Incentive Plan”), which was approved at the 2007 Annual Meeting of Stockholders of the Company. All the prior options issued by API were carried over to this plan under the provisions of the Plan of Arrangement. On October 22, 2009, the Company amended the Equity Incentive Plan to increase the number of shares of common stock under the plan from 1,250,000 to 2,125,000. On January 21, 2011, the Company amended the Equity Incentive Plan to further increase the number of shares of common stock under the plan from 2,125,000 to 5,875,000, and on June 3, 2011 amended the plan to permit the issuance of RSUs, which amendments were approved by the shareholders of the Company on November 4, 2011. Of the 5,875,000 shares authorized under the Equity Incentive Plan, 3,739,389 shares are available for issuance pursuant to options, RSUs, or stock as of November 30, 2014. Under the Company’s Equity Incentive Plan, incentive options and non-statutory options may have a term of up to ten years from the date of grant. The stock option exercise prices are equal to at least 100 percent of the fair market value of the underlying shares on the date the options are granted.
As of November 30, 2014 there was $275 of total unrecognized compensation related to non-vested stock options, which are not contingent upon attainment of certain milestones. For options with certain milestones necessary for vesting, the fair value is not calculated until the conditions become probable. The cost is expected to be recognized over the remaining periods of the options, which are expected to vest from 2014 to 2017.
During the years ended November 30, 2014, 2013 and 2012, ($16), $928, and $2,224, respectively, has been recognized as stock-based compensation expense in general and administrative expense.
The fair value of each option grant is estimated at the grant date using the Black-Scholes option-pricing model based on the assumptions detailed below:
| Year ended November 30, 2014 |
Year ended November 30, 2013 |
Year ended November 30, 2012 |
||||||||||
| Expected volatility |
70.2 | % | 81.9 | % | 89.5 | % | ||||||
| Expected dividends |
0 | % | 0 | % | 0 | % | ||||||
| Expected term |
6 years | 6 years | 6 years | |||||||||
| Risk-free rate |
1.58 | % | 0.85 | % | 0.91 | % | ||||||
F-36
Table of Contents
API Technologies Corp.
Notes to Consolidated Financial Statements
Dollar Amounts in Thousands, Except Per Share Data
The summary of the common stock options granted, cancelled, exchanged or exercised under the Plan:
| Shares | Weighted Average Exercise Price |
|||||||
| Share Options outstanding— November 30, 2011 |
1,919,591 | $ | 5.72 | |||||
| Less forfeited |
(526,985 | ) | $ | 5.02 | ||||
| Exercised |
— | $ | — | |||||
| Issued |
1,025,000 | $ | 3.51 | |||||
|
|
|
|||||||
| Share Options outstanding— November 30, 2012 |
2,417,606 | $ | 5.06 | |||||
| Less forfeited |
(569,121 | ) | $ | 5.26 | ||||
| Exercised |
— | $ | — | |||||
| Issued |
— | $ | — | |||||
|
|
|
|||||||
| Share Options outstanding—November 30, 2013 |
1,848,485 | $ | 4.98 | |||||
| Less forfeited |
(765,175 | ) | $ | 4.90 | ||||
| Exercised |
— | $ | — | |||||
| Issued |
245,000 | $ | 2.23 | |||||
|
|
|
|||||||
| Share Options outstanding—November 30, 2014 |
1,328,310 | $ | 4.52 | |||||
|
|
|
|||||||
| Share Options exercisable—November 30, 2014 |
931,136 | $ | 5.26 | |||||
|
|
|
|||||||
Restricted stock unit activity under the 2006 Equity Compensation Plan is presented below:
| Units | Weighted Average Grant Date Fair Value |
|||||||
| RSUs outstanding—November 30, 2011 |
51,000 | $ | 6.43 | |||||
| Issued |
315,477 | $ | 3.61 | |||||
| Exercised-Stock issued (a) |
(227,477 | ) | $ | 3.56 | ||||
|
|
|
|||||||
| RSUs outstanding—November 30, 2012 |
139,000 | $ | 4.43 | |||||
| Issued |
15,000 | $ | 2.56 | |||||
| Exercised-Stock issued |
(72,333 | ) | $ | 4.94 | ||||
|
|
|
|||||||
| RSUs outstanding—November 30, 2013 |
81,667 | $ | 3.72 | |||||
| Issued |
15,000 | $ | 2.37 | |||||
| Exercised-Stock issued |
(48,333 | ) | $ | 3.72 | ||||
|
|
|
|||||||
| RSUs outstanding —November 30, 2014 |
48,334 | $ | 3.30 | |||||
|
|
|
|||||||
| RSUs exercisable —November 30, 2014 |
— | $ | — | |||||
|
|
|
|||||||
| (a) | 190,477 of the RSUs issued during the year ended November 30, 2012 were fully vested on the issuance date. |
F-37
Table of Contents
API Technologies Corp.
Notes to Consolidated Financial Statements
Dollar Amounts in Thousands, Except Per Share Data
| RSUs and Options Outstanding |
RSUs and Options Exercisable | |||||||||||||||||||||||||||
| Range of Exercise Price |
Number of Outstanding at November 30, 2014 |
Weighted Average Exercise Price |
Weighted Average Remaining Life (Years) |
Aggregate Intrinsic Value |
Number Exercisable at November 30, 2014 |
Weighted Average Exercise Price |
Aggregate Intrinsic Value |
|||||||||||||||||||||
| $0.00 – $ 3.55 |
694,167 | $ | 2.83 | 7.89 | $ | 102 | 268,325 | $ | 3.54 | $ | — | |||||||||||||||||
| $3.56 – $ 4.99 |
27,084 | $ | 3.56 | 5.90 | $ | — | 21,668 | $ | 3.56 | $ | — | |||||||||||||||||
| $5.00 – $ 6.99 |
649,559 | $ | 5.95 | 5.84 | $ | — | 635,309 | $ | 5.97 | $ | — | |||||||||||||||||
| $7.00 – $20.00 |
5,834 | $ | 14.07 | 2.49 | $ | — | 5,834 | $ | 14.07 | $ | — | |||||||||||||||||
|
|
|
|
|
|
|
|
|
|||||||||||||||||||||
| 1,376,644 | 6.86 | $ | 102 | 931,136 | $ | — | ||||||||||||||||||||||
|
|
|
|
|
|
|
|
|
|||||||||||||||||||||
The intrinsic value is calculated as the excess of the market value as of November 30, 2014 over the exercise price of the shares. The market value as of November 30, 2014 was $2.11 as reported by the NASDAQ Stock Market.
18. SUPPLEMENTAL CASH FLOW INFORMATION
Supplemental cash flow information for the period ended:
| Year ended Nov. 30, 2014 |
Year ended Nov. 30, 2013 |
Year ended Nov. 30, 2012 |
||||||||||
| Supplemental Cash Flow Information |
||||||||||||
| Cash paid for income taxes |
$ | 835 | $ | 2,802 | $ | 759 | ||||||
| Cash paid for interest |
$ | 9,093 | $ | 13,488 | $ | 16,001 | ||||||
| Deferred gain on Sale/Leaseback (note 12d) |
$ | 8,383 | $ | — | $ | — | ||||||
| Capital lease obligation (note 12d) |
$ | 5,225 | $ | — | $ | — | ||||||
| Term loan issued in acquisition (note 4a) |
$ | — | $ | — | $ | 2,700 | ||||||
In February and May 2014, the Company received $1,414 and $402, respectively, related to tax refunds from the acquisition of one of its subsidiaries, SenDEC Corporation.
19. EARNINGS (LOSS) PER SHARE OF COMMON STOCK
The following table sets forth the computation of weighted-average shares outstanding for calculating basic and diluted earnings per share (EPS):
| Year ended November 30, |
Year ended November 30, |
Year ended November 30, |
||||||||||
| 2014 | 2013 | 2012 | ||||||||||
| Weighted average shares-basic |
55,448,862 | 55,405,764 | 55,314,263 | |||||||||
| Effect of dilutive securities |
* | * | * | |||||||||
|
|
|
|
|
|
|
|||||||
| Weighted average shares—diluted |
55,448,862 | 55,405,764 | 55,314,263 | |||||||||
|
|
|
|
|
|
|
|||||||
Basic EPS and diluted EPS for the years ended November 30, 2014, 2013 and 2012 have been computed by dividing the net income (loss) by the weighted average shares outstanding. The weighted average numbers of shares of common stock outstanding includes exchangeable shares and shares to be issued under the Plan of Arrangement.
F-38
Table of Contents
API Technologies Corp.
Notes to Consolidated Financial Statements
Dollar Amounts in Thousands, Except Per Share Data
| * | All outstanding options aggregating 1,376,644 (1,930,152 – 2013, 2,556,606—2012) incremental shares, and 892,862 warrants have been excluded from the November 30, 2014, 2013 and 2012 computation of diluted EPS, respectively, as they are anti-dilutive due to the losses generated in each respective year. |
20. COMMITMENTS AND CONTINGENCIES
| (a) | Rent |
The following is a schedule by years of approximate future minimum rental payments under operating leases that have remaining non-cancelable lease terms in excess of one year as of November 30, 2014.
| 2015 |
$ | 4,116 | ||
| 2016 |
4,355 | |||
| 2017 |
3,917 | |||
| 2018 |
4,008 | |||
| 2019 |
3,689 | |||
| Thereafter |
19,993 | |||
|
|
|
|||
| Total |
$ | 40,078 | ||
|
|
|
The preceding data reflects existing leases at November 30, 2014, and does not include replacement upon the expiration. In the normal course of business, operating leases are normally renewed or replaced by other leases. Rent expense amounted to $3,919 and $3,919 for the years ended November 30, 2014 and 2013, respectively.
| b) | On September 15, 2011, Currency, Inc., KII Inc., Kuchera Industries, LLC, William Kuchera and Ronald Kuchera (the “Plaintiffs”) filed a lawsuit against API and three API subsidiaries (the “API Pennsylvania Subsidiaries”) in the Court of Chancery of the State of Delaware in relation to the Asset Purchase Agreement by and among API, the API Pennsylvania Subsidiaries, the KGC Companies, William Kuchera, and Ronald Kuchera dated January 20, 2010. Plaintiffs’ complaint alleges claims for breach of contract and unjust enrichment based on their contention that API and the API Pennsylvania Subsidiaries violated the Agreement by failing to issue certain shares of stock to Plaintiffs and by failing to cooperate with Plaintiffs in the filing of a final general and administrative overhead rate with the Defense Contracting Audit Agency. API and the API Pennsylvania Subsidiaries filed an answer to the complaint denying all liability and a counterclaim for breach of contract against Plaintiffs. The final outcome and impact of this matter is subject to many variables, and cannot be predicted. Of the 550,000 shares that have not been delivered under the Asset Purchase Agreement, 126,250 were placed in escrow and the remaining 423,750 shares have been accounted for as common shares subscribed but not issued with a value of $2,373. |
| c) | The Company is also a party to lawsuits in the normal course of its business. Litigation can be unforeseeable, expensive, lengthy and disruptive to normal business operations. Moreover, the results of complex legal proceedings are difficult to predict. An unfavorable resolution of a particular lawsuit could have a material adverse effect on the Company’s business, operating results, or financial condition. |
In accordance with required guidance, the Company accrues for litigation matters when losses become probable and reasonably estimable. The Company has no recorded accrual relating to its outstanding legal matters as of November 30, 2014 (November 30, 2013—$0). As of the end of each applicable reporting period,
F-39
Table of Contents
API Technologies Corp.
Notes to Consolidated Financial Statements
Dollar Amounts in Thousands, Except Per Share Data
or more frequently, as necessary, the Company reviews each outstanding matter and, where it is probable that a liability has been incurred, it accrues for all probable and reasonably estimable losses. Where the Company is able to reasonably estimate a range of losses with respect to such a matter, it records an accrual for the amount within the range that constitutes its best estimate. If the Company can reasonably estimate a range but no amount within the range appears to be a better estimate than any other, it will use the amount that is the low end of such range. Because of the uncertainty, the complexity and the many variables involved in litigation, the actual costs to the Company with respect to its legal matters may differ from our estimates, could result in a significant difference and could have a material adverse effect on the Company’s financial position, liquidity, or results of operations. If we determine that an additional loss in excess of our accrual is probable but not estimable, the Company will provide disclosure to that effect. The Company expenses legal costs as they are incurred.
21. RESTRUCTURING CHARGES RELATED TO CONSOLIDATION OF OPERATIONS
In accordance with accounting guidance for costs associated with asset exit or disposal activities, restructuring costs are recorded as incurred. Restructuring charges for employee workforce reductions are recorded upon employee notification.
a) Ottawa restructuring
In November 2013, the Company commenced the restructuring of its Ottawa, Ontario, Canada business (“Ottawa restructuring”), which included the movement of certain operations to its State College facility, in order to improve its profitability. The actions taken as part of the Ottawa restructuring are intended to realize synergies from our combined SSC operations, contain costs and streamline our operations. Elements of the Ottawa restructuring include management re-alignment, workforce reductions and write-downs and charges related to inventory and relocation costs. The Ottawa restructuring was substantially completed by May 31, 2014. As a result of the Ottawa restructuring, the Company reduced its SSC workforce by approximately 4%, which represents approximately 3% of its global workforce.
The Company has recorded $2,047 of cumulative salary and related charges for the Ottawa restructuring in fiscal 2014 and 2013. As at November 30, 2014, $230 is included in accounts payable and accrued liabilities.
b) EMS restructuring
In June 2012, the Company announced the restructuring of its EMS business (“EMS restructuring”) in order to improve its profitability. The actions taken as part of the EMS restructuring are intended to realize synergies from our combined EMS operations, contain costs, reduce our exposure to low margin and unprofitable revenue streams within the EMS businesses, and streamline our operations. Elements of the EMS restructuring include management re-alignment, workforce reductions and write-downs and charges related to inventory, fixed assets, and long-term leases. The EMS restructuring was substantially completed by the end of fiscal 2012. As of November 30, 2012, the Company reduced its EMS workforce by approximately 10%, which represented approximately 2% of its global workforce.
During the period ending November 30, 2012, the Company incurred approximately $591 related to cash outlays, primarily due to employee separation expense. The majority of the non-cash charges are primarily related to the write-down of inventory related to the EMS product offerings, leasehold impairments and fixed asset impairments.
F-40
Table of Contents
API Technologies Corp.
Notes to Consolidated Financial Statements
Dollar Amounts in Thousands, Except Per Share Data
The following table summarizes the charges related to EMS restructuring activities by type of cost as of November 30, 2014:
| EMS Restructuring |
||||
| Salary and related charges |
$ | 591 | ||
| Inventory write-down |
7,401 | |||
| Fixed asset impairment |
865 | |||
| Lease impairment |
3,672 | |||
|
|
|
|||
| Accumulated restructuring charges at November 30, 2012 |
12,529 | |||
| Cash payments |
(591 | ) | ||
| Non-cash charges |
(9,902 | ) | ||
|
|
|
|||
| Balance-Lease impairment accrual, November 30, 2014 |
$ | 2,036 | ||
|
|
|
|||
c) 2010 restructuring
In 2010, the Company started a restructuring plan (“2010 Restructuring Plan”) to streamline operations. During the years ended November 30, 2014 and 2013 restructuring expenses included legal charges, and workforce reductions and other expenses related to consolidating certain operations to its State College, P.A. facility and consolidating certain parts of its C-MAC operations. During the year ended November 30, 2012 restructuring expenses included charges of approximately i) $2,736 related to workforce reductions and other expenses related to consolidating certain parts of its microwave operations from Palm Bay, Florida to its owned facility in State College, P.A., consolidating certain parts of its operations in its leased facilities in Windber, P.A and Sterling, VA, and workforce reductions and other expenses in the United Kingdom, and ii) $2,437 related to workforce reductions and other expenses related to consolidating certain parts of its C-MAC operations. Management continues to evaluate whether other related assets have been impaired, and has concluded that there should be no additional impairment charges as of November 30, 2014.
For the years ended November 30, 2014, 2013 and 2012, the following table represents the details of restructuring charges with respect to the 2010 Restructuring Plan:
| Year ended Nov. 30, 2014 |
Year ended Nov. 30, 2013 |
Year ended Nov. 30, 2012 |
||||||||||
| Opening balance |
$ | — | $ | 210 | $ | 780 | ||||||
| Restructuring charges |
1,460 | 1,327 | 5,173 | |||||||||
|
|
|
|
|
|
|
|||||||
| Accumulated restructuring charges |
1,460 | 1,537 | 5,953 | |||||||||
| Cash payments |
(1,460 | ) | (1,537 | ) | (5,743 | ) | ||||||
| Non-cash charges |
— | — | — | |||||||||
|
|
|
|
|
|
|
|||||||
| Ending Balance |
$ | — | $ | — | $ | 210 | ||||||
|
|
|
|
|
|
|
|||||||
22. SEGMENT INFORMATION AND GEOGRAPHICAL DATA
The Company follows the authoritative guidance on the required disclosures for segments which establish standards for the way that public business enterprises report information about operating segments in annual financial statements and requires that those enterprises report selected information about operating segments in financial reports. The guidance also establishes standards for related disclosures about products, geographic areas and major customers.
F-41
Table of Contents
API Technologies Corp.
Notes to Consolidated Financial Statements
Dollar Amounts in Thousands, Except Per Share Data
The authoritative accounting guidance uses a management approach for determining segments. The management approach designates the internal organization that is used by management for making operating decisions and assessing performance as the source of the Company’s reportable segments. The Company’s operations are conducted in three principal business segments: Systems, Subsystems & Components (SSC), Secure Systems & Information Assurance (SSIA) and Electronic Manufacturing Services (EMS). Inter-segment sales are presented at their market value for disclosure purposes. Corporate includes general and administrative functions and unallocated costs of our shared service operations/management, administrative and other shared corporate services functions such as information technology, legal, finance, human resources, and marketing. These administrative and other shared services costs have been allocated in the adjusted EBITDA measure based on a percent of revenue for each respective operating segment.
During the quarter ended February 28, 2014, the Company changed its reported basis of measurement of segment profit or loss. This change in reporting has been applied to the years ended November 30, 2014, 2013 and 2012. The Company’s chief operating decision maker evaluates segment performance based primarily on revenues and Adjusted EBITDA. The accounting policies of each of the operating segments are the same as those described in the summary of significant accounting policies in Note 2. Adjusted EBITDA represents income from continuing operations excluding depreciation and amortization, stock-based compensation expense and other items as described below. Management views adjusted EBITDA as an important measure of segment performance because it removes from operating results the impact of items that management believes do not reflect the Company’s core operating performance. Adjusted EBITDA is a measure which is also used in calculating financial ratios in material debt covenants in the Company’s credit facilities.
Management does not evaluate the performance of its operating segments using asset measures. The identifiable assets by segment disclosed in this note are those assets specifically identifiable within each segment and include cash, accounts receivable, inventory, goodwill and intangible assets.
| Year ended November 30, 2014 |
SSC | SSIA | EMS | Corporate | Inter Segment Eliminations |
Total | ||||||||||||||||||
| Revenue from external customers |
$ | 162,454 | $ | 21,999 | $ | 42,404 | $ | — | $ | — | $ | 226,857 | ||||||||||||
|
|
|
|
|
|
|
|
|
|
|
|
|
|||||||||||||
| Adjusted EBITDA: |
22,372 | 3,614 | (245 | ) | — | — | 25,741 | |||||||||||||||||
| Acquisition related charges |
479 | |||||||||||||||||||||||
| Restructuring |
2,217 | |||||||||||||||||||||||
| Depreciation and amortization |
15,965 | |||||||||||||||||||||||
| Interest expense, net |
11,765 | |||||||||||||||||||||||
| Amortization of note discounts and deferred financing costs |
10,940 | |||||||||||||||||||||||
| Other adjustments * |
2,019 | |||||||||||||||||||||||
|
|
|
|||||||||||||||||||||||
| Loss from continuing operations before income taxes |
$ | (17,644 | ) | |||||||||||||||||||||
|
|
|
|||||||||||||||||||||||
| Segment assets—as at November 30, 2014 |
$ | 241,246 | $ | 13,183 | $ | 24,235 | $ | 4,176 | $ | — | $ | 282,840 | ||||||||||||
| Goodwill included in assets—as at |
$ | 114,301 | $ | — | $ | 2,469 | $ | — | $ | — | $ | 116,770 | ||||||||||||
| Purchase of fixed assets, to |
$ | 2,126 | $ | 285 | $ | 306 | $ | 16 | $ | — | $ | 2,733 | ||||||||||||
F-42
Table of Contents
API Technologies Corp.
Notes to Consolidated Financial Statements
Dollar Amounts in Thousands, Except Per Share Data
| * | Other adjustments primarily include inventory provisions, stock based compensation, franchise taxes, financing and other adjustments, lease payments for the State College, Pennsylvania facility and foreign exchange loss and change in benefit liability. |
| Year ended November 30, 2013 |
SSC | SSIA | EMS | Corporate | Inter Segment Eliminations |
Total | ||||||||||||||||||
| Revenue from external customers |
$ | 170,685 | $ | 18,300 | $ | 55,315 | $ | — | $ | — | $ | 244,300 | ||||||||||||
|
|
|
|
|
|
|
|
|
|
|
|
|
|||||||||||||
| Adjusted EBITDA: |
22,601 | 4,064 | 467 | — | — | 27,132 | ||||||||||||||||||
| Acquisition related charges |
849 | |||||||||||||||||||||||
| Restructuring |
2,617 | |||||||||||||||||||||||
| Depreciation and amortization |
17,130 | |||||||||||||||||||||||
| Interest expense, net |
14,208 | |||||||||||||||||||||||
| Amortization of note discounts and deferred financing costs |
13,020 | |||||||||||||||||||||||
| Other adjustments * |
8,045 | |||||||||||||||||||||||
|
|
|
|||||||||||||||||||||||
| Loss from continuing operations before income taxes |
$ | (28,737 | ) | |||||||||||||||||||||
|
|
|
|||||||||||||||||||||||
| Segment assets—as at November 30, 2013 |
$ | 249,363 | $ | 15,068 | $ | 34,741 | $ | 5,406 | $ | — | $ | 304,578 | ||||||||||||
| Goodwill included in assets—as at |
$ | 114,301 | $ | — | $ | 2,469 | $ | — | $ | — | $ | 116,770 | ||||||||||||
| Purchase of fixed assets, to |
$ | 2,042 | $ | 64 | $ | 363 | $ | 4 | $ | — | $ | 2,473 | ||||||||||||
| * | Other adjustments primarily include inventory provisions, stock based compensation, franchise taxes, financing and other adjustments, foreign exchange loss and reversal of contingency accrual. |
| Year ended November 30, 2012 |
SSC | SSIA | EMS | Corporate | Inter Segment Eliminations |
Total | ||||||||||||||||||
| Revenue from external customers |
$ | 160,579 | $ | 22,502 | $ | 59,300 | $ | — | $ | — | $ | 242,381 | ||||||||||||
|
|
|
|
|
|
|
|
|
|
|
|
|
|||||||||||||
| Adjusted EBITDA: |
27,822 | 4,488 | (508 | ) | — | — | 31,802 | |||||||||||||||||
| Acquisition related charges |
4,027 | |||||||||||||||||||||||
| Restructuring |
17,079 | |||||||||||||||||||||||
| Depreciation and amortization |
16,945 | |||||||||||||||||||||||
| Interest expense, net |
16,209 | |||||||||||||||||||||||
| Amortization of note discounts and deferred financing costs |
15,684 | |||||||||||||||||||||||
| Goodwill Impairment |
107,495 | |||||||||||||||||||||||
| Other adjustments * |
8,505 | |||||||||||||||||||||||
|
|
|
|||||||||||||||||||||||
| Loss from continuing operations before income taxes |
$ | (154,142 | ) | |||||||||||||||||||||
|
|
|
|||||||||||||||||||||||
| Segment assets—as at November 30, 2012 |
$ | 317,791 | $ | 13,496 | $ | 52,589 | $ | 8,839 | $ | — | $ | 392,715 | ||||||||||||
| Goodwill included in assets—as at |
$ | 114,301 | $ | — | $ | 2,469 | $ | — | $ | — | $ | 116,770 | ||||||||||||
| Purchase of fixed assets, to |
$ | 1,014 | $ | 19 | $ | 106 | $ | — | $ | — | $ | 1,139 | ||||||||||||
F-43
Table of Contents
API Technologies Corp.
Notes to Consolidated Financial Statements
Dollar Amounts in Thousands, Except Per Share Data
| * | Other adjustments primarily include inventory provisions, stock based compensation, financing and other adjustments, foreign exchange loss, impairment write-down on assets held for sale, SenDEC earn-out reversal and C-MAC pro-forma. |
The Company has operations in the United States, United Kingdom, Canada, Mexico, China and Germany. Revenues are attributed to geographic regions based upon the location of the customer. The geographic distribution of sales is as follows:
| Year ended November 30, 2014 |
Year ended November 30, 2013 |
Year ended November 30, 2012 |
||||||||||
| Revenues |
||||||||||||
| United States |
$ | 155,476 | $ | 177,057 | $ | 185,564 | ||||||
| United Kingdom |
25,229 | 23,503 | 22,832 | |||||||||
| Canada |
9,772 | 9,188 | 9,286 | |||||||||
| China |
5,833 | 3,834 | 7,257 | |||||||||
| Germany |
4,367 | 5,002 | 4,067 | |||||||||
| All other countries |
26,180 | 25,716 | 13,375 | |||||||||
|
|
|
|
|
|
|
|||||||
| Total |
$ | 226,857 | $ | 244,300 | $ | 242,381 | ||||||
|
|
|
|
|
|
|
|||||||
The geographic distribution of long-lived assets is as follows at November 30:
| 2014 | 2013 | |||||||
| Long-lived assets |
||||||||
| United States |
$ | 20,880 | $ | 25,369 | ||||
| United Kingdom |
8,300 | 9,121 | ||||||
| Canada |
901 | 452 | ||||||
| Mexico |
30 | 29 | ||||||
| China |
453 | 398 | ||||||
| Germany |
10 | 12 | ||||||
|
|
|
|
|
|||||
| Total |
$ | 30,574 | $ | 35,381 | ||||
|
|
|
|
|
|||||
23. 401(K) PLAN
The Company has adopted a 401(k) deferred compensation arrangement. Under the provision of the plan, the Company was required to match 50% of the first 5% deferred contributions for certain employee contributions. The employer match was suspended effective March 11, 2013 and was reinstated effective April 2014.
Employees may contribute up to a maximum of 100% of eligible compensation. During the years ended November 30, 2014 and 2013, the Company incurred $189 and $297, respectively, as its obligation under the terms of the plan, charged to general and administrative expense.
F-44
Table of Contents
API Technologies Corp.
Notes to Consolidated Financial Statements
Dollar Amounts in Thousands, Except Per Share Data
24. INTERIM FINANCIAL INFORMATION (UNAUDITED)
The following is a summary of the Company’s selected quarterly financial data for the years ended November 30, 2014, 2013 and 2012:
| Three months ended | Year ended Nov. 30, 2014 |
|||||||||||||||||||
| Feb. 28, 2014 | May 31, 2014 | Aug. 31, 2014 | Nov. 30, 2014 | |||||||||||||||||
| Revenues |
$ | 58,918 | $ | 53,169 | $ | 56,924 | $ | 57,846 | $ | 226,857 | ||||||||||
| Operating expenses |
11,778 | 12,340 | 12,076 | 11,318 | 47,512 | |||||||||||||||
|
|
|
|
|
|
|
|
|
|
|
|||||||||||
| Operating income (loss) |
1,567 | (1,930 | ) | 2,733 | 2,214 | 4,584 | ||||||||||||||
|
|
|
|
|
|
|
|
|
|
|
|||||||||||
| Net income (loss) |
$ | (2,124 | ) | $ | (14,984 | ) | $ | (634 | ) | $ | (1,172 | ) | $ | (18,914 | ) | |||||
|
|
|
|
|
|
|
|
|
|
|
|||||||||||
| Basic earnings (loss) per share |
$ | (0.05 | ) | $ | (0.27 | ) | $ | (0.01 | ) | $ | (0.02 | ) | $ | (0.35 | ) | |||||
|
|
|
|
|
|
|
|
|
|
|
|||||||||||
| Diluted earnings (loss) per share |
$ | (0.05 | ) | $ | (0.27 | ) | $ | (0.01 | ) | $ | (0.02 | ) | $ | (0.35 | ) | |||||
|
|
|
|
|
|
|
|
|
|
|
|||||||||||
| Three months ended | Year ended Nov. 30, 2013 |
|||||||||||||||||||
| Feb. 28, 2013 | May 31, 2013 | Aug. 31, 2013 | Nov. 30, 2013 | |||||||||||||||||
| Revenues |
$ | 58,304 | $ | 64,229 | $ | 62,630 | $ | 59,137 | $ | 244,300 | ||||||||||
| Operating expenses |
13,334 | 13,520 | 12,659 | 12,626 | 52,139 | |||||||||||||||
|
|
|
|
|
|
|
|
|
|
|
|||||||||||
| Operating income (loss) |
(1,281 | ) | 1,097 | 2,315 | (3,654 | ) | (1,523 | ) | ||||||||||||
|
|
|
|
|
|
|
|
|
|
|
|||||||||||
| Net income (loss) |
$ | (14,426 | ) | $ | 7,473 | $ | 6,968 | $ | (7,243 | ) | $ | (7,228 | ) | |||||||
|
|
|
|
|
|
|
|
|
|
|
|||||||||||
| Basic earnings (loss) per share |
$ | (0.26 | ) | $ | 0.13 | $ | 0.12 | $ | (0.14 | ) | $ | (0.15 | ) | |||||||
|
|
|
|
|
|
|
|
|
|
|
|||||||||||
| Diluted earnings (loss) per share |
$ | (0.26 | ) | $ | 0.13 | $ | 0.12 | $ | (0.14 | ) | $ | (0.15 | ) | |||||||
|
|
|
|
|
|
|
|
|
|
|
|||||||||||
| Three months ended | Year ended Nov. 30, 2012 |
|||||||||||||||||||
| Feb. 28, 2012 | May 31, 2012 | Aug. 31, 2012 | Nov. 30, 2012 | |||||||||||||||||
| Revenues |
$ | 61,984 | $ | 68,270 | $ | 58,759 | $ | 53,368 | $ | 242,381 | ||||||||||
| Operating expenses |
12,422 | 105,076 | 34,498 | 15,870 | 167,866 | |||||||||||||||
|
|
|
|
|
|
|
|
|
|
|
|||||||||||
| Operating income (loss) |
3,128 | (97,779 | ) | (21,647 | ) | (5,138 | ) | (121,436 | ) | |||||||||||
|
|
|
|
|
|
|
|
|
|
|
|||||||||||
| Net income (loss) |
$ | 773 | $ | (109,507 | ) | $ | (27,666 | ) | $ | (12,303 | ) | $ | (148,703 | ) | ||||||
|
|
|
|
|
|
|
|
|
|
|
|||||||||||
| Basic earnings (loss) per share |
$ | 0.01 | $ | (1.98 | ) | $ | (0.50 | ) | $ | (0.22 | ) | $ | (2.69 | ) | ||||||
|
|
|
|
|
|
|
|
|
|
|
|||||||||||
| Diluted earnings (loss) per share |
$ | 0.01 | $ | (1.98 | ) | $ | (0.50 | ) | $ | (0.22 | ) | $ | (2.69 | ) | ||||||
|
|
|
|
|
|
|
|
|
|
|
|||||||||||
F-45
Table of Contents
SCHEDULE II—VALUATION AND QUALIFYING ACCOUNTS
(Amounts in thousands)
| Year ended Nov. 30, 2014 |
Year ended Nov. 30, 2013 |
Year ended Nov. 30, 2012 |
||||||||||
| Allowance for doubtful accounts |
||||||||||||
| Balance beginning of period |
$ | 697 | $ | 609 | $ | 474 | ||||||
| Charged to costs and expenses |
115 | 302 | (145 | ) | ||||||||
| Charged to other accounts (1) |
— | — | 280 | |||||||||
| Deductions (2) |
(96 | ) | (214 | ) | — | |||||||
|
|
|
|
|
|
|
|||||||
| Balance at end of period |
$ | 716 | $ | 697 | $ | 609 | ||||||
| Inventory obsolescence reserve |
||||||||||||
| Balance beginning of period |
$ | 12,571 | $ | 7,822 | $ | 9,731 | ||||||
| Charged to costs and expenses |
2,020 | 4,970 | 9,281 | |||||||||
| Charged to other accounts (1) |
— | — | 4,667 | |||||||||
| Deductions (3) |
(5,601 | ) | (221 | ) | (15,857 | ) | ||||||
|
|
|
|
|
|
|
|||||||
| Balance at end of period |
$ | 8,990 | $ | 12,571 | $ | 7,822 | ||||||
| (1) | Provision primarily as a result of business acquisitions. |
| (2) | Uncollectible accounts written off, net of recoveries. |
| (3) | Obsolete inventory written off, net of recoveries. |
F-46