Attached files
| file | filename |
|---|---|
| 8-K - FORM 8-K - Bristow Group Inc | d8k.htm |
 Fourth Quarter FY 2011
Earnings Presentation
Bristow Group Inc.
May 11, 2011
Exhibit 99.1 |
 Fourth quarter earnings call agenda
Introduction
(Linda
McNeill,
Investor
Relations
Manager)
CEO
remarks
(Bill
Chiles,
President
and
CEO)
Financial
discussion
(Jonathan
Baliff,
SVP
and
CFO)
Operational
highlights
(Bill
Chiles,
President
and
CEO)
Questions and answers
2 |
 Forward-looking statements
3
This presentation may contain “forward-looking statements” within the meaning of the
Private Securities Litigation Reform Act of 1995. Forward-looking statements include
statements about our future business, operations, capital expenditures, fleet composition,
capabilities and results; modeling information, earnings guidance, expected operating margins
and other financial projections; future dividends; plans, strategies and objectives of our
management, including our plans and strategies to grow earnings and our business, our general
strategy going forward and our business model; expected actions by us and by third parties, including
our customers, competitors and regulators; our use of excess cash; the valuation of our company and
its valuation relative to relevant financial indices; assumptions underlying or relating to any
of the foregoing, including assumptions regarding factors impacting our business, financial
results and industry; and other matter Our forward-looking statements reflect our views and
assumptions on the date of this presentation regarding future events and operating performance.
They involve known and unknown risks, uncertainties and other factors, many of which may be
beyond our control, that may cause actual results to differ materially from any future results,
performance or achievements expressed or implied by the forward-looking statements. These
risks, uncertainties and other factors include those discussed under the captions “Risk
Factors” and “Management’s Discussion and Analysis of Financial Condition and
Results of Operations” in our Annual Report on Form 10-K for the fiscal year ended
March 31, 2010 and our Quarterly Reports on Form 10-Q for the quarters ended June 30,
September 30 and December 31, 2010. We do not undertake any obligation, other than as
required by law, to update or revise any forward-looking statements, whether as a result of new
information, future events or otherwise.
|
 Chief Executive comments
Bill
Chiles,
President
and
CEO
4 |
 Aviation Support Services KPI History
* Includes commercial operations only
5 |
 Q4
and FY2011 highlights 6
•
Bristow delivered to shareholders in FY2011:
•
Second half performance was stronger than the first half with increased levels of
activity, aircraft sales, pricing in Europe and earnings from our
unconsolidated affiliate in Brazil
•
Our cost of capital was significantly lowered with refinancings and a corporate
reorganization •
A new capital allocation framework was introduced culminating in
the announcement of the initiation
of a quarterly dividend of $0.15
•
Earnings per share guidance will also commence with a FY 2012 range of $3.55 to
$3.90 •
Q4 Revenue of $310M (10% increase from Q4 FY2010,
2% decrease from Q3 FY2011)
•
Q4 EPS, excluding special items, of $1.00 (37% increase
from Q4 FY2010, 41% increase from Q3 FY2011)
•
Q4 GAAP EPS of $0.84 (8% increase from Q4 FY2010,
26% decrease from Q3 FY2011)
•
Q4 Operating income of $50M (16% increase from Q4
FY2010, 7% increase from Q3 FY2011)
•
Q4 EBITDA of $77M (30% increase from Q4 FY2010,
18% increase from Q3 FY2011)
•
FY 2011 Revenue of $1.233B (6% increase from FY2010)
•
FY 2011 EPS, excluding special items, of $3.30 (9% increase from
FY2010)
•
FY 2011 GAAP EPS of $3.60 (16% increase from FY2010)
•
FY 2011 Operating income of $190M (5% increase from FY2010)
•
FY 2011 EBITDA of $277M (7% increase from FY2010) |
 •
Oil prices have fallen from highs but still relatively strong. Lower prices
create a more sustainable economic recovery
•
Overall international Exploration & Production (E&P) capital expenditures
and operating expenditures continue to grow
•
The modest growth in 2010, has led to solid recovery so far in calendar
year 2011 with signals of faster expansion in 2012 and 2013
•
Balanced across non-U.S. geographies, with Brazil and Australia looking
particularly promising
•
Although U.S. ops were challenging in early 2011, recovery is discernable
•
This E&P confidence is reflected in improved helicopter tender activity,
principally for FY 2012/2013 work
•
Aircraft sales for our helicopters improved significantly this quarter
Current market environment
7 |
 Q4
2011 YOY Operational performance highlights Europe
Revenue
and
operating
margin
is
higher
year
over
year
due
to
new
customers,
increased
activity and cost management.
West Africa
Revenue rose because of new contracts and rate escalations on existing contracts
and reduced number of aircraft maintenance delays. However, operating
margin is lower due to a high level of maintenance and freight costs in the
quarter. Australia
Revenue
increased
significantly
from
new
contracts
and
favorable
exchange
rates; higher
compensation costs and non-recurring costs drove operating margin lower.
However, sequentially better versus the third quarter.
Other International
Revenue benefited from new contracts in the Baltic Sea and Suriname and higher
activity in Brazil, Trinidad and Russia. Operating income improved
significantly due to strong performance by Lider in Brazil.
North America
Lower revenue and profitability due to poor weather in February and end of support
work for BP. A few drilling permits were issued in Q4. Activity
has started to pick up very recently. 8 |
 Financial discussion
Jonathan
Baliff,
SVP
and
CFO
9 |
 Financial highlights –
Earnings per share summary
4Q FY10 to 4Q FY11 bridge
FY10 to FY11 bridge
10 |
 Financial highlights –
EBITDA summary
4Q FY10 to 4Q FY11 bridge
11
FY10 to FY11 bridge |
 Reconciliation of special items
Fourth Quarter FY 2011 & Full Year FY 2011
12
See the reconciliation of special items for the Fourth Quarter FY 2010 & Full
Year FY 2010, and the footnotes to this table included in the appendix to this
presentation. March 2011 Quarter
Operating
Income
EBITDA
Net
Income
Diluted
Earnings
Per
Share
(Unaudited)
(In thousands, except per share amounts)
Adjusted for special items...............
$
56,653
$
79,905
$
37,001
$
1.00
Impairment of IT system
(1)
...........
(5,306)
—
(3,449)
(0.09)
Held for sale aircraft
impairment
(2)
............................
(1,500)
—
(1,095)
(0.03)
Impairment of investment in
affiliate
(3)
....................................
—
(2,445)
(1,589)
(0.04)
As reported.....................................
$
49,847
$
77,460
$
30,868
0.84
Fiscal Year Ended
March 31, 2011
Operating
Income
EBITDA
Net
Income
Diluted
Earnings
Per
Share
(Unaudited)
(In thousands, except per share amounts)
Adjusted for special items...............
$
193,030
$
278,708
$
121,285
$
3.30
Impairment of IT system
(1)
...........
(5,306)
—
(3,449)
(0.09)
Held for sale aircraft
impairment
(2)
.............................
(1,500)
—
(1,095)
(0.03)
Impairment of investment in
affiliate
(3)
....................................
—
(2,445)
(1,589)
(0.04)
Power-by-the-hour credit
(4)
..........
3,500
3,500
2,520
0.07
Retirement of 6 1/8% Senior
Notes
(5)
.......................................
—
(2,300)
(3,055)
(0.08)
Income tax items
(6)
.....................
—
—
17,698
0.48
As reported....................................
$
189,724
$
277,463
$
132,315
3.60 |
 Quarterly dividend initiation
13
•
On May 4, 2011, the Board of Directors of Bristow declared a first quarter cash
dividend of $0.15 per share of our common stock.
•
The dividend will be paid on June 10, 2011 to stockholders of record on May 20,
2011; approximately $5.4 million payment expected.
•
If held at this level and paid quarterly (subject to quarterly Board approval), we
expect the dividend to yield 1.4% annually based on a $43.81 stock
price. •
We are confident in the underlying ability of Bristow to generate cash flow while
growing the business across the globe.
•
We believe a dividend payment will make our stock more attractive to international
and income-oriented investors.
•
In FY 2012 and future periods, we will continually evaluate excess liquidity and
optimal capital structure in consideration of any increase in the level of
dividends or other possible return of cash to our investors.
|
 FY
2012 earnings guidance •
Issuance of annual earnings guidance demonstrates Bristow’s confidence in our
business model anchored by the underlying contractual stability serving
mostly offshore production, which makes our operating performance more
stable and predictable. •
Our objectives in providing annual earnings guidance include:
•
Aligning shareholders and other market participants with management’s
expectation of our operational performance and how management directs and
operates our business. •
Increasing BRS trading liquidity and lowering our cost of equity.
•
Earnings per share guidance for fiscal year 2012 is $3.55 to $3.90.
•
Earnings per share guidance does not include unrealized gains and losses on
disposals of assets as well as special items because their timing and
amounts are more variable and less predictable. •
Perspectives on the FY 2012 adjusted earnings guidance range will be updated on
subsequent quarterly calls.
14 |
 Operational highlights
Bill
Chiles,
President
and
CEO
15 |
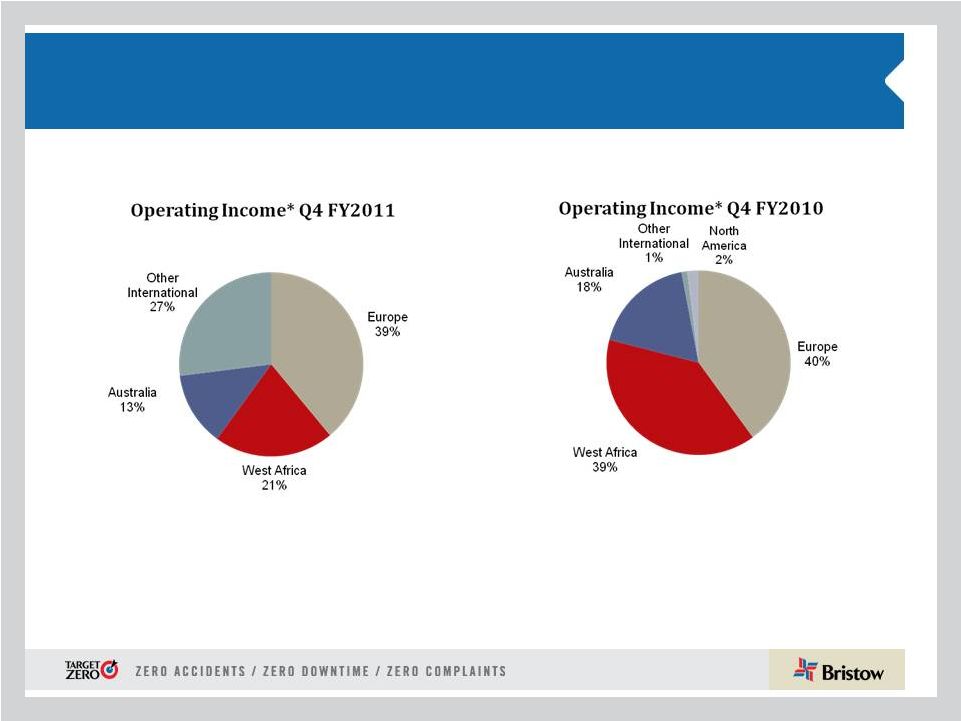 Quarter-over-quarter changes in Operating Income
16
Operating income for Q4 2011 is $50.5M
Operating income for Q4 2010 is $42.8M
*
Excludes centralized operations, corporate, gain on sale of assets, and Bristow
Academy. In Q4 FY 2011, North America was loss of $1.6 million and is
not included. |
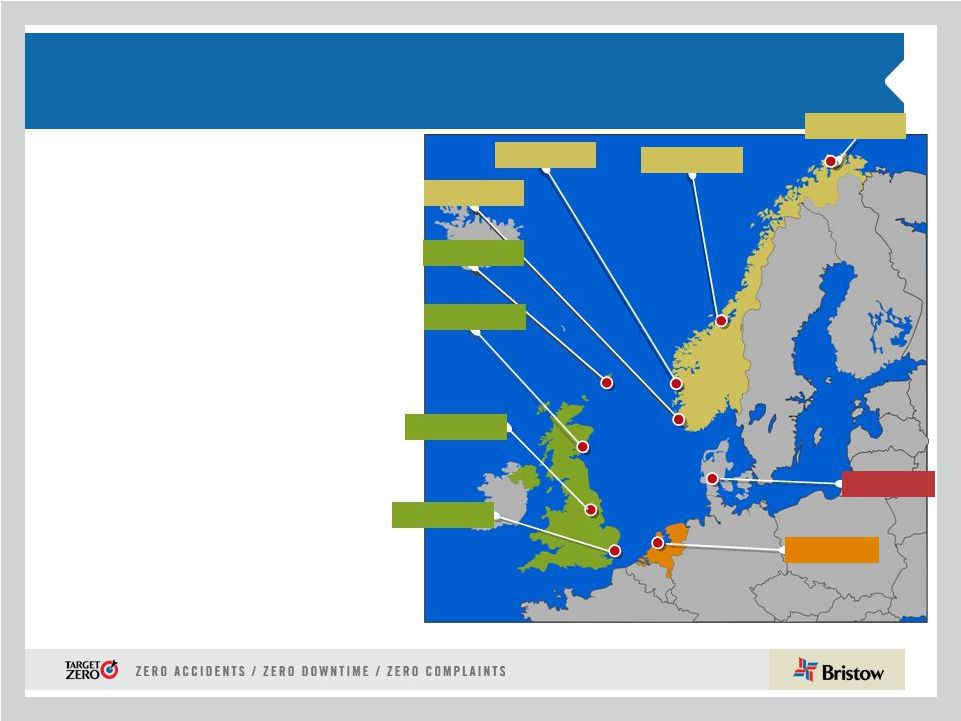 Europe (EBU)
UK
Netherlands
Norway
Norwich
Aberdeen
Scasta
Stavanger
Den Helder
Bergen
Hammerfest
•
Europe represents 41% of total revenue in Q4
FY11 and 39% of operating income
•
Operating margin of 18.8% vs. 18.1% in prior
year quarter
•
Increase in activity with new client contracts
commencing generated more the $1mm in
revenues
•
Additional work in Humberside for additional
customers in Q4 2011 not in Q4 2010
•
Cost management also contributed to the higher
operating margin
Outlook:
•
Several major tenders outstanding in UK,
Norway and Denmark for FY12 & FY13;
tender awarded for Statoil Sola renewal
Operating margins expected for FY12 to
be ~ high teens
17
Esbjerg
Humberside
Kristiansund |
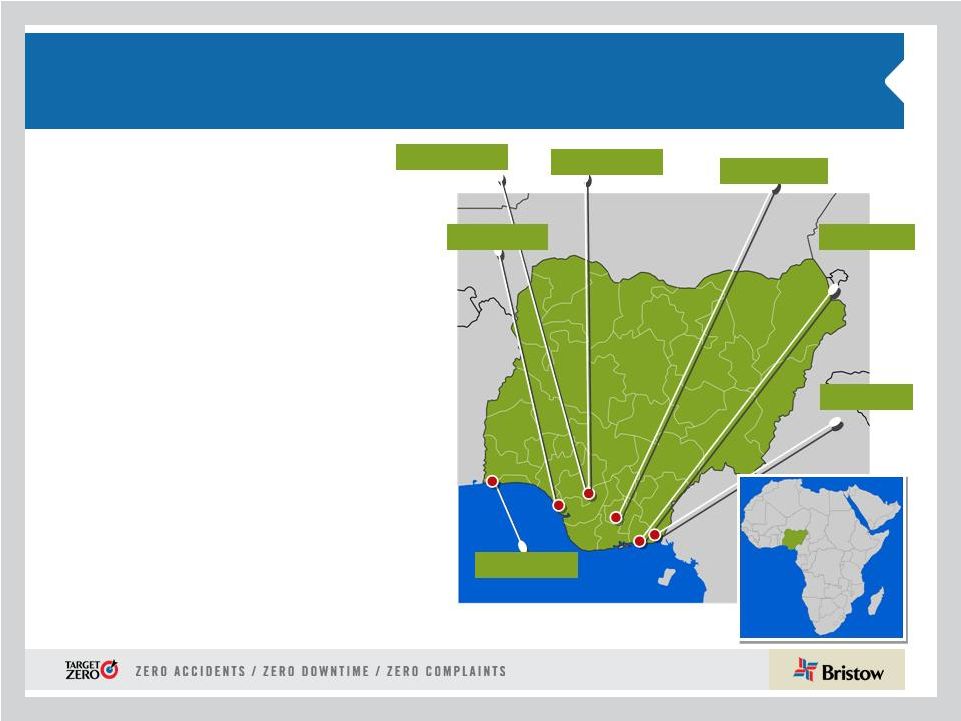 West Africa (WASBU)
Nigeria
Lagos
Escravos
Port Harcourt
Warri Osubi
Eket
Calabar
18
•
Nigeria represents 18% of total revenue in Q4 FY11
and 21% of operating income
•
Revenue of $55.2M increased slightly from
$54.2M
•
Increased operating expense in Q4 FY2011
associated with maintenance and freight
charges
•
Operating income decreased to $13.3M from
$18.8M
•
Operating margin of 24.0% vs. 34.6% in prior
year quarter
•
Increased competition and new entrants
Outlook:
•
Awaiting results of recent tenders
Operating margins expected in FY12 to be
back in the ~ mid twenties
Warri Texaco |
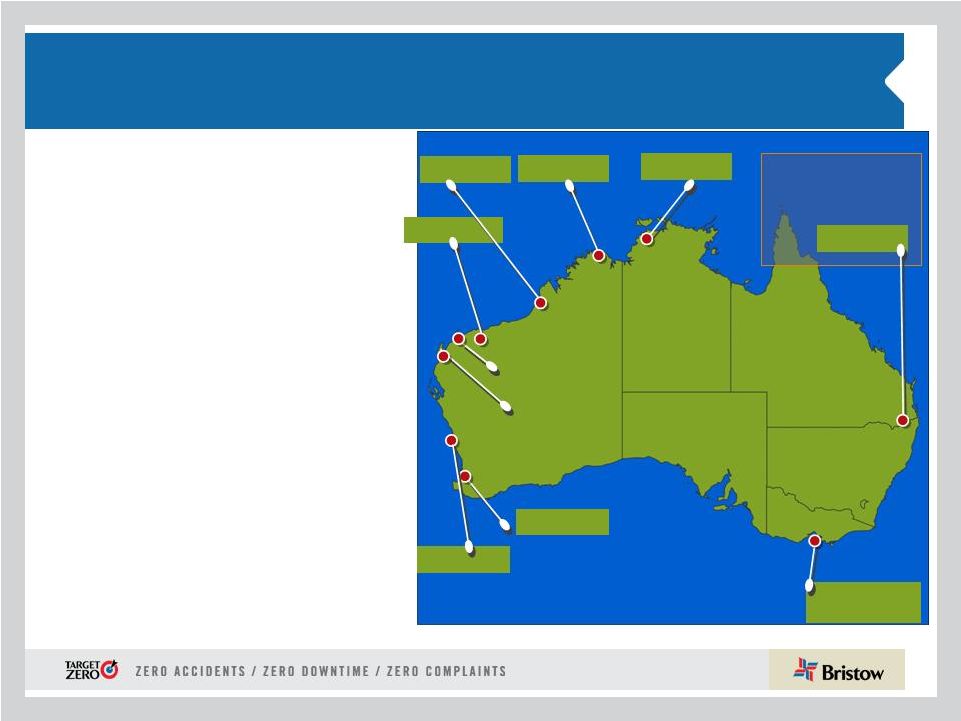 Karratha
Exmouth
Learmonth
Varanus Is
Barrow Is
Australia (AUSBU)
Australia
Perth
Dongara
Essendon
Tooradin
Broome
Truscott
Darwin
BDI provide support
to the Republic of
Singapore Air Force
Oakey
•
Australia represented 15% of total revenue in
Q4 FY11 and 13% of operating income
•
Revenue of $45M increased from $34M on
strong activity levels
•
Operating income declined to $7.8M from
$8.3M
•
Higher compensation costs and other
one time costs
•
Impairment loss shows up as increased
depreciation on three held for sale
aircraft, which were being used for
parts
•
Operating margin 17.4% vs. 24.5% for the
prior year quarter
Outlook:
•
Loss of Woodside as of May 31, 2011; we expect
to be replaced with other work
•
Higher activity levels to date due to increased gas
demand in Asia
Operating margins expected for FY12
to be ~ mid to upper teens
19 |
 Other International (OIBU)
Consolidated in OIBU
Unconsolidated Affiliate
•
OIBU represented 12% of total revenue and 27% of
operating income for Q4 FY11
•
Revenue increased to $37.3 from $32.1M
•
Operating income to $17.1M from $0.6M
•
Operating margin was 45.8% vs 1.9% in the
prior year quarter
•
Increased revenue from the Baltic Sea, Suriname,
Ghana and Russia
•
Brazil –
Lider generated equity earnings of $6.2M
•
Reduced exposure in Mexico from transfer of
indemnity on performance bonds. Investment in
affiliate impaired for loss of $2.4M
•
PAS dividend in Egypt of $2.5 million in March 2011
Outlook:
•
Tender activity in Ghana and Equatorial Guinea
Expect operating margins in FY12 to be
~high teens to lower twenties
20 |
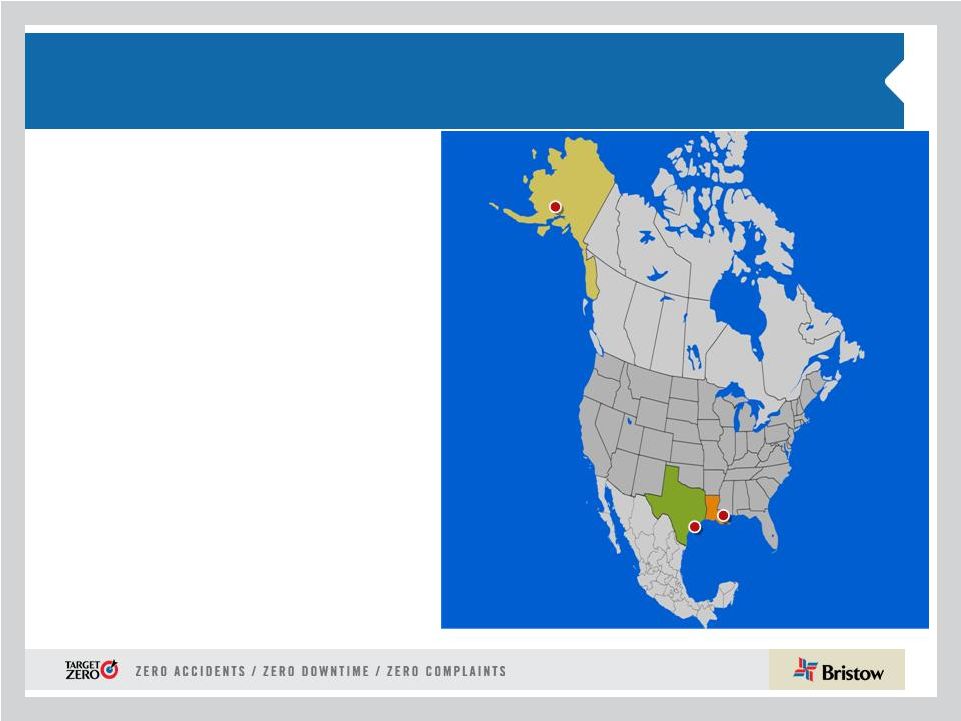 North America (NABU)
•
Revenue fell to $40.1M from $45.5M and
represented 13% of total revenue
•
Operating loss of $1.6M vs. operating income of
$1M
•
Operating margin of negative 4% declined from
2.2% in the prior year quarter
•
Gulf of Mexico outlook
•
BP work concluded in February 2011
•
Continues to be in a state of flux and
challenging market
•
We continue to redeploy aircraft to other
regions of the world
•
We are starting to see the signs of a
recovery
Expect operating margins for FY12 to
be single digits
21 |
 Summary
22
Open for Q and A
•
Bristow had an excellent FY2011 with promises made and kept in safety,
operations and financial performance.
•
Strong cash flow generation has supported dividend initiation to
common
shareholders.
•
We see expansion for FY2012 and FY2013.
Our medium to long term
outlook remains strong given better market dynamics and our financial
strength.
•
Expect growth in earnings in fiscal 2012, with EPS expected in the range of
$3.55 to $3.90. |
 Appendix
23 |
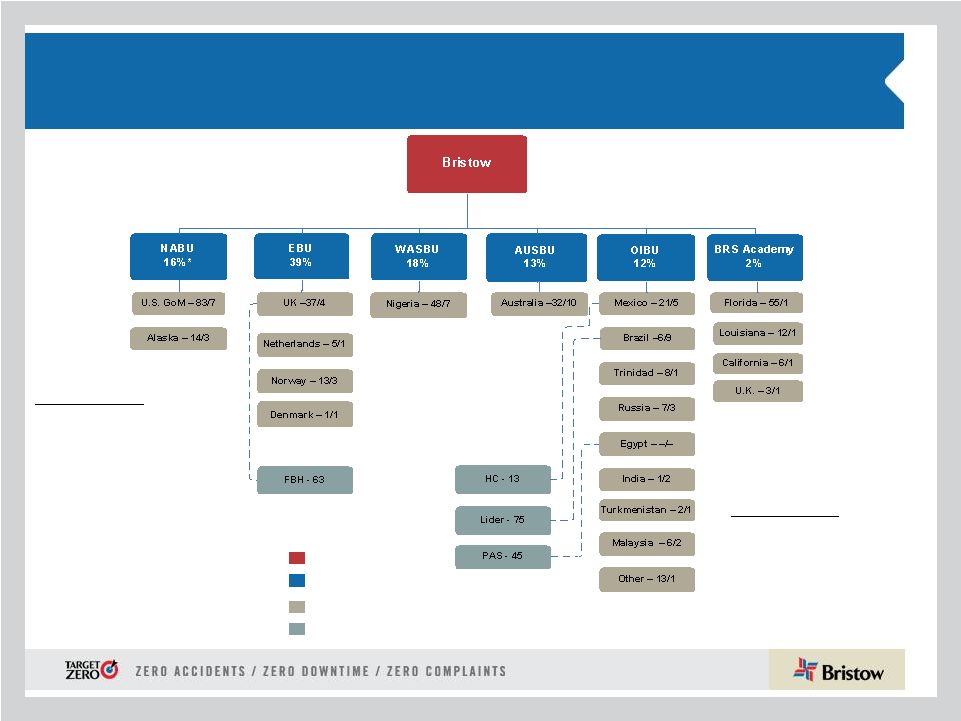 Organizational Chart -
as of March 31, 2011
Business
Unit
(*
%
of
FY11
Revenues)
Corporate
Region
(
#
of
Aircraft
/
#
of
Locations)
Joint
Venture
(No.
of
aircraft)
Key
Operated Aircraft
Bristow owns and/or operates
373 aircraft as of March 31, 2011
Affiliated Aircraft
Bristow affiliates and joint
ventures operate 196 aircraft
as of March 31,2011
24 |
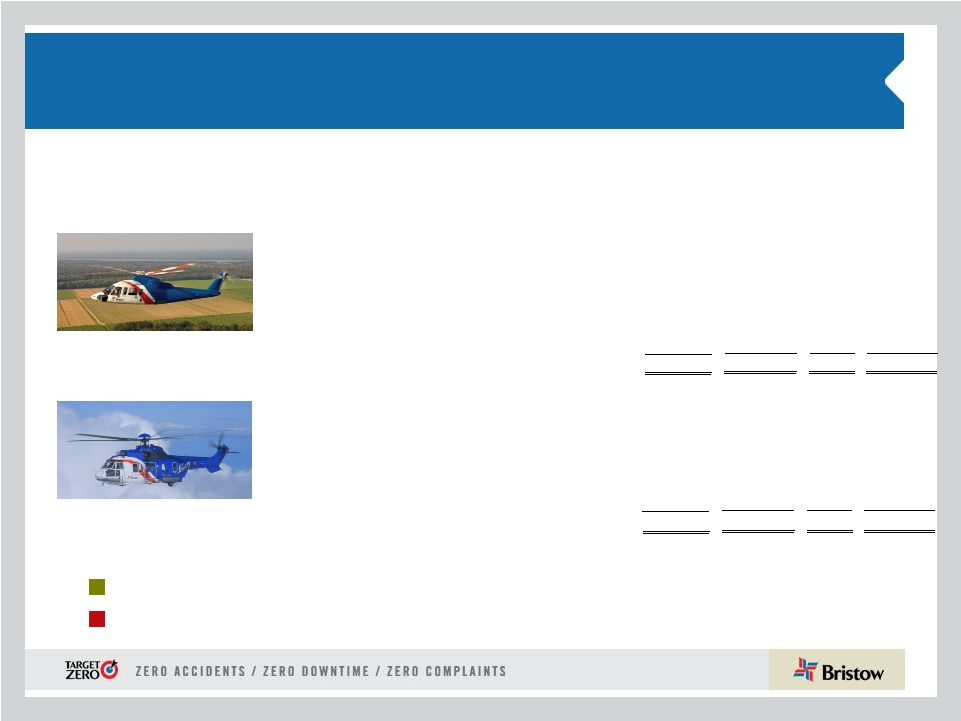 Aircraft Fleet –
Medium and Large
As of March 31, 2011
Next Generation Aircraft
Medium capacity 12-16 passengers
Large capacity 18-25 passengers
25
Mature Aircraft Models
Aircraft
Type
No. of PAX
Engine
Consl
Unconsl
Total
Ordered
Medium Helicopters
AW139
12
Twin Turbine
7
4
11
-
Bell 212
12
Twin Turbine
3
22
25
-
Bell 412
13
Twin Turbine
39
46
85
-
EC155
13
Twin Turbine
4
-
4
-
Sikorsky S-76 A/A++
12
Twin Turbine
20
8
28
-
Sikorsky S-76 C/C++
12
Twin Turbine
54
26
80
-
127
106
233
0
Large Helicopters
AS332L Super Puma
18
Twin Turbine
30
-
30
-
Bell 214ST
18
Twin Turbine
1
-
1
-
EC225
25
Twin Turbine
15
-
15
3
Mil MI 8
20
Twin Turbine
7
-
7
-
Sikorsky S-61
18
Twin Turbine
2
-
2
-
Sikorsky S-92
19
Twin Turbine
23
1
24
3
78
1
79
6 |
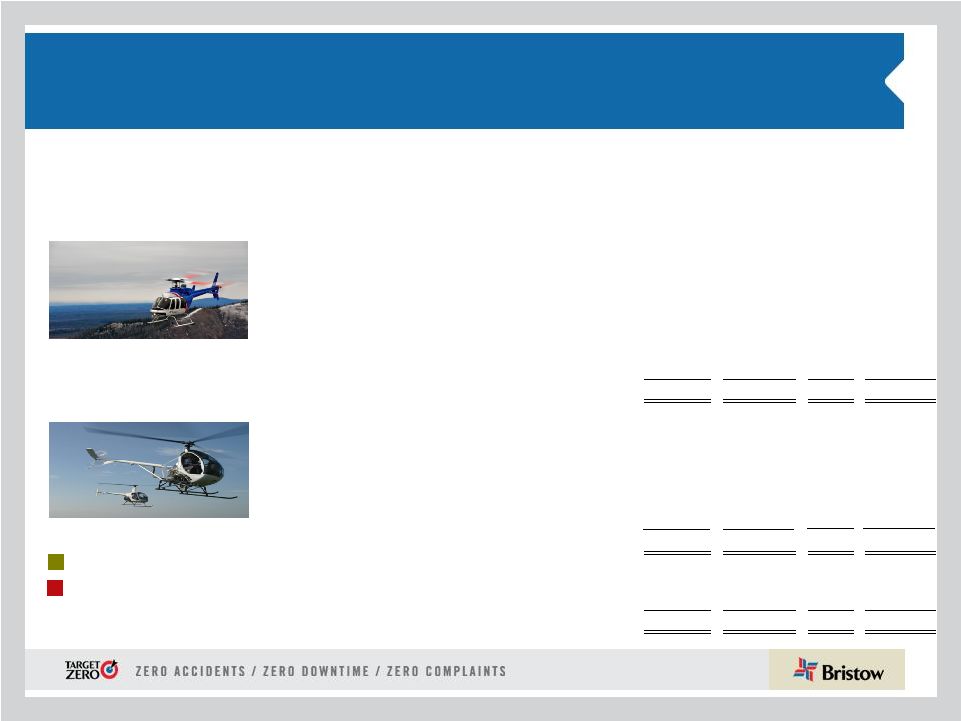 Aircraft Fleet –
Small, Training and Fixed
As of March 31, 2011 (continued)
Next Generation Aircraft
Mature Aircraft Models
Small capacity 4-7 passengers
Training capacity 2-6 passengers
26
Training Helicopters
AS355
4
Twin Turbine
3
-
3
-
Bell 206B
6
Single Engine
9
-
9
-
Robinson R22
2
Piston
11
-
11
-
Robinson R44
2
Piston
2
-
2
-
Sikorsky 300CB/Cbi
2
Piston
50
-
50
-
Fixed Wing
1
-
1
-
76
-
76
-
-
Fixed Wing
3
37
40
-
Total
373
196
569
6
Aircraft
Type
No. of PAX
Engine
Consl
Unconsl
Total
Ordered
Small Helicopters
Bell 206B
4
Turbine
2
2
4
-
Bell 206 L-3
6
Turbine
4
6
10
-
Bell 206 L-4
6
Turbine
31
2
33
-
Bell 407
6
Turbine
42
1
43
-
BK 117
7
Twin Turbine
2
-
2
-
BO-105
4
Twin Turbine
2
-
2
-
EC135
7
Twin Turbine
6
3
9
-
AS350
4
Turbine
-
36
36
-
Agusta 109
8
Twin Turbine
-
2
2
-
89
52
141
- |
 Consolidated Fleet Changes and Aircraft Sales for
FY 2011
27
(2) 1 additional aircraft sold on April 1, 2011. Cash deposit received
in FY 2011. Estimated gain of $1.3M to be recorded in Q1 2012.
Q 1 FY11
Q2 FY 11
Q 3 FY11
Q4 FY 11
Total
Fleet Count Beginning Period
390
384
379
378
390
Delivered
Agusta AW 139
1
1
2
4
Sikorsky S-76 C++
3
3
Sikorsky S-92
1
1
Total Delivered
1
1
3
3
8
Removed
Sales
(5)
(4)
-
(7)
(16)
Other*
(2)
(2)
(4)
(1)
(9)
Total Removed
(7)
(6)
(4)
(8)
(25)
384
379
378
373
373
* Includes net lease returns/commencements and operated returns
# of A/C
Sold
Cash
Received
(1)
Gain/
Loss
(1)
Q1 FY 11
5
3,770
1,585
Q2 FY 11
4
4,350
1,842
Q3 FY 11
-
-
-
Q4 FY 11
7
(2)
12,071
6,751
Totals
16
20,191
10,178
(1) Amounts stated in thousands |
 Reconciliation of Special Items
Fourth Quarter FY2010 & Full Year FY2010
28
See notes to this table on page 29.
Fiscal Year Ended
March 31, 2010
Operating
Income
EBITDA
Net
Income
Diluted
Earnings
Per
Share
(Unaudited)
(In thousands, except per share amounts)
Adjusted for special items...............
$
181,540
$
259,586
$
109,114
$
3.02
Allowance for receivables
(10)
........
(1,100)
(1,100)
(715)
(0.02)
Depreciation correction
(8)
..............
3,250
—
2,898
0.08
Australia local tax
(9
)
......................
2,041
2,041
1,327
0.04
Departure of officers
(11)
.................
(4,874)
(4,874)
(3,168)
(0.09)
Hedging gains
(12)
..........................
—
3,936
2,558
0.07
As reported
.....................................
$
180,857
$
259,589
$
112,014
3.10
March 2010 Quarter
Operating
Income
EBITDA
Net
Income
Diluted
Earnings
Per
Share
(Unaudited)
(In thousands, except per share amounts)
Adjusted for special items...............
$
39,920
$
60,385
$
26,630
$
0.73
Allowance for receivables
(7)
.........
(2,200)
(2,200)
(1,430)
(0.04)
Depreciation correction
(8)
..............
3,872
—
2,463
0.07
Australia local tax
(9
)
......................
1,200
1,200
780
0.02
As reported.....................................
$
42,792
$
59,385
$
28,443
0.78 |
 Reconciliation of Special Items
Notes
29
(1)
Represents additional depreciation expense recorded as a result of the impairment of previously
capitalized internal software costs as the related project was abandoned in the March 2011
quarter. (2)
Represents additional depreciation expense recorded as a result of the impairment of three held for
sale aircraft in the March 2011 quarter. (3)
Represents a charge recorded as a reduction in other income (expense), net related to the impairment
of our 24% investment in Heliservicio, an unconsolidated affiliate in Mexico, resulting from a
pending sale of the investment. (4)
Represents a reduction in maintenance expense (included in direct cost) associated with a credit
resulting from the renegotiation of a “power-by-the- hour” contract for
aircraft maintenance with a third party provider. (5)
Represents to impact from the early retirement of the 6 % Senior Notes,
which resulted in a $2.3 million early redemption premium (included in other income (expense),
net) and the non-cash write-off of $2.4 million of unamortized debt issuance costs (included in interest expense).
(6)
Represents the impact of a reduction in the provision for income taxes related to adjustments to
deferred tax liabilities that were no longer required as a result of a restructuring during
the fiscal year ended March 31, 2011. (7)
Represents a $3.6 million bad debt allowance recorded for accounts receivable due from our
unconsolidated affiliate in Mexico, which we determined were not probable of collection, which
was partially offset by a $1.4 million reduction in a bad debt allowance for accounts receivable due from a client
in Nigeria; these items are included in direct cost.
(8)
Represents a reduction in depreciation expense recorded in the March 2010 quarter for errors in the
calculation of depreciation on certain aircraft in prior periods.
(9)
Represents a net expense reduction in Australia upon resolution of local tax matters in the March
2010 quarter that reduced direct costs and in fiscal year ended March 31, 2010 that reduced
direct cost by $1.1 million and general and administrative expense by $0.9 million. (10)
Represents a $3.6 million bad debt allowance recorded for accounts receivable due from our
unconsolidated affiliate in Mexico, which we determined were not probable of collection, which
was partially offset by a $2.5 million reduction in a bad debt allowance for accounts receivable due from a client
in Kazakhstan; these items are included in direct cost.
(11)
Represents compensation costs associated with the departure of three of the Company’s officers
during the fiscal year ended March 31, 2010; these costs are included in general and
administrative costs. (12)
Represents the impact of pre-tax hedging gains of $3.9 million realized during the fiscal year
ended March 31, 2010 due to termination of forward contracts on euro-denominated aircraft
purchase commitments; these gains are included in other income (expense), net.
1/8 |
 EBITDA and EBITDAR Reconciliations
30
($ in millions)
2000
2001
2002
2003
2004
Income from continuing operations
$8.8
$27.9
$42.5
$40.3
$49.6
Income tax expense
3.8
13.3
19.1
17.5
18.5
Interest expense
18.5
18.4
15.8
14.9
16.8
Depreciation and amortization
32.0
33.1
33.9
37.5
39.4
EBITDA Subtotal
63.1
92.7
111.4
110.2
124.3
Aircraft rental expense
–
–
–
–
–
EBITDAR
$63.1
$92.7
$111.4
$110.2
$124.3
($ in millions)
2005
2006
2007
2008
2009
Income from continuing operations
$49.2
$54.5
$72.5
$107.7
$125.5
Income tax expense
$20.4
$14.7
$38.8
$44.5
$50.5
Interest expense
$15.7
$14.7
$10.9
$23.8
$35.1
Depreciation and amortization
40.5
42.1
42.5
54.1
65.5
EBITDA Subtotal
125.8
125.9
164.7
230.1
276.7
Aircraft rental expense
–
2.1
6.3
6.3
8.2
EBITDAR
$125.8
$128.0
$171.0
$236.4
$284.9
($ in millions)
2010
2011
Income from continuing operations
$113.5
$133.3
Income tax expense
$29.0
$7.1
Interest expense
$42.4
$46.2
Depreciation and amortization
74.7
90.9
EBITDA Subtotal
259.6
277.5
Aircraft rental expense
9.1
5.9
EBITDAR
$268.7
$283.4
March 31,
March 31,
March 31, |
 ROCE Reconciliation
31
31-Mar-06
30-Jun-06
30-Sep-06
31-Dec-06
31-Mar-07
Numerator:
Total assets
1,176.4
$
1,239.8
$
1,469.1
$
1,517.8
$
1,505.8
$
EBITDA
163.5
(-) Assets discountinued operations
(27.4)
(28.4)
(23.8)
(26.0)
(26.2)
Minority Interest
1.2
(-) Cash
(122.5)
(109.6)
(268.3)
(219.7)
(184.2)
164.7
(-) Progress payments for aircraft and other
(83.5)
(89.5)
(131.1)
(145.9)
(167.8)
(-) Current liabilities
(163.9)
(180.8)
(194.5)
(173.1)
(168.0)
(+) Current liabilities discontinued operations
5.5
4.7
3.3
3.0
5.9
(+) Short term deferred tax
5.0
6.6
10.0
10.9
17.6
(+) Estimated fair value of aircraft
665.3
750.1
772.3
846.6
946.5
(+) Net book value of property & equipment (non-aircraft)
126.0
134.5
178.8
201.4
223.3
Denominator:
(-) Net book value property & equipment (aircraft and
non-aircraft) (615.5)
(664.4)
(730.4)
(824.9)
(891.5)
Average Capital Employed
1,113.1
$
Capital employed
965.3
$
1,062.8
$
1,085.7
$
1,190.1
$
1,261.5
$
Return on capital employed:
15%
31-Mar-07
30-Jun-07
30-Sep-07
31-Dec-07
31-Mar-08
Numerator:
Total assets
1,505.8
$
1,844.4
$
1,899.2
$
1,960.4
$
1,977.4
$
EBITDA
230.3
(-) Assets discountinued operations
(26.2)
(23.9)
(25.3)
-
-
Minority Interest
(0.1)
(-) Cash
(184.2)
(339.5)
(276.4)
(315.3)
(290.1)
230.2
(-) Progress payments for aircraft and other
(167.8)
(189.4)
(206.8)
(247.9)
(182.9)
(-) Current liabilities
(168.0)
(173.0)
(183.7)
(170.8)
(165.0)
(+) Current liabilities discontinued operations
5.9
2.8
3.7
-
-
(+) Short term deferred tax
17.6
18.0
18.5
11.4
9.2
(+) Estimated fair value of aircraft
946.5
1,022.9
1,054.0
1,146.6
1,177.3
(+) Net book value of property & equipment (non-aircraft)
223.3
244.9
264.6
314.8
249.1
Denominator:
(-) Net book value property & equipment (aircraft and
non-aircraft) (891.5)
(1,017.1)
(1,099.5)
(1,150.2)
(1,172.5)
Average Capital Employed
1,450.3
$
Capital employed
1,261.5
$
1,390.1
$
1,448.3
$
1,549.0
$
1,602.6
$
Return on capital employed:
16%
Fiscal Year 2007
Fiscal Year 2008
Minority interest is added to EBITDA since the capital employed includes the full fair value of
aircraft operated by consolidated subsidiaries. Average capital employed represents the average
of the prior fiscal year end balance and quarter-end balances. Fair market value of aircraft is adjusted at the beginning of each fiscal year using our experience
buying and selling aircraft and a third-party valuation service. Also adjustments are made quarterly to reflect aircraft entering and exiting the fleet.
Excludes leased aircraft and aircraft operated for others. |
 ROCE Reconciliation
32
31-Mar-08
30-Jun-08
30-Sep-08
31-Dec-08
31-Mar-09
Numerator:
Total assets
1,977.4
$
2,354.5
$
2,306.3
$
2,342.9
$
2,334.6
$
EBITDA
276.7
(-) Cash
(290.1)
(527.4)
(399.1)
(364.7)
(301.0)
(-) Progress payments for aircraft and other
(182.9)
(229.6)
(296.2)
(322.0)
(230.1)
(-) Current liabilities
(165.0)
(162.9)
(159.5)
(184.7)
(154.8)
(+) Short term deferred tax
9.2
12.3
11.6
7.2
6.2
(
+
) Estimated fair value of aircraft
1,177.3
1,361.9
1,420.2
1,601.2
1,612.5
(
+
) Net book value of property & equipment (non-aircraft)
249.1
297.5
360.1
392.3
309.9
Denominator:
(-) Net book value property & equipment (aircraft and
non-aircraft) (1,172.5)
(1,319.1)
(1,404.5)
(1,505.1)
(1,541.5)
Average Capital Employed
1,846.3
$
Capital employed
1,602.6
$
1,787.2
$
1,838.9
$
1,967.2
$
2,035.7
$
Return on capital employed:
15%
31-Mar-09
30-Jun-09
30-Sep-09
31-Dec-09
31-Mar-10
Numerator:
Total assets
2,334.6
$
2,458.1
$
2,476.4
$
2,533.6
$
2,494.6
$
EBITDA
259.6
(-) Cash
(301.0)
(138.3)
(143.2)
(107.1)
(77.8)
(-) Progress payments for aircraft and other
(230.1)
(191.6)
(107.5)
(127.0)
(152.8)
(-) Current liabilities
(154.8)
(197.4)
(165.9)
(187.5)
(166.1)
(+) Short term deferred tax
6.2
11.0
10.5
9.3
10.2
(+) Estimated fair value of aircraft
1,612.5
1,677.3
1,741.0
1,832.1
1,865.1
(+) Net book value of property & equipment (non-aircraft)
309.9
283.8
207.0
220.3
248.9
Denominator:
(-) Net book value property & equipment (aircraft and
non-aircraft) (1,541.5)
(1,573.7)
(1,600.4)
(1,706.9)
(1,719.3)
Average Capital Employed
2,350.5
$
Capital employed
2,035.7
$
2,329.2
$
2,417.9
$
2,466.8
$
2,502.7
$
Return on capital employed:
11%
Fiscal Year 2009
Fiscal Year 2010
Minority interest is added to EBITDA since the capital employed includes the full fair value of
aircraft operated by consolidated subsidiaries. Average capital employed represents the average
of the prior fiscal year end balance and quarter-end balances. Fair market value of
aircraft is adjusted at the beginning of each fiscal year using our experience buying and selling aircraft and a third-party valuation
service. Also adjustments are made quarterly to reflect aircraft entering and exiting the fleet.
Excludes leased aircraft and aircraft operated for others. |
 ROCE Reconciliation
33
31-Mar-10
30-Jun-10
30-Sep-10
31-Dec-10
31-Mar-11
Numerator:
Total assets
2,494.6
$
2,504.7
$
2,606.9
$
2,638.7
$
2,662.6
$
EBITDA
277.5
(-) Cash
(77.8)
(73.9)
(108.5)
(100.9)
(116.4)
(-) Progress payments for aircraft and other
(152.8)
(161.2)
(168.6)
(121.4)
(112.4)
(-) Current liabilities
(166.1)
(161.1)
(168.6)
(163.6)
(167.3)
Short term deferred tax
10.2
10.1
10.7
13.3
12.2
Estimated fair value of aircraft
1,865.1
1,779.7
1,809.6
1,829.9
1,845.1
Net book value of property & equipment (non-aircraft)
248.9
258.5
268.6
221.6
216.6
Denominator:
(-) Net book value property & equipment (aircraft and
non-aircraft) (1,719.3)
(1,711.6)
(1,753.6)
(1,787.5)
(1,767.9)
Average Capital Employed
2,509.4
$
Capital employed
2,502.7
$
2,445.2
$
2,496.5
$
2,530.2
$
2,572.5
$
Return on capital employed:
11.1%
Fiscal Year 2011
Minority interest is added to EBITDA since the capital employed includes the full fair value of
aircraft operated by consolidated subsidiaries. Average capital employed represents the average of the prior fiscal year end balance and
quarter-end balances. Fair market value of aircraft is adjusted at the beginning of each fiscal year using our experience
buying and selling aircraft and a third-party valuation service. Also adjustments are made
quarterly to reflect aircraft entering and exiting the fleet. Excludes leased aircraft and aircraft operated for others.
(+)
(+)
(+) |
 Leverage Reconciliation
34
Debt
Investment
Capital
Leverage
(a)
(b)
(c) = (a) + (b)
(a) / (c)
As of March 31, 2011
707.5
$
1,518.8
$
2,226.3
$
31.8%
Adjust for:
Unfunded Pension Liability
99.6
99.6
NPV of GE and Norsk Lease Obligations
40.5
40.5
Adjusted
847.6
$
(d)
1,518.8
$
2,366.4
$
35.8%
Calculation of debt to EBITDAR multiple
EBITDAR:
FY 2011
283.4
$
(e)
Annualized
377.9
$
= (d) / (e)
2.99:1 |
 Bristow Group Inc. (NYSE: BRS)
2000 West Sam Houston Parkway South
Suite 1700, Houston, Texas 77042
t
713.267.7600
f
713.267.7620
bristowgroup.com
Contact Us
35 |