Attached files
| file | filename |
|---|---|
| 8-K - FORM 8-K - MATERION Corp | l42643e8vk.htm |
| Investor Presentation May 2011 Materion Corporation (Formerly Brush Engineered Materials) Exhibit 99.1 |
| Forward-Looking Statements These slides contain (and the accompanying oral discussion will contain) "forward-looking statements" within the meaning of the Private Securities Litigation Reform Act of 1995. These statements involve known and unknown risks, uncertainties and other factors that could cause the actual results of the Company to differ materially from the results expressed or implied by these statements, including health issues, litigation and regulation relating to our business, our ability to achieve and/or maintain profitability, significant cyclical fluctuations in our customers' businesses, competitive substitutes for our products, risks associated with our international operations, including foreign currency rate fluctuations, energy costs and the availability and prices of raw materials, the timing and ability to achieve further efficiencies and synergies resulting from our name change and product line alignment under the Materion name and brand, and other factors disclosed in periodic reports filed with the Securities and Exchange Commission. Consequently these forward-looking statements should be regarded as the Company's current plans, estimates and beliefs. The Company does not undertake and specifically declines any obligation to publicly release the results of any revisions to these forward-looking statements that may be made to reflect any future events or circumstances after the date of such statements or to reflect the occurrence of anticipated or unanticipated events. 2 |
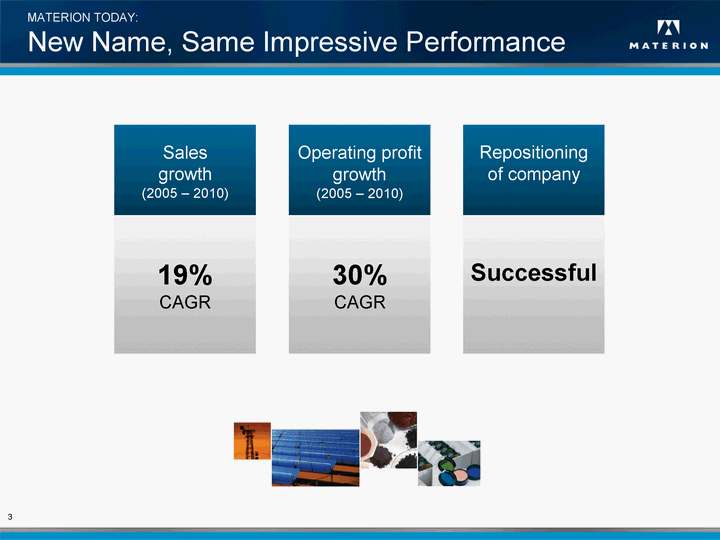
| MATERION TODAY: New Name, Same Impressive Performance 3 19% CAGR Sales growth (2005 - 2010) 30% CAGR Operating profit growth (2005 - 2010) Successful Repositioning of company |
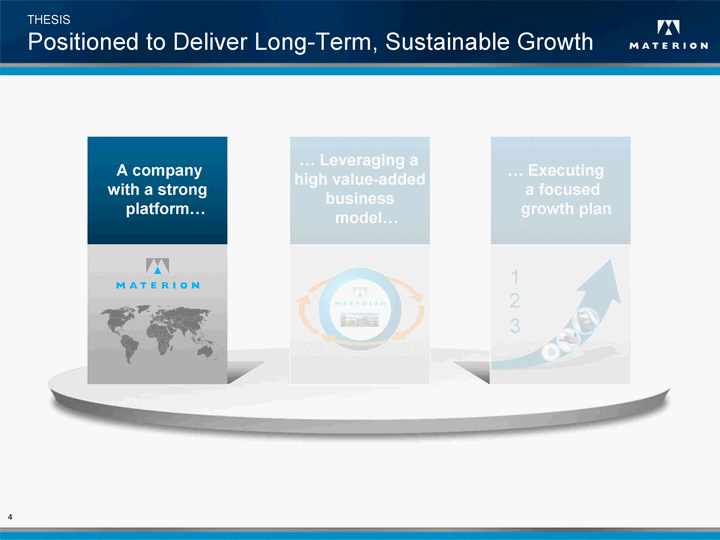
| THESIS Positioned to Deliver Long-Term, Sustainable Growth 4 ... Leveraging a high value-added business model... A company with a strong platform... ... Executing a focused growth plan 1 2 3 |
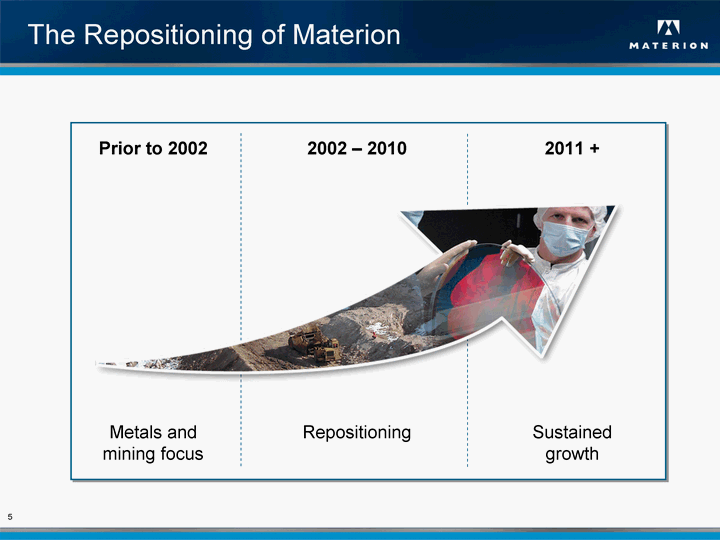
| The Repositioning of Materion Prior to 2002 2002 - 2010 2011 + Metals and mining focus Repositioning Sustained growth 5 |
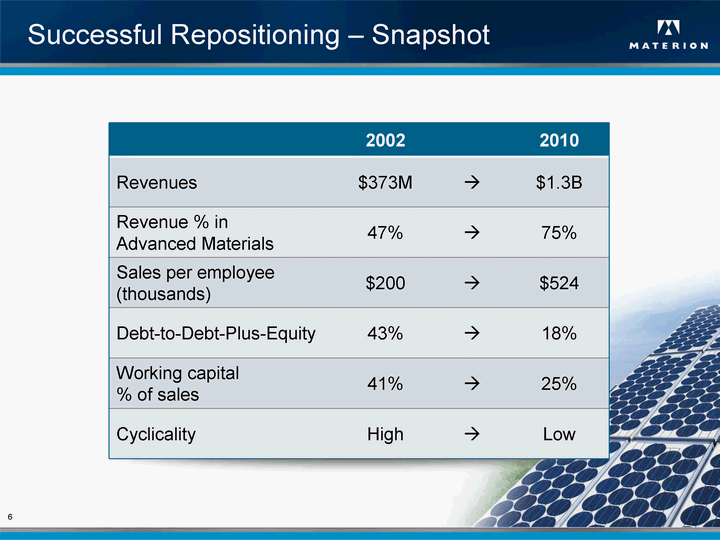
| Successful Repositioning - Snapshot 6 2002 2010 Revenues $373M ? $1.3B Revenue % in Advanced Materials 47% ? 75% Sales per employee (thousands) $200 ? $524 Debt-to-Debt-Plus-Equity 43% ? 18% Working capital % of sales 41% ? 25% Cyclicality High ? Low |
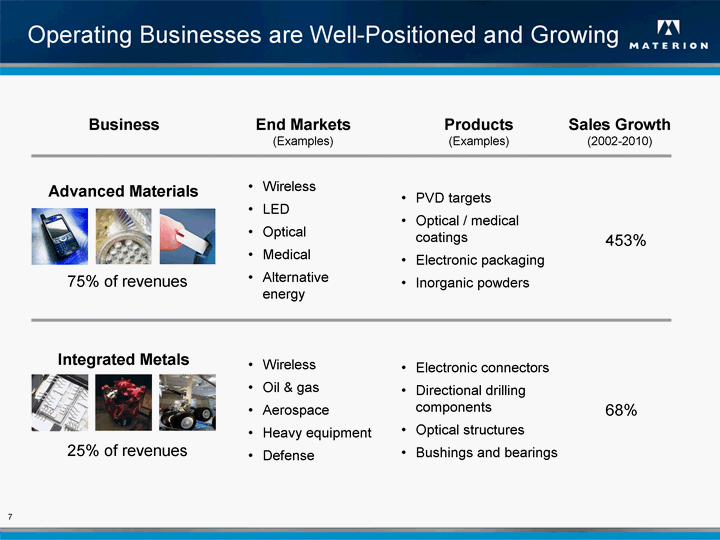
| Operating Businesses are Well-Positioned and Growing 7 Business End Markets (Examples) Products (Examples) Sales Growth (2002-2010) Advanced Materials Wireless LED Optical Medical Alternative energy PVD targets Optical / medical coatings Electronic packaging Inorganic powders 453% 75% of revenues Integrated Metals Wireless Oil & gas Aerospace Heavy equipment Defense Electronic connectors Directional drilling components Optical structures Bushings and bearings 68% 25% of revenues |
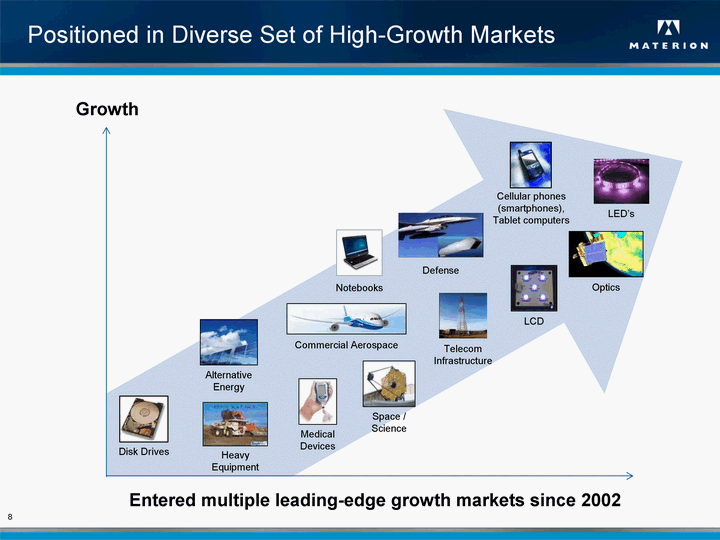
| Positioned in Diverse Set of High-Growth Markets 8 Growth Entered multiple leading-edge growth markets since 2002 Defense Commercial Aerospace Medical Devices Disk Drives Optics Telecom Infrastructure LED's Alternative Energy LCD Space / Science Notebooks Cellular phones (smartphones), Tablet computers Heavy Equipment |
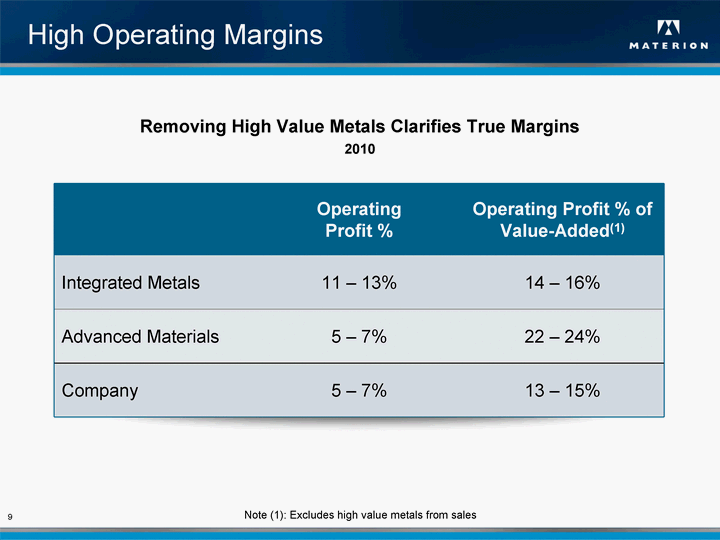
| High Operating Margins Operating Profit % Operating Profit % of Value-Added(1) Integrated Metals 11 - 13% 14 - 16% Advanced Materials 5 - 7% 22 - 24% Company 5 - 7% 13 - 15% 9 Removing High Value Metals Clarifies True Margins 2010 Note (1): Excludes high value metals from sales |
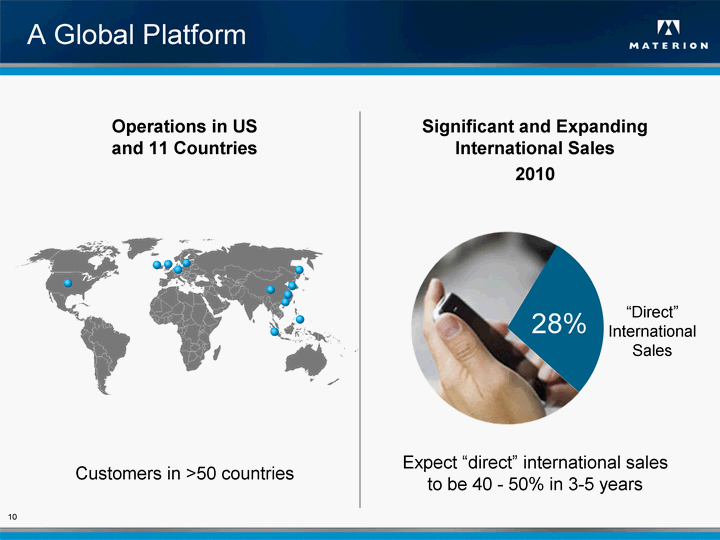
| A Global Platform Operations in US and 11 Countries Significant and Expanding International Sales 2010 28% "Direct" International Sales 10 Customers in >50 countries Expect "direct" international sales to be 40 - 50% in 3-5 years |
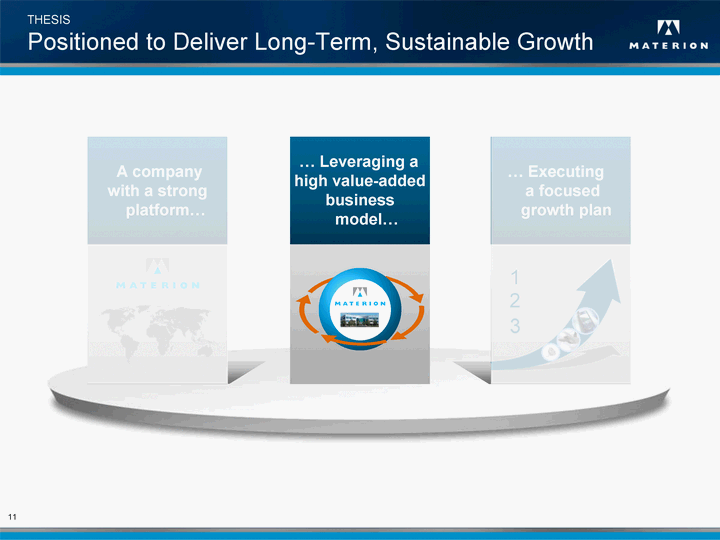
| THESIS Positioned to Deliver Long-Term, Sustainable Growth 11 A company with a strong platform... ... Leveraging a high value-added business model... ... Executing a focused growth plan 1 2 3 |
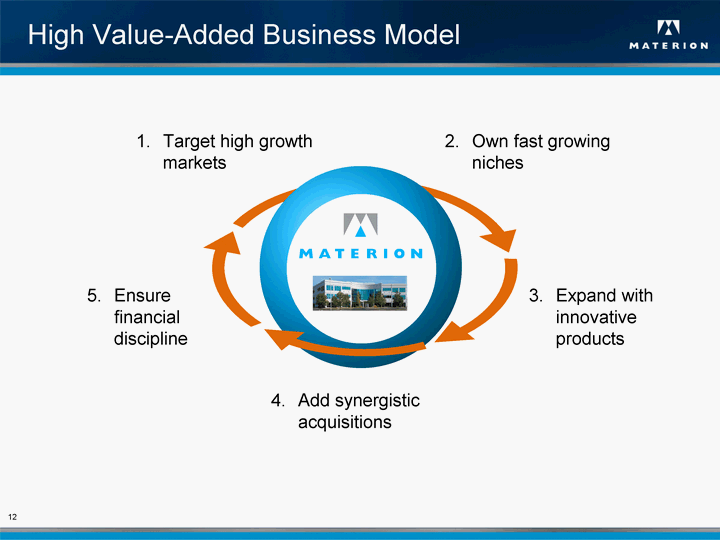
| High Value-Added Business Model 12 Target high growth markets Own fast growing niches Expand with innovative products Add synergistic acquisitions Ensure financial discipline |
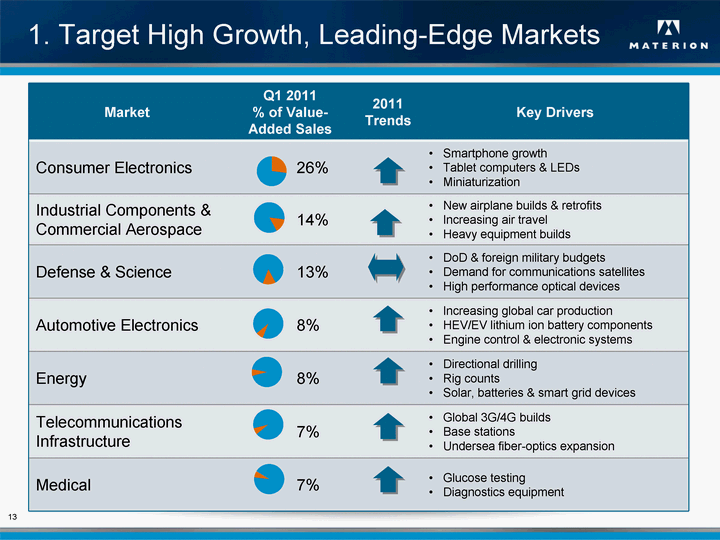
| 1. Target High Growth, Leading-Edge Markets 13 Market Q1 2011 % of Value- Added Sales 2011 Trends Key Drivers Consumer Electronics 26% Smartphone growth Tablet computers & LEDs Miniaturization Industrial Components & Commercial Aerospace 14% New airplane builds & retrofits Increasing air travel Heavy equipment builds Defense & Science 13% DoD & foreign military budgets Demand for communications satellites High performance optical devices Automotive Electronics 8% Increasing global car production HEV/EV lithium ion battery components Engine control & electronic systems Energy 8% Directional drilling Rig counts Solar, batteries & smart grid devices Telecommunications Infrastructure 7% Global 3G/4G builds Base stations Undersea fiber-optics expansion Medical 7% Glucose testing Diagnostics equipment |
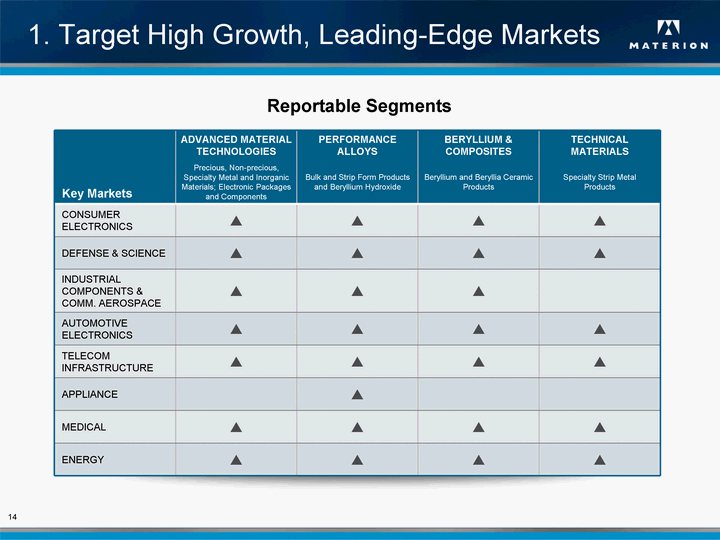
| 1. Target High Growth, Leading-Edge Markets 14 Reportable Segments ADVANCED MATERIAL TECHNOLOGIES PERFORMANCE ALLOYS BERYLLIUM & COMPOSITES TECHNICAL MATERIALS Key Markets Precious, Non-precious, Specialty Metal and Inorganic Materials; Electronic Packages and Components Bulk and Strip Form Products and Beryllium Hydroxide Beryllium and Beryllia Ceramic Products Specialty Strip Metal Products CONSUMER ELECTRONICS p p p p DEFENSE & SCIENCE p p p p INDUSTRIAL COMPONENTS & COMM. AEROSPACE p p p AUTOMOTIVE ELECTRONICS p p p p TELECOM INFRASTRUCTURE p p p p APPLIANCE p MEDICAL p p p p ENERGY p p p p |
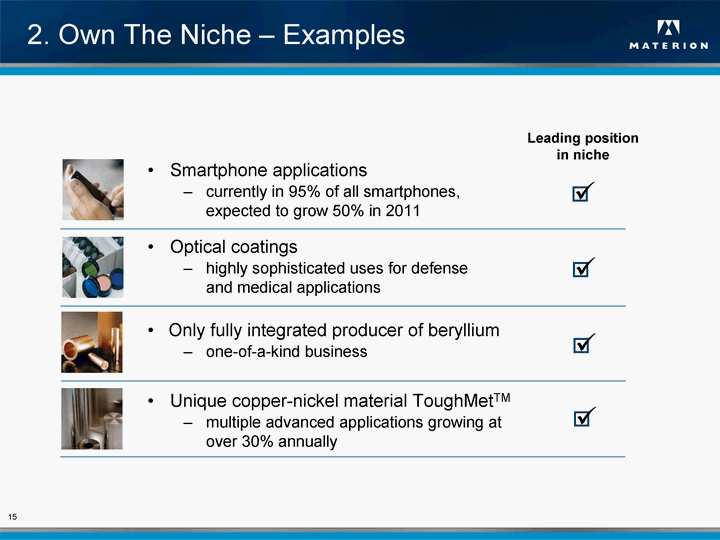
| 2. Own The Niche - Examples Only fully integrated producer of beryllium one-of-a-kind business 15 Leading position in niche Unique copper-nickel material ToughMetTM multiple advanced applications growing at over 30% annually Optical coatings highly sophisticated uses for defense and medical applications Smartphone applications currently in 95% of all smartphones, expected to grow 50% in 2011 u u u u |
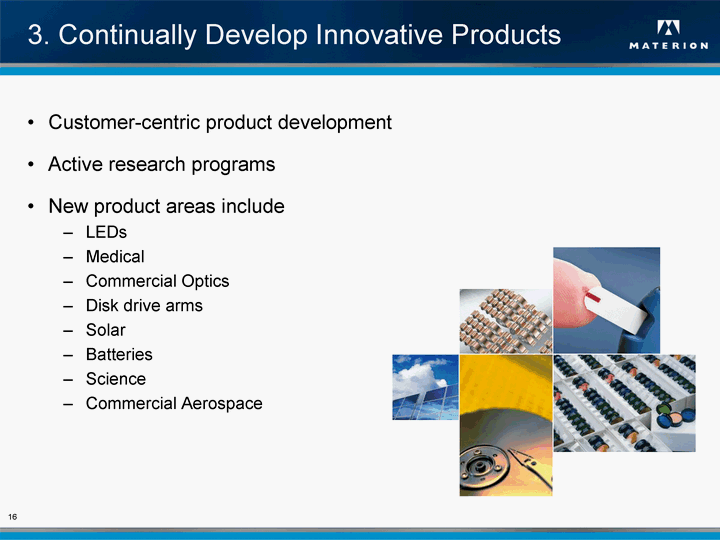
| 3. Continually Develop Innovative Products Customer-centric product development Active research programs New product areas include LEDs Medical Commercial Optics Disk drive arms Solar Batteries Science Commercial Aerospace 16 |
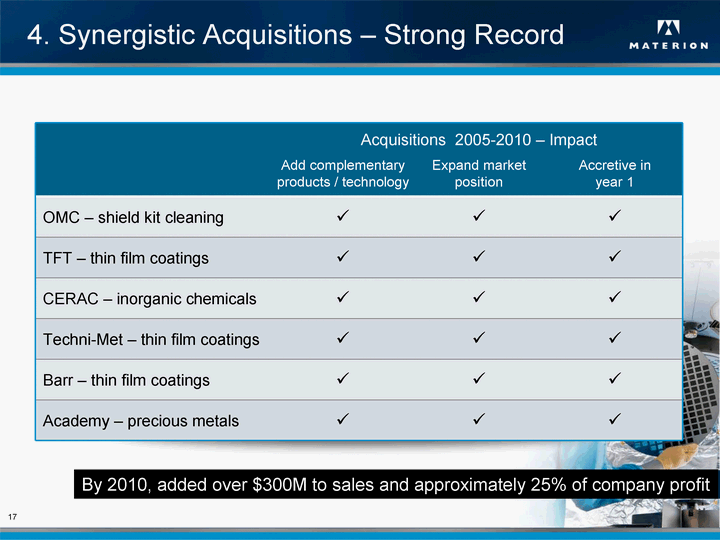
| 4. Synergistic Acquisitions - Strong Record Add complementary products / technology Expand market position Accretive in year 1 OMC - shield kit cleaning u u u TFT - thin film coatings u u u CERAC - inorganic chemicals u u u Techni-Met - thin film coatings u u u Barr - thin film coatings u u u Academy - precious metals u u u 17 By 2010, added over $300M to sales and approximately 25% of company profit Acquisitions 2005-2010 - Impact |
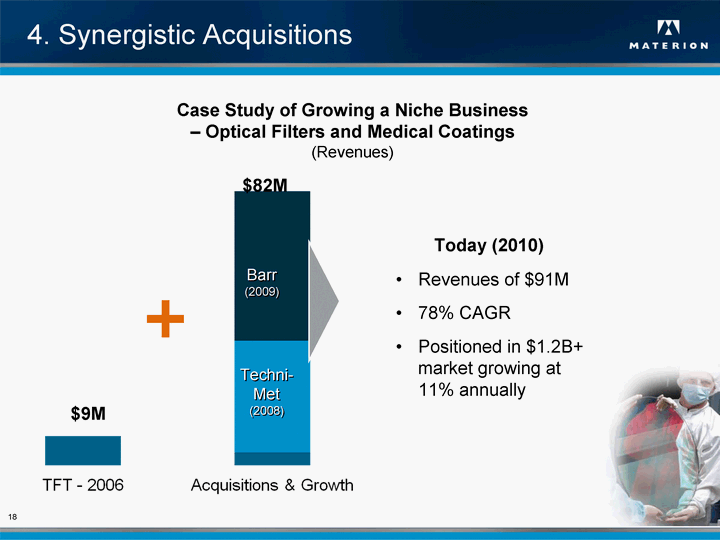
| 4. Synergistic Acquisitions Case Study of Growing a Niche Business - Optical Filters and Medical Coatings (Revenues) 18 Today (2010) Revenues of $91M 78% CAGR Positioned in $1.2B+ market growing at 11% annually $9M $82M Barr (2009) Techni- Met (2008) |
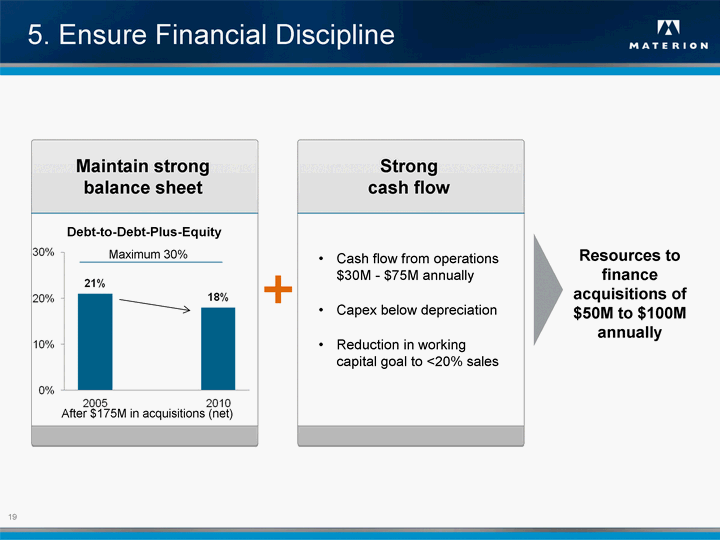
| 5. Ensure Financial Discipline 19 Maintain strong balance sheet Debt-to-Debt-Plus-Equity Maximum 30% Strong cash flow Cash flow from operations $30M - $75M annually Capex below depreciation Reduction in working capital goal to <20% sales Resources to finance acquisitions of $50M to $100M annually After $175M in acquisitions (net) |
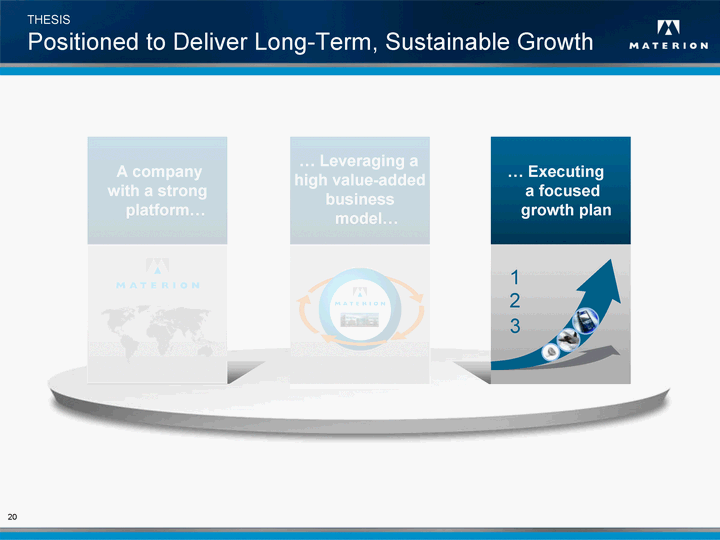
| THESIS Positioned to Deliver Long-Term, Sustainable Growth 20 A company with a strong platform... ... Leveraging a high value-added business model... ... Executing a focused growth plan 1 2 3 |
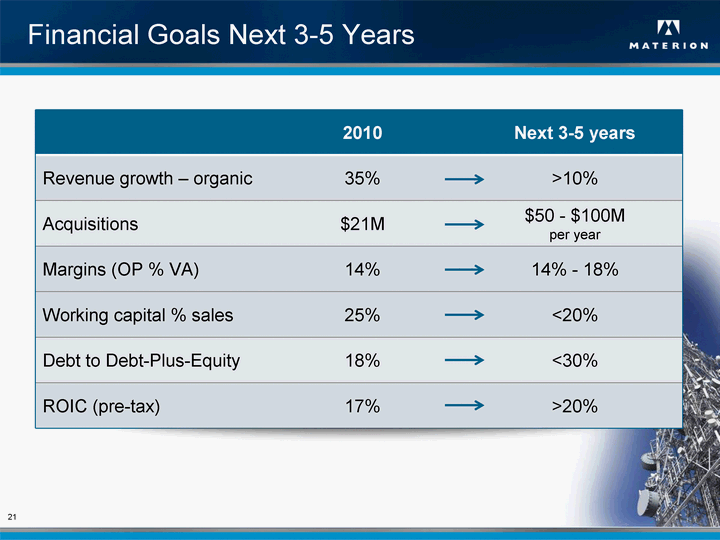
| Financial Goals Next 3-5 Years 2010 Next 3-5 years Revenue growth - organic 35% >10% Acquisitions $21M $50 - $100M per year Margins (OP % VA) 14% 14% - 18% Working capital % sales 25% <20% Debt to Debt-Plus-Equity 18% <30% ROIC (pre-tax) 17% >20% 21 |
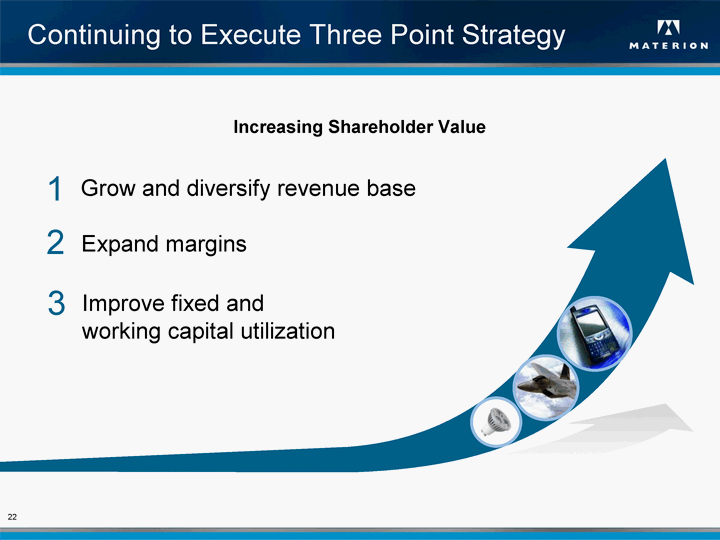
| Continuing to Execute Three Point Strategy 22 1 Grow and diversify revenue base 2 Expand margins 3 Improve fixed and working capital utilization Increasing Shareholder Value |
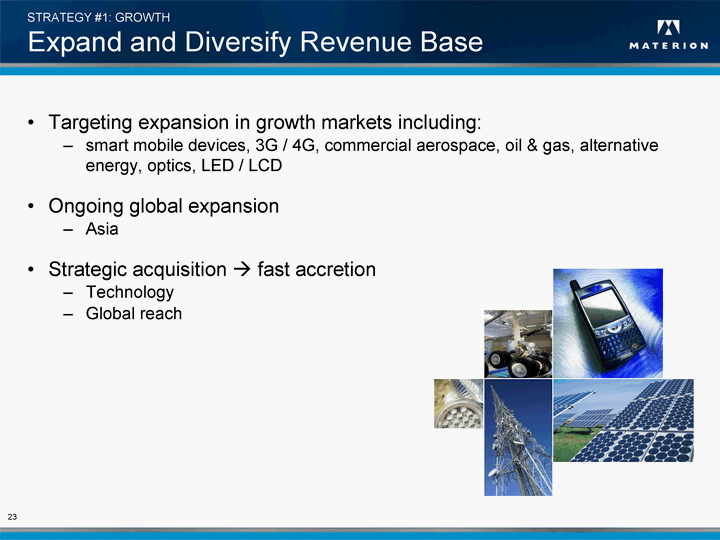
| STRATEGY #1: GROWTH Expand and Diversify Revenue Base Targeting expansion in growth markets including: smart mobile devices, 3G / 4G, commercial aerospace, oil & gas, alternative energy, optics, LED / LCD Ongoing global expansion Asia Strategic acquisition ? fast accretion Technology Global reach 23 |
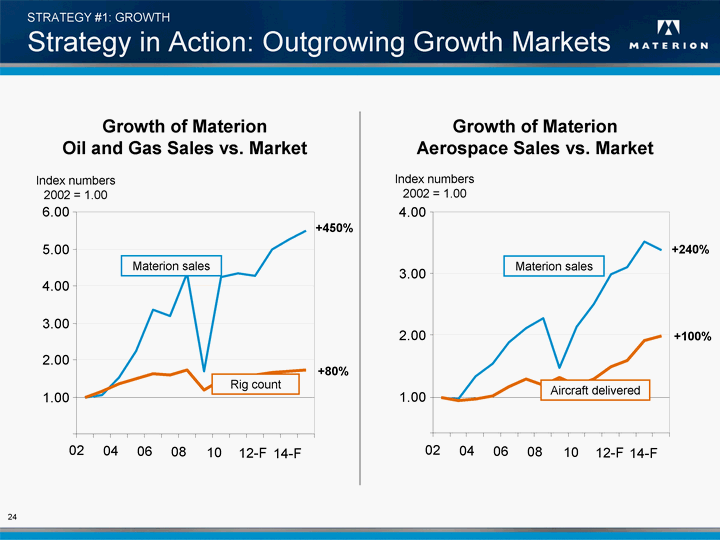
| STRATEGY #1: GROWTH Strategy in Action: Outgrowing Growth Markets Growth of Materion Oil and Gas Sales vs. Market Growth of Materion Aerospace Sales vs. Market 24 1.00 2.00 3.00 4.00 5.00 6.00 02 Index numbers 2002 = 1.00 Materion sales Rig count 04 06 08 10 12-F 14-F +450% +80% 1.00 2.00 3.00 4.00 Index numbers 2002 = 1.00 Materion sales Aircraft delivered 02 04 06 08 10 12-F 14-F +240% +100% |
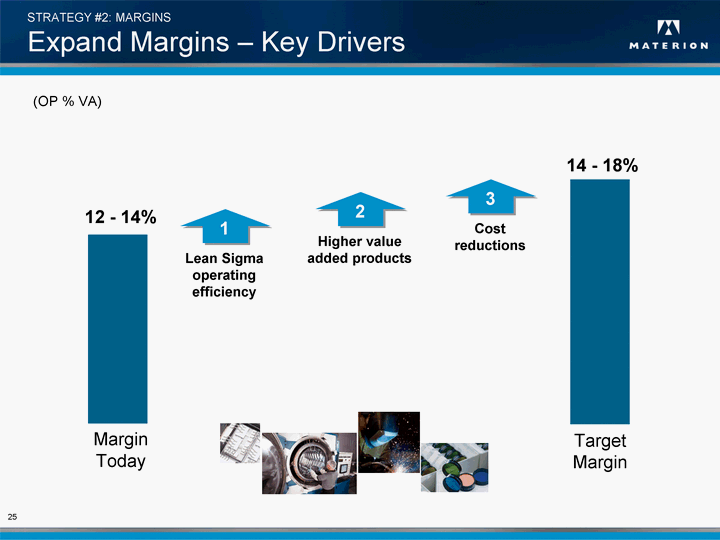
| STRATEGY #2: MARGINS Expand Margins - Key Drivers 25 1 Lean Sigma operating efficiency 2 Higher value added products 3 Cost reductions Margin Today 12 - 14% Target Margin 14 - 18% (OP % VA) |
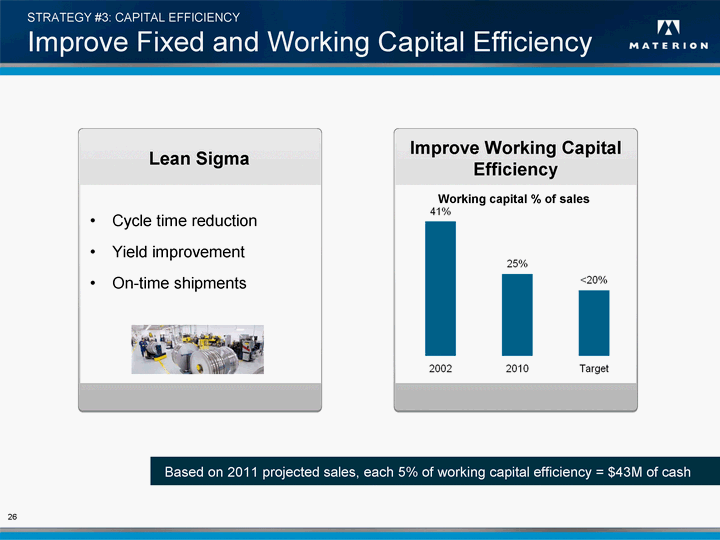
| STRATEGY #3: CAPITAL EFFICIENCY Improve Fixed and Working Capital Efficiency 26 Lean Sigma Cycle time reduction Yield improvement On-time shipments Based on 2011 projected sales, each 5% of working capital efficiency = $43M of cash Improve Working Capital Efficiency Working capital % of sales |
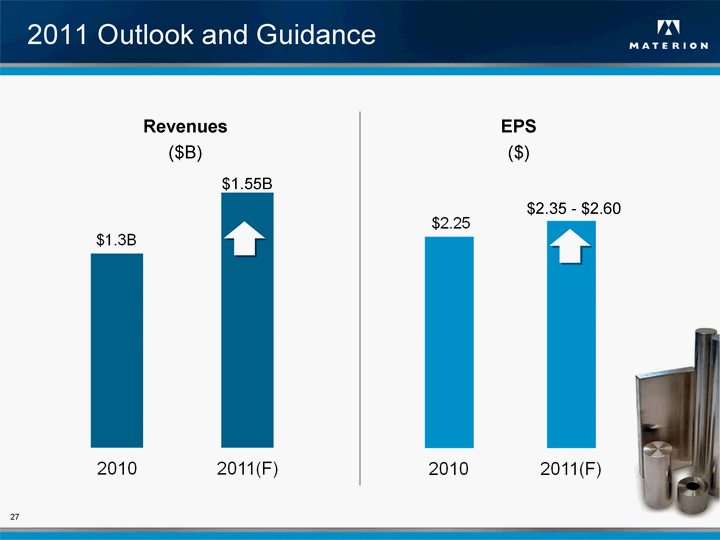
| 2011 Outlook and Guidance Revenues ($B) EPS ($) 27 $1.55B $2.35 - $2.60 |
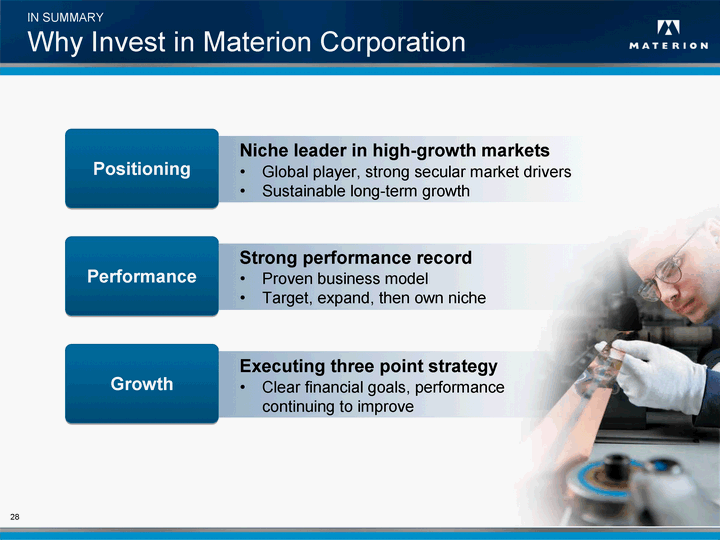
| IN SUMMARY Why Invest in Materion Corporation 28 Positioning Niche leader in high-growth markets Performance Strong performance record Growth Executing three point strategy Global player, strong secular market drivers Sustainable long-term growth Proven business model Target, expand, then own niche Clear financial goals, performance continuing to improve |
| Investor Presentation May 2011 Materion Corporation (Formerly Brush Engineered Materials) |
