Attached files
| file | filename |
|---|---|
| 8-K - OVERSEAS SHIPHOLDING GROUP INC | earn8k1q2011.htm |
| EX-99 - OVERSEAS SHIPHOLDING GROUP INC | earn8k1q2011ex991.htm |
EXHIBIT 99.2

First Quarter Fiscal 2011 Earnings
Conference Call
Conference Call
May 3, 2011

page 2
This presentation contains forward-looking statements regarding the Company's prospects, including the outlook
for tanker and articulated tug barge markets, changing oil trading patterns, anticipated levels and timing of
newbuilding and scrapping, prospects for certain strategic alliances and investments, forecasted newbuilding
delivery schedule for 2011 through 2013, projected scheduled drydock and off hire days for the three remaining
fiscal quarters of 2011, projected locked-in charter revenue and locked-in time charter days for the remaining
nine months of 2011 and 2012 through 2015 and thereafter, forecasted 2011 vessel expenses, charter hire
expenses, depreciation and amortization, general and administrative expenses, interest expense, and levels of
equity income and capital expenditures, the profitability in 2011 of certain business units and the Company’s two
FSOs, ability to meet refinancing obligations in 2011 and 2012, prospects of OSG’s strategy of being a market
leader in the segments in which it competes and the forecast of world economic activity and oil demand. These
statements are based on certain assumptions made by OSG management based on its experience and
perception of historical trends, current conditions, expected future developments and other factors it believes are
appropriate in the circumstances. Forward-looking statements are subject to a number of risks, uncertainties
and assumptions, many of which are beyond the control of OSG, which may cause actual results to differ
materially from those implied or expressed by the forward-looking statements. Factors, risks and uncertainties
that could cause actual results to differ from the expectations reflected in these forward-looking statements are
described in the Company’s Annual Report for 2010 on Form 10-K and those risks discussed in the other reports
OSG files with the Securities and Exchange Commission.
Forward-Looking Statements

page 3
< First quarter results reflected continued weakness in our international
markets
markets
• TCE revenues were $207M, down 10% from $230M in 1Q2010 but up 13% from $183M in
4Q2010
4Q2010
• Reported net loss of $34.6M or $1.15 per diluted share
< TCE revenues depressed by weak spot rates, higher fuel prices and
increased spot exposure
increased spot exposure
• In our key international tanker classes, spot rates remained under pressure in Q1
• Expirations of both VLCC FFA cover and MR time charters have increased spot exposure
compared with 1Q2010
compared with 1Q2010
• Crude markets impacted by excess tonnage, higher fuel prices, increased Chinese liftings
of Middle East vs. West African crude, inventory drawdowns
of Middle East vs. West African crude, inventory drawdowns
• TCE rate earned by spot VLCCs down 52% vs 1Q2010 but up 42% vs 4Q2010
• In MRs, Q1 spot TCE of $12,900/day was down 15% vs 1Q2010 but up 6% vs 4Q2010
- Significant strengthening continues into Q2 - Q2 average spot TCE expected to exceed $18K/day
• Q2 TCEs booked generally higher than those achieved in Q1
< U.S. Flag revenue contribution increased 50% vs 1Q2010 due to new
deliveries on higher-rate time charters and increased lightering volumes
deliveries on higher-rate time charters and increased lightering volumes
Financial Highlights

page 4
Continued execution on our fleet expansion and
renewal program
renewal program
< Crude - continued development of commercial platforms
• FSOs are performing well and delivering the positive results
we have projected for them
we have projected for them
• Newbuild fleet - 2 VLCCs in 2011; 2 Aframaxes in 2013
< Products - continued averaging down on capital and
charter-in costs
charter-in costs
• Two time-chartered MRs delivered in Q1 - Atlantic Grace and
Atlantic Star
Atlantic Star
• Newbuild fleet - 2 LR1s, 2 MRs (all in 2011)
< U.S. Flag - fleet modernization now complete
• Overseas Chinook now converted to shuttle tanker and
performing spot voyage to position for delivery under 4-year
time charter to Petrobras - expected on May 7th
performing spot voyage to position for delivery under 4-year
time charter to Petrobras - expected on May 7th
• OSG 351 delivered on April 1st and now in service with term
contract cover in place (through 2020)
contract cover in place (through 2020)
• Overseas Tampa delivered on April 28th - in spot market
• Last two single hull vessel vessels sold - U.S. fleet now
100% double hull
100% double hull
• Solidified leadership position as operator of largest, most
modern fleet in Jones Act market - well-positioned for the
long term
modern fleet in Jones Act market - well-positioned for the
long term

page 5
Disciplined Expense Management
< We have continued to identify and capture
G&A cost savings
G&A cost savings
• Savings are permanent
• 1Q2011 - on budget for target full-year G&A
expense of $95 million
expense of $95 million
• Continued cost discipline in 2011 and
beyond
beyond
< OSG reduced daily vessel operating
expense from 2008 to 2010 on
international flag vessels while improving
operational performance
expense from 2008 to 2010 on
international flag vessels while improving
operational performance
• We expect to hold 2011 daily Opex below
2008 levels
2008 levels
• 1Q2011 Opex in line with budget
• Safety, Environmental Protection and
Quality metrics improved over this period
Quality metrics improved over this period
Operating Expense per Day 1
International Fleet
G&A Expenses
(~34%)
($ in millions)
1 Does not reflect offsetting impact of payments received on two U.S. Flag vessels trading internationally and one Canadian flag vessel.

page 6
2011 Outlook - Crude & Products
< Crude - We expect 2H2011 to be stronger than 1H2011
• Sector is supply-challenged - fleet growth to exceed demand growth in 2011
• However, demand picture is encouraging
- Oil demand growth is to be met by increased OPEC Middle East production
- Shut-in of Libyan crude exports to result in longer haul movements into Europe
- Japan - substitution of oil for nuclear power to generate additional demand in 2H2011
- Slow steaming is growing in acceptance - benefits are significant
- Many wildcards - most are positive
< Products - We believe that a long-term cyclical recovery has begun
• Spot rates remain firm at highest levels since 1Q2009
• Volatility will accompany the upturn
• Vessel supply bubble is behind us - forward fleet growth is restrained
• Ton-mile growth in the MR sector expected to exceed supply growth in 2011
and 2012, setting the stage for a multi-year recovery
and 2012, setting the stage for a multi-year recovery
• Diesel demand increasing at faster pace than overall oil demand
• Ton-mile growth expected to continue from longer-haul trading patterns
- Increased diesel exports from U.S. to Europe and LatAm, India to Europe

page 7
2011 Outlook - U.S. Flag
< Strong foundation provided by fixed contract coverage - 65% of revenue days fixed
in 2011, 52% in 2012 - with spot fleet providing leverage to anticipated upside
in 2011, 52% in 2012 - with spot fleet providing leverage to anticipated upside
< Current weakness in Jones Act spot rates is seasonal, exacerbated by refinery
maintenance - throughput and demand expected to be restored in late Q2 and Q3
maintenance - throughput and demand expected to be restored in late Q2 and Q3
< Jones Act fleet expected to decline further
• 7 newbuilds delivering through 2015 will be offset by mandated/expected retirements
< Refinery expansion in the Mid-continent and Gulf Coast to result in more product
available on Gulf Coast
available on Gulf Coast
• Pipeline capacity to Northeast is limited - some will be exported (diesel to Europe)
• Balance will displace imports and generate coastwise movements
• Gasoline exports to Mexico have increased
< Lighterings into Delaware City refinery have begun
• Startup later in May will add to recent increases in other contract volumes
• Fleet renewal has increased efficiency, particularly on fuel cost

page 8
Through consistent execution of our strategy during this downturn, OSG has
improved its competitive position and thereby enhanced its ability to:
improved its competitive position and thereby enhanced its ability to:
– outperform in any market and
– deliver material improvement in financial performance in 2011 and beyond
1 Includes all expenses, including allocated G&A.
In Summary
< We have further enhanced our commercial platforms
• Pools are the cornerstone of our international fleet’s commercial strategy
• We have added pool partners and vessels across our pools
• Renewal of important contracts in our pools and in both International and U.S. Flag lightering
• The International Flag Product Tanker business we have built over the last 6 years should deliver a
materially better contribution in 2011
materially better contribution in 2011
< We have continued to modernize and optimize our fleet
• Challenging shipyard projects are completed - attractive contract cover in place on FSOs, lightering ATBs
and U.S. Flag shuttle tankers
and U.S. Flag shuttle tankers
• Recent fleet transactions have reduced average capital cost / charter-in cost
< We have reduced costs at sea and ashore and are pursuing further savings
• Further savings expected in G&A expense in 2011 - on track for 2011 target of $95M
• Holding the line on vessel expenses in 2011 - on track for 2011 target
< We have secured the turnaround in our U.S. Flag unit
• Positive contribution expected in 2011 compared with a $35M 1 operating loss in 2010
< We have maintained financial flexibility through the downturn and will outlast it
< We have maintained discipline in pursuing investment opportunities

page *
Financial Review
Myles Itkin, CFO

page 10
Reflects increase in spot market exposure [from 64% of
TCE revenues in 1Q2010 to 69% in 1Q2011] due to
expiry of time charter/FFA cover, lower spot rates and
higher bunker costs [$10.9M higher quarter-over-quarter]
TCE revenues in 1Q2010 to 69% in 1Q2011] due to
expiry of time charter/FFA cover, lower spot rates and
higher bunker costs [$10.9M higher quarter-over-quarter]
Both FSOs fully employed for quarter and earned service
level bonuses. OSG’s share of FSO JV income was
$3.7M compared with a loss of $4.2M in 2010. LNG -
$1.5M; ATC - $0.5M
level bonuses. OSG’s share of FSO JV income was
$3.7M compared with a loss of $4.2M in 2010. LNG -
$1.5M; ATC - $0.5M
Reflects higher interest expense associated with March
2010 issuance of $300M 8-1/8% Senior Notes due 2018
2010 issuance of $300M 8-1/8% Senior Notes due 2018
Reflects 302 more charter-in days during 1Q2011,
primarily in MRs and U.S. Flag Product Carriers
primarily in MRs and U.S. Flag Product Carriers
Reflects $0.9M reduction in compensation costs; $1.6M
reduction in legal fees and consulting fees. 1Q2011 is
higher than expected run rate due to costs related to
payment of cash incentive bonuses
reduction in legal fees and consulting fees. 1Q2011 is
higher than expected run rate due to costs related to
payment of cash incentive bonuses
Reflects costs associated with growth in U.S. Flag
operating fleet and return to service of Overseas Puget
Sound and OSG 209 from layup. Average daily vessel
expenses remain flat to down
operating fleet and return to service of Overseas Puget
Sound and OSG 209 from layup. Average daily vessel
expenses remain flat to down
Financial Review - Income Statement

page 11
Reflects $85M drawn under revolving credit facility and
CEXIM facility, offset by $64M in expenditures for
vessels and $13.5M in dividends paid to shareholders
CEXIM facility, offset by $64M in expenditures for
vessels and $13.5M in dividends paid to shareholders
Overseas New Orleans delivered to buyers during
1Q2011
1Q2011
Decrease reflects $41M tax refund received in January
2011
2011
1 Short term investments consists of time deposits with maturities greater than 3 months
Includes CIP of $738M for 9 vessels and two tugs
Financial Review - Balance Sheet
page 12
|
Covenants on $1.8B facility 2
|
||
|
Covenant 1Q2011 Capacity
|
||
|
Maximum Leverage 3
< 60% |
44%
|
$1.9B add’l debt
|
|
Minimum Net Worth 4
³ $1.2B
|
$2.5B
|
$1.3B in losses
|
|
Minimum
Unencumbered Assets 5
³ 150%
|
234%
|
$0.8B new secured
debt on $1.1B of vessels |
1 Liquidity consists of Cash & Cash Equivalents, Short Term Investments and committed availability under bank facilities (reflects $150M
reduction in revolving credit facility effective in February 2011). 2 Preliminary figures. 3 Funded indebtedness to total capitalization. 4
Tangible net worth. 5 Unencumbered tangible assets to unsecured debt; capacity assumes 70% advance ratio.
reduction in revolving credit facility effective in February 2011). 2 Preliminary figures. 3 Funded indebtedness to total capitalization. 4
Tangible net worth. 5 Unencumbered tangible assets to unsecured debt; capacity assumes 70% advance ratio.
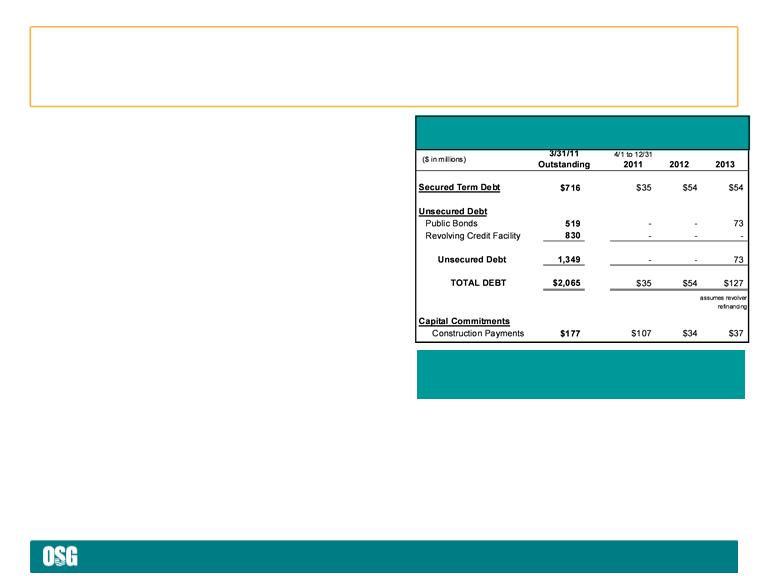
Debt Repayment and Capital Commitments
Conservative financial policy enhances financial flexibility
< Strong liquidity and balance
sheet profile
sheet profile
• $1.1B in liquidity 1
• Long term debt to capital = 49.4%
• Manageable debt and refinancing
obligations over next two years
obligations over next two years
• Future construction commitments of
$177M are fully funded
$177M are fully funded
• Ample room within covenants
< Large unsecured asset base
• 70% of Vessel NBV is unsecured
< We will continue to build upon
this important competitive
advantage
this important competitive
advantage

page 13
2011 Guidance
< Estimated vessel expenses $295M to $310M
< Time and bareboat charter hire expenses $380M to $395M
< Depreciation and amortization $185M to $195M
< G&A $95M to $100M
< Equity income of affiliated companies $20M to $25M
< Interest expense $90M to $100M
updated from $95M to $110M due to later assumed closing dates
for additional facilities and changes to the unsecured revolver
< Capital expenditures
– Drydock costs $43M for full year
(Q2 $15M, Q3 $12M and Q4 $13M on 25 vessels)
– Newbuild progress payments, vessel $188M for full year
improvements and capitalized interest (Q2 $71M, Q3 $19M and Q4 $35M)

page *
Appendix

page 15
Special Items Affecting Net Loss
Set forth below are significant items of income and expense that affected the Company’s results for the three months ended March 31, 2011 and
2010, all of which are typically excluded by securities analysts in their published estimates of the Company’s financial results.
2010, all of which are typically excluded by securities analysts in their published estimates of the Company’s financial results.
1 Impairment charges on two U.S. Flag vessels, net of asset sales
Reconciling Items

page 16
EBITDA
EBITDA represents operating earnings before interest expense and income taxes, plus other income/(expense) and depreciation and
amortization expense. EBITDA is presented to provide investors with meaningful additional information that management uses to monitor ongoing
operating results and evaluate trends over comparative periods. EBITDA should not be considered a substitute for net income / (loss) or cash
flow from operating activities prepared in accordance with accounting principles generally accepted in the United States or as a measure of
profitability or liquidity. While EBITDA is frequently used as a measure of operating results and performance, it is not necessarily comparable to
other similarly titled captions of other companies due to differences in methods of calculation.
TCE Revenues
Consistent with general practice in the shipping industry, the Company uses time charter equivalent revenues, which represents shipping revenues
less voyage expenses, as a measure to compare revenue generated from a voyage charter to revenue generated from a time charter. Time
charter equivalent revenues, a non-GAAP measure, provides additional meaningful information in conjunction with shipping revenues, the most
directly comparable GAAP measure, because it assists Company management in making decisions regarding the deployment and use of its
vessels and in evaluating their financial performance.
Reconciling Items (cont’d)

page 17
|
|
Owned
|
Chartered-in
|
Total
|
Newbuild
|
Total
|
|
VLCC
|
9
|
6
|
15
|
2
|
17
|
|
FSO
|
2
|
-
|
2
|
-
|
2
|
|
Suezmax
|
-
|
2
|
2
|
-
|
2
|
|
Aframax
|
6
|
4
|
10
|
2
|
12
|
|
Panamax
|
9
|
-
|
9
|
-
|
9
|
|
Lightering
|
2
|
4
|
6
|
-
|
6
|
|
Total Crude
|
28
|
16
|
44
|
4
|
48
|
|
LR1
|
2
|
2
|
4
|
2
|
6
|
|
MR *
|
15
|
19
|
34
|
3
|
37
|
|
Total Products
|
17
|
21
|
38
|
5
|
43
|
|
Product Carrier
|
2
|
10
|
12
|
-
|
12
|
|
Clean ATB
|
7
|
-
|
7
|
-
|
7
|
|
Lightering ATB
|
4
|
-
|
4
|
-
|
4
|
|
Total U.S. Flag
|
13
|
10
|
23
|
-
|
23
|
|
Total Gas
|
4
|
-
|
4
|
-
|
4
|
|
TOTAL
|
62
|
47
|
109
|
9
|
118
|
* Products MR operating fleet Includes 2 owned U.S. Flag MRs that trade internationally and a car carrier; Products MR newbuild fleet includes a
chemical tanker.
chemical tanker.
Fleet Composition - As of April 29, 2011

page 18
Off Hire and Scheduled Drydock
In addition to regular inspections by OSG personnel, all vessels are subject to periodic drydock, special survey and other scheduled or known
maintenance and repairs. The table below sets forth actual days off hire for the first quarter of 2011 and anticipated days off hire for the above-
mentioned events by vessel class for the second, third and fourth quarters in 2011.
maintenance and repairs. The table below sets forth actual days off hire for the first quarter of 2011 and anticipated days off hire for the above-
mentioned events by vessel class for the second, third and fourth quarters in 2011.
1 Includes one time chartered-in vessel that was off-hire for purposes of TCE revenue and charter hire expense until April termination of charter-in
commitment. 2 Includes conversion of Overseas Chinook to shuttle tanker. 3 Includes layup days on vessels sold in 1Q2011.
commitment. 2 Includes conversion of Overseas Chinook to shuttle tanker. 3 Includes layup days on vessels sold in 1Q2011.
Off Hire Schedule

page 19
For the Quarter Ended March 31, 2011
($ in thousands)
Note: Vessels chartered-in for less than one year are not on the Company’s fleet list.
Charter Hire Expense by Segment

page 20
Locked-in Time Charter
Days by Segment
Days by Segment
Locked-in Time Charter
Revenue by Segment
Revenue by Segment
($ in 000)
Locked-in
Charter Revenue
Charter Revenue
($ in 000)
Note: Locked-in time charter days for 2011 are as of 3/31/11 and will differ from a more current date used in Appendices 3 and 4 in the quarterly
earnings press release.
earnings press release.
Future Revenue $/Days by Segment - As of 3/31/11

page *
www.osg.com