Attached files
| file | filename |
|---|---|
| 8-K - FORM 8-K - ALIMERA SCIENCES INC | c16574e8vk.htm |
| EX-99.1 - EX-99.1 - ALIMERA SCIENCES INC | c16574exv99w1.htm |
Exhibit 99.2

| Alimera Sciences, Inc. Duration of DME Subgroup Analysisof the FAME StudyWebcastMay 5, 2011 1 |

| Time (Months) Patients (%) P = .018 Percentage of Patients With ^ 15-Letter Improvement Over Baseline, FAME A+B, Full Population Primary Readout P = .002 |

| Subgroup Ideal subgroup should meet the following: Statistically significant VA results at month 24 and 36 Greater benefit to risk ratio Identifiable prior to administration of ILUVIEN |

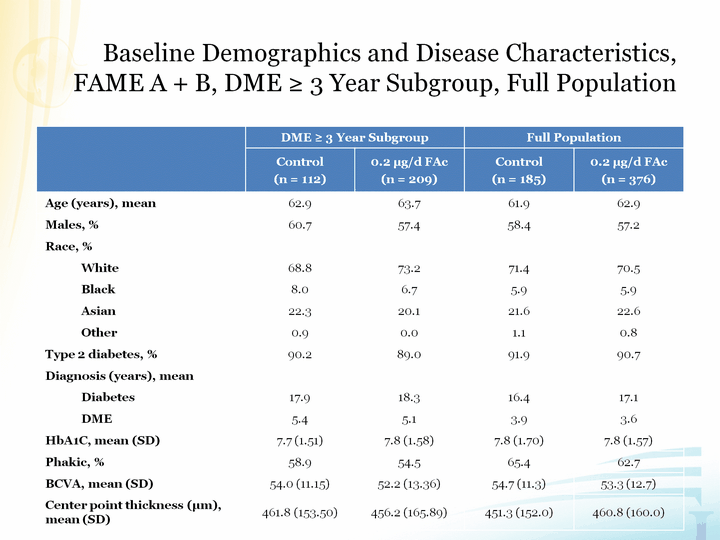
| Baseline Demographics and Disease Characteristics, FAME A + B, DME ^ 3 Year Subgroup, Full Population FAME A + B, DME ^ 3 Year Subgroup, Full Population FAME A + B, DME ^ 3 Year Subgroup, Full Population |

| FAME A Duration of DME Subgroup Analysis |

| Time (Months) Patients (%) P = .010 Percentage of Patients With ^ 15-Letter Improvement Over Baseline, FAME A, DME ^ 3 Year Subgroup Primary Readout P = .004 |

| Time (Months) Patients (%) P = .441 Percentage of Patients With ^ 15-Letter Improvement Over Baseline, FAME A, DME < 3 Year Subgroup Primary Readout P = .836 |

| FAME B Duration of DME Subgroup Analysis |

| Time (Months) Patients (%) P = .004 Percentage of Patients With ^ 15-Letter Improvement Over Baseline, FAME B, DME ^ 3 Year Subgroup Primary Readout P = .006 |

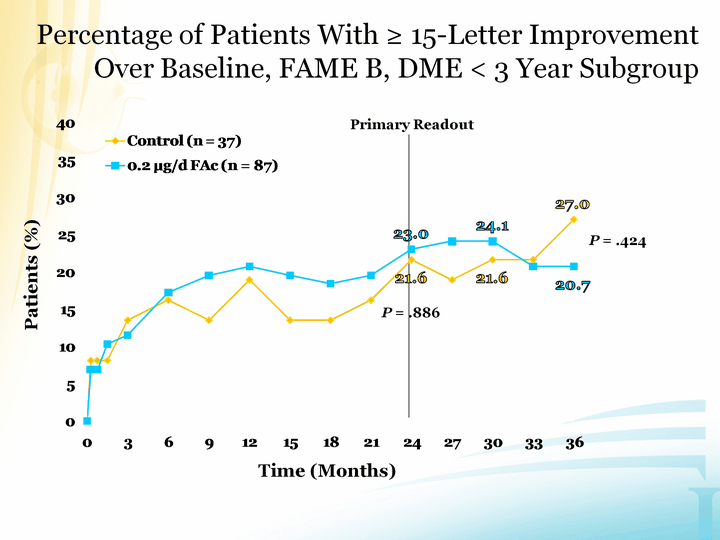
| Time (Months) Patients (%) P = .424 Percentage of Patients With ^ 15-Letter Improvement Over Baseline, FAME B, DME < 3 Year Subgroup Primary Readout P = .886 |

| FAME A + B Duration of DME Subgroup Analysis |

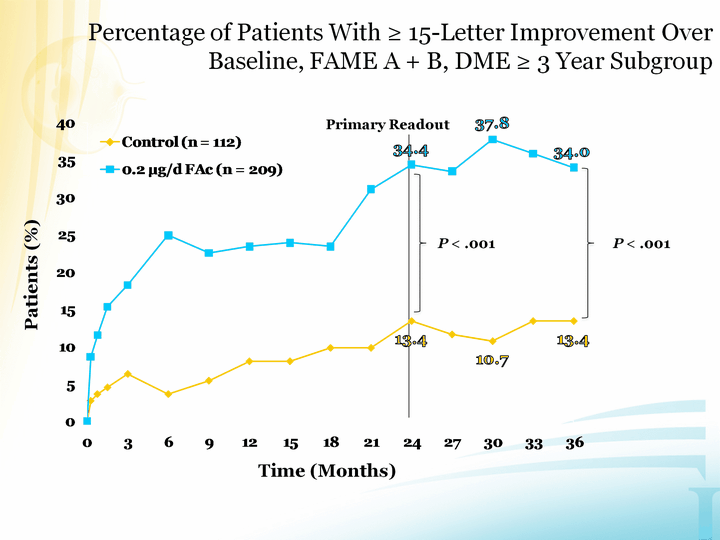
| Time (Months) Patients (%) P < .001 Percentage of Patients With ^ 15-Letter Improvement Over Baseline, FAME A + B, DME ^ 3 Year Subgroup Primary Readout P < .001 |

| Time (Months) Patients (%) P = .275 Percentage of Patients With ^ 15-Letter Improvement Over Baseline, FAME A + B, DME < 3 Year Subgroup Primary Readout P = .984 |

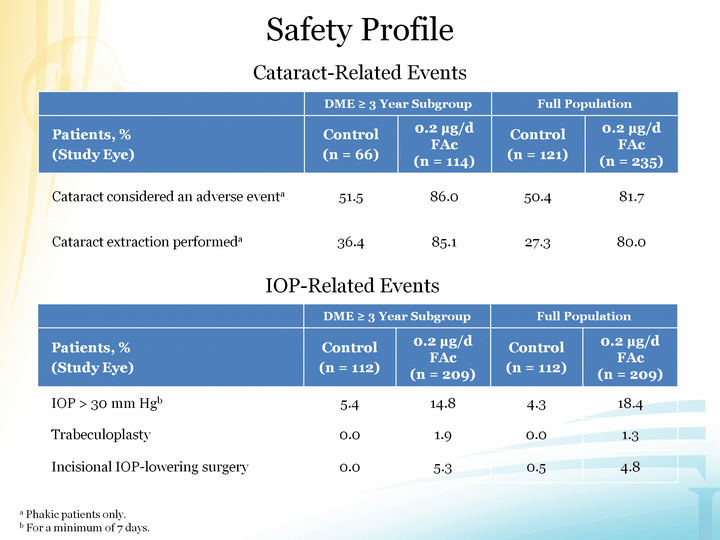
| Cataract-Related Events Cataract-Related Events DME ^ 3 Year Subgroup DME ^ 3 Year Subgroup Full Population Full Population Patients, %(Study Eye) Control(n = 112) 0.2 µg/d FAc (n = 209) Control(n = 112) 0.2 µg/d FAc (n = 209) IOP > 30 mm Hgb 5.4 14.8 4.3 18.4 Trabeculoplasty 0.0 1.9 0.0 1.3 Incisional IOP-lowering surgery 0.0 5.3 0.5 4.8 IOP-Related Events Safety Profile a Phakic patients only.b For a minimum of 7 days. |

| Alimera Sciences, Inc. Duration of DME Subgroup Analysisof the FAME StudyWebcastMay 5, 2011 1 |
