Attached files
| file | filename |
|---|---|
| 8-K - FORM 8-K - Mastercard Inc | d8k.htm |
| EX-99.1 - PRESS RELEASE - Mastercard Inc | dex991.htm |
Exhibit 99.2
|
|
MasterCard Incorporated First-Quarter 2011 Financial Results Conference Call
May 3, 2011
|
|
Business Update
• Operational Overview
• Economic Update
• Business Highlights
| 2 |
|
|
|
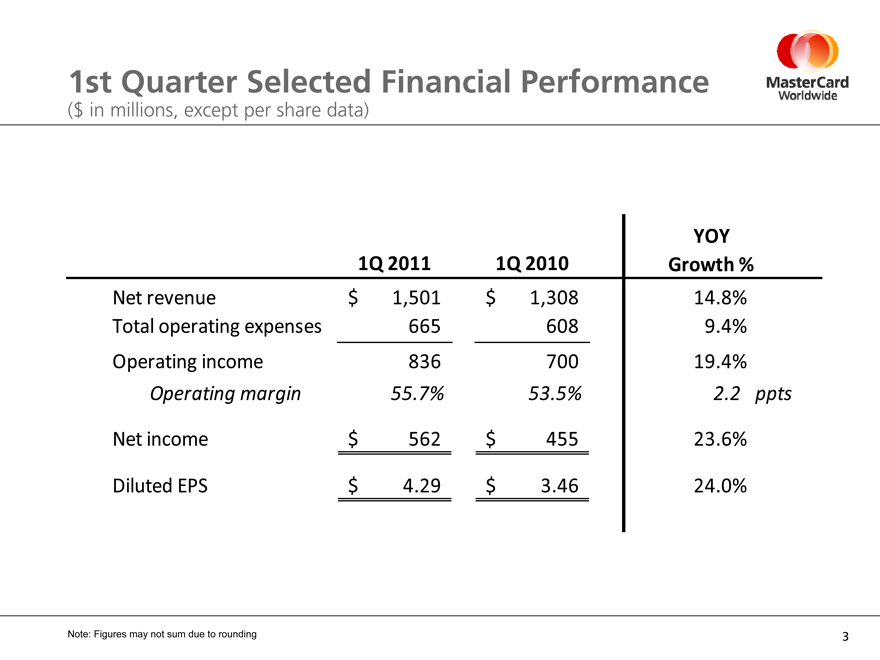
1st Quarter Selected Financial Performance
($ in millions, except per share data)
YOY
1Q 2011 1Q 2010 Growth %
Net revenue $ 1,501 $ 1,308 14.8%
Total operating expenses 665 608 9.4%
Operating income 836 700 19.4%
Operating margin 55.7% 53.5% 2.2 ppts
Net income $ 562 $ 455 23.6%
Diluted EPS $ 4.29 $ 3.46 24.0%
Note: Figures may not sum due to rounding
| 3 |
|
|
|
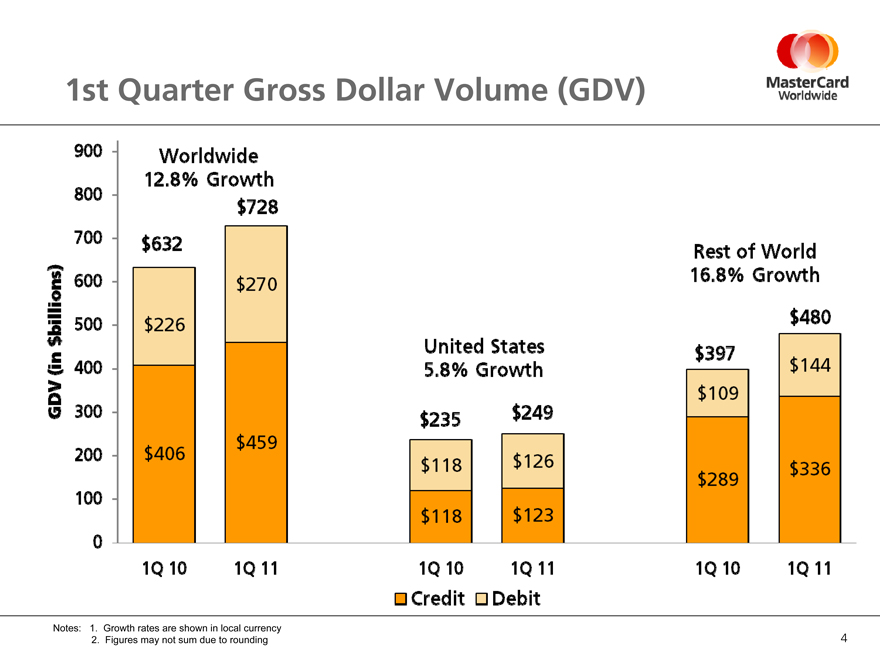
1st Quarter Gross Dollar Volume (GDV)
900 Worldwide
12.8% Growth
800
$728 700 $632
Rest of World 600 16.8% Growth $270 $480 500 $226 United States $397 400 5.8% Growth $144 $109 300 $249 $235 $459 200 $406 $126 $118 $336 $289
100
$118 $123
0
1Q 10 1Q 11 1Q 10 1Q 11 1Q 10 1Q 11
Credit Debit
GDV (in $billions)
Notes: 1. Growth rates are shown in local currency
2. Figures may not sum due to rounding
| 4 |
|
|
|
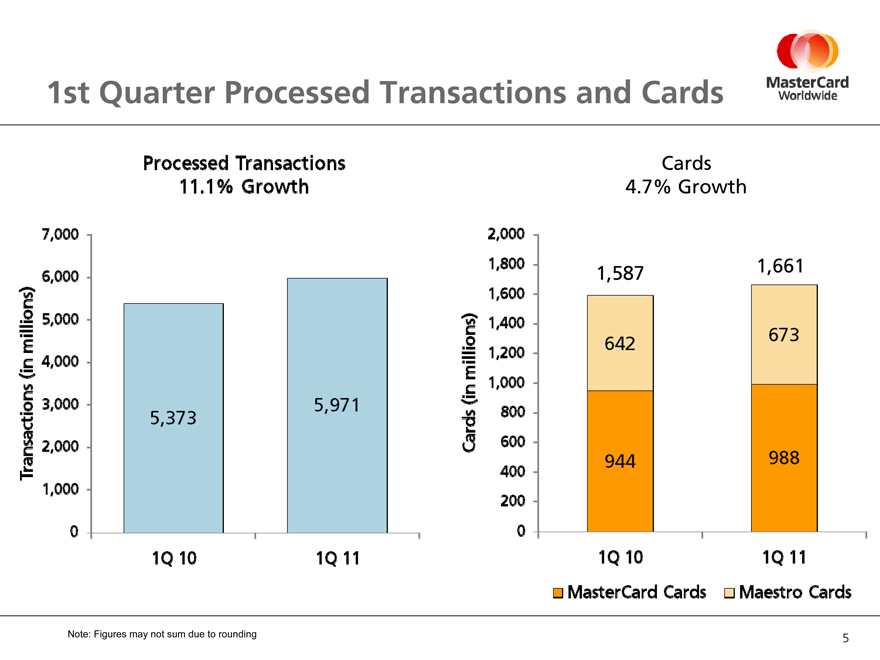
1st Quarter Processed Transactions and Cards
Processed Transactions Cards
11.1% Growth 4.7% Growth
7,000 2,000
1,800 1,661 6,000 1,587 1,600
5,000 1,400
673
Transactions (in millions) 642 Cards (in millions) 1,200 4,000 1,000 3,000 5,971
5,373 800
2,000 600 944 988 400 1,000 200
0 0
1Q 10 1Q 11 1Q 10 1Q 11
MasterCard Cards Maestro Cards
Note: Figures may not sum due to rounding
| 5 |
|
|
|
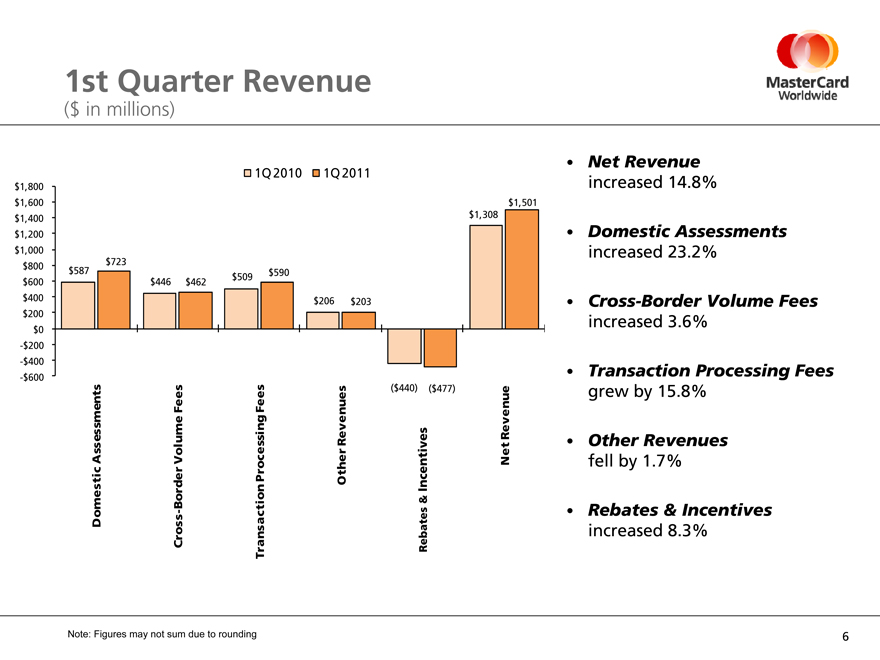
1st Quarter Revenue
($ in millions)
1Q 2010 1Q 2011
$1,800 $1,600 $1,501 $1,308 $1,400 $1,200 $1,000 $723 $800 $587 $590 $509 $600 $446 $462 $400 $206 $203 $200 $0
-$200
-$400
-$600
Fees Fees ($440) ($477)
Revenue Revenues Assessments Volume Net Processing Other Incentives & Border Domestic Cross—Transaction Rebates
Note: Figures may not sum due to rounding
• Net Revenue increased 14.8%
• Domestic Assessments increased 23.2%
• Cross-Border Volume Fees increased 3.6%
• Transaction Processing Fees grew by 15.8%
• Other Revenues fell by 1.7%
• Rebates & Incentives increased 8.3%
| 6 |
|
|
|
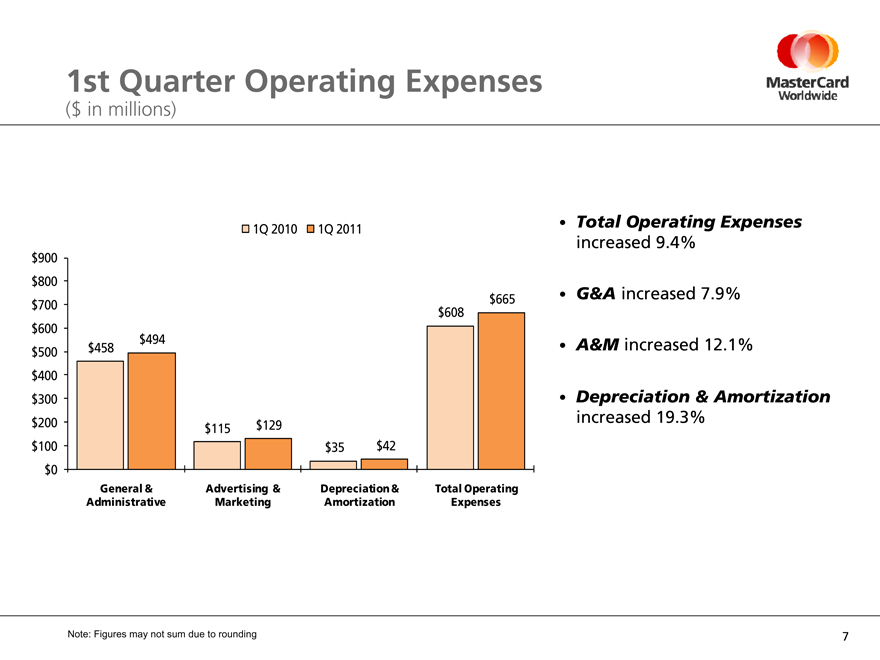
1st Quarter Operating Expenses
($ in millions)
• Total Operating Expenses
1Q 2010 1Q 2011
increased 9.4%
increased 7.9%
increased 12.1%
increased 19.3%
$900
$800 G&A $700 $665 • $608 $600 $494 $458 • A&M $500
$400
$300 • Depreciation & Amortization
$200 $129 $115 $100 $35 $42 $0
General & Advertising & Depreciation & Total Operating Administrative Marketing Amortization Expenses
Note: Figures may not sum due to rounding
| 7 |
|
|
|
1st Quarter Cash Flow Statement and Balance Sheet Highlights
• Cash flow from operations of $355 million
• Cash, cash equivalents and other liquid investments of
$3.9 billion
• Share Repurchase
o As of March 31: approx. 2.6 million shares (cost of $654 million) o As of April 28: approx. 3.9 million shares (cost of $1 billion) o Announced incremental $1 billion share repurchase in April 2011
| 8 |
|
|
|
Thoughts for 2011
• Business update through April 28
• Thoughts for the full year
o Net Revenue o Total Operating Expenses o Tax Rate
9
|
|

10