Attached files
| file | filename |
|---|---|
| 8-K - CAL DIVE FORM 8-K 1Q11 EARNINGS - Cal Dive International, Inc. | form8k1q11050311.htm |
| EX-99.1 - CAL DIVE PRESS RELEASE 1Q11 EARNINGS RELEASE - Cal Dive International, Inc. | exhibit99_1.htm |
EXHIBIT 99.2

Cal Dive International
1st Quarter 2011 Earnings Conference Call

Forward-Looking Statements
This presentation may include “forward-looking” statements that are generally identifiable through
our use of words such as “believe,” “expect,” “anticipate,” “intend,” “plan,” “estimate,” “project” and
similar expressions and include any statements that we make regarding our earnings expectations.
The forward-looking statements speak only as of the date of this presentation, and we undertake no
obligation to update or revise such statements to reflect new information or events as they occur.
Our actual future results may differ materially due to a variety of factors, including current economic
and financial market conditions, changes in commodity prices for natural gas and oil and in the level
of offshore exploration, development and production activity in the oil and natural gas industry, the
impact on the market and regulatory environment in the U.S. Gulf of Mexico resulting from the
Macondo well blowout, our inability to obtain contracts with favorable pricing terms if there is a
downturn on our business cycle, intense competition in our industry, the operational risks inherent in
our business, and other risks detailed in our Form 10-K on file with the Securities and Exchange
Commission.
2
Presentation Outline
Summary of 1Q 2011 Results
Backlog
Discussion of Financial Results
Credit Facility Renewal
Non-GAAP Reconciliations
Questions & Answers
3

Summary of 1Q Results
4
General improvement in activity levels.
Construction project in Bahamas and
diving related work in Australia.
Solid Backlog at end of quarter.
Typical seasonality in 1Q.
Permitting activity still slow but improving
in Gulf of Mexico.

Backlog
5

Financial Results
6
|
(all amounts in thousands, except per
share amounts and percentages) |
(1) See reconciliation on Non-GAAP financial measures at the end of the presentation.
|
1st Quarter
|
|||
|
2011
|
|
2010
|
|
|
|
|
|
|
|
Revenues
|
$95,431
|
|
$57,418
|
|
|
|
|
|
|
Gross Loss
|
($7,226)
|
|
($15,409)
|
|
Margins
|
(8%)
|
|
(27%)
|
|
|
|
|
|
|
Net Loss
|
($18,745)
|
|
($19,129)
|
|
Margins
|
(20%)
|
|
(33%)
|
|
|
|
|
|
|
Diluted Loss Per Share
|
($0.20)
|
|
($0.20)
|
|
|
|
|
|
|
EBITDA (1)
|
($1,338)
|
|
($8,490)
|
|
Margins
|
(1%)
|
|
(15%)
|

Utilization
7
(1) Effective vessel utilization is calculated by dividing the total number of days the vessels generated revenues by the total number
of days the vessels were available for operation in each period excluding days in which the vessels were in drydocking or taken out
of service for upgrades.
of days the vessels were available for operation in each period excluding days in which the vessels were in drydocking or taken out
of service for upgrades.
|
|
|
1st Quarter
|
|
|
|
|
2011
|
2010
|
|
Effective Utilization (1) -
|
|
|
|
|
Saturation Diving Vessels
|
|
48%
|
39%
|
|
Surface Diving Vessels
|
|
34%
|
22%
|
|
Construction Barges
|
|
15%
|
6%
|
|
Total Fleet
|
|
30%
|
22%
|
|
|
|
|
|
|
Calendar Day Utilization -
|
|
|
|
|
Saturation Diving Vessels
|
|
38%
|
35%
|
|
Surface Diving Vessels
|
|
32%
|
21%
|
|
Construction Barges
|
|
14%
|
5%
|
|
Total Fleet
|
|
27%
|
19%
|
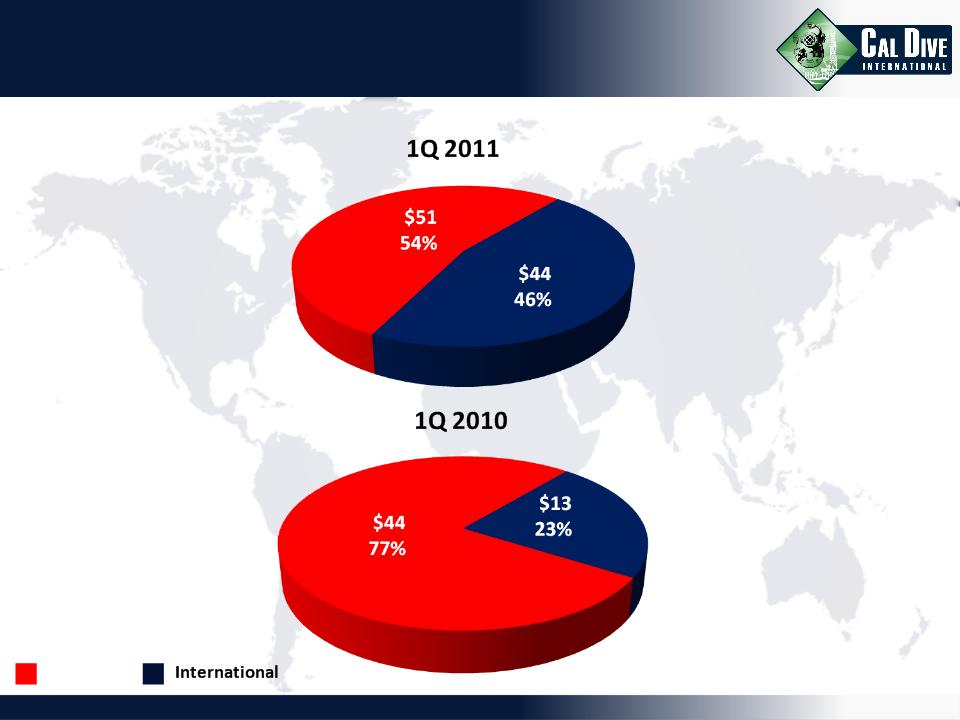
International Revenue
($ millions)
Domestic
8
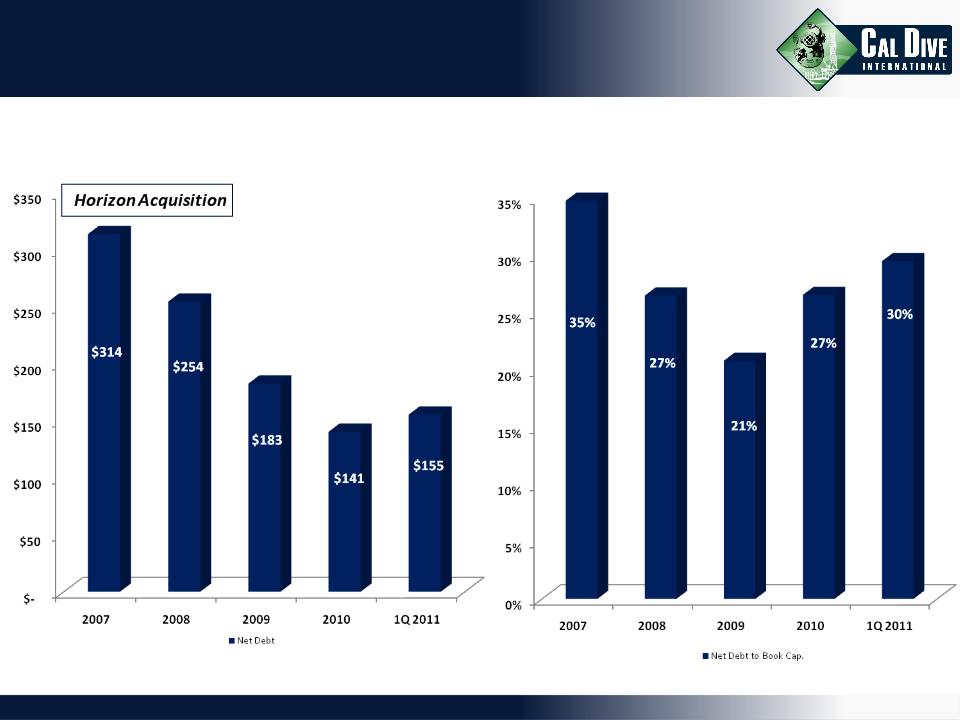
Debt Levels
9
|
Net Debt Levels (1)
|
|
Net Debt to Book Cap. % (2)
|
($ millions)
(1) Calculated as Total Debt less Cash and Cash Equivalents.
(2) Calculated as Net Debt divided by Stockholders’ Equity plus Net Debt.

Liquidity
10
|
Liquidity Positions
|
($ millions)

11
Credit Facility Renewal
5 year facility: $150 million term loan; $300 million revolver.
Scheduled term loan principal payments significantly reduced.
No payments until June 30, 2012;
$2 million per quarter until June 30, 2013;
$4 million per quarter thereafter until final payment at maturity.
Pricing grid governing both term loan and revolver.
Pricing is 275bps plus LIBOR at current ratio;
Pricing grid subject to leverage ratio ranging from 250-325bps.
Non-GAAP Reconciliations
12
EBITDA Reconciliations
13
|
(all amounts in thousands)
|
|
|
|
1st Quarter
|
||
|
|
|
2011
|
|
2010
|
|
|
|
|
|
|
|
|
($1,338)
|
|
($8,490)
|
|
|
|
|
|
|
|
|
Less: Depreciation & Amortization
|
|
16,876
|
|
18,262
|
|
|
|
|
|
|
|
Less: Non-Cash Stock Comp. Expense
|
|
2,281
|
|
1,783
|
|
|
|
|
|
|
|
Less: Net Interest Expense
|
|
2,027
|
|
2,458
|
|
|
|
|
|
|
|
Less: Provision for Income Taxes
|
|
(3,777)
|
|
(11,864)
|
|
|
|
|
|
|
|
Net Loss
|
|
($18,745)
|
|
($19,129)
|