Attached files
UNITED STATES
SECURITIES AND EXCHANGE COMMISSION
Washington, D.C. 20549
FORM 10-K
|
þ
|
ANNUAL REPORT PURSUANT TO SECTION 13 OR 15(d) OF THE SECURITIES EXCHANGE ACT OF 1934
|
For the fiscal year ended December 31, 2010
or
|
¨
|
TRANSITION REPORT PURSUANT TO SECTION 13 OR 15(d) OF THE SECURITIES EXCHANGE ACT OF 1934
|
For the transition period from to
Commission File Number: 001-33206

CAL DIVE INTERNATIONAL, INC.
(Exact name of registrant as specified in its charter)
|
Delaware
|
61-1500501
|
|
|
(State or other jurisdiction of
incorporation or organization)
|
(I.R.S. Employer
Identification No.)
|
|
|
2500 CityWest Boulevard, Suite 2200
Houston, Texas
(Address of Principal Executive Offices)
|
77042
(Zip Code)
|
(713) 361-2600
Registrant’s telephone number, including area code:
Securities registered pursuant to Section 12(b) of the Act:
|
Common Stock ($.01 par value)
|
New York Stock Exchange
|
|
Title of each class
|
Name of each exchange on which registered
|
Securities registered pursuant to Section 12(g) of the Act: None
Indicate by check mark if the registrant is a well-known seasoned issuer, as defined in Rule 405 of the Securities Act. Yes o No þ
Indicate by check mark if the registrant is not required to file reports pursuant to Section 13 or Section 15(d) of the Act. Yes o No þ
Indicate by check mark whether the registrant (1) has filed all reports required to be filed by Section 13 or 15(d) of the Securities Exchange Act of 1934 during the preceding 12 months (or for such shorter period that the registrant was required to file such reports), and (2) has been subject to such filing requirements for the past 90 days. Yes þ No o
Indicate by check mark whether the registrant has submitted electronically and posted on its corporate website, if any, every Interactive Data File required to be submitted and posted pursuant to Rule 405 of Regulation S-T during the preceding 12 months (or for such shorter period that the registrant was required to submit and post such files). Yes o No o
Indicate by check mark if disclosure of delinquent filers pursuant to Item 405 of Regulation S-K is not contained herein, and will not be contained, to the best of registrant’s knowledge, in definitive proxy or information statements incorporated by reference in Part III of this Form 10-K or any amendment to this Form 10-K. þ
Indicate by check mark whether the registrant is a large accelerated filer, an accelerated filer, a non-accelerated filer, or a smaller reporting company. See definitions of “large accelerated filer,” “accelerated filer” and “smaller reporting company” in Rule 12b-2 of the Exchange Act. (Check one):
|
Large accelerated filer o
|
Accelerated filer þ
|
|
Non-accelerated filer o (Do not
check if a smaller reporting company)
|
Smaller reporting company o
|
Indicate by check mark whether the registrant is a shell company (as defined in Rule 12b-2 of the Act). Yes o No þ
The aggregate market value of the voting and non-voting common equity held by non-affiliates of the Registrant based on the closing sales price of the Registrant’s common stock as of June 30, 2010 was approximately $541 million.
As of February 28, 2011, the Registrant had 95,424,518 shares of common stock outstanding.
DOCUMENTS INCORPORATED BY REFERENCE
Portions of the Registrant’s definitive Proxy Statement for the Annual Meeting of Stockholders to be held on May 10, 2011, are incorporated by reference into Part III of this Form 10-K.
TABLE OF CONTENTS
|
Page
|
||
|
1
|
||
|
1
|
||
|
12
|
||
|
21
|
||
|
21
|
||
|
23
|
||
|
23
|
||
|
24
|
||
|
24
|
||
|
26
|
||
|
27
|
||
|
36
|
||
|
37
|
||
|
60
|
||
|
60
|
||
|
62
|
||
|
62
|
||
|
62
|
||
|
62
|
||
|
62
|
||
|
62
|
||
|
62
|
||
|
62
|
||
|
64
|
||
|
66
|
PART I
Cautionary Statement for Purposes of the “Safe Harbor” Provisions of the Private Securities Litigation Reform Act of 1995
This annual report contains or incorporates by reference statements that constitute “forward-looking statements” within the meaning of the Private Securities Litigation Reform Act of 1995. Our forward-looking statements express our current expectations or forecasts of possible future results or events, including projections of future performance, statements regarding our future financial position, business strategy, budgets, projected costs and savings, forecasts of trends, and statements of management’s plans and objectives and other matters. These forward-looking statements do not relate strictly to historic or current facts and often use words such as “may,” “will,” “expect,” “intend,” “estimate,” “anticipate,” “believe” or “continue” and other words and expressions of similar meaning. Although we believe that the expectations reflected in such forward-looking statements are reasonable, we give no assurance that such expectations will be realized or achieved in the future. Important factors that could cause actual results to differ materially from our expectations are disclosed under Item 1A “Risk Factors” and elsewhere in this annual report. Forward-looking statements speak only as of the date of this annual report, and we undertake no obligation to update or revise such forward-looking statements to reflect new circumstances or unanticipated events as they occur.
Unless the context otherwise requires, references in this annual report to (i) “the company,” “our company,” “the registrant,” “we,” “our,” “us,” “CDI” and “Cal Dive International” means Cal Dive International, Inc. and its subsidiaries, and (ii) “Helix” means Helix Energy Solutions Group, Inc., our former parent corporation. Please refer to the subsection “— Certain Definitions” on page 11 for definitions of additional terms used in this annual report.
Overview
We are a marine contractor that provides manned diving, pipelay and pipe burial, platform installation and platform salvage services to a diverse customer base in the offshore oil and natural gas industry. We offer our customers these complementary services on an integrated basis for more complex subsea projects, which provides them with greater efficiency in the completion of their work, while enhancing the utilization of our fleet. Our headquarters are located in Houston, Texas.
Our global footprint encompasses operations in the Gulf of Mexico Outer Continental Shelf (or “OCS”), the Northeastern U.S., Latin America, Southeast Asia, China, Australia, the Middle East, India and the Mediterranean. We currently own and operate a diversified fleet of 29 vessels, including 19 surface and saturation diving support vessels, six pipelay/pipebury barges, one dedicated pipebury barge, one combination derrick/pipelay barge and two derrick barges.
We were organized in February 2006 as a Delaware corporation to facilitate the transfer to us by Helix of its shallow water marine contracting business. Previously, we were an unincorporated division of Helix. In December 2006, we completed an initial public offering of approximately 22 million shares of our common stock, which we listed on the New York Stock Exchange under the symbol “DVR.” Upon completion of our initial public offering, Helix’s percentage ownership interest declined to approximately 74% of our outstanding common stock.
On December 11, 2007, we completed an acquisition of Horizon Offshore, Inc. (or “Horizon”), with Horizon becoming our wholly-owned subsidiary. We issued approximately 20.3 million shares of common stock and paid approximately $300 million in cash to the former Horizon stockholders upon completion of the acquisition. After giving effect to the additional shares issued in connection with the Horizon transaction, Helix’s percentage ownership interest further declined to approximately 58.5% of our outstanding common stock.
As of December 31, 2008, Helix owned 61,506,691 shares, or 57.2%, of our common stock. During 2009, Helix reduced its ownership to 500,000 of our shares, or less than 1% of our common stock, at December 31, 2009, by completing the following transactions:
|
·
|
We repurchased and retired approximately 15.2 million shares of our common stock from Helix in two separate transactions for $100 million, or a weighted average price of $6.57 per share. We funded the share repurchase by borrowing $100 million under our revolving credit facility.
|
|
·
|
Helix sold 45.8 million shares of our common stock to third parties in two separate secondary public offerings. We did not receive any proceeds from Helix’s sale of our common stock.
|
Our Services
The origin of our business traces historically to California Divers Inc., which pioneered the use of mixed gas diving in the early 1960s when oilfield exploration off the Santa Barbara coast moved to water depths below 250 feet. We commenced operations in the Gulf of Mexico OCS in 1975, and since that time, our principal business has been centered in this region through the provision of essential marine contracting services to support the entire production lifecycle of the offshore oil and natural gas industry (including subsea services on production platforms, risers, subsea production systems and pipelines). Our customers include major and independent oil and natural gas producers, pipeline transmission companies and offshore engineering and construction firms.
Our diversified fleet allows us to offer services in the early, middle and late phases of the production lifecycle of the offshore oil and natural gas industry. The early phase of infrastructure installation includes pipeline installation and trenching, shore approaches, tie-ins, and platform installations, the middle phase of production and well remediation includes inspection, repairs, and maintenance, and the late phase of decommissioning and salvage includes pipeline P&A and removal, platform removal and well P&A. Customer spending for the early infrastructure stage is more sensitive to changes in commodity prices as compared to spending for the middle and late phases which is less discretionary in nature.
Our diving services include saturation, surface and mixed gas diving. Collectively, these enable us to provide a full complement of manned diving services to our customers in water depths of up to 1,000 feet. We provide our saturation diving services in water depths of 200 to 1,000 feet through our fleet of eight saturation diving vessels and nine portable saturation diving systems. A number of these vessels have capabilities such as dynamic positioning (or “DP”), hyperbaric rescue chambers, multi-chamber saturation diving systems to accommodate operations at multiple depths and moon pool deployment, which allow us to operate effectively in a variety of challenging offshore environments. We also provide surface and mixed gas diving services in water depths that are typically less than 300 feet through our 11 surface diving vessels. We believe that our fleet of diving support vessels is the largest in the world.
We also provide pipelay and pipebury services with our six pipelay/pipebury barges. These barges install, bury and repair pipelines with outside diameters of up to 36 inches, and employ conventional S-lay technology that is appropriate for operating on the Gulf of Mexico OCS and the international areas where we currently operate.
Conventional S-lay pipeline installation involves the sequential assembly of pipe segments through an assembly line of welding stations that run the length of the pipelay vessel. Welds are then inspected and coated on the deck of the pipelay barge. The pipe is then offloaded off the stern and into the water via a ramp that is referred to as a “stinger.” The stinger, which supports the pipe as it is lowered into the water, prevents over-stressing as the pipe curves into a horizontal position toward the sea floor. The barge is then moved forward by its anchor winches and the pipeline is laid on the sea floor. The suspended pipe forms an elongated “S” shape as it undergoes a second bend above the point where contact is made with the sea floor. Pipelay and pipe burial operations also typically require extensive use of our diving services with divers regularly inspecting the pipeline while it is being laid.
The Bureau of Ocean Energy Management, Regulation and Enforcement (“BOEMRE”), formerly the Minerals Management Service, requires pipelines installed on the Gulf of Mexico OCS in water depths of 200 feet or less to be buried at least three feet below the sea floor. Jet sleds, which are either self-propelled or towed behind pipelay/pipebury barges, are used to bury pipelines. Jet sleds use a high-pressure stream of water that is pumped from the barge to create a trench in the sea floor into which the pipe settles. For larger pipe burying projects, or where a deeper trench is required, we typically use our dedicated pipebury barge. We also own and operate a pipeline plow which we use to bury pipelines in areas where the use of jet sleds is not allowed due to environmental concerns.
We also provide platform installation and salvage services using our two derrick barges, each of which is equipped with cranes designed to lift and place platforms, structures or equipment into position for installation. In addition, our derrick barges are used to disassemble and remove platforms and prepare them for salvage or refurbishment. Our two derrick barges have lift capacities of 1,000 and 500 tons, respectively. We also have a combination derrick/pipelay vessel with a lift capacity of 1,200 tons, which we use to install up to 36” diameter pipe, and to install and remove offshore fixed platforms.
Because of our broad range of complementary service capabilities, we are able to offer a full range of these services on an integrated basis for more complex subsea projects. We believe the combination of scheduling flexibility available to us by virtue of our large diversified fleet of vessels, the wide range of capabilities of our assets and the advanced technical skills of our personnel distinguishes us from our competitors and makes us a leading marine contracting service provider.
Geographic Areas
Revenues by geographic area were as follows for the past three fiscal years (in thousands):
|
Year Ended December 31,
|
||||||||||||||||||||||||
|
2010
|
%
|
2009
|
%
|
2008
|
%
|
|||||||||||||||||||
|
United States
|
$ | 426,245 | 79% | $ | 555,413 | 67% | $ | 605,991 | 71% | |||||||||||||||
|
International
|
110,223 | 21% | 273,949 | 33% | 250,915 | 29% | ||||||||||||||||||
| $ | 536,468 | 100% | $ | 829,362 | 100% | $ | 856,906 | 100% | ||||||||||||||||
We strategically evaluate the deployment of our assets and globally reposition vessels based on the demands of our clients and the markets in which they operate. As of December 31, for the years presented, the physical location of net property and equipment by geographic area was as follows (in thousands):
| As of December 31, | ||||||||||||||||
| 2010 | % | 2009 | % | |||||||||||||
| United States | $ | 401,771 | 71 | % | $ | 429,937 | 71 | % | ||||||||
| International | 166,020 | 29 | % | 179,296 | 29 | % | ||||||||||
| $ | 567,791 | 100 | % | $ | 609,233 | 100 | % | |||||||||
Our Industry
Marine contracting is cyclical and typically driven by actual or anticipated changes in oil and natural gas prices and capital spending by upstream producers. Historically, sustained high commodity prices have led to increases in expenditures for offshore drilling and completion activities and, as a result, greater demand for our services. However, a prolonged worldwide recession beginning in 2008 that has only recently shown signs of recovery has resulted in a decrease in worldwide demand for hydrocarbons, causing many oil and natural gas companies to curtail capital spending for exploration and development.
Further compounding the negative effects from the sustained global recession that lasted through mid-2010 is the aftermath of the April 2010 Macondo well disaster in the Gulf of Mexico, which continues to significantly and adversely affect oil and gas exploration activities in the Gulf of Mexico and has increased uncertainty in the market and regulatory environment for our industry. We anticipate the cumulative effect of these factors will likely have a negative effect on our customers’ spending level for some time, the duration of which is generally unknown. However; we believe the long-term outlook for our business remains favorable in both domestic and international markets as capital spending will be required to replenish oil and natural gas production, and for industry participants to satisfy new “idle iron” regulations and other directives promulgated by BOEMRE regarding the decommissioning of offshore platforms and pipelines. We expect all of these factors to continue to drive long-term demand for our services.
Key Indicators
Commodity prices. Our business is dependent upon the level of capital expenditures by oil and natural gas companies for offshore exploration, development and production operations. The willingness of oil and natural gas companies to make capital expenditures for exploration and development is generally dependent upon oil and natural gas prices, which can have considerable volatility. The majority of our customers on the Gulf of Mexico OCS drill for, produce and transport natural gas. If natural gas prices remain at their current reduced levels (as compared to those realized during 2008) for a sustained period, we would expect a negative impact on our business. The following table sets forth U.S. oil and natural gas prices for the last three years:
|
Year Ended December 31,
|
Increase/(Decrease)
|
|||||||||||||||||||||||||||
|
2010
|
2009
|
2008
|
2010 to 2009
|
2009 to 2008
|
||||||||||||||||||||||||
|
U.S. natural gas price (1)
|
$ | 4.37 | $ | 3.94 | $ | 8.86 | $ | 0.43 | 11% | $ | (4.92 | ) | (56%) | |||||||||||||||
|
Nymex oil price(2)
|
$ | 79.61 | $ | 62.09 | $ | 99.75 | $ | 17.52 | 28% | $ | (37.66 | ) | (38%) | |||||||||||||||
_______________________
|
(1)Annual average of the Henry Hub Gulf Coast natural gas spot price per Mmbtu as reported by U. S, Energy Information Administration Independent Statistics and Analysis as of February 9, 2011.
|
|
(2)Annual average of Cushing, OK West Texas Intermediate crude oil daily spot price per barrel, as reported by U. S, Energy Information Administration Independent Statistics and Analysis as of February 9, 2011.
|
Drilling activity. Demand for our new construction services generally lags behind successful drilling activity by a period of six to 18 months and can be longer. While demand for our marine contracting services typically has a high correlation with offshore rig counts, increases in subsea project complexity and capital spending per project as well as demand for hurricane-related repair work also impact utilization and day rates. The following table details worldwide and Gulf of Mexico rig count and utilization, and Gulf of Mexico platform installations and removals for the last three years:
|
Year Ended December 31,
|
Increase/(Decrease)
|
|||||||||||||||
|
2010
|
2009
|
2008
|
2010 to 2009
|
2009 to 2008
|
||||||||||||
|
Worldwide jackup and drill barge rig count(1)
|
514
|
495
|
474
|
19
|
4%
|
21
|
4%
|
|||||||||
|
Worldwide jackup and drill barge rig utilization(2)
|
68%
|
73%
|
85%
|
(5%)
|
(7%)
|
(12%)
|
(14%)
|
|||||||||
|
Gulf of Mexico jackup and drill barge rig count(1)
|
80
|
74
|
81
|
6
|
8%
|
(7)
|
(9%)
|
|||||||||
|
Gulf of Mexico jackup and drill barge rig utilization(2)
|
44%
|
43%
|
75%
|
1%
|
3%
|
(32%)
|
(43%)
|
|||||||||
|
Gulf of Mexico platform installations(3)
|
23
|
29
|
75
|
(6)
|
(21%)
|
(46)
|
(61%)
|
|||||||||
|
Gulf of Mexico platform removals(3)
|
161
|
221
|
151
|
(60)
|
(27%)
|
70
|
46%
|
|||||||||
______________________
|
(1)
|
Source: RigLogix.com; represents annual average of contracted jackup and drill barge rigs as of February 14, 2011.
|
|
(2)
|
Source: RigLogix.com; represents annual average of rig-by-rig utilization of jackup and drill barge rigs as of February 14, 2011.
|
|
(3)
|
Source: Bureau of Ocean Energy Management, Regulation and Enforcement as of February 14, 2011, subject to change due to periodic updates.
|
Our Competitive Strengths
Our competitive strengths include:
|
·
|
Leader in the Gulf of Mexico OCS diving services market. We believe the size and diversified capabilities of our fleet, and our workforce of approximately 1,300 diving and marine personnel, make us the market leader for diving services on the Gulf of Mexico OCS and contribute to our significant share of diving services contracts in this market.
|
|
·
|
Diversified operating capabilities provide clients with an integrated solution. We offer a comprehensive range of complementary manned diving, pipelay and pipe burial and derrick barge services. Because of the diving support typically required to facilitate pipeline and platform installation and decommissioning work, we often seek to enter into contracts to provide a full range of these services on an integrated basis for a particular project. We believe this approach makes us more accountable to our customers and allows for a more seamless transition between phases of a project. In addition, our ability to provide these services on an integrated basis for our customers enhances utilization of our fleet and gives us greater control over operational and commercial risks than we would otherwise possess if we subcontracted a significant portion of the scope of such work to third parties.
|
|
·
|
Highly skilled workforce. The quality of our workforce has been, and will continue to be, a vital contributor to our success. We invest significant resources in training programs to ensure that our divers, offshore workforce and support staff have the best technical, operational and safety skills in the industry. This investment in our workforce enhances our ability to deliver innovative solutions to our customers. In addition, we have been successful with retention of our employees because of the leadership position we hold in our markets. Employee retention is a significant challenge in our industry given the intense competition for skilled labor. Industry practice, which we follow, is to compensate divers based on their logged diving time, and we believe that divers and others are strongly incentivized to work for us because of our high vessel utilization and our proven operating history. We believe these factors, along with our commitment to effective training and safety, has enabled us to attract and retain a strong core of skilled employees.
|
|
·
|
Excellent, long-standing customer relationships. We have built a reputation as a premier marine contractor during more than 35 years of operating in the Gulf of Mexico. We have developed a large and stable customer base (comprised of some of the largest energy producers in the world), by consistently providing superior and comprehensive services on schedule while maintaining a strong safety track record.
|
|
·
|
Successful acquisition track record. We have a proven track record of identifying and executing acquisitions that complement our fleet and workforce and enhance our service capabilities. For example, in December 2007 we acquired Horizon. This acquisition added eight construction barges and one multi-service vessel to our fleet, and significantly enhanced our pipelay and pipe burial, installation, decommissioning and salvage services capabilities. We attribute much of the growth of our business to our successful acquisitions, and we believe that acquisitions will remain a key element of our growth strategy. Furthermore, we believe that our ability to integrate acquisitions efficiently is one of our core organizational competencies. We have consistently demonstrated the ability to add to our revenue base and retain key personnel from acquired businesses, while improving project performance by leveraging our existing cost structure.
|
|
·
|
Proven management team with extensive experience in the marine contracting business. Most of our executive officers and senior managers have spent the majority of their respective careers in the marine contracting business, working at various levels of the industry in the Gulf of Mexico and internationally. This senior management team, which has an average of 25 years of industry experience, includes recognized leaders in diving services and offshore marine construction. We believe the knowledge and experience of our management team provide us with a valuable competitive strength.
|
Our Business Strategy
The principal elements of our strategy include:
|
·
|
Focus on securing contracts for projects requiring integrated diving and marine construction services. Our business strategy is focused on securing contracts for substantial integrated projects that require both our diving and marine construction services. The integration of these services enhances the utilization of our fleet and maximizes efficiencies in project completion at a qualified lump sum price for our customers. We significantly expanded our operating capabilities to perform such projects through our December 2007 acquisition of Horizon, and we continue to seek to maintain our leadership position in the marine construction market by enhancing the capabilities of our existing assets, opportunistically acquiring complementary assets or businesses and continuing to provide a high level of customer service. Although there were significantly fewer large, complex, integrated projects for us to bid on in 2010, late in the year we were awarded a contract and commenced work on a project for the removal of a large jetty and installation of a new platform and 11 pipelines in Freeport, Bahamas. The project is expected to generate revenues of approximately $59.9 million and is utilizing one pipelay barge, one derrick barge and one of our four-point DSVs.
|
|
·
|
Increase our presence in high-growth international markets. Our business strategy also includes increasing our penetration into several international regions such as Latin America, the Middle East, Southeast Asia, China, India and Australia. We believe these regions offer promising long-term growth opportunities due to anticipated future increases in upstream capital spending in these markets and the highly fragmented nature of our competition currently engaged in these regions. We continually evaluate potential projects, strategic alliances and acquisition opportunities that could strengthen our presence and competitive position internationally. In 2010, we experienced intense competition in our primary international markets due to increased capacity placed into service. Additionally, there were significantly fewer projects let out for bid in Mexico, and we were not the successful bidder on any of them. However, in the first quarter of 2010, we were awarded a contract by a specialty horizontal drilling company in association with the Gorgon Project in Australia, which is expected to generate revenues of approximately $23 million and involve project management and diving support services. The project was initially expected to commence in the fourth quarter of 2010, and is now expected to commence in the first quarter of 2011. In February 2011, we also were awarded a project in Mexico for the installation of a 20” subsea pipeline located in the Abkatun Field in 24 meters of water. We expect the lump-sum contract to generate total revenue of approximately $24 million. The project will utilize one pipelay barge and one DP saturation diving vessel and will commence in the second quarter of 2011.
|
|
·
|
Capitalize on potential increased demand for decommissioning and salvage services. In September 2010, BOEMRE issued a “Notice to Lessees” requiring lessees of platforms in the Gulf of Mexico OCS to plug all wells that have been idle for the past five years and decommission related equipment. These lessees were given until mid-February 2011 to submit company-wide plans for decommissioning these facilities and wells. We believe these regulations will increase demand for our salvage and decommissioning services and have a positive impact on our business, operations and revenues.
|
|
·
|
Continue to attract, develop and retain highly skilled personnel. Our market leadership and future growth plans depend upon our ability to employ the most highly-skilled divers, offshore workforce and support staff in the industry. As stated above, we have historically invested, and intend to continue to invest significant resources in our workforce. These investments ensure our employees are vested with a superior knowledge base and appropriate skills relevant to offshore construction operations and safety, and facilitates their long-term career development. In January 2011, we launched “Cal Dive College” with dedicated training centers located at our Fourchon, Louisiana and Port Arthur, Texas docks, as well as our Broussard, Louisiana operating facility. These training centers offer courses on Cal Dive policies and procedures, our safety mission, career development and advancement and leadership skills in locations that are more accessible and convenient to our entire workforce, including our offshore workers. We will also continue our practice of structuring compensation and benefit plans that are competitive with our peers and properly incentivize our workforce.
|
|
·
|
Optimize our mix of dayrate and qualified lump-sum work. We seek to optimize the allocation of our resources between dayrate and qualified lump-sum work in order to diversify our sources of revenue and enhance overall profitability. We believe that this strategy allows us to respond effectively to the increasing demand from larger customers for integrated solutions while ensuring that a segment of our fleet is positioned to capitalize on attractive opportunities in the spot market. If warranted by a change in business conditions, we have the ability to adjust our allocation of resources.
|
Seasonality
As a marine contractor with significant operations in the Gulf of Mexico, our vessel utilization is typically lower during the winter and early spring due to unfavorable weather conditions in the Gulf of Mexico. As is common in the industry, we typically bear the risk of delays caused by some, but not all, adverse weather conditions. We believe that the technological capabilities of our fleet and our ability to operate effectively in challenging offshore environments provides an advantage during winter months and reduces the impact of weather-related delays. We pursue business opportunities in international areas that we believe will partially offset the seasonality of our operations in the Gulf of Mexico OCS or where upstream capital spending is anticipated to increase and independently offer promising long-term growth opportunities for our business.
Customers
Our customers include major and independent oil and natural gas producers, pipeline transmission companies and offshore engineering and construction firms. The level of marine contracting capital spending by customer varies from year to year due to the concentrated nature of construction and installation expenditures and the unpredictability of repair work. Consequently, customers that account for a significant portion of contract revenues in one fiscal year may represent an immaterial portion of contract revenues in subsequent fiscal years. The percent of consolidated revenue of major customers that accounted for 10% or more of our consolidated revenues for each of the last three years was as follows: 2010 — Chevron Corporation 16%, BP Exploration and Production 13% and Apache Corporation 10%; 2009 — Chevron Corporation 13%; and 2008 — GDF Suez 14%, Helix 13% and Chevron Corporation 11%. We provided marine contracting services to over 75 customers in 2010.
Backlog
As of December 31, 2010, our backlog supported by written agreements or contract awards totaled approximately $191.5 million, compared to approximately $183.0 million as of December 31, 2009. A majority of our current backlog is expected to be performed during 2011, with $45.2 million expected to be performed in 2012 and beyond. The contracts included in our backlog are cancellable without penalty in most cases. Backlog is not a reliable indicator of total annual revenues because it does not include the substantial portion of our revenues that is derived from the spot market.
Contracting and Tendering
Our services are performed under contracts that are typically awarded through a competitive bid process. Contract terms vary depending on the services required and are often determined through negotiation. Most of our contracts can be categorized as either dayrate or qualified lump-sum. Under dayrate contracts, we are paid a daily rate, which consists of a base rate for our vessel and crews as well as cost reimbursements for materials and ancillary activities, for as long as we provide our services. Qualified lump-sum contracts, on the other hand, define the services that we will provide for an agreed upon fixed price and certain cost protections. This type of contract is most commonly used for complex subsea projects where the customers desire greater control over costs.
We seek to optimize our mix of dayrate and qualified lump-sum contracts based on prevailing market conditions. As part of that effort, we also attempt to strike the appropriate balance between short-term and long-term dayrate contracts. Our goal is to diversify our sources of revenue while maximizing profitability in a given business environment.
Our historical acquisitions have also diversified our operating capabilities and enable us to offer a comprehensive range of manned diving, pipelay and pipe burial services, and derrick barge services. Because of the diving support typically required to facilitate pipeline and platform installation and decommissioning work, we often seek to enter into contracts to provide a full range of these services on an integrated basis for a particular project. We believe this approach makes us more accountable to our customers and allows for a more seamless transition between phases of the project. In addition, our ability to provide these services on an integrated basis for our customers enhances utilization of our fleet and gives us greater control over operational and commercial risks that we would otherwise possess if we subcontracted a significant portion of the scope of work to third parties.
Competitors
The marine contracting business is highly competitive. Competition for marine contracting work in the markets we serve has historically been based on price, the location and type of equipment available, the ability to deploy such equipment and the safety and quality of such services. In recent years, price has been the primary factor in obtaining contracts, but our ability to acquire specialized vessels, to attract and retain skilled personnel, and to demonstrate a good safety record have also been important competitive factors.
Our principal competitors for diving services on the Gulf of Mexico OCS include Global Industries, Ltd. (“Global”), Tetra Technologies Inc. (through its wholly-owned subsidiary, Epic Divers & Marine, L.L.C.) (“Tetra”) and Oceaneering International, Inc., as well as a number of smaller companies that often compete solely on price. Based on the size of our fleet, we are the largest saturation and surface diving service provider on the Gulf of Mexico OCS.
Our principal competitors for shallow water pipelay services on the Gulf of Mexico OCS include Global, Chet Morrison Contractors, Inc., Bisso Marine Co. and several smaller companies. Because shallow water marine construction activities generally are less complex and involve lower upfront capital expenditures, there are a number of companies with one or more pipelay barges capable of installing pipelines in shallow water.
For the installation and removal of production platforms, we compete primarily with Offshore Specialty Fabricators, Inc., Global, Superior Energy Services, Inc., Tetra and several smaller companies. We believe that our reputation, asset capabilities, highly experienced personnel and low-cost structure are key advantages for us in this market.
Internationally, the marine construction industry is comprised of a small number of major international construction companies, government owned or controlled companies and smaller indigenous companies that operate in specific areas. International contracts are typically awarded on a competitive bid basis and generally have longer lead times than those on the Gulf of Mexico OCS. Our major competitors internationally are Global, J. Ray McDermott, S.A., Swiber Offshore Construction Pte. Ltd., Protexa S.A. de C.V. and several local competitors.
Employees
As of December 31, 2010, we had approximately 1,900 employees, approximately 69% of whom work offshore and approximately 31% of whom work onshore. In addition, throughout the year we also contracted with third parties to provide approximately 230 offshore workers. None of our employees belong to a union or are employed pursuant to any collective bargaining agreement or any similar arrangement. We believe we have a good relationship with our employees.
Training and Safety
Assuring the safety of our workforce is one of our core values. Our goal, based upon the belief that all incidents are preventable, is to provide an incident and injury-free workplace by emphasizing the importance of safe behavior by our employees. Our behavioral safety procedures and training programs were developed by management personnel who started their careers working in the offshore industry, and who have firsthand knowledge of the mental and physical challenges of the offshore and subsea worksite. As a result, we believe that our overall safety management system is among the best in the industry. Nevertheless, we are constantly engaged in a company-wide effort to enhance our behavioral safety procedures and training programs with a constant focus on awareness and open communication between management and all offshore and onshore employees. We currently document all daily observations and analyze data both at the immediate worksite and at the corporate level. Worksite condition inspections, known as “Hazard Hunts,” are conducted with required “actions by” and close out dates. Annual progressive audits are carried out throughout our fleet, facilities and worksites by our environmental, health and safety department to provide an avenue of understanding and mechanism to identify training requirements throughout our diverse fleet. Management site visits are conducted regularly to assist in face to face communication across the fleet. In January 2011, we launched “Cal Dive College” with dedicated training centers located at our Fourchon, Louisiana and Port Arthur, Texas docks, as well as our Broussard, Louisiana operating facility. These training centers offer courses on Cal Dive policies and procedures, our safety mission, career development and advancement and leadership skills in locations that are more accessible and convenient to our entire workforce, including our offshore workers.
Government Regulation
The marine contracting industry is subject to extensive governmental and industry rules and regulations, including those of the U.S. Coast Guard, the National Transportation Safety Board, the U.S. Environmental Protection Agency, BOEMRE, International Safety Management and the U.S. Customs Service. We comply with the requirements of applicable Classification Societies, including the American Bureau of Shipping, Det Norske Veritas, Lloyd’s Register and Bureau Veritas. We also support and voluntarily comply with standards of the Association of Diving Contractors International, and the International Marine Contractors Association. Among the more significant standards we follow are those established by the U.S. Coast Guard, which sets safety standards, authorizes investigations into vessel and diving accidents and recommends improved safety standards. We are required by various other governmental and quasi-governmental agencies to obtain various permits, licenses and certificates with respect to our vessels and operations.
In addition, we depend on the demand for our services from the oil and natural gas industry. As a result, our business is affected by laws and regulations, as well as changing tax regulations and policies relating to the oil and natural gas industry generally. In particular, the development and operation of oil and natural gas properties located on the OCS of the United States is regulated primarily by BOEMRE. Because our operations rely on offshore oil and natural gas production, if the government were to restrict the availability of offshore oil and natural gas leases, such action could materially adversely affect our business, financial condition and results of operations.
Certain of our employees are also covered by provisions of the Jones Act, the Death on the High Seas Act and general maritime laws. These laws make liability limits under state workers’ compensation laws inapplicable and permit these employees to bring suit for job related injuries with generally no limits on our potential liability.
Environmental Regulation
Our operations are subject to a variety of federal, state and local as well as international laws and regulations governing environmental protection, health and safety, including those relating to climate change and the discharge of materials into the environment. Numerous governmental departments issue rules and regulations to implement and enforce laws that are often complex and costly to comply with and that carry substantial administrative, civil and possibly criminal penalties for noncompliance. Under these laws and regulations, we may be liable for remediation or removal costs, damages, including damages to natural resources, and other costs associated with releases of hazardous materials, including oil, into the environment, and such liability may be imposed on us even if the acts that resulted in the releases were in compliance with all applicable laws at the time such acts were performed. Some of the environmental laws and regulations that are applicable to our business operations are discussed below.
Legislation to regulate emissions of greenhouse gases has been introduced in Congress, and there has been a wide-ranging policy debate, both nationally and internationally, regarding the impact of these gases and possible means for their regulation. In 2009 the U.S. House of Representatives approved adoption of the “American Clean Energy and Security Act of 2009” to control and reduce greenhouse gas emissions in the U.S. In addition, the Environmental Protection Agency (“EPA”) has undertaken new efforts to collect information regarding greenhouse gas emissions and their effects. The EPA declared that certain greenhouse gases represent a danger to human health and proposed to expand its regulations relating to those emissions.
Efforts continue to be made in the international community toward the adoption of international treaties or protocols that would address global climate change issues, such as the United Nations Climate Change Conference in Copenhagen in 2009. While we cannot determine to what extent our future operations may be affected by such legislation, to the extent it would prohibit or restrict offshore drilling or impose additional environmental protection requirements resulting in increased costs to the oil and gas industry, our business could be adversely affected. We continue to monitor these regulations and their potential affect on both our business and the industry in which we operate.
The Oil Pollution Act of 1990, as amended (“OPA”), imposes a variety of requirements on “Responsible Parties” related to the prevention of oil spills and liability for damages resulting from such spills in waters of the United States. A “Responsible Party” includes the owner or operator of an onshore facility, a vessel or a pipeline, and the lessee or permittee of the area in which an offshore facility is located. OPA imposes liability on each Responsible Party for oil spill removal costs and for other public and private damages from oil spills. Failure to comply with OPA may result in the assessment of civil and criminal penalties. OPA establishes liability limits of $350 million for onshore facilities, all removal costs plus $75 million for offshore facilities and the greater of $600 per gross ton or $500,000 for vessels other than tank vessels. The liability limits are not applicable, however, if (i) the spill is caused by gross negligence or willful misconduct, (ii) results from violation of a federal safety, construction, or operating regulation; or (iii) if a party fails to report a spill or fails to cooperate fully in the cleanup. Few defenses exist to the liability imposed under OPA.
OPA also imposes ongoing requirements on a Responsible Party, including preparation of an oil spill contingency plan and maintenance of proof of financial responsibility to cover a majority of the costs in a potential spill. With respect to financial responsibility, OPA requires the Responsible Party for certain offshore facilities to demonstrate financial responsibility of not less than $35 million, with the financial responsibility requirement potentially increasing up to $150 million if the risk posed by the quantity or quality of oil that is explored for or produced indicates that a greater amount is required. BOEMRE has promulgated regulations implementing these financial responsibility requirements for covered offshore facilities. Under the BOEMRE regulations, the amount of financial responsibility required for an offshore facility is increased above the minimum amounts if the “worst case” oil spill volume calculated for the facility exceeds certain limits established in the regulations.
OPA also requires owners and operators of vessels over 300 gross tons to provide the U.S. Coast Guard with evidence of financial responsibility to cover the cost of cleaning up oil spills from such vessels. We currently own and operate 18 vessels over 300 gross tons. Satisfactory evidence of financial responsibility has been provided to the U.S. Coast Guard for all of our vessels.
The Federal Water Pollution Control Act (the “Clean Water Act”), and analogous state laws impose strict controls on the discharge of pollutants, including oil and other substances, into the navigable waters of the United States and state waters and impose potential liability for the costs of remediating releases of such pollutants. The controls and restrictions imposed under the Clean Water Act and analogous state laws have become more stringent over time, and it is possible that additional restrictions will be imposed in the future. Permits must be obtained to discharge pollutants into state and federal waters. Certain state regulations and the general permits issued under the Federal National Pollutant Discharge Elimination System program prohibit the discharge of produced waters and sand, drilling fluids, drill cuttings and certain other substances related to the exploration for and production of oil and natural gas into certain coastal and offshore waters. The Clean Water Act and analogous state laws provide for civil, criminal and administrative penalties for any unauthorized discharge of oil and other hazardous substances and impose liability on responsible parties for the costs of cleaning up any environmental contamination caused by the release of a hazardous substance and for natural resource damages resulting from the release. Our vessels routinely carry diesel fuel for their own use. Offshore vessels operated by us have facility and vessel response plans to deal with potential spills of oil or its derivatives.
The Comprehensive Environmental Response, Compensation, and Liability Act (“CERCLA”), and comparable state laws contains provisions requiring the remediation of releases of hazardous substances into the environment and imposes liability, without regard to fault or the legality of the original conduct, on certain classes of persons including current and former owners and operators of contaminated sites where the release occurred and those companies that transport, dispose of or arrange for disposal of hazardous substances released at the site. Under CERCLA, such persons may be subject to joint and several liability for the costs of cleaning up the hazardous substances that have been released into the environment, for damages to natural resources and for the costs of certain health studies. Neighboring parties and third parties may also file claims for personal injury and property damage allegedly caused by the release of hazardous substances into the environment. In the ordinary course of business, we handle hazardous substances. Governmental agencies or third parties could seek to hold us responsible under CERCLA for all or part of the costs to clean up a site at which such hazardous substances may have been released or deposited.
We have incurred in the past, and expect to incur in the future, capital and other expenditures related to environmental compliance. Such expenditures, however, are included within our overall capital and operating budgets and are not separately accounted for. We do not anticipate that compliance with existing environmental laws and regulations will have a material effect upon our capital expenditures, earnings or competitive position. However, changes in the environmental laws and regulations, or claims for damages to persons, property, natural resources or the environment, could result in substantial costs and liabilities, and thus there can be no assurance that we will not incur material environmental costs or liabilities in the future.
Available Information
Our annual reports on Form 10-K, quarterly reports on Form 10-Q, current reports on Form 8-K and amendments to those reports filed or furnished pursuant to Section 13(a) or 15(d) of the Securities Exchange Act of 1934 are available free of charge on our website at www.caldive.com as soon as reasonably practicable after we electronically file such reports with, or furnish them to, the Securities and Exchange Commission (“SEC”). Information contained on our website is not part of this annual report.
Certain Definitions
Defined below are certain terms helpful to understanding the services rendered and equipment utilized in the marine contracting industry:
|
·
|
Dive support vessel (DSV): Specially equipped vessel that performs services and acts as an operational base for divers, ROVs and specialized equipment.
|
|
·
|
Drydock: The process of docking a vessel so that it is fully supported out of the water for the purposes of regulatory certification, inspection, maintenance and repair. Drydocking allows full work access to the vessel hull.
|
|
·
|
Dynamic positioning (DP): Computer-directed thruster systems that use satellite-based positioning and other positioning technologies to ensure the proper counteraction to wind, current and wave forces, enabling the vessel to maintain its position without the use of anchors. Two DP systems (DP-2) are necessary to provide the redundancy required to support safe deployment of divers, while only a single DP system is necessary to support ROV operations.
|
|
·
|
4 point mooring: A mooring system that uses four anchors, which are spooled out to the sea floor by deck-mounted anchor winches, to secure a vessel in open waters.
|
|
·
|
Gulf of Mexico OCS: The Outer Continental Shelf in the Gulf of Mexico, defined as the area in the Gulf of Mexico extending from the shoreline to water depths up to 1,000 feet.
|
|
·
|
Hyperbaric rescue chamber (HRC): An additional chamber, connected to the saturation diving system, that acts as a floating pressurized lifeboat in the event of a vessel emergency.
|
|
·
|
Mixed gas diving: Diving technique used in water depths between 170 and 300 feet. The inert nitrogen normally found in air is replaced with helium, which provides longer bottom times at greater depths and eliminates the narcotic effect of nitrogen under pressure.
|
|
·
|
Moon pool: An opening in the bottom center of a vessel through which a diving bell or ROV may be deployed, allowing safer deployment in adverse weather conditions.
|
|
·
|
Multi-purpose support vessel (MSV): A DP DSV that is capable of performing coring and well operations in addition to working in diving and ROV modes.
|
|
·
|
Pipelay and pipe burial: Pipelay barges provide offshore work stations that allow for the welded assembly of multiple sections of pipe on deck and the laying out of the pipeline on the sea floor. In water depths less than 200 feet, U.S. federal law requires that the pipeline be buried at least three feet below the sea floor. Pipeline burial is accomplished by plowing or jetting out a trenched ditch from under the pipeline.
|
|
·
|
Portable saturation diving system: Saturation diving system that is transportable to various offshore locations. These systems are typically deployed on barges and rigs that do not consistently require deep dive support.
|
|
·
|
Qualified lump-sum: A lump-sum bid sent in response to a client’s request for quote that sets forth a defined scope of work, a lump-sum price to complete that work, extra work rates for anything outside the defined scope of work and a list of clarifications and qualifications applicable to the project or contract.
|
|
·
|
Remotely operated vehicle (ROV): Robotic vehicles used to complement, support and increase the efficiency of diving and subsea operations and for tasks beyond the capability of manned diving operations.
|
|
·
|
Saturation diving: Provides for efficient work time on the sea floor in water depths between 200 and 1,000 feet. Divers stay under pressure in a vessel-mounted chamber and are transported to the sea floor in a diving bell. One-time decompression is conducted after completion of the job or a 30-day period, whichever is shorter. A split-level saturation diving system has an additional chamber that allow extra divers to “store” at a different pressure level, which allows the divers to work at different depths.
|
|
·
|
Surface diving: Diving operations conducted in shallower waters, typically limited to depths of approximately 170 feet. At greater depths, bottom times become limited and decompression times increase significantly. Compressed air and communications are supplied to the diver through a dive umbilical tethered to the surface. Based on factors of depth and time, divers must decompress after each dive.
|
|
·
|
Surface diving system: Dive equipment components required for air or gas surface diving operations, which typically includes air compressors, dive hoses, communication radios, air/gas manifolds and decompression chambers.
|
You should carefully consider the risk factors described below in addition to the other information contained or incorporated by reference in this annual report. In addition to the following risk factors, we may also be affected in the future by additional risks and uncertainties not presently known to us or that we currently believe are immaterial. If any of the events described in the following risk factors and elsewhere in this annual report occur, our business, financial condition and results of operations could be materially and adversely affected. In addition, the trading price of our common stock could decline due to any of the events described in these risk factors.
Risks Relating to Our Business
The Macondo well blowout in the Gulf of Mexico could have a significant impact on exploration and production activities in United States coastal waters that could adversely affect demand for our services.
As has been widely publicized, in April 2010, the Deepwater Horizon rig, engaged in deepwater drilling operations at the Macondo well in the Gulf of Mexico off the coast of Louisiana, sank after an explosion and fire resulting in the death of 11 workers. Following the explosion, the Macondo well immediately began to discharge hydrocarbons into the Gulf of Mexico until July 15, 2010, when a temporary cap stopped the oil flow. Efforts to permanently seal the well were completed on September 17, 2010.
The catastrophic explosion and the related oil spill in the U.S. Gulf of Mexico has significantly and adversely disrupted oil and gas exploration activities in the Gulf of Mexico, and the likely duration of this disruption is currently unknown. The commission previously appointed by the President to study the causes of the catastrophe and recommend legislative or regulatory measures to be taken in order to minimize the possibility of a reoccurrence of a disastrous oil spill recently released its results and recommendations. Included in the findings of the commission were directives for increasingly stringent oversight by the government (both regulatory and supervisory) regarding spill response and safety matters. On October 12, 2010, the United States Government lifted the moratorium on deep water permitting and drilling. However, with the enhanced safety regulations and inspection requirements of BOEMRE, there continues to be uncertainty surrounding the requirements for and pace of issuance of permits on the Gulf of Mexico OCS. Although exploration activity in the shallow waters of the Gulf of Mexico has been allowed to re-commence since the time the moratorium was lifted, new safety and permitting requirements have been imposed on shallow water operators, only a limited number of new drilling permits have been issued to shallow water operators, and only one deepwater drilling permit has been issued. At the same time, various bills are being considered by Congress which, if enacted, could either significantly increase the costs of conducting drilling and exploration activities in the Gulf of Mexico, particularly in deep waters, or worst case, could drive a substantial portion of drilling and operation activity out of the Gulf of Mexico where the nucleus of our operations are currently focused. After the regulatory landscape becomes clearer, it may be the case that regulatory compliance costs for any future exploration activity will have the effect of limiting exploration to only the largest oil companies, which could significantly reduce the number of customers requiring our services.
Among the uncertainties which have arisen in the aftermath of the Deepwater Horizon explosion include whether (i) Congress will repeal the $75 million cap on non-reclamation liabilities under OPA, (ii) insurance will continue to be available at a reasonable cost and with reasonable policy limits to support drilling and exploration activity in the Gulf of Mexico, and (iii) the overall legislative and regulatory response to the disaster will discourage investment in oil and gas exploration in the Gulf of Mexico.
Negative developments associated with any one or more of these uncertainties could reduce demand for our services and adversely affect our operations in the Gulf of Mexico. However, until the ultimate regulatory response to this disaster becomes more certain, we cannot accurately predict the effect of this catastrophic event on our customers and similarly, the longer term impact on our core business. Any regulatory response that has the effect of materially curtailing drilling and exploration activity in the Gulf of Mexico will ultimately adversely affect our domestic operations in this region.
We have significant indebtedness, which could restrict our operations and impair our financial condition.
We have a five-year senior secured credit facility, consisting of a term loan and a $300 million revolving credit facility, both of which mature on December 11, 2012. At December 31, 2010, we had outstanding debt of $165.3 million under the term loan, no borrowing outstanding under the revolving credit facility and outstanding letters of credit of $0.3 million.
Our significant level of corporate debt may:
|
·
|
reduce the availability of our cash flow or limit our ability to obtain additional financing on satisfactory terms to effectively fund our working capital requirements, capital expenditures, acquisitions, investments, and other general corporate requirements;
|
|
·
|
increase our vulnerability to downturns in the general economy or industry;
|
|
·
|
put us at a competitive disadvantage compared to those of our competitors who are not as leveraged;
|
|
·
|
increase our exposure to rising interest rates because a material portion of our borrowings bear adjustable interest rates; and
|
|
·
|
limit our flexibility in planning for, or reacting to, changes in our business and the industry in which we operate.
|
If our cash flow and capital resources are not sufficient to service our debt obligations, we may be forced to reduce or delay our business activities and capital expenditures, sell assets, seek additional equity or debt capital, or restructure or refinance our debt. These measures might not be adequate to permit us to meet our scheduled debt service obligations. A default on these debt obligations could cause a default under our other debt instruments and materially impair our financial condition and liquidity.
Economic conditions could negatively impact our business.
Our operations are affected by local, national and worldwide economic conditions and the condition of the oil and natural gas industry. The consequences of a lower level of economic activity, decreased offshore exploration and drilling and increased uncertainty regarding energy prices and the capital and commodity markets could have a material adverse effect on the demand for our services. Adverse market conditions could also jeopardize the performance of certain counterparty obligations, including those of our insurers, suppliers, customers and financial institutions. Although we monitor the creditworthiness of our counterparties, any disruptions could lead to sudden changes in a counterparty’s liquidity. In the event any such party fails to perform, our financial results could be adversely affected and we could incur losses and our liquidity could be negatively impacted. These negative economic factors could also result in a future impairment of our long-lived assets.
Our business largely depends on offshore exploration, development and production activity in the oil and natural gas industry.
Our business is substantially dependent upon the condition of the oil and natural gas industry and, in particular, the willingness of oil and natural gas companies to make capital expenditures for offshore exploration, development and production operations. The level of capital expenditures generally depends on the prevailing views of future oil and natural gas prices, which are influenced by numerous factors, including but not limited to:
|
·
|
changes in United States and international economic conditions;
|
|
·
|
demand for oil and natural gas, especially in the United States, China and India;
|
|
·
|
worldwide political conditions and political actions, particularly in significant oil-producing regions such as the Middle East, West Africa and Latin America which can result in nationalization and seizures of assets;
|
|
·
|
actions taken by the Organization of Petroleum Exporting Countries (“OPEC”);
|
|
·
|
the availability and discovery rate of new oil and natural gas reserves in offshore areas;
|
|
·
|
the rate of decline of existing and new oil and natural gas reserves;
|
|
·
|
the cost of offshore exploration for, and production and transportation of, oil and natural gas, both on an absolute basis and as compared to the exploration and development costs of other regions;
|
|
·
|
the ability of oil and natural gas companies to generate funds or otherwise obtain external capital for exploration, development, construction and production operations;
|
|
·
|
the sale and expiration dates of offshore leases in the United States and overseas;
|
|
·
|
technological advances affecting energy exploration, production, transportation and consumption;
|
|
·
|
weather conditions;
|
|
·
|
environmental or other government regulations (both domestic and foreign), including the promulgation of regulations associated with climate change;
|
|
·
|
domestic and foreign tax policies; and
|
|
·
|
the pace adopted by foreign governments for the exploration, development and production of their oil and natural gas reserves.
|
Oil and natural gas prices have historically been volatile. The institution of additional climate change regulation or negative public perception regarding a continued reliance on and use of carbon-based sources of energy could reduce the demand for oil and natural gas in the global marketplace. Such regulations or negative perceptions could also have an adverse effect on our business, as demand for our services is highly dependent on the level of exploration, development and production activity. The continued weakness of the worldwide economy has also led to businesses being more focused on liquidity and access to capital, which has caused many oil and natural gas companies to curtail or defer planned capital spending, which may negatively affect our operations. A sustained period of low offshore drilling and production activity, low commodity prices or reductions in industry budgets could reduce demand for our services and would likely have a material adverse effect on our business, financial condition or results of operations.
Market conditions in the marine contracting industry are highly cyclical and subject to rapid change. Due to the short-term nature of most of our contracts, adverse changes in market conditions can have an immediate impact on our results of operations.
Historically, the marine contracting industry has been highly cyclical, with periods of high demand and high dayrates often followed by periods of low demand and low dayrates. Periods of low demand can result in vessels and diving systems being idle. We may be required to render certain vessels or diving systems idle or reduce contract rates in response to market conditions in the future. On the Gulf of Mexico OCS, contracts are generally short-term, and oil and natural gas companies tend to respond quickly to changes in commodity prices. Due to the historical short-term nature of many of our contracts, changes in market conditions can have an immediate impact on our results of operations. In addition, customers generally have the right to terminate our contracts with little or no notice and without penalty. As a result of the cyclicality of our industry, our results of operations are subject to volatility.
Our business is concentrated on the Gulf of Mexico OCS, and the mature nature of this region could result in less exploration, development and production activities in the area, thereby reducing demand for our services.
The Gulf of Mexico OCS is a mature oil and natural gas production region that has experienced substantial exploration, development, construction and production activity for many years. Because a large number of oil and natural gas prospects in this region have already been drilled, additional prospects of sufficient size and quality could be more difficult to identify, and other regions may offer superior or more cost-effective drilling prospects. Moreover, oil and natural gas companies may be unable to obtain the financing necessary to drill prospects in this region. The decrease in the size of oil and natural gas prospects, the decrease in production or the failure to obtain such financing may result in reduced exploration, development, construction and production activity in the Gulf of Mexico and reduced demand for our services.
Intense competition in our industry may reduce our profitability and weaken our financial condition.
The businesses in which we operate are highly competitive. Our contracts traditionally have been awarded on a competitive bid basis, and while customers may consider, among other things, the reputation, safety record and experience of the contractor, price competition is often the primary factor in determining which qualified contractor is awarded a job. This competition has become more intense in recent years as mergers among oil and natural gas companies have reduced the number of available customers. Contract pricing is partially dependent on the supply of competing vessels. Generally, excess offshore service capacity puts downward pressure on contract rates. We are currently experiencing this downward pressure in some of the international markets in which we currently operate as new assets, the commitments for which were made prior to the recent global recession, have been placed into service in these markets. If other companies construct new vessels or relocate existing vessels to our markets, competition may further increase and drive down the rates we may charge our customers. We believe that the competition for contracts will continue to be intense in the foreseeable future particularly in the international markets due to increased capacity coming to market. Our inability to compete successfully may reduce our profitability and weaken our financial condition.
If we fail to manage our growth effectively, our results of operations could be harmed.
We have a history of growing through acquisitions of companies and assets. We must plan and manage our acquisitions effectively to achieve revenue growth and maintain profitability in our evolving market. If we fail to manage current and future acquisitions effectively, our results of operations could be adversely affected. Our growth has placed, and is expected to continue to place, significant demands on our personnel, management and other resources. We must continue to improve our operational, financial, management and legal/compliance information systems to keep pace with the growth of our business.
Any future acquisitions could present a number of risks, including but not limited to:
|
·
|
incorrect assumptions regarding the future results of acquired operations or assets or expected cost reductions or other synergies expected to be realized as a result of acquiring operations or assets;
|
|
·
|
failure to integrate the operations or management of any acquired operations or assets successfully and timely;
|
|
·
|
diversion of management’s attention from existing operations or other priorities; and
|
|
·
|
our inability to secure, on terms we find acceptable, sufficient financing that may be required for any such acquisition or investment.
|
Our business plan anticipates, and is based upon, our ability to successfully complete acquisitions of other businesses or assets. Our failure to do so, or to successfully integrate our acquisitions in a timely and cost effective manner, could have an adverse affect on our business, financial condition or results of operations.
Our operations outside of the United States are subject to additional political, economic, and other uncertainties that could adversely affect our business, financial condition or results of operations, and our exposure to such risks will increase as we expand our international operations.
An element of our business strategy is to expand the scope of our operations in international oil and natural gas producing areas such as the Middle East, Southeast Asia, China, India, the Mediterranean, Australia and Latin America. Our operations outside of the United States are subject to risks inherent in foreign operations, including but not limited to:
|
·
|
political, social and economic instability;
|
|
·
|
the loss of revenue, property and equipment from hazards such as expropriation, nationalization, war, insurrection, acts of terrorism and other political risks;
|
|
·
|
increased operating costs;
|
|
·
|
increases in taxes and governmental royalties;
|
|
·
|
renegotiation or abrogation of contracts with governmental entities;
|
|
·
|
changes in laws and policies governing operations of foreign-based companies;
|
|
·
|
import-export quotas;
|
|
·
|
currency restrictions and exchange rate fluctuations;
|
|
·
|
world economic cycles;
|
|
·
|
limited market access;
|
|
·
|
other uncertainties arising out of foreign government sovereignty over our international operations; and
|
|
·
|
compliance with the Foreign Corrupt Practices Act and similar laws.
|
In addition, laws and policies of the United States affecting foreign trade and taxation may also adversely affect our international operations.
As our international operations expand, the exposure to these risks will increase. Our business, financial condition or results of operations could be susceptible to adverse events beyond our control that may occur in a particular country or region in which we are active.
We require highly skilled personnel and the loss of the services of one or more of our key employees, or our failure to attract and retain other highly qualified personnel in the future, could disrupt our operations and adversely affect our financial results.
Our continued success depends on our retention of experienced subsea and marine construction professionals at levels that will allow us to serve our business. Our industry has lost a significant number of these professionals over the past several years for a variety of reasons, and it will be important for us to develop a strategy that will allow us to retain and deploy subsea and marine construction professionals capable of performing our available work. We believe that our success and continued growth are also dependent upon our ability to attract and retain skilled personnel. Unionization or a significant increase in the wages paid by other employers could result in a reduction in our workforce, increases in the wage rates we pay, or both. Additionally, if the Employee Free Choice Act or a similar law is enacted, it will be much easier for unions to organize U.S. workforces. If any of these events occur for any significant period of time, our revenues and profitability could be diminished and our growth potential could be impaired.
The operation of marine vessels is risky, and we may incur losses or other liabilities that are not covered by insurance that could have a material adverse effect on our financial condition and results of operations.
Marine contracting involves a high degree of operational risk. Hazards, such as vessels sinking, grounding, colliding and sustaining damage from severe weather conditions, are inherent in marine operations, and may become exacerbated to the extent severe weather conditions in regions in which we operate are intensified as a result of global climate change. These hazards can cause personal injury or loss of life, severe damage to and destruction of property and equipment, pollution or environmental damage and suspension of operations. Damage arising from such occurrences may result in lawsuits asserting large claims. We maintain such insurance protection as we deem prudent, including maritime employer’s liability and protection and indemnity insurance which provides coverage for our liability to our employees under the Jones Act and general maritime law, as well as hull insurance on our vessels. Such insurance may not be sufficient or effective under all circumstances or against all hazards to which we may be subject. A successful claim for which we are not fully insured could have a material adverse effect on our business, financial condition or results of operations. Moreover, our ability to maintain adequate insurance in the future at rates that we consider reasonable may be limited. As a result of market conditions, premiums and deductibles for certain of our insurance policies are subject to change and could escalate. In some instances, certain insurance could become unavailable or available only for reduced amounts of coverage. In the event of property loss due to a catastrophic marine disaster, mechanical failure or collision, insurance may not cover a substantial loss of revenues, increased costs and other liabilities, and could have a material adverse effect on our operating performance if we were to lose any of our large vessels.
We may experience equipment or mechanical failures, which could increase costs, reduce revenues and result in penalties for failure to meet project completion requirements.
The successful execution of contracts requires a high degree of reliability of our vessels, barges and equipment. Breakdowns not only add to the costs of executing a project, but they can also delay the completion of subsequent contracts, which are scheduled to utilize the same assets. We operate a scheduled maintenance program in order to keep all assets in good working order, but despite this breakdowns can and do occur.
Our contracting business declines in winter, and adverse weather conditions in the Gulf of Mexico can adversely affect our revenues.
Marine operations conducted in the Gulf of Mexico are typically seasonal and depend, in part, on weather conditions. Historically, we have experienced our lowest vessel utilization rates during the winter and early spring, when weather conditions are least favorable for offshore exploration, development and construction activities. As is common in the industry, in more competitive market conditions, we typically bear the risk of delays caused by some, but not all, adverse weather conditions. Typically our customers choose to perform most of the Gulf of Mexico work between May and October. Accordingly, our results in any one quarter are not necessarily indicative of annual results or continuing trends.
Our original estimates of the costs associated with our qualified lump-sum projects and capital projects may be incorrect and result in reduced profitability, losses or cost over-runs on those projects.
Many of our projects are performed on a qualified lump-sum basis where a defined work scope is delivered for a fixed price and extra work, which is subject to customer approval, is billed separately. The revenue, cost and gross profit realized on a qualified lump-sum contract can vary from the estimated amount because of changes in offshore job conditions, variations in labor and equipment productivity from the original estimates, and the performance of subcontractors. These variations and risks inherent in the marine construction business may result in our experiencing reduced profitability or losses on certain projects. In addition, estimates for capital projects, including recertification costs, may be inadequate due to unknown factors associated with the work to be performed and market conditions and can result in cost over-runs.
We are subject to extensive federal, state, local and other laws and regulations that could adversely affect the cost, manner or feasibility of conducting our operations.
Our marine construction, intervention, inspection, maintenance and decommissioning operations are subject to extensive laws and regulations. In order to conduct our operations in compliance with these laws and regulations, we must obtain and maintain numerous permits, approvals and certificates from various federal, state and local governmental authorities. Any actual or alleged violation of permit requirements or failure to obtain any required permit could result in restrictions or prohibitions on our operations or criminal sanctions. Alternatively, we may have to incur substantial expenditures to obtain, maintain or renew authorizations to conduct existing projects. Due to adverse operating market conditions or unfavorable financing conditions, there also may be occasions when certain recertification efforts may be delayed, temporarily suspending certain vessel operations, until more favorable market or cost of capital conditions arise. If a project cannot be performed as planned due to changing requirements or local opposition, we may suffer expensive delays, extended periods of non-operation or significant loss of value in a project.
In addition, our costs of compliance may increase if existing laws and regulations are revised or reinterpreted, or if new laws and regulations become applicable to our operations that may, for instance, require us to obtain additional permits, approvals and certificates for proposed projects. Any increases in our costs of compliance or a failure to comply with such laws and regulations, as interpreted and enforced, may have a material adverse effect on our business, financial condition or results of operations. See Item 1, “Business — Government Regulation.”
We may incur substantial costs and liabilities with respect to environmental, health and safety laws and regulations.
We may incur substantial costs and liabilities as a result of environmental, health and safety requirements relating to, among other things, our marine construction and intervention, inspection, maintenance and decommissioning operations. These costs and liabilities could arise under a wide range of environmental, health and safety laws, including regulations and enforcement policies, which have tended to become increasingly strict over time. Failure to comply with these laws and regulations may result in assessment of administrative, civil, and criminal penalties, imposition of cleanup and site restoration costs and liens, and the issuance of orders enjoining or limiting our current or future operations. Compliance with these laws and regulations also increases the cost of our operations and may prevent or delay the commencement or continuance of a given operation. In addition, claims for damages, including damages for natural resources, to persons or property may result from environmental and other impacts of our operations.
Strict, joint and several liability to remediate contamination may be imposed under certain environmental laws, which could cause us to become liable for, among other things, the conduct of others or for consequences of our own actions that were in compliance with all applicable laws at the time those actions were taken. New or modified environmental, health or safety laws, regulations or enforcement policies could be more stringent and impose unforeseen liabilities or significantly increase compliance costs. Therefore, the costs to comply with environmental, health or safety laws or regulations or the liabilities incurred in connection with them could significantly and adversely affect our business, financial condition or results of operations. See Item 1, “Business — Environmental Regulation.”
In addition, in December 2009 the EPA published findings that the emissions of carbon dioxide, methane and other greenhouse gases are contributing to the warming of the Earth’s atmosphere and other climatic changes, presenting an endangerment to human health and the environment. Because our business and services are highly dependent on the continued exploration for and production of fossil fuels (predominantly oil and natural gas), the enactment of additional regulations related to climate change or greenhouse gases could reduce worldwide demand for oil and natural gas and have an corresponding adverse effect on our business, financial condition or results of operations.
A possible terrorist attack or armed conflict could harm our business.
Terrorist activities, anti-terrorist efforts or acts of piracy and other armed conflict involving the U.S. may adversely affect the U.S. and global economies and could prevent us from meeting our debt service, financial and other contractual obligations. If any of these events occur, the resulting political instability and societal disruption could reduce overall demand for our services. Oil and natural gas related facilities and assets, including our marine equipment, could be direct targets for terrorist attacks or acts of piracy, and our operations could be adversely impacted if infrastructure integral to our customers’ operations is damaged or destroyed. Costs for insurance and other security may increase as a result of these threats, and some insurance coverage may become more difficult to obtain, if available at all. Our operations in international areas abroad may increase our exposure to these risks.
Risks Relating to Our Relationship with Helix and to our Common Stock
As described in Item 1, “Business” and elsewhere in this Form 10-K, Helix, our former parent company, reduced its ownership of our common stock through a series of transactions in 2009 from a majority to less than 1%. Notwithstanding this reduction in Helix’s ownership position, the following describes certain risks associated with our ongoing relationship with Helix and with our common stock generally.
If Helix engages in the same type of business we conduct or takes advantage of business opportunities that might be attractive to us, our ability to operate successfully and expand our business may be hampered.
Our amended and restated certificate of incorporation provides that, subject to any contractual provision to the contrary, Helix may:
|
·
|
engage in the same or similar business activities or lines of business as us, or
|
|
·
|
do business with any of our clients, customers or vendors.
|
In addition, the corporate opportunity policy set forth in our amended and restated certificate of incorporation addresses potential conflicts of interest between our company, on the one hand, and Helix and its officers and directors who are directors of our company, on the other hand. This corporate opportunity policy does not terminate until no officers or directors of Helix serve on our board of directors. Two Helix directors currently serve as members of our board of directors.
The policy provides that if Helix acquires knowledge of a potential transaction or matter which may be a corporate opportunity for both Helix and us, Helix is free to pursue the corporate opportunity. It also provides that if one of our directors who is also a director or officer of Helix learns of a potential transaction or matter that may be a corporate opportunity for both Helix and us, the director is free to present the corporate opportunity to Helix rather than to us, unless that opportunity is expressly offered to that person in writing solely in his or her capacity as our director.
Additionally, if one of our directors who also serves as a director or officer of Helix learns of a potential transaction or matter that may be a corporate opportunity for both Helix and us, the policy provides that the director will have no duty to communicate or present that corporate opportunity to us and will not be liable to us or our stockholders for breach of fiduciary duty by reason of Helix’s actions with respect to that corporate opportunity.
We will not have control over certain tax decisions and could be liable for income taxes owed by Helix.
Prior to the closing of our initial public offering, we and certain of our subsidiaries were included in Helix’s consolidated group for U.S. federal income tax purposes. In addition, we or one or more of our subsidiaries may be included in the combined, consolidated or unitary tax returns of Helix or one or more of its subsidiaries for foreign, state and local income tax purposes. Under our Tax Matters Agreement with Helix, Helix has the right to prepare and file income tax returns that include us or our subsidiaries if Helix has any responsibility for the taxes shown on such income tax returns. The Tax Matters Agreement grants Helix the sole authority to respond to and conduct all tax proceedings (including tax audits) relating to such income tax returns. This arrangement may result in conflicts of interest between Helix and us. For example, under the Tax Matters Agreement, Helix is able to choose to contest, compromise or settle any adjustment or deficiency proposed by the relevant taxing authority in a manner that may be beneficial to Helix and detrimental to us. In addition, while Helix is generally responsible for any taxes resulting from its prior asset transfer to us, we have agreed to be responsible for any additional taxes that may result from actions we take.
Provisions in our corporate governance documents and Delaware law may delay or prevent an acquisition of us that our other stockholders may consider favorable.
Our amended and restated certificate of incorporation and amended and restated bylaws contain provisions that could make it more difficult for a third party to acquire us without the consent of our board of directors. These provisions include supermajority voting requirements with respect to the removal of directors and amendment of certain provisions of our organizational documents, provisions for a classified board of directors and a prohibition on the ability of our stockholders to act by written consent. Our board of directors also has the right to issue preferred stock without stockholder approval, which could be used to dilute the stock ownership of a potential hostile acquirer.
In addition to anti-takeover protections contained in our corporate governance documents, Delaware law also imposes certain restrictions on mergers and other business combinations between us and any holder of 15% or more of our outstanding voting stock. These restrictions under Delaware law apply to Helix and any other stockholder seeking to acquire control of our company.
While we enjoy certain anti-takeover protections afforded under Delaware law and applicable provisions of our organizational documents as described above, we may be more susceptible to takeover action from third parties now that Helix no longer holds a significant interest in our company. Although we believe these provisions protect our stockholders from coercive or otherwise unfair takeover tactics and thereby provide for an opportunity to receive a higher bid by requiring potential acquirers to negotiate with our board of directors, these provisions apply even if the offer may be considered beneficial by some stockholders. While our board of directors may consider the approval and adoption of other customary anti-takeover measures to attempt to mitigate these risks, such as the adoption of a shareholder rights plan, no decision in this regard has been made by our board.
Our common stock is subject to restrictions on foreign ownership.
We are subject to government regulations pursuant to the Shipping Act, 1916, as amended, the Merchant Marine Act, 1920, as amended, the Merchant Marine Act, 1936, as amended, and the regulations promulgated thereunder, as such laws and regulations may be amended from time to time. In an effort to assure that we remain in compliance with the citizenship requirements of these laws, our amended and restated certificate of incorporation contains provisions limiting non-U.S. citizenship ownership of our capital stock. Generally speaking, under such restrictions, transfers or purported transfers of our capital stock that result in one or more non-U.S. citizens owning or controlling capital stock (or the voting power thereof) in the aggregate in excess of 25% of our outstanding capital stock, are void (subject to our board of directors determining otherwise) and any shares owned or controlled by a non-U.S. citizen in excess of such percentage shall not be entitled to receive dividends or distributions or to vote with respect to any matter submitted to our stockholders. Such restrictions may make our capital stock less attractive to potential investors, which may result in our common stock having a lower market price than it might have in the absence of such restrictions and redemption rights. In addition, if we do not comply with these restrictions, we could be deemed to have undertaken an unapproved foreign transfer, resulting in significant penalties and fines.
None.
Our Vessels
We currently own and operate a diversified fleet of 29 vessels, including 19 surface and saturation diving support vessels as well as six shallow water pipelay vessels, one dedicated pipebury barge, one combination pipelay/derrick barge and two derrick barges. Our fleet of diving support vessels comprises 11 surface diving support vessels capable of working in water depths up to 300 feet, and eight saturation diving support vessels that typically work in water depths of 200 to 1,000 feet. Five of our saturation diving support vessels have DP capabilities. Our ten construction barges have a range of capabilities and perform construction projects in water depths up to 1,000 feet.
The following table provides select information about each of the vessels we own:
|
Vessel
|
Flag State
|
Placed in
Service by
Cal Dive (1)
|
Length (Feet)
|
DP or Anchor
Moored
|
||||||||||||
|
Saturation Diving
|
||||||||||||||||
|
DP DSV Eclipse
|
Bahamas
|
3/2002 | 367 |
DP
|
||||||||||||
|
DP DSV Mystic Viking
|
Bahamas
|
6/2001 | 253 |
DP
|
||||||||||||
|
DP DSV Kestrel
|
Vanuatu
|
9/2006 | 323 |
DP
|
||||||||||||
|
DP MSV Texas
|
Vanuatu
|
12/2007 | 341 |
DP
|
||||||||||||
|
DP MSV Uncle John
|
Bahamas
|
11/1996 | 254 |
DP
|
||||||||||||
|
DSV American Constitution
|
Panama
|
11/2005 | 200 |
4 point
|
||||||||||||
|
DSV Cal Diver I
|
U.S.
|
7/1984 | 196 |
4 point
|
||||||||||||
|
DSV Cal Diver II
|
U.S.
|
6/1985 | 166 |
4 point
|
||||||||||||
|
Surface Diving
|
||||||||||||||||
|
DSV American Star
|
U.S.
|
11/2005 | 165 |
4 point
|
||||||||||||
|
DSV American Triumph
|
U.S.
|
11/2005 | 164 |
4 point
|
||||||||||||
|
DSV American Victory
|
U.S.
|
11/2005 | 165 |
4 point
|
||||||||||||
|
DSV Dancer
|
U.S.
|
3/2006 | 173 |
4 point
|
||||||||||||
|
DSV Mr. Fred
|
U.S.
|
3/2000 | 166 |
4 point
|
||||||||||||
|
DSV Midnight Star
|
Vanuatu
|
6/2006 | 197 |
4 point
|
||||||||||||
|
Cal Diver IV
|
U.S.
|
3/2001 | 120 | — | ||||||||||||
|
Fox
|
U.S.
|
10/2005 | 130 | — | ||||||||||||
|
Polo Pony
|
U.S.
|
3/2001 | 110 | — | ||||||||||||
|
Sterling Pony
|
U.S.
|
3/2001 | 110 | — | ||||||||||||
|
White Pony
|
U.S.
|
3/2001 | 116 | — | ||||||||||||
|
Pipelay/Pipebury
|
||||||||||||||||
|
Brave
|
U.S.
|
11/2005 | 275 |
Anchor
|
||||||||||||
|
Rider
|
U.S.
|
11/2005 | 260 |
Anchor
|
||||||||||||
|
American
|
U.S.
|
12/2007 | 180 |
Anchor
|
||||||||||||
|
Lone Star
|
Vanuatu
|
12/2007 | 313 |
Anchor
|
||||||||||||
|
Brazos
|
Vanuatu
|
12/2007 | 210 |
Anchor
|
||||||||||||
|
Pecos
|
U.S.
|
12/2007 | 256 |
Anchor
|
||||||||||||
|
Pipebury
|
||||||||||||||||
|
Canyon
|
Vanuatu
|
12/2007 | 330 |
Anchor
|
||||||||||||
|
Derrick/Pipelay Combination
|
||||||||||||||||
|
Sea Horizon
|
Vanuatu
|
12/2007 | 360 |
Anchor
|
||||||||||||
|
Derrick
|
||||||||||||||||
|
Atlantic
|
U.S.
|
12/2007 | 420 |
Anchor
|
||||||||||||
|
Pacific
|
U.S.
|
12/2007 | 350 |
Anchor
|
||||||||||||
|
_______________________
|
||||||||||||||||
|
(1) Represents the date Cal Dive placed the vessel in service and not its date of commissioning.
|
||||||||||||||||
In addition to our saturation diving vessels, we currently own nine portable saturation diving systems.
During the first quarter of 2010, we sold a portable saturation diving system to a third party for cash proceeds of $3.7 million, and recognized a gain on the sale of $1.1 million. During the second quarter of 2010, we sold two surface diving vessels, the Mr. Jim and the Mr. Jack to different third parties for cash proceeds totaling $0.6 million, and recognized a gain on the sales of $0.1 million.
In April 2008, we sold three surface diving vessels, the Cal Diver V, the American Diver and the American Liberty to a third party for $0.7 million, and recorded a gain on the sale of $0.2 million.
During 2007 through February 2008, we chartered a vessel for use in the Middle East. Expense for this charter was $2.7 million for the year ended December 31, 2008.
All of our vessels other than the Sea Horizon and the Eclipse are subject to vessel mortgages securing our credit facility. See Item 7, “Management’s Discussion and Analysis of Financial Condition and Results of Operations - Liquidity and Capital Resources.”
We incur routine drydock, inspection, maintenance and repair costs pursuant to U.S. Coast Guard regulations and in order to maintain our vessels in class under the rules of the applicable class society. For 2010, these costs were $6.7 million. We defer these costs and amortize them over the period commencing with the date the vessel returned to service following completion of the drydock and certification process to the next certificate expiry date, which typically ranges from 24 months to 60 months. These costs can fluctuate widely from year to year based on the number of vessels, the scope of the related work plan, availability of drydock capacity and general prevailing market conditions. In addition to complying with these requirements, we have our own vessel maintenance program that we believe permits us to continue to provide our customers with well maintained, reliable vessels. In addition to the deferred drydock costs discussed above, during 2010, we incurred $42.5 million in capital expenditures primarily related to replacements and vessel improvements. In the normal course of business, we charter other vessels on a short-term basis, such as tugboats, cargo barges, utility boats and dive support vessels.
Our Facilities
Our corporate headquarters are located at 2500 CityWest Boulevard, Suite 2200, Houston, Texas. Our primary subsea and marine services operations are based in Broussard, Louisiana. All of our facilities are leased except for our Broussard, Louisiana facility, approximately 6 1/2 acres that we own at our Port of Iberia, Louisiana facility (the remainder of which is leased), our Port Arthur and Sabine, Texas facilities and our Southeast Asia maintenance base and office in Singapore. The Sabine facility has no employees and is used only for docking our vessels. The remaining terms of these leases range from less than one to 10 years. Future minimum rentals under these non-cancelable leases are approximately $15.9 million at December 31, 2010, with $3.6 million in 2011, $3.0 million in 2012, $2.8 million in 2013, $2.8 million in 2014 and $3.7 million thereafter. Total rental expense under these operating leases was approximately $5.0 million, $5.4 million and $5.2 million for the years ended December 31, 2010, 2009, and 2008, respectively.
The following table provides select information about our material facilities:
|
Location
|
Function
|
Size
|
|
Houston, Texas
|
Corporate Headquarters, Project
|
89,000 square feet
|
|
Management and Sales Office
|
||
|
Broussard, Louisiana
|
Operations, Offices and Warehouse
|
16 acres (Buildings: 84,000 sq. ft.)
|
|
Port of Iberia, Louisiana
|
Training and Warehouse
|
23 acres (Building 68,602 sq. ft.)
|
|
Fourchon, Louisiana
|
Marine, Operations and Dock
|
26 acres (Buildings: 2,300 sq. ft.)
|
|
Port Arthur, Texas
|
Marine/Spool base
|
23 acres (Building 6,000 sq. ft.)
|
|
Singapore
|
Marine, Operations, Offices,
|
48,821 sq. ft.
|
|
Project Management and Warehouse
|
||
|
Perth, Australia
|
Operations, Offices and Project Management
|
33,906 sq. ft.
|
|
Ciudad del Carmen, Mexico
|
Operations, Offices and Dock
|
94,561 sq. ft.
|
Insurance and Legal Proceedings
Our operations are subject to the inherent risks of offshore marine activity, including accidents resulting in personal injury and the loss of life or property, environmental mishaps, mechanical failures, fires and collisions. We insure against these risks at levels consistent with industry standards. We also carry workers’ compensation, maritime employer’s liability, general liability and other insurance customary in our business. All insurance is carried at levels of coverage and deductibles we consider financially prudent. Our services are provided in hazardous environments where accidents involving catastrophic damage or loss of life could occur, and litigation arising from such events may result in our being named a defendant in lawsuits asserting large claims. Although there can be no assurance the amounts of insurance we carry are sufficient to protect us fully in all events, or that such insurance will continue to be available at current levels of cost or coverage, we believe that our insurance protection is adequate for our business operations. A successful liability claim for which we are underinsured or uninsured could have a material adverse effect on our business, financial condition or results of operations.
We are involved in various legal proceedings, primarily involving claims for personal injury under the General Maritime Laws of the United States and the Jones Act as a result of alleged negligence. In addition, we from time to time incur other claims, such as contract disputes, in the normal course of business. Under our agreements with Helix, we have assumed and agreed to indemnify Helix for liabilities related to our business.
Tax Assessment
During the fourth quarter of 2006, Horizon received a tax assessment related to fiscal 2001 from the Servicio de Administracion Tributaria (“SAT”), the Mexican taxing authority, for approximately $283.5 million pesos, translated to approximately $25.1 million using the foreign exchange rate at December 31, 2010, including penalties and interest. The SAT’s assessment claims unpaid taxes related to services performed among our subsidiaries as well as penalties and accrued interest. We have consulted with our Mexican counsel and believe that under the Mexico and United States double taxation treaty these services are not taxable and the tax assessment itself is invalid. Accordingly, we have not recorded a liability for the SAT’s assessment for the 2001 tax year in our consolidated financial statements. On February 14, 2008, we received notice from the SAT upholding the original assessment. On April 21, 2008, we filed a petition in Mexico tax court disputing the assessment. We believe that our position is supported by law and intend to vigorously defend our position. All pleadings have been filed and we are awaiting the court’s decision. However, the ultimate timing and outcome of this litigation and our potential liability from this assessment, if any, cannot be determined at this time. Nonetheless, an unfavorable outcome with respect to the Mexico tax assessment could have a material adverse effect on our financial position, results of operations, and cash flows.
The SAT also claimed unpaid taxes related to services performed among our subsidiaries for Horizon’s 2002 through 2007 taxable years. During 2009, we successfully completed negotiations with the SAT with respect to their claim of unpaid taxes related to Horizon’s 2002 through 2007 taxable years, and paid an aggregate of approximately $3.3 million in settlement of these periods. Horizon’s 2002 through 2004 tax audits were closed in 2009, settling this particular claim by the SAT. In 2009 we also filed amendments for tax years 2005 through 2007 using the same methodology used in the settlement for the 2002 through 2004 years. The amended returns were accepted by the Mexican tax authority in March 2010, effectively settling this particular claim. Even though we have settled this issue for these years, under Mexican tax law there is a five-year statute of limitations, so our tax years 2005 through 2010 remain open for examination in this jurisdiction.
Not applicable.
PART II
Item 5. Market for Registrant’s Common Equity, Related Stockholder Matters and Issuer Purchases of Equity Securities
Our common stock trades on the New York Stock Exchange under the symbol “DVR.” The following table sets forth, for the periods indicated, the high and low sales price per share of our common stock on the New York Stock Exchange:
|
Common Stock
Price
|
||||||||
|
High
|
Low
|
|||||||
|
Fiscal Year 2009
|
||||||||
|
First Quarter
|
$ | 7.99 | $ | 4.67 | ||||
|
Second Quarter
|
10.15 | 6.54 | ||||||
|
Third Quarter
|
11.75 | 7.18 | ||||||
|
Fourth Quarter
|
10.48 | 6.83 | ||||||
|
Fiscal Year 2010
|
||||||||
|
First Quarter
|
8.14 | 6.35 | ||||||
|
Second Quarter
|
7.97 | 4.75 | ||||||
|
Third Quarter
|
6.69 | 4.48 | ||||||
|
Fourth Quarter
|
5.99 | 4.79 | ||||||
|
Fiscal Year 2011
|
||||||||
|
First Quarter (through February 28)
|
6.88 | 5.78 | ||||||
As of February 28, 2011, there were approximately 194 registered stockholders of our common stock.
Dividend Policy
We do not pay cash dividends on our common stock and do not anticipate paying cash dividends on our common stock in the foreseeable future. We currently intend to retain earnings, if any, for the future operation and growth of our business. In addition, our financing arrangements prohibit the payment of cash dividends on our common stock. See Item 7, “Management’s Discussion and Analysis of Financial Condition and Results of Operations - Liquidity and Capital Resources.”
Stock Performance Graph
The information included under the caption “Stock Performance Graph” in this Item 5 of this annual report is not deemed to be “soliciting material” or “filed” with the SEC or subject to Regulation 14A or 14C under the Securities Exchange Act of 1934 or to the liabilities of Section 18 of the Securities Exchange Act of 1934, and will not be incorporated by reference into any filings we make under the Securities Act of 1933 or the Securities Exchange Act of 1934, except to the extent we specifically incorporate it by reference into such a filing.
The graph below compares the cumulative total stockholder return on our common stock for the period from December 14, 2006 (the date our common stock began trading) to December 31, 2010, to the cumulative total stockholder return for (i) the stocks of the S&P 500 Index, (ii) the Philadelphia Oil Service Sector index (“OSX”), a price-weighted index of leading oil service companies and (iii) a peer group (the “Peer Group”) selected in good faith by us and consisting of the following companies: Dril-Quip, Inc., Global Industries, Ltd., Gulfmark Offshore, Inc., Helix Energy Solutions Group, Inc., Hercules Offshore, Inc., Newpark Resources, Inc., Oceaneering International, Inc., Superior Energy Services, Inc., TETRA Technologies, Inc. and Tidewater Inc. Prior to 2010 the Peer Group also included Trico Marine Services, Inc. However, Trico filed for bankruptcy protection during 2010 and its stock is no longer listed on NASDAQ, so we have removed it from the Peer Group for all periods in the graph below. The returns of each member of the Peer Group have been weighted according to its equity market capitalization as of December 31, 2010. We believe that the members of the Peer Group provide services and products more comparable to us than the companies included in the OSX.
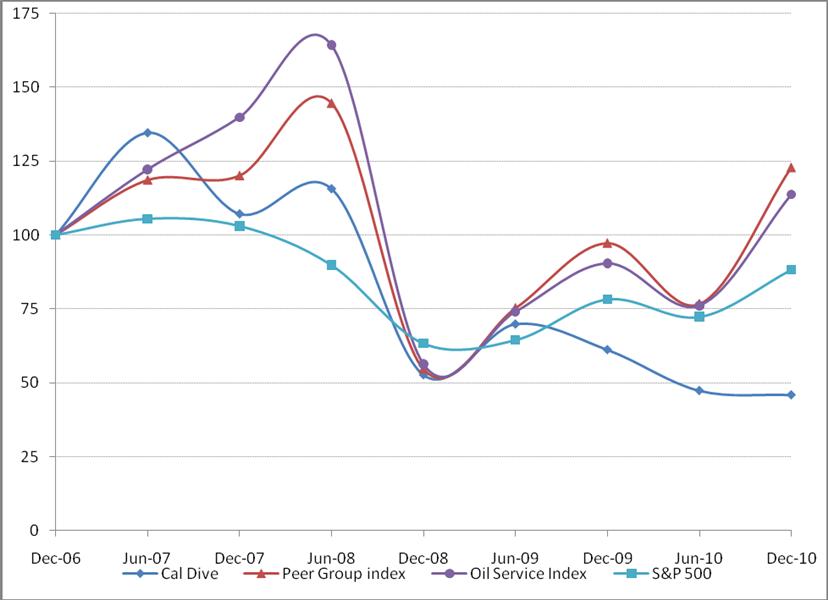
|
Base Date
|
Years Ended December 31,
|
||||||||||||||||||||||||
|
12/14/06
|
2006
|
2007
|
2008
|
2009
|
2010
|
||||||||||||||||||||
|
Cal Dive
|
100 | 101.6 | 107.2 | 52.7 | 61.2 | 45.9 | |||||||||||||||||||
|
Peer Group Index
|
100 | 90.9 | 120.0 | 54.7 | 97.2 | 122.8 | |||||||||||||||||||
|
Oil Service Index
|
100 | 92.7 | 139.8 | 56.3 | 90.4 | 113.6 | |||||||||||||||||||
|
S&P 500 Index
|
100 | 99.5 | 103.0 | 63.4 | 78.2 | 88.2 | |||||||||||||||||||
Purchases of Equity Securities by the Issuer
The table below summarizes the repurchases of our common stock in the fourth quarter of 2010:
|
Period
|
Total Number of Shares Purchased
|
Average Price Paid Per Share
|
Total Number of Shares Purchased as Part of a Publicly Announced Program
|
Maximum Value of Shares that may yet be Purchased Under the Programs
|
||||||||||||
|
(in thousands)
|
||||||||||||||||
|
October 1 to October 31, 2010
|
— | — | — | — | ||||||||||||
|
November 1 to November 30, 2010
|
— | — | — | — | ||||||||||||
|
December 1 to December 31, 2010(1)
|
187,216 | $ | 5.77 | — | — | |||||||||||
| 187,216 | $ | 5.77 | — | — | ||||||||||||
|
|
_______________________
|
|
(1)
|
Represents shares surrendered to us by employees in order to satisfy tax withholding obligations upon vesting of restricted shares.
|
Item 6. Selected Financial Data
For periods prior to December 14, 2006, our historical financial and other data have been derived from Helix’s consolidated financial statements and prepared on a combined basis, using the historical results of operations and bases of the assets and liabilities of the shallow water marine contracting business of Helix and giving effect to allocations of expenses to and from Helix. Our historical financial data will not necessarily be indicative of our future performance nor will such data necessarily reflect what our consolidated financial position and results of operations would have been had we operated as an independent publicly traded company during the periods shown.
We have prepared our consolidated financial statements as if we had been in existence as a separate company throughout all relevant periods. The consolidated results of operations data and cash flow data and the consolidated balance sheet data presented below were derived from our audited consolidated financial statements and the related notes thereto.
During 2009, we repurchased from Helix and retired approximately 15.2 million shares of our common stock in two separate transactions for $100 million at a weighted average price of $6.57 per share.
You should read the information contained in this table in conjunction with Item 7, “Management’s Discussion and Analysis of Financial Condition and Results of Operations,” and our historical audited consolidated financial statements and the accompanying notes thereto included elsewhere in this report.
|
Year Ended December 31,
|
||||||||||||||||||||
|
2010
|
2009
|
2008
|
2007
|
2006
|
||||||||||||||||
|
Results of Operations Data:
|
||||||||||||||||||||
|
Revenues
|
$ | 536,468 | $ | 829,362 | $ | 856,906 | $ | 623,615 | $ | 509,917 | ||||||||||
|
Net income (loss)
|
(315,849 | ) | 76,627 | 109,499 | 105,600 | 119,414 | ||||||||||||||
|
Net income (loss) per common share:
|
||||||||||||||||||||
|
Basic and fully diluted
|
$ | (3.47 | ) | $ | 0.81 | $ | 1.03 | $ | 1.24 | $ | 1.91 | |||||||||
|
Cash dividends declared per common share
|
$ | — | $ | — | $ | — | $ | — | $ | 7.42 | ||||||||||
|
December 31,
|
||||||||||||||||||||
|
2010
|
2009
|
2008
|
2007
|
2006
|
||||||||||||||||
|
Balance Sheet Data:
|
||||||||||||||||||||
|
Net property and equipment
|
$ | 567,791 | $ | 609,233 | $ | 604,242 | $ | 562,318 | $ | 222,247 | ||||||||||
|
Total assets
|
752,301 | 1,155,979 | 1,309,608 | 1,274,050 | 452,153 | |||||||||||||||
|
Long-term debt, less current maturities
|
106,008 | 155,000 | 235,000 | 315,000 | 201,000 | |||||||||||||||
|
Total stockholders’ equity
|
387,711 | 694,798 | 705,697 | 587,907 | 157,761 | |||||||||||||||
Item 7. Management’s Discussion and Analysis of Financial Condition and Results of Operations
The following management discussion and analysis should be read in conjunction with our historical consolidated financial statements and their notes included elsewhere in this annual report. This discussion contains forward-looking statements that reflect our current views with respect to future events and financial performance. Our actual results may differ materially from those anticipated in these forward-looking statements as a result of certain factors, such as those set forth under Item 1A, “Risk Factors” and elsewhere in this annual report.
Business and Outlook
We experienced challenging market conditions in 2010 that we expect to continue in 2011 as a result of the continued negative effects stemming from the global recession that began in 2008 and the April 2010 Macondo well disaster. Our 2010 results were also affected by the following additional factors:
|
·
|
reduced new construction work worldwide;
|
|
·
|
fewer large projects utilizing multiple vessels occurring in 2010 similar to projects completed in 2008 and 2009 which yielded significant profits;
|
|
·
|
reduced levels of hurricane repair and salvage work in the Gulf of Mexico; and
|
|
·
|
heightened competition in certain of our international strategic markets due to new capacity placed into service.
|
The Macondo well disaster has significantly and adversely disrupted oil and gas exploration activities in the Gulf of Mexico and there is increased uncertainty in the market and regulatory environment for our industry which will likely have a negative effect on our customer’s spending levels for some time. The duration that this disruption will continue is currently unknown. We believe these uncertain market conditions contributed to the decline in our stock price and our market capitalization relative to our equity book value during 2010. In the third quarter of 2010, the continued decline in our stock price and uncertainty described above prompted us to conclude that a triggering event had occurred that required us to perform an interim impairment test, which resulted in our recording $315.7 million of pre-tax impairment expenses ($292.5 million of pre-tax goodwill impairment expense and $23.2 million of pre-tax fixed assets impairment expense).
Generally, we believe the long-term outlook for our business remains favorable in both domestic and international markets as capital spending will increase to support exploration and development activity necessary to replenish oil and natural gas production, and for industry participants to satisfy new “idle iron” regulations and other directives promulgated by BOEMRE regarding the decommissioning of platforms and pipelines. We expect all of these factors to continue to drive long-term demand for our services.
Fiscal 2010 Performance
We generated a net loss of $315.8 million ($3.47 per diluted share) for the year ended December 31, 2010 primarily as a result of non-cash, pre-tax impairment charges recorded during the third quarter related to goodwill and four idle construction barges. This compares to net income of $76.6 million, or $0.81 per share, for the year ended December 31, 2009. Our 2010 performance compared to 2009 was also adversely affected by lower vessel utilization, which was 57% in 2009 declining to 47% in 2010. This continuing prolonged decline in vessel utilization is primarily a result of decreased demand for new construction services worldwide and a decrease in demand for hurricane repair and salvage work. In addition, we experienced lower day rates across our diving fleet during 2010 as well as unexpected mechanical downtime for one of our DP saturation diving vessels in the third quarter of 2010. Work relating to cleanup efforts for the oil spill as a result of the Macondo well blowout partially offset these factors.
Vessel Utilization
We believe vessel utilization is one of the most important performance measurements for our business. Utilization provides a good indication of demand for our vessels and, as a result, the contract rates we may charge for our services. As a marine contractor with significant operations in the Gulf of Mexico, our vessel utilization is typically lower during the winter and early spring due to unfavorable weather conditions in the Gulf of Mexico. Accordingly, we attempt to schedule our drydock inspections and other routine and preventative maintenance programs during this period. The bid and award process during the first two quarters typically leads to the commencement of construction activities during the second and third quarters.
The seasonal trend for vessel utilization can be disrupted by hurricanes, which can cause severe offshore damage and generate significant demand for our services from oil and natural gas companies trying to restore shut-in production. This production restoration focus has led to increased demand for our services for prolonged periods following hurricanes, as was the case in the first half of 2009 following hurricanes Gustav and Ike in 2008. Beginning in the fourth quarter of 2009, and reflected in our results for the year ended December 31, 2010, our operations on the Gulf of Mexico OCS returned to more customary seasonal conditions, the effect of which was further exacerbated by particularly weak demand for our services during the first half of 2010. These factors resulted in a 10% decrease in vessel utilization across our entire fleet for the fiscal year ended December 31, 2010 as compared to fiscal 2009.
The following table shows the size of our fleet and effective utilization of our vessels during the past three fiscal years:
|
2010
|
2009
|
2008
|
||||||
|
Number
of Vessels
|
Utilization
(1)
|
Number
of Vessels
|
Utilization
(1)
|
Number
of Vessels
|
Utilization
(1)
|
|||
|
Saturation Diving
|
8
|
65%
|
8
|
79%
|
8
|
87%
|
||
|
Surface and Mixed Gas Diving
|
11
|
51%
|
13
|
57%
|
13
|
64%
|
||
|
Construction Barges
|
10
|
29%
|
10
|
41%
|
10
|
50%
|
||
|
Entire Fleet
|
29
|
47%
|
31
|
57%
|
31
|
64%
|
||
|
(1)Effective vessel utilization is calculated by dividing the total number of days the vessels generated revenues by the total number of days the vessels were available for operation in each year.
|
||||||
Results of Operations
Operating Results
|
Year Ended December 31,
|
Increase/(Decrease)
|
|||||||||||||||||||||||||||
|
2010
|
2009
|
2008
|
2010 to 2009
|
2009 to 2008
|
||||||||||||||||||||||||
|
(in thousands)
|
(in thousands, except %)
|
|||||||||||||||||||||||||||
|
Revenues
|
$ | 536,468 | $ | 829,362 | $ | 856,906 | $ | (292,894 | ) | (35 | %) | $ | (27,544 | ) | (3 | %) | ||||||||||||
|
Gross profit
|
62,442 | 215,885 | 254,007 | (153,443 | ) | (71 | %) | (38,122 | ) | (15 | %) | |||||||||||||||||
|
Vessel Utilization
|
47 | % | 57 | % | 64 | % | (10 | %) | (18 | %) | (7 | %) | (11 | %) | ||||||||||||||
Revenues decreased from 2009 to 2010 by $292.9 million, or 35%, and gross profit decreased by $153.4 million or 71%, due to lower vessel utilization, which declined from 57% in 2009 to 47% in 2010. The decreases in revenues and gross profit in 2010 as compared to 2009 were primarily a result of (i) fewer substantial integrated construction projects (as compared to a liquefied natural gas project located offshore Boston and two significant pipelay projects in China and Mexico which were ongoing in 2009 that utilized multiple vessels and yielded significant profits), (ii) decreased demand for hurricane related repair work and salvage activity as compared to the increased activity experienced during 2009 as a result of hurricanes Gustav and Ike that passed through the Gulf of Mexico in the third quarter of 2008 and (iii) significantly lower day rates.
Revenues decreased from 2008 to 2009 by $27.5 million, or 3%, and gross profit decreased by $38.1 million or 15%. The decreases in revenues and gross profit in 2009 as compared to 2008 were primarily a result of lower vessel utilization resulting from a decreased new construction services, which declined from 64% in 2008 to 57% in 2009. Our 2009 decline in vessel utilization was partially offset by an increase in demand for hurricane related repair and salvage work resulting from hurricanes Gustav and Ike.
Goodwill impairment
|
Year Ended December 31,
|
Increase/(Decrease)
|
|||||||||||||||||||||||||||
|
2010
|
2009
|
2008
|
2010 to 2009
|
2009 to 2008
|
||||||||||||||||||||||||
|
(in thousands)
|
(in thousands, except %)
|
|||||||||||||||||||||||||||
|
Goodwill impairment
|
$ | 292,469 | $ | — | $ | — | $ | 292,469 | 100 | % | $ | — | — | |||||||||||||||
During 2010 we incurred $292.5 million of goodwill impairment charges following a significant and continued decline in our stock prices and related market capitalization and a challenging business climate. There were no comparable impairment charges during the same period of 2009.
Fixed assets impairment
|
Year Ended December 31,
|
Increase/(Decrease)
|
|||||||||||||||||||||||||||
|
2010
|
2009
|
2008
|
2010 to 2009
|
2009 to 2008
|
||||||||||||||||||||||||
|
(in thousands)
|
(in thousands, except %)
|
|||||||||||||||||||||||||||
|
Fixed assets impairment
|
$ | 23,242 | $ | — | $ | — | $ | 23,242 | 100 | % | $ | — | — | |||||||||||||||
During 2010 we incurred $23.2 million of impairment charges related to certain fixed assets, consisting of four idle construction barges, for which the outlook for utilization remains uncertain. There were no comparable impairment charges during the same period of 2009.
Selling and administrative expenses
|
Year Ended December 31,
|
Increase/(Decrease)
|
|||||||||||||||||||||||||||
|
2010
|
2009
|
2008
|
2010 to 2009
|
2009 to 2008
|
||||||||||||||||||||||||
|
(in thousands)
|
(in thousands, except %)
|
|||||||||||||||||||||||||||
|
Selling and administrative expenses
|
$ | 60,138 | $ | 73,787 | $ | 74,500 | $ | (13,649 | ) | (18 | %) | $ | (713 | ) | (1 | %) | ||||||||||||
|
Selling and administrative expenses as a percentage of revenues
|
11 | % | 9 | % | 9 | % | 2 | % | 22 | % | 0 | % | 0 | % | ||||||||||||||
Selling and administrative expenses decreased from 2009 to 2010 by $13.6 million, or 18%. The decreases were primarily due to lower incentive cash compensation in 2010, cost control measures initiated by management in the fourth quarter of 2009 in response to the downturn in business activity, and lower amortization expense for certain intangible assets recognized as part of the Horizon acquisition, which became fully amortized in the second quarter of 2009. Selling and administrative expenses as a percentage of revenue for the year ended December 31, 2010 increased from the same period ended December 31, 2009 due to the decrease in revenues as described above.
Provision for doubtful accounts
|
Year Ended December 31,
|
Increase/(Decrease)
|
|||||||||||||||||||||||||||
|
2010
|
2009
|
2008
|
2010 to 2009
|
2009 to 2008
|
||||||||||||||||||||||||
|
(in thousands)
|
||||||||||||||||||||||||||||
|
Provision for doubtful accounts
|
$ | (167 | ) | $ | 7,992 | $ | — | $ | (8,159 | ) | (102 | %) | $ | 7,992 | 100 | % | ||||||||||||
The provision for doubtful accounts recorded during 2009 was comprised of $2.5 million reserved for customers that filed for bankruptcy protection during the year and $5.5 million for contract disputes with customers. We intend to pursue all commercial and legal avenues for collection of the receivables currently reserved for in our allowance for doubtful accounts.
Gains on sales and other expense, net
|
Year Ended December 31,
|
Increase/(Decrease)
|
|||||||||||||||||||||||||||
|
2010
|
2009
|
2008
|
2010 to 2009
|
2009 to 2008
|
||||||||||||||||||||||||
|
(in thousands)
|
||||||||||||||||||||||||||||
|
Gain on sale of assets
|
$ | 1,325 | $ | 301 | $ | 204 | $ | 1,024 | 340 | % | $ | 97 | 48 | % | ||||||||||||||
|
Other expense, net
|
317 | 2,069 | 973 | (1,752 | ) | (85 | %) | 1,096 | 113 | % | ||||||||||||||||||
In 2010, we sold a portable saturation system to a third party for cash proceeds totaling $3.7 million and recognized a gain on the sale of $1.1 million, and we sold two utility vessels to different third parties for $0.6 million and recognized a gain on the sales of $0.1 million.
Other income (expense) is primarily from foreign currency gains and losses on transactions conducted in currencies other than the U.S. dollar. In addition, we recorded an impairment charge of $0.5 million during 2009 for abandonment of buildings and leasehold improvements.
Interest expense, net
|
Year Ended December 31,
|
Increase/(Decrease)
|
|||||||||||||||||||||||||||
|
2010
|
2009
|
2008
|
2010 to 2009
|
2009 to 2008
|
||||||||||||||||||||||||
|
(in thousands)
|
||||||||||||||||||||||||||||
|
Interest expense, net
|
$ | 9,060 | $ | 13,801 | $ | 21,312 | $ | (4,741 | ) | (34 | %) | $ | (7,511 | ) | (35 | %) | ||||||||||||
The decrease in interest expense, net from 2008 to 2009 and from 2009 to 2010 is primarily due to lower outstanding borrowings. Our debt level under our credit facility was $165.3 million, $235.0 million, and $315.0 million at December 31, 2010, 2009, and 2008, respectively.
Income tax expense (benefit)
|
Year Ended December 31,
|
Increase/(Decrease) (1)
|
|||||||||||||||||||
|
2010
|
2009
|
2008
|
2010 to 2009
|
2009 to 2008
|
||||||||||||||||
|
Income tax expense (benefit) including goodwill and fixed asset impairment charges
|
$ | (5,443 | ) | $ | 41,910 | $ | 47,927 | $ | (47,353 | ) | $ | (6,017 | ) | |||||||
|
Effect of the goodwill and fixed asset impairment charges
|
13,108 | — | — | 13,108 | — | |||||||||||||||
|
Income tax expense (benefit) excluding goodwill and fixed asset impairment charges
|
$ | 7,665 | $ | 41,910 | $ | 47,927 | $ | (34,245 | ) | $ | (6,017 | ) | ||||||||
_____________________________
(1) Percentage is not meaningful.
Our effective tax rate was 1.7%, 35.4%, and 30.4% for the years ended December 31, 2010, 2009, and 2008, respectively. Because we generated a pre-tax loss for the year ended December 31, 2010, the lower effective tax rate results in a lower tax benefit realized. The change in our effective tax rate during the year ended December 31, 2010 compared to 2009 and 2008 was primarily due to the impairment charges related to non-deductible goodwill, which decreased our current year effective tax rate by 30.3%.
Net Income (Loss)
|
Year Ended December 31,
|
Increase/(Decrease)
|
|||||||||||||||||||||||||||
|
2010
|
2009
|
2008
|
2010 to 2009
|
2009 to 2008
|
||||||||||||||||||||||||
|
(in thousands)
|
||||||||||||||||||||||||||||
|
Net income (loss)
|
$ | (315,849 | ) | $ | 76,627 | $ | 109,499 | $ | (392,476 | ) | (512 | %) | $ | (32,872 | ) | (30 | %) | |||||||||||
|
Weighted average fully-diluted shares outstanding
|
91,067 | 91,927 | 104,418 | (860 | ) | (1 | %) | (12,491 | ) | (12 | %) | |||||||||||||||||
|
Fully-diluted earnings (loss) per share
|
$ | (3.47 | ) | $ | 0.81 | $ | 1.03 | $ | (4.28 | ) | (528 | %) | $ | (0.22 | ) | (21 | %) | |||||||||||
As a result of the factors described above, (i) net income decreased from a net income of $76.6 million in 2009 to a net loss of $315.8 million in 2010, and fully-diluted earnings per share decreased from earnings per share of $0.81 in 2009 to a loss per share of $3.47 in 2010 , and (ii) net income decreased from 2008 to 2009 by $32.9 million, or 30%, and fully-diluted earnings per share decreased by $0.22 per share, or 21%. Partially offsetting the decrease in fully-diluted earnings per share in 2009 was a 12% reduction in weighted average fully-diluted shares outstanding from 2008 to 2009, primarily as a result of the repurchase from Helix and retirement of 15.2 million shares of our common stock during 2009.
Liquidity and Capital Resources
We require capital to fund ongoing operations, organic growth initiatives and pursue joint ventures or acquisitions. Our primary sources of liquidity are cash flows generated from our operations, available cash and cash equivalents and availability under our revolving credit facility. We use, and intend to continue using, these sources of liquidity to fund our working capital requirements, maintenance capital expenditures, strategic investments and acquisitions. For 2011, we anticipate capital expenditures, excluding acquisitions or investments in joint ventures, of approximately $60.9 million for vessel improvements and replacements, and $11.7 million of regulatory drydock costs. In connection with our business strategy, we regularly evaluate acquisition and joint venture opportunities, including vessels and marine contracting businesses. We believe that our liquidity will provide the necessary capital to fund our business activities and achieve our near-term and long-term growth objectives. We expect to be able to fund our activities for 2011 with cash flows generated from our operations, available cash and cash equivalents, and available borrowings under our revolving credit facility.
We have a credit facility, which consists of a variable-interest term loan and a variable-interest $300 million revolving credit facility, with certain financial institutions. At December 31, 2010, we had outstanding debt of $165.3 million under our term loan, including current maturities, and no debt outstanding under our revolving credit facility. The revolving credit facility and the term loan mature on December 11, 2012, with quarterly principal payments of $14.8 million payable on the term loan and a final payment of $61.5 million due on maturity. We may prepay all or any portion of the outstanding balance of the term loan without prepayment penalty. We may borrow from or repay the revolving credit facility as business needs merit. At December 31, 2010, we were in compliance with all debt covenants under our facility.
As of December 31, 2010, we had $24.6 million of cash on hand, $217.8 million available for borrowing under our revolving credit facility, issued and outstanding letters of credit of $0.3 million under our revolving credit facility, and no outstanding warranty bonds.
Effective July 19, 2010, we amended the credit facility to, among other things, (i) increase our permitted consolidated leverage ratio covenant, (ii) amend the amortization of a portion of our term loan, and (iii) permit us to transfer in the future two of our saturation diving vessels operating internationally (the Eclipse and the Texas ) to one of our international subsidiaries and to release such vessels as collateral upon any such future transfer (in December 2010 we completed the transfer of the Eclipse as permitted by the terms of the amendment).
Under the amendment, our permitted debt to EBITDA leverage ratio was increased from 3.75x to 4.75x for the period through June 30, 2011, decreasing to 4.25x through September 30, 2011, and thereafter returning to 3.75x. In addition, the amortization of a portion of the debt outstanding under the term loan was deferred until the maturity date, reducing our quarterly principal payments on the term loan from $20.0 million to $14.8 million, with a final payment of $61.5 million due on December 11, 2012. Our current blended total interest rate for the term loan at December 31, 2010 is approximately 2.88%.
Although we were in full compliance with the leverage ratio covenant, and anticipated continued compliance in the future, we took the proactive measure to secure the amendment to enhance our access to cash and liquidity in the future. The impairment charges related to goodwill and the four idle construction barges have no effect on our debt covenants under our credit facility. Based on our consolidated leverage ratio and outstanding borrowings and letters of credit as of December 31, 2010, we have $217.8 million available for borrowing under the revolving credit facility.
Cash Flows
Our cash flows depend on the level of spending by oil and natural gas companies for marine contracting services. Certain sources and uses of cash, such as the level of discretionary capital expenditures, issuance and repurchases of debt and of our common stock, are within our control and are adjusted as necessary based on market conditions. The following is a discussion of our cash flows for the years ended December 31, 2010 and 2009.
Operating Activities. Net cash provided by operating activities totaled $79.4 million during 2010 compared to $234.9 million during 2009. During 2010, net income adjusted for net non-cash items, such as depreciation and amortization, stock-based compensation and deferred income taxes, provided $63.5 million of cash, and net changes in our working capital and other balance sheet accounts used $15.9 million of cash. During 2009, net income adjusted for non-cash items, such as depreciation and amortization, stock-based compensation and provision for doubtful accounts, provided $172.4 million of cash, and net changes in our working capital and other balance sheet accounts provided $62.5 million of cash.
Investing Activities. Net cash used for investing activities was $37.9 million during 2010 compared to $63.0 million during 2009. During 2010 and 2009, cash used for capital expenditures were $42.3 million and $63.0 million, respectively, and cash provided by sales of assets was $4.5 million during 2010.
Financing Activities. Net cash used for financing activities was $69.7 million during 2010 compared to $180.0 million in 2009. During 2010, we borrowed $25.0 million under our revolving credit facility to meet working capital needs. We made scheduled payments of $69.7 million under our term loan and re-paid the entire $25.0 million outstanding under our revolving credit facility, which resulted in no amounts being outstanding under our revolving credit facility as of December 31, 2010. During 2009, we borrowed $100 million under our revolving credit facility to fund the $100 million repurchase of our common stock from Helix. We made scheduled payments of $80 million under our term loan and re-paid the $100 million outstanding under our revolving credit facility, which resulted in no amounts being outstanding under our revolving credit facility as of December 31, 2009.
Contractual and Other Obligations
We lease several facilities worldwide and accommodations for certain employees located outside the U.S. under noncancelable operating leases. Total rental expense under these operating leases was approximately $5.0 million, $5.4 million and $5.2 million for the years ended December 31, 2010, 2009 and 2008, respectively.
At December 31, 2010, our contractual obligations for long-term debt, operating leases, purchase commitments and other payables were as follows:
|
Payments Due by Period
|
||||||||||||||||||||
|
Total
|
Less than
1 year
|
1 to 3 years
|
3 to 5 years
|
More than
5 Years
|
||||||||||||||||
|
(in thousands)
|
||||||||||||||||||||
|
Long-term financing obligations(1)
|
||||||||||||||||||||
|
Principal
|
$ | 165,336 | $ | 59,328 | $ | 106,008 | $ | — | $ | — | ||||||||||
|
Interest
|
9,200 | 5,462 | 3,738 | — | — | |||||||||||||||
|
Noncancelable operating leases and charters(2)
|
15,903 | 3,578 | 5,780 | 5,432 | 1,113 | |||||||||||||||
|
Long-term tax payable to Helix(3)
|
1,691 | 974 | 583 | 134 | — | |||||||||||||||
|
Interest rate swap
|
282 | 282 | — | — | — | |||||||||||||||
|
Total contractual obligations
|
$ | 192,412 | $ | 69,624 | $ | 116,109 | $ | 5,566 | $ | 1,113 | ||||||||||
|
|
|
(1)
|
Represents the term loan under our credit facility - see Note 5 to our consolidated financial statements. Assumes an interest rate based on three month LIBOR at December 31, 2010 plus a margin of 2.25% and commitment fees of 0.4% on unused portion of revolver.
|
|
(2)
|
See Note 8 to our consolidated financial statements under the caption “Lease Commitments.”
|
|
(3)
|
See Note 3 to our consolidated financial statements.
|
Off-Balance Sheet Arrangements
As of December 31, 2010, we have no off-balance sheet arrangements. For information regarding our principles of consolidation, see Note 2 to our consolidated financial statements.
Critical Accounting Estimates and Policies
Our accounting policies are described in Note 2 to our consolidated financial statements. We prepare our financial statements in conformity with U.S. generally accepted accounting principles. Our results of operations and financial condition, as reflected in our consolidated financial statements and related notes, are subject to management’s evaluation and interpretation of business conditions, changing capital market conditions and other factors that could affect the ongoing viability of our business and our customers. We believe the most critical accounting policies in this regard are those described below. While these issues require us to make judgments that are somewhat subjective, they are generally based on a significant amount of historical data and current market data.
Revenue Recognition
We determine the appropriate revenue recognition accounting method for each of our contracts at the beginning of the project. Most of our revenues are derived from contracts that have a short duration. These contracts contain either qualified lump-sum provisions or provisions for specific time, material and equipment charges, which we bill in accordance with the terms of such contracts.
Revenue generated from qualified lump-sum contracts is recognized on the percentage-of-completion method based on the ratio of costs incurred to total estimated costs at completion. Changes in the expected cost of materials and labor, productivity, scheduling and other factors may affect the total estimated costs. Additionally, external factors, including weather or other factors outside of our control, may also affect the progress and estimated cost of a project’s completion and, therefore, delay the timing of income and revenue recognition. We routinely review estimates related to our contracts and reflect revisions to profitability in earnings on a current basis. If a current estimate of total contract cost indicates an ultimate loss on a contract, we recognize the projected loss in full when it is first determined as required under generally accepted accounting principles. We recognize additional contract revenue related to claims when the claim is probable and legally enforceable.
In determining whether a contract should be accounted for using the percentage-of-completion method, we follow the accounting guidelines for the performance of construction-type contracts. The use of this method is based on our experience and history of being able to prepare reasonably dependable estimates of the cost to complete our projects. Although we constantly seek to improve our ability to estimate revenue, contract costs and profitability, adjustments to total contract costs due to unanticipated events could be significant in future periods.
Revenues generated from specific time, materials and equipment contracts are generally earned on a dayrate basis and recognized as delivery has occurred or services have been rendered, price is fixed or determinable and collection is reasonably assured.
Property and Equipment
We record our property and equipment at cost, net of recorded impairments. We depreciate our assets primarily on the straight-line method over their estimated useful lives. Our estimates of useful lives of our assets are as follows: vessels — 15 to 20 years; portable saturation diving systems — ten to 20 years; machinery and equipment — five to ten years; and buildings and leasehold improvements — three to 20 years. Major replacements and improvements, which extend the vessel’s economic useful life or functional operating capability, are capitalized and depreciated over their economic useful lives. We expense the costs of repairs and maintenance which do not materially prolong the useful life of the property and equipment as incurred. Inherent in this process are estimates we make regarding the specific cost incurred and the period that the incurred cost will benefit.
We evaluate our property and equipment for impairment whenever events or changes in circumstances indicate that the carrying amounts of our property and equipment may not be recoverable. We base our evaluation on impairment indicators such as the nature of the assets, the future economic benefit of the assets, any historical or future profitability measurements and other external market conditions. If such impairment indicators are present, we determine whether an impairment has occurred through projected net undiscounted cash flows based on expected operating results over the remaining life of the asset group. The cash flows are based on historical data adjusted for management estimates of future market performance that rely on existing market data, industry trends, expected utilization and margins. Management’s estimates may vary considerably from actual outcomes due to future adverse market conditions, poor operating results, or other factors that could result in our inability to recover the current carrying value of long-lived assets, which could possibly require an impairment charge in the future. We recorded $23.2 million of impairment charges related to certain fixed assets, consisting of four idle construction barges for which the outlook for future utilization is uncertain. We recorded an impairment charge of $0.5 million in 2009 for buildings and leasehold improvements we have abandoned.
Recertification Costs and Deferred Drydock Costs
Our vessels are required by regulation to be recertified after certain periods of time. Typically, these recertification costs are incurred while the vessel is in drydock. We defer these costs and amortize them over the period commencing with the date the vessel returned to service following completion of the drydock process to the next certificate expiry date, which typically ranges from 24 months to 60 months. A drydock and related recertification process typically lasts one to two months, a period during which the vessel is not available to earn revenue. Inherent in this process are estimates we make regarding the specific cost incurred and the period that the incurred cost will benefit.
Goodwill and Fixed Asset Impairments
Under Accounting Standards Codification (“ASC”) Topic 350, Intangibles – Goodwill and Other and ASC Topic 360, Property, Plant and Equipment, we perform an annual impairment test of goodwill and long-lived assets. We elected November 1st as our annual impairment assessment date for goodwill and other intangible assets. In certain circumstances, we also test for impairment of goodwill between annual tests if a triggering event occurs, such as significant adverse change in the business climate, unexpected significant declines in operating results, an adverse action by a regulator, emergence of unanticipated competition, loss of key personnel or a decline in market capitalization. Our goodwill impairment test is based on our single operating and reporting unit and involves a comparison of the fair value of the unit with its carrying amount. The fair value is determined using market-related valuation models and discounted cash flows.
During the third quarter of 2010, our market capitalization declined by approximately 22% from $551.2 million at June 30, 2010 to $430.4 million at August 31, 2010, which was lower by $256.4 million, or 37%, than our equity book value at August 31, 2010. The Macondo well disaster has significantly and adversely disrupted oil and gas exploration activities in the Gulf of Mexico and there is increased uncertainty in the market and regulatory environment for our industry which has had a negative effect on our customer’s spending levels. The duration of this disruption is currently unknown and this has negatively impacted the outlook for activity levels in the Gulf of Mexico. In light of the continued decline in our stock price and market capitalization and challenging and uncertain business climate during 2010, management determined that a triggering event had occurred necessitating the performance of an interim impairment test. As a result, we commenced an interim assessment of our goodwill, which we completed as of August 31, 2010.
Goodwill impairment is determined using a two-step process. In the first step, if the fair value of our reporting unit exceeds its carrying amount, goodwill of the reporting unit is not considered to have a potential impairment and the second step of the impairment test is not necessary. However, if the carrying amount of our reporting unit exceeds its fair value, the second step of the process is performed to determine if goodwill is impaired and to measure the amount of impairment loss to recognize, if any.
Under the first step of the process, we estimated the fair value of our reporting unit using both a market-related and discounted cash flow valuation approach. Under the market-related approach, the fair value of our reporting unit is calculated by applying an average peer total invested capital to EBITDA (defined as earnings before interest, income taxes and depreciation and amortization) multiple to forecasted EBITDA for the reporting unit. We exercise our judgment in selecting peer companies that operate in the same or similar lines of business as ours and are potentially subject to similar market risks. Under the income approach, a discounted cash flow analysis is performed requiring us to make various assumptions about our discount rate, future revenue, operating margins, capital expenditures and growth rates. These assumptions are based on historical operating results, long-term business plans, economic projections, anticipated future cash flows and marketplace data. These fair value measurements fall within Level 3 under ASC Topic 820, Fair Value Measurements and Disclosures.
The second step of the process compared the implied fair value of goodwill with the carrying amount of goodwill. To the extent that our reporting unit’s carrying amount exceeds the implied fair value of its goodwill, an impairment loss is recognized in an amount equal to that excess. The implied fair value of goodwill is determined in the same manner as the amount of goodwill recognized in a business combination, through allocation of the fair value of the reporting unit to all of the assets and liabilities, including any unrecognized intangible assets, as if the reporting unit had been acquired in a business combination.
Based on the first step calculation of our goodwill impairment test, the carrying amount of our reporting unit exceeded its fair value, which required us to perform the second step of the impairment test. In the second step, the fair value of goodwill and fixed assets was generally estimated using an income valuation approach. Based on our 2010 goodwill impairment analysis, we recorded $292.5 million of pre-tax goodwill impairment expense.
Income Taxes
In accordance with ASC Topic 740, “Income Taxes,” we recognize income tax expense for the amount of taxes payable or refundable for the current year and deferred tax liabilities and assets for the future tax consequences of events that have been recognized in our financial statements or tax returns. The current provision for income tax is based upon the current tax laws and our interpretation of these laws, as well as the probable outcomes of any foreign or domestic tax audits. A valuation allowance for deferred tax assets is recorded when it is more likely than not that some or all of the benefit from the deferred tax asset will not be realized. We compute deferred income taxes using the liability method. We provide for deferred income taxes on all temporary differences between the financial-reporting basis and the tax basis of our assets and liabilities by applying enacted statutory tax rates, applicable to future years. Allowable tax credits are applied currently as reductions to the provisions for income taxes.
Our most significant judgments on tax related matters include tax valuation allowances and uncertain tax positions. These matters involve the exercise of significant judgment which could change and materially impact our financial condition or results of operations. The realization of our deferred tax assets depends on recognition of sufficient future taxable income in specific tax jurisdictions during periods in which those temporary differences are deductible. Valuation allowances are established when necessary to reduce deferred income tax assets to the amounts we believe are more likely than not to be recovered. In evaluating our valuation allowance, we consider the reversal of existing temporary differences, the existence of taxable income in prior carryback years, tax planning strategies and future taxable income for each of our taxable jurisdictions, the latter two of which involve the exercise of significant judgment. Changes to our valuation allowance could materially impact our results of operations. We have liabilities for unrecognized tax benefits related to uncertain tax positions connected with ongoing examinations and open tax years. Changes in our assessment of these liabilities may require us to increase the liability and record additional tax expense or reverse the liability and recognize a tax benefit which would positively or negatively impact our effective tax rate.
We do not provide for U.S. income taxes on foreign subsidiaries’ undistributed earnings intended to be permanently reinvested in foreign operations.
For financial reporting purposes, our provision for income taxes has been computed on the basis that we have completed and filed separate federal income tax returns for all periods presented.
Allowance for Doubtful Accounts
We maintain an allowance for doubtful accounts to record accounts receivable at their net realizable value. A significant amount of judgment is involved in recording and making adjustments to this reserve. Allowances have been recorded for receivables believed to be uncollectible, including amounts for the resolution of potential credit and other collection issues such as disputed invoices, customer satisfaction claims and pricing discrepancies. Depending on how these issues are resolved, or if the financial condition of our customers were to deteriorate resulting in an impairment of their ability to make payments, adjustments to the allowance may be required.
Loss Contingencies
We accrue loss contingency reserves when our assessments indicate that it is probable that a liability has been incurred and an amount can be reasonably estimated. Estimates of our liabilities are based on an evaluation of potential outcomes and currently available facts. We attempt to resolve these matters through settlements, mediation and arbitration proceedings when possible. Actual results may differ from our estimates, and our estimates can be revised in the future, either negatively or positively, depending upon actual outcomes or changes in expectations based on the facts surrounding each matter.
Recently Issued Accounting Principles
Each reporting period we consider all newly issued but not yet adopted accounting and reporting guidance applicable to our operations and the preparation of our consolidated financial statements. We do not believe that any issued accounting and reporting guidance we have not yet adopted will have a material impact on our consolidated financial statements.
Item 7A. Quantitative and Qualitative Disclosures About Market Risk
We are exposed to market risks in our normal business activities. Market risk is the potential loss that may result from market changes associated with existing or forecasted financial transactions. The types of market risks to which we are exposed are credit risk, interest rate risk and foreign currency exchange rate risk.
Credit Risk. Our financial instruments that potentially subject us to concentrations of credit risk consist primarily of cash equivalents and accounts receivable. Cash equivalents such as deposits and temporary cash investments are held by major banks. Our trade receivables are with a variety of U.S., international and foreign-country national oil and natural gas companies. Management considers this credit risk to be limited due to the financial resources of these companies. We perform ongoing credit evaluations of our customers and we generally do not require material collateral to support contractual payment obligations. We maintain reserves for potential credit losses.
Interest Rate Risk. At December 31, 2010, we had $165.3 million of variable-rate debt outstanding under our credit facility. Changes based on the floating interest rates under this facility could result in an increase or decrease in our annual interest expense and related cash outlay. To reduce the impact of this market risk, in August 2010 we entered into a twelve-month interest rate swap with a notional amount of $100 million to convert a portion of our anticipated variable-rate interest payments under our term loan to fixed-rate interest payments. We expect this interest rate swap to effectively fix our variable interest payments made on $100 million of our term loan, at 0.645% plus the current average applicable loan margin of approximately 2.25% for a total interest rate of 2.88% for the remaining term of the interest rate hedge. A hypothetical increase of 10% in quoted interest rates as of December 31, 2010 would increase interest expense by $0.4 million and $0.3 million in 2011 and 2012, respectively.
Foreign Currency Exchange Rate Risk. We have operations in foreign locations that subject us to market risk from changes in foreign currency exchange rates. Although the vast majority of our business is transacted in U.S. dollars, we transact some business in Euro-dollars, Mexican pesos, Singapore dollars, and Australian dollars, among others. Historically, foreign currency exchange rate risk has not been material to our business and we have not entered into any foreign exchange contracts. At various times, we utilize the payment structure of customer contracts to selectively hedge our exposure to exchange rate fluctuations in connection with monetary assets, liabilities, cash flows and commitments denominated in certain foreign currencies. As we continue to grow our international operations, foreign currency exchange rate risk may become more significant and we may mitigate our foreign currency risk with foreign currency derivative instruments in the future.
Item 8. Financial Statements and Supplementary Data
INDEX TO FINANCIAL STATEMENTS
|
|
Page
|
|
38
|
|
|
39
|
|
|
40
|
|
|
41
|
|
|
42
|
|
|
43
|
REPORT OF INDEPENDENT REGISTERED PUBLIC ACCOUNTING FIRM
The Board of Directors and Stockholders of
Cal Dive International, Inc. and Subsidiaries
We have audited the accompanying consolidated balance sheets of Cal Dive International, Inc. and subsidiaries as of December 31, 2010 and 2009, and the related consolidated statements of operations, stockholders' equity and comprehensive income (loss), and cash flows for each of the three years in the period ended December 31, 2010. Our audits also included the financial statement schedule listed in the Index at Item 15(a). These financial statements and schedule are the responsibility of the Company's management. Our responsibility is to express an opinion on these financial statements and schedule based on our audits.
We conducted our audits in accordance with the standards of the Public Company Accounting Oversight Board (United States). Those standards require that we plan and perform the audit to obtain reasonable assurance about whether the financial statements are free of material misstatement. An audit includes examining, on a test basis, evidence supporting the amounts and disclosures in the financial statements. An audit also includes assessing the accounting principles used and significant estimates made by management, as well as evaluating the overall financial statement presentation. We believe that our audits provide a reasonable basis for our opinion.
In our opinion, the financial statements referred to above present fairly, in all material respects, the consolidated financial position of Cal Dive International, Inc. and subsidiaries at December 31, 2010 and 2009, and the consolidated results of their operations and their cash flows for each of the three years in the period ended December 31, 2010, in conformity with U.S. generally accepted accounting principles. Also, in our opinion, the related financial statement schedule, when considered in relation to the basic financial statements taken as a whole, presents fairly in all material respects the information set forth therein.
We also have audited, in accordance with the standards of the Public Company Accounting Oversight Board (United States), Cal Dive International, Inc. and subsidiaries’ internal control over financial reporting as of December 31, 2010, based on criteria established in Internal Control-Integrated Framework issued by the Committee of Sponsoring Organizations of the Treadway Commission and our report dated March 2, 2011 expressed an unqualified opinion thereon.
/s/ Ernst & Young LLP
Houston, Texas
March 2, 2011
Cal Dive International, Inc. and Subsidiaries
Consolidated Balance Sheets
(in thousands)
|
December 31,
|
||||||||
|
2010
|
2009
|
|||||||
|
ASSETS
|
||||||||
|
Current assets:
|
||||||||
|
Cash and cash equivalents
|
$ | 24,576 | $ | 52,413 | ||||
|
Accounts receivable:
|
||||||||
|
Trade, net of allowance for doubtful accounts of $6,039 and $7,286, respectively
|
86,239 | 119,499 | ||||||
|
Contracts in progress
|
26,829 | 24,511 | ||||||
|
Income tax receivable
|
2,182 | 2,173 | ||||||
|
Deferred income taxes
|
3,425 | 3,183 | ||||||
|
Other current assets
|
17,439 | 22,929 | ||||||
|
Total current assets
|
160,690 | 224,708 | ||||||
|
Property and equipment
|
799,757 | 797,387 | ||||||
|
Less - Accumulated depreciation
|
(231,966 | ) | (188,154 | ) | ||||
|
Net property and equipment
|
567,791 | 609,233 | ||||||
|
Other assets:
|
||||||||
|
Goodwill
|
― | 292,469 | ||||||
|
Deferred drydock costs
|
14,602 | 16,976 | ||||||
|
Other assets, net
|
9,218 | 12,593 | ||||||
|
Total assets
|
$ | 752,301 | $ | 1,155,979 | ||||
|
LIABILITIES AND STOCKHOLDERS’ EQUITY
|
||||||||
|
Current liabilities:
|
||||||||
|
Accounts payable
|
$ | 58,685 | $ | 49,680 | ||||
|
Advanced billings on contracts
|
5 | 3,512 | ||||||
|
Current maturities of long-term debt
|
59,328 | 80,000 | ||||||
|
Income tax payable
|
4,462 | 6,025 | ||||||
|
Accrued liabilities
|
23,276 | 39,668 | ||||||
|
Total current liabilities
|
145,756 | 178,885 | ||||||
|
Long-term debt
|
106,008 | 155,000 | ||||||
|
Deferred income taxes
|
109,434 | 121,973 | ||||||
|
Other long term liabilities
|
3,392 | 5,323 | ||||||
|
Total liabilities
|
364,590 | 461,181 | ||||||
|
Stockholders’ equity:
|
||||||||
|
Common stock, 240,000 shares authorized, $0.01 par value,
Issued and outstanding: 95,465 and 93,933 shares, respectively
|
954 | 939 | ||||||
|
Capital in excess of par value of common stock
|
406,891 | 399,199 | ||||||
|
Accumulated other comprehensive income
|
1,969 | 914 | ||||||
|
Retained (deficit) earnings
|
(22,103 | ) | 293,746 | |||||
|
Total stockholders’ equity
|
387,711 | 694,798 | ||||||
|
Total liabilities and stockholders’ equity
|
$ | 752,301 | $ | 1,155,979 | ||||
The accompanying notes are an integral part of these consolidated financial statements.
Cal Dive International, Inc. and Subsidiaries
Consolidated Statements of Operations
(in thousands, except per share amounts)
|
Year Ended December 31,
|
||||||||||||
|
|
2010
|
2009
|
2008
|
|||||||||
|
Revenues
|
$ | 536,468 | $ | 829,362 | $ | 856,906 | ||||||
|
Cost of sales
|
474,026 | 613,477 | 602,899 | |||||||||
|
Gross profit
|
62,442 | 215,885 | 254,007 | |||||||||
|
Goodwill impairment
|
292,469 | — | — | |||||||||
|
Fixed assets impairment
|
23,242 | — | — | |||||||||
|
Selling and administrative expenses
|
60,138 | 73,787 | 74,500 | |||||||||
|
Gain on sale of assets
|
1,325 | 301 | 204 | |||||||||
|
Provision for doubtful accounts
|
(167 | ) | 7,992 | — | ||||||||
|
Income (loss) from operations
|
(311,915 | ) | 134,407 | 179,711 | ||||||||
|
Interest expense, net
|
9,060 | 13,801 | 21,312 | |||||||||
|
Other expense, net
|
317 | 2,069 | 973 | |||||||||
|
Income (loss) before income taxes
|
(321,292 | ) | 118,537 | 157,426 | ||||||||
|
Income tax expense (benefit)
|
(5,443 | ) | 41,910 | 47,927 | ||||||||
|
Net income (loss)
|
$ | (315,849 | ) | $ | 76,627 | $ | 109,499 | |||||
|
Net income (loss) per common share:
|
||||||||||||
|
Basic and fully-diluted
|
$ | (3.47 | ) | $ | 0.81 | $ | 1.03 | |||||
|
Weighted average shares outstanding:
|
||||||||||||
|
Basic
|
91,067 | 91,884 | 104,418 | |||||||||
|
Fully-diluted
|
91,067 | 91,927 | 104,418 | |||||||||
The accompanying notes are an integral part of these consolidated financial statements.
Cal Dive International, Inc. and Subsidiaries
Consolidated Statements of Stockholders’ Equity and Comprehensive Income (Loss)
(in thousands)
|
Accumulated
|
||||||||||||||||||||||||
|
Other
|
||||||||||||||||||||||||
|
Capital
|
Compre-
|
Total
|
||||||||||||||||||||||
|
Common Stock
|
in Excess
|
hensive
|
Retained
|
Stockholders’
|
||||||||||||||||||||
|
Shares
|
Par value
|
of Par
|
Income (loss)
|
Earnings
|
Equity
|
|||||||||||||||||||
|
Balances at December 31, 2007
|
105,159 | $ | 1,051 | $ | 479,236 | $ | — | $ | 107,620 | $ | 587,907 | |||||||||||||
|
Net income
|
109,499 | 109,499 | ||||||||||||||||||||||
|
Foreign currency translation adjustment
|
(216 | ) | (216 | ) | ||||||||||||||||||||
|
Unrealized loss from cash flow hedge (net of income tax of $603)
|
(1,122 | ) | (1,122 | ) | ||||||||||||||||||||
|
Comprehensive income
|
108,161 | |||||||||||||||||||||||
|
Stock-based compensation plans
|
2,339 | 24 | 9,605 | 9,629 | ||||||||||||||||||||
|
Balances at December 31, 2008
|
107,498 | 1,075 | 488,841 | (1,338 | ) | 217,119 | 705,697 | |||||||||||||||||
|
Net income
|
76,627 | 76,627 | ||||||||||||||||||||||
|
Foreign currency translation adjustment
|
1,539 | 1,539 | ||||||||||||||||||||||
|
Decrease in unrealized loss from cash flow hedge (net of income tax of $384)
|
713 | 713 | ||||||||||||||||||||||
|
Comprehensive income
|
78,879 | |||||||||||||||||||||||
|
Repurchase and retirement of stock from Helix
|
(15,212 | ) | (152 | ) | (99,848 | ) | (100,000 | ) | ||||||||||||||||
|
Stock-based compensation plans
|
1,647 | 16 | 10,206 | 10,222 | ||||||||||||||||||||
|
Balances at December 31, 2009
|
93,933 | 939 | 399,199 | 914 | 293,746 | 694,798 | ||||||||||||||||||
|
Net (loss)
|
(315,849 | ) | (315,849 | ) | ||||||||||||||||||||
|
Foreign currency translation adjustment
|
796 | 796 | ||||||||||||||||||||||
|
Decrease in unrealized loss from cash flow hedge (net of income tax of $139)
|
259 | 259 | ||||||||||||||||||||||
|
Comprehensive loss
|
(314,794 | ) | ||||||||||||||||||||||
|
Stock-based compensation plans
|
1,532 | 15 | 7,692 | 7,707 | ||||||||||||||||||||
|
Balances at December 31, 2010
|
95,465 | $ | 954 | $ | 406,891 | $ | 1,969 | $ | (22,103 | ) | $ | 387,711 | ||||||||||||
The accompanying notes are an integral part of these consolidated financial statements.
Cal Dive International, Inc. and Subsidiaries
Consolidated Statements of Cash Flows
(in thousands)
|
Year Ended December 31,
|
||||||||||||
|
|
2010
|
2009
|
2008
|
|||||||||
|
Cash Flows From Operating Activities:
|
||||||||||||
|
Net income (loss)
|
$ | (315,849 | ) | $ | 76,627 | $ | 109,499 | |||||
|
Adjustments to reconcile net income to net cash provided by operating activities:
|
||||||||||||
|
Depreciation and amortization
|
68,961 | 76,313 | 71,195 | |||||||||
|
Stock compensation expense
|
7,427 | 7,272 | 6,021 | |||||||||
|
Deferred income tax expense (benefit)
|
(12,755 | ) | 2,427 | 24,883 | ||||||||
|
Loss (gain) on sale of assets
|
(1,325 | ) | 99 | (204 | ) | |||||||
|
Provision for doubtful accounts
|
(167 | ) | 7,992 | — | ||||||||
|
Deferred financing costs
|
1,497 | 1,172 | 1,165 | |||||||||
|
Goodwill impairment
|
292,469 | — | — | |||||||||
|
Fixed assets impairment
|
23,242 | 530 | — | |||||||||
|
Changes in operating assets and liabilities:
|
||||||||||||
|
Accounts receivable, net
|
31,391 | 128,729 | 6,838 | |||||||||
|
Other current assets
|
2,732 | (298 | ) | (2,170 | ) | |||||||
|
Deferred drydock costs
|
(6,639 | ) | (12,868 | ) | (15,842 | ) | ||||||
|
Accounts payable and accrued liabilities
|
(11,635 | ) | (53,513 | ) | (53,974 | ) | ||||||
|
Other noncurrent assets and liabilities, net
|
25 | 382 | (7,506 | ) | ||||||||
|
Net cash provided by operating activities
|
79,374 | 234,864 | 139,905 | |||||||||
|
Cash Flows From Investing Activities:
|
||||||||||||
|
Additions to property and equipment
|
(42,328 | ) | (63,024 | ) | (83,108 | ) | ||||||
|
Proceeds from sales of property and equipment
|
4,455 | 17 | 2,472 | |||||||||
|
Net cash used in investing activities
|
(37,873 | ) | (63,007 | ) | (80,636 | ) | ||||||
|
Cash Flows From Financing Activities:
|
||||||||||||
|
Draws on revolving credit facility
|
25,000 | 100,000 | 61,100 | |||||||||
|
Repayments of revolving credit facility
|
(25,000 | ) | (100,000 | ) | (61,100 | ) | ||||||
|
Repayments on term loan under credit facility
|
(69,664 | ) | (80,000 | ) | (60,000 | ) | ||||||
|
Repurchase of common stock
|
— | (100,000 | ) | — | ||||||||
|
Net cash provided by (used in) financing activities
|
(69,664 | ) | (180,000 | ) | (60,000 | ) | ||||||
|
Effect of exchange rate on cash and cash equivalents
|
326 | — | — | |||||||||
|
Net increase (decrease) in cash and cash equivalents
|
(27,837 | ) | (8,143 | ) | (731 | ) | ||||||
|
Cash and cash equivalents:
|
||||||||||||
|
Balance, beginning of year
|
52,413 | 60,556 | 61,287 | |||||||||
|
Balance, end of year
|
$ | 24,576 | $ | 52,413 | $ | 60,556 | ||||||
|
Supplemental cash flow information:
|
||||||||||||
|
Interest paid, net of amounts capitalized
|
$ | 7,454 | $ | 10,996 | $ | 20,704 | ||||||
|
Income taxes paid (refunded), net
|
$ | 11,779 | $ | 48,050 | $ | (2,867 | ) | |||||
The accompanying notes are an integral part of these consolidated financial statements.
Cal Dive International, Inc. and Subsidiaries
Notes to Consolidated Financial Statements
1. Organization
We are a marine contractor that provides manned diving, pipelay and pipe burial, platform installation and platform salvage services to a diverse customer base in the offshore oil and natural gas industry. We offer our customers these complementary services on an integrated basis for more complex subsea projects, which provides them with greater efficiency in the completion of their work, while enhancing the utilization of our fleet. Our headquarters are located in Houston, Texas.
Our global footprint encompasses operations in the Gulf of Mexico OCS, the Northeastern U.S., Latin America, Southeast Asia, China, Australia, the Middle East, India and the Mediterranean. We currently own and operate a diversified fleet of 29 vessels, including 19 surface and saturation diving support vessels, six pipelay/pipebury barges, one dedicated pipebury barge, one combination derrick/pipelay barge and two derrick barges.
2. Summary of Significant Accounting Policies
Principles of Consolidation
Our consolidated financial statements are prepared in accordance with U.S. generally accepted accounting principles and include the accounts of all majority owned and controlled subsidiaries after the elimination of all significant intercompany transactions. Our financial statements for prior periods include reclassifications that are made to conform to the current year presentation. These reclassifications did not impact our reported net income (loss) or stockholders’ equity.
We consolidate entities when we either (i) have the ability to control the operating and financial decisions and policies of that entity or (ii) are allocated a majority of the entity’s losses and/or returns through our variable interests in that entity. The determination of our ability to control or exert significant influence over an entity and whether we are allocated a majority of the entity’s losses and/or returns involves the use of judgment. We apply the equity method of accounting where we can exert significant influence over, but do not control, the policies and decisions of an entity and where we are not allocated a majority of the entity’s losses and/or returns. We use the cost method of accounting where we are unable to exert significant influence over the entity.
Subsequent Events
We conducted our subsequent events review through the date these annual consolidated financial statements were filed with the SEC.
Use of Estimates
The preparation of consolidated financial statements in conformity with U.S. generally accepted accounting principles requires management to make estimates and assumptions that affect the reported amounts of assets and liabilities and disclosure of contingent assets and liabilities at the date of the consolidated financial statements and the reported amounts of revenues and expenses during the reporting period. On an ongoing basis, we evaluate our estimates, including those related to bad debts, equity investments, intangible assets and goodwill, property and equipment, income taxes, workers’ compensation insurance, revenues, expected costs to complete construction and capital projects and contingent liabilities. In making judgments about the estimated carrying values of assets and liabilities, we use our historical experience and various other assumptions that we believe to be reasonable under the circumstances. These estimates may be revised from time to time with changes in experience or in assumptions, and actual results may differ from estimates.
Revenue Recognition
We determine the appropriate revenue accounting method for each of our contracts at the beginning of the project. Most of our revenues are derived from contracts that have a short duration. These contracts contain either qualified lump-sum provisions or provisions for specific time, material and equipment charges, which we bill in accordance with the terms of such contracts. We recognize revenue as it is earned at estimated collectible amounts.
Revenues generated from specific time, materials and equipment contracts are generally earned on a dayrate basis and recognized as amounts are earned in accordance with contract terms. Under these contracts, we may receive revenues for the mobilization of equipment and personnel, and incur incremental costs for mobilization of equipment and personnel to the contracted site, which typically consist of materials, supplies and transit costs. We defer revenue and costs related to mobilization and amortize them on a straight-line basis over the estimated contract service period, which is consistent with the general pace of activity, level of services being provided and dayrates being earned over the service period of the contract. Mobilization costs to move vessels when a contract does not exist are expensed as incurred.
Revenue on significant qualified lump-sum contracts is recognized on the percentage-of-completion method based on the ratio of costs incurred to total estimated costs at completion. In determining whether a contract should be accounted for using the percentage-of-completion method, we consider whether:
|
·
|
the customer provides specifications for the construction of facilities or for the provision of related services;
|
|
·
|
we can reasonably estimate our progress towards completion and our costs;
|
|
·
|
the contract includes provisions as to the enforceable rights regarding the goods or services to be provided, consideration to be received and the manner and terms of payment;
|
|
·
|
the customer can be expected to satisfy its obligations under the contract; and
|
|
·
|
we can be expected to perform our contractual obligations.
|
Under the percentage-of-completion method, we recognize estimated contract revenue based on costs incurred to date as a percentage of total estimated costs. Changes in the expected cost of materials and labor, productivity, scheduling and other factors may affect the total estimated costs. Additionally, external factors, including weather or other factors outside of our control, may also affect the progress and estimated cost of a project’s completion and, therefore, delay the timing of income and revenue recognition. We routinely review estimates related to our contracts and reflect revisions to profitability in earnings on a current basis. If a current estimate of total contract cost indicates an ultimate loss on a contract, we recognize the projected loss in full when it is first determined. We recognize additional contract revenue related to claims when the claim is probable and legally enforceable.
The asset “contracts in progress” represents revenues from time, materials and equipment contracts for work performed during the period that has not yet been invoiced, and costs and estimated earnings recognized as revenue on the percentage-of-completion method in excess of amounts billed as determined on an individual contract basis. The liability “advance billings on contracts” represents amounts billed in excess of costs, and estimated earnings recognized as revenue on the percentage-of-completion method on an individual contract basis. All amounts included in contracts in progress at December 31 are expected to be billed and collected within one year. The following is a summary of the components of contracts in progress (dollars in thousands):
|
December 31,
|
||||||||
|
2010
|
2009
|
|||||||
|
Unbilled revenue from time, material and equipment contracts
|
$ | 8,813 | $ | 8,834 | ||||
|
Revenue recognized on the percentage-of-completion method in excess of amounts billed
|
18,016 | 15,677 | ||||||
| $ | 26,829 | $ | 24,511 | |||||
Cash and Cash Equivalents
We define cash and cash equivalents as cash and all highly liquid financial instruments with original maturities of less than three months.
Accounts Receivable and Allowance for Doubtful Accounts
We maintain an allowance for doubtful accounts to record accounts receivable at their net realizable value. A significant amount of judgment is involved in recording and making adjustments to this reserve. Allowances have been recorded for receivables believed to be uncollectible, including amounts for the resolution of potential credit and other collection issues such as disputed invoices, customer satisfaction claims and pricing discrepancies. Depending on how these issues are resolved, or if the financial condition of our customers were to deteriorate resulting in an impairment of their ability to make payments, adjustments to the allowance may be required and are charged to expense. The allowance for doubtful accounts was $6.0 million and $7.3 million for the years ended December 31, 2010 and 2009, respectively.
Retention is not immediately collectible under the retainage provisions of our contracts. We include retainages expected to be collected within one year in accounts receivable - trade. Retainages expected to be collected after one year are included in other assets. The following amounts represent retainages on contracts (dollars in thousands):
|
December 31,
|
||||||||
|
2010
|
2009
|
|||||||
|
Retainages expected to be collected within one year (1)
|
$ | 2,210 | $ | 2,210 | ||||
|
Retainages expected to be collected after one year
|
— | — | ||||||
|
Total retainages
|
$ | 2,210 | $ | 2,210 | ||||
__________________________
|
(1)
|
At December 31, 2009 we believed this amount to be current, however, we experienced delays in collecting this retainage. We now believe that collection will be completed in 2011.
|
Property and Equipment
Property and equipment are recorded at cost, net of recorded impairments. We depreciate our assets primarily on the straight-line method over their estimated useful lives. Depreciation expenses were $57.6 million, $53.2 million and $46.0 million for the years ended December 31, 2010, 2009 and 2008, respectively. The following is a summary of the components of property and equipment (dollars in thousands):
|
Estimated
|
December 31,
|
||||||||
|
Useful Life
|
2010
|
2009
|
|||||||
|
Vessels
|
15 to 20 years
|
$ | 632,952 | $ | 632,142 | ||||
|
Portable saturation diving systems
|
10 to 20 years
|
73,218 | 73,355 | ||||||
|
Machinery and equipment
|
5 to 10 years
|
47,454 | 48,757 | ||||||
|
Buildings, leasehold improvements and other
|
3 to 20 years
|
46,133 | 43,133 | ||||||
|
Total property and equipment
|
$ | 799,757 | $ | 797,387 | |||||
The cost of repairs and maintenance is charged to operations as incurred, while the cost of improvements is capitalized and depreciated over the useful life of the asset. Total repair and maintenance charges were $16.5 million, $25.3 million and $17.6 million for the years ended December 31, 2010, 2009 and 2008, respectively. When equipment is sold or otherwise disposed of, the cost of the equipment and accumulated depreciation are removed from the accounts, and any gain or loss is reflected in income.
For long-lived assets to be held and used, excluding goodwill, we base our evaluation of recoverability on impairment indicators such as the nature of the assets, the future economic benefit of the assets, any historical or future profitability measurements and other external market conditions or factors that may be present. If such impairment indicators are present or other factors exist that indicate the carrying amount of the asset may not be recoverable, we determine whether an impairment has occurred through the use of an undiscounted cash flows analysis of the asset group. If it is determined that an impairment has occurred, we recognize a loss for the difference between the carrying amount and the fair value of the asset. The fair value of the asset is measured using quoted market prices or, in the absence of quoted market prices, is based on an estimate of discounted cash flows the asset will generate in the future. We recorded $23.2 million in impairment charges related to certain fixed assets, consisting of four idle construction barges for which the outlook for future utilization is uncertain. We recorded an impairment charge of $0.5 million in 2009 for buildings and leasehold improvements we have abandoned. We recorded no impairment charges to property and equipment in 2008.
Assets are classified as held for sale and included in other current assets when we have a plan for disposal of certain assets and those assets meet the held for sale criteria as set forth in authoritative accounting guidance. At December 31, 2010 and 2009, we had no assets held for sale.
Recertification Costs and Deferred Drydock Charges
Our vessels are required by the various regulatory authorities in the jurisdictions in which we operate to be recertified from time to time, which requires the drydocking of the vessel. We incur recertification costs during the period when a vessel is in drydock. In addition, while the vessel is in drydock, routine repairs and maintenance of the vessel and, if necessary, major replacements and improvements, are performed. We expense routine repairs and maintenance costs when they are incurred. We defer and amortize drydock and related recertification costs over the period for which the certificate issued is valid, which ranges from 24 months to 60 months. A drydock and related recertification process typically takes between one to two months, a period during which the vessel is not available to earn revenue. Major replacements and improvements that extend the vessel’s economic useful life or functional operating capability, are capitalized as property and equipment and depreciated over the remaining estimated economic useful life of the vessel. Inherent in this process are estimates we make regarding the specific cost incurred and the period that the incurred cost will benefit the vessel and its operations.
Prior to January 1, 2010, we generally amortized drydock and recertification costs over 30 months. Effective January 1, 2010, we changed the period for amortization of these costs to commence with the date the vessel returned to service following completion of the drydock process to the next certificate expiry date, which typically ranges from 24 months to 60 months. The change in this amortization period was based on management’s assessment that the period for which the certificate is valid is a better measure of the length of time for which we expect to receive future benefits from the recertification and drydock process. This change in the estimated service life of our drydock and recertification costs had the effect of lengthening the amortization period for these costs, which decreased our loss from operations by $3.5 million ($0.04 per common share) for the year ended December 31, 2010. This change in estimate had no impact on our cash flows for the year ended December 31, 2010.
As of December 31, 2010 and 2009, capitalized deferred drydock and related recertification costs totaled $14.6 million and $17.0 million, respectively. During the years ended December 31, 2010, 2009 and 2008, drydock amortization expense was $9.1 million, $19.6 million and $19.9 million, respectively.
Goodwill and Fixed Assets Impairment
Under Accounting Standards Codification (“ASC”) Topic 350, Intangibles – Goodwill and Other and ASC Topic 360, Property, Plant and Equipment, we perform an annual impairment test of goodwill and long-lived assets. We elected November 1st as our annual impairment assessment date for goodwill and other intangible assets. In certain circumstances, we also test for impairment of goodwill between annual tests if a triggering event occurs, such as significant adverse change in the business climate, unexpected significant declines in operating results, an adverse action by a regulator, emergence of unanticipated competition, loss of key personnel or a decline in market capitalization. Our goodwill impairment test is based on our single operating and reporting unit and involves a comparison of the fair value of the unit with its carrying amount. The fair value is determined using market-related valuation models and discounted cash flows.
During the third quarter of 2010, our market capitalization declined significantly by approximately 22% from $551.2 million at June 30, 2010 to $430.4 million at August 31, 2010, which was lower by $256.4 million, or 37%, than our equity book value at August 31, 2010. The Macondo well disaster has significantly and adversely disrupted oil and gas exploration activities in the Gulf of Mexico and there is increased uncertainty in the market and regulatory environment for our industry which has had a negative effect on our customer’s spending levels. The duration of this disruption is currently unknown and this has negatively impacted the outlook for activity levels in the Gulf of Mexico. We believe these uncertain market conditions contributed to the significant decline in our stock price and market capitalization, and this prompted us to conclude that a triggering event had occurred requiring us to perform an interim impairment test. As a result, we commenced an interim assessment of our goodwill, which we completed as of August 31, 2010. Goodwill impairment is determined using a two-step process. In the first step, if the fair value of our reporting unit exceeds its carrying amount, goodwill of the reporting unit is not considered to have a potential impairment and the second step of the impairment test is not necessary. However, if the carrying amount of our reporting unit exceeds its fair value, the second step of the process is performed to determine if goodwill is impaired and to measure the amount of impairment loss to recognize, if any.
Under the first step of the process, we estimated the fair value of our reporting unit using both a market-related and discounted cash flow valuation approach. Under the market-related approach, the fair value of our reporting unit is calculated by applying an average peer total invested capital to EBITDA (defined as earnings before interest, income taxes and depreciation and amortization) multiple to forecasted EBITDA for the reporting unit. We exercise our judgment in selecting peer companies that operate in the same or similar lines of business as ours and are potentially subject to similar market risks. Under the income approach, a discounted cash flow analysis is performed requiring us to make various assumptions about our discount rate, future revenue, operating margins, capital expenditures and growth rates. These assumptions are based on historical operating results, long-term business plans, economic projections, anticipated future cash flows and marketplace data. These fair value measurements fall within Level 3 under ASC Topic 820, Fair Value Measurements and Disclosures.
The second step of the process compared the implied fair value of goodwill with the carrying amount of goodwill. To the extent that our reporting unit’s carrying amount exceeds the implied fair value of its goodwill, an impairment loss is recognized in an amount equal to that excess. The implied fair value of goodwill is determined in the same manner as the amount of goodwill recognized in a business combination, through allocation of the fair value of the reporting unit to all of the assets and liabilities, including any unrecognized intangible assets, as if the reporting unit had been acquired in a business combination.
Based on the first step calculation of our goodwill impairment test, the carrying amount of our reporting unit exceeded its fair value, which required us to perform the second step of the impairment test. In the second step, the fair value of goodwill and fixed assets was generally estimated using an income valuation approach. Based on our 2010 goodwill impairment analysis, we recorded $292.5 million of pre-tax goodwill impairment expense.
The changes in the carrying amount of goodwill are as follows:
|
Balance at December 31, 2008
|
$ | 292,469 | ||
|
Balance at December 31, 2009
|
$ | 292,469 | ||
|
Impairment charges
|
(292,469 | ) | ||
|
Balance at December 31, 2010
|
$ | — |
A summary of other intangible assets is as follows (in thousands):
|
As of December 31, 2010
|
As of December 31, 2009
|
||||||||||||||||
|
Estimated
|
Gross
|
Accumulated
|
Gross
|
Accumulated
|
|||||||||||||
|
Useful Life
|
Amount
|
Amortization
|
Amount
|
Amortization
|
|||||||||||||
|
Contract backlog
|
1.5 years
|
$ | — | $ | — | $ | 2,960 | $ | (2,960 | ) | |||||||
|
Customer relationships
|
5 to 7 years
|
6,758 | (4,261 | ) | 6,758 | (3,186 | ) | ||||||||||
|
Trade name
|
7 years
|
490 | (214 | ) | 490 | (144 | ) | ||||||||||
|
Total
|
$ | 7,248 | $ | (4,475 | ) | $ | 10,208 | $ | (6,290 | ) | |||||||
Intangible assets, excluding goodwill, are recorded as other noncurrent assets on our consolidated balance sheets and are amortized on a straight-line basis over their estimated useful life. Total amortization expenses for intangible assets for the years ended December 31, 2010, 2009, and 2008 were $1.1 million, $2.6 million and $5.1 million, respectively. A summary of the estimated amortization expense for the next five years is as follows (in thousands):
|
Years Ended December 31,
|
||||
|
2011
|
$ | 1,223 | ||
|
2012
|
1,187 | |||
|
2013
|
297 | |||
|
2014
|
66 | |||
|
2015
|
$ | — | ||
Loss Contingencies
We recognize liabilities for contingencies when we have an exposure that, when fully analyzed, indicates it is both probable that a liability has been incurred and the amount of loss can be reasonably estimated. Estimates of our liabilities are based on an evaluation of potential outcomes and currently available facts. We attempt to resolve these matters through settlements, mediation and arbitration proceedings when possible. Actual results may differ from our estimates, and our estimates can be revised in the future, either negatively or positively, depending upon actual outcomes or changes in expectations based on the facts surrounding each matter. Where the most likely outcome of a contingency can be reasonably estimated, we accrue a liability for that amount. Where the most likely outcome cannot be estimated, a range of potential losses is established and if no one amount in that range is more likely than any other, the low end of the range is accrued.
Income Taxes
We recognize income tax expense for the amount of taxes payable or refundable for the current year and deferred tax liabilities and assets for the future tax consequences of events that have been recognized in our financial statements or tax returns. The current provision for income tax is based upon the current tax laws and our interpretation of these laws, as well as the probable outcomes of any foreign or domestic tax audits. We compute deferred income taxes using the liability method. We provide for deferred income taxes on all temporary differences between the financial-reporting basis and the tax basis of our assets and liabilities by applying enacted statutory tax rates, applicable to future years. Allowable tax credits are applied currently as reductions to the provisions for income taxes. A valuation allowance for deferred tax assets is recorded when it is more likely than not that some or all of the benefit from the deferred tax asset will not be realized. We do not provide for U.S. income taxes on foreign subsidiaries’ undistributed earnings intended to be permanently reinvested in foreign operations.
We account for uncertain tax positions using a benefit recognition model with a two-step approach: (1) a more-likely-than-not recognition criterion and (2) a measurement attribute that measures the position as the largest amount of tax benefit that is greater than 50% likely of being realized upon ultimate settlement. If it is not more likely than not that the benefit will be sustained on its technical merits, no benefit is recorded. Uncertain tax positions that relate only to timing of when an item is included on a tax return are considered to have met the recognition threshold. We recognize accrued interest and penalties related to unrecognized tax benefits in income tax expense on our consolidated statements of operations.
Stock-Based Compensation Plans
We measure restricted stock awards at fair value on the date they are granted to employees and recognize compensation cost in our financial statements over the requisite service period.
The fair value of the liability incurred for performance share units is revalued at the end of each reporting period through settlement using the Monte Carlo simulation methodology. Changes in the fair value of the liability for performance share units that occur during the requisite service period are recognized as compensation expense based on the percentage share of the requisite service that has been rendered at that date. As it is management’s intent to pay cash to settle our liability for performance share units, if any, at the end of the service period, we record a liability for these financial instruments on our balance sheet rather than as an increase to equity.
Interest Rate Swap and Hedging Activities
To reduce the impact of changes in interest rates on our variable rate term loan, in August 2010 we entered into a twelve-month interest rate swap with a notional amount of $100 million that converts a portion of our anticipated variable-rate interest payments under our term loan to fixed-rate interest payments of 0.645%. This interest rate swap qualifies as a cash flow hedge under hedge accounting. At December 31, 2010, the interest rate swap had a fair value of $0.3 million, which is recorded as current accrued liabilities. We reclassify any unrealized loss from our interest rate swap into earnings upon settlement. As of December 31, 2010, $0.3 million of unrealized loss from our interest rate swap is recorded in other comprehensive income and will be reclassified into earnings during 2011. During 2010 we reclassified $0.6 million of unrealized losses into earnings related to all settled cash flow hedges.
Changes in the interest rate swap fair value are deferred to the extent it is effective and are recorded as a component of accumulated other comprehensive income until the anticipated interest payments occur and are recognized in interest expense. The ineffective portion of the interest rate swap, if any, will be recognized immediately in earnings.
We formally document all relations between hedging instruments and hedged items, as well as our risk management objectives, strategies for undertaking various hedge transactions and our methods for assessing and testing correlation and hedge ineffectiveness. We also assess, both at inception of the hedge and on an on-going basis, whether the derivatives that are used in our hedging transactions are highly effective in offsetting changes in cash flows of the hedged items. Changes in the assumptions used could impact whether the fair value change in the interest rate swap is charged to earnings or accumulated other comprehensive income.
Recently Issued Accounting Principles
Each reporting period we consider all newly issued but not yet adopted accounting and reporting guidance applicable to our operations and the preparation of our consolidated financial statements. We do not believe that any issued accounting and reporting guidance we have not yet adopted will have a material impact on our financial statements.
3. Related Party Transactions
Prior to December 2006, we were wholly-owned by Helix. In December 2006, Helix and its subsidiaries contributed and transferred to us all of the assets and liabilities of its shallow water marine contracting business, including 23 surface and diving support vessels capable of operating in water depths of up to 1,000 feet and three shallow water pipelay vessels, and then we, through an initial public offering (“IPO”), became a separate company from Helix.
As of December 31, 2008, Helix owned 61,506,691 shares of our common stock, which represented approximately 57.2% of our common stock. During 2009, Helix reduced its ownership to 500,000 of our shares, or less than 1% of our common stock, by completing the following transactions:
|
·
|
We repurchased and retired approximately 15.2 million shares of our common stock from Helix in two separate transactions for $100 million, or a weighted average price of $6.57 per share. We funded the share repurchase by borrowing $100 million under our revolving credit facility.
|
|
·
|
Helix sold 45.8 million shares of our common stock to third parties in two separate secondary public offerings. We did not receive any proceeds from Helix’s sale of our common stock.
|
In contemplation of our IPO, we entered into several agreements with Helix addressing the rights and obligations of each respective company, including a Master Agreement, a Corporate Services Agreement, an Employee Matters Agreement, a Registration Rights Agreement and a Tax Matters Agreement. Once Helix ceased to own a significant percentage of our common stock, most, but not all, of the rights and obligations contained in these agreements were eliminated. The Corporate Services Agreement and the Employee Matters Agreement were terminated in 2009.
The Master Agreement created a framework for the separation of our business from Helix’s business, allocated liabilities (including those potential liabilities related to litigation) between the parties, allocated responsibilities and provided standards for each company’s conduct going forward (e.g., coordination regarding financial reporting), and set forth the indemnification obligations of each party. The provisions in the Master Agreement related to the timing, presentation and delivery of our financial information terminated upon the completion of Helix’s secondary offering in September 2009.
Pursuant to a Corporate Services Agreement that we terminated in the third quarter of 2009, Helix provided to us certain administrative services including: (i) internal audit, tax, treasury and other financial services; (ii) insurance (including claims) and related services; and (iii) information systems, network and communication services. The costs of these administrative services were allocated to us based on actual direct costs incurred, or allocated based on headcount, work hours and revenues. Total allocated costs from Helix for such services were approximately $0.9 million and $3.7 million for the years ended December 31, 2009 and 2008, respectively.
Pursuant to the Employee Matters Agreement, we generally accepted and assumed all employment related obligations with respect to all individuals who were our employees as of the IPO closing date, including expenses related to existing options and restricted stock. These employees are entitled to retain their Helix stock options and restricted stock grants under their original terms except as mandated by applicable law. We are required under the terms of the Employee Matters Agreement to pay to Helix a monthly service fee equal to the sum of (i) the aggregate third party administrative costs incurred by Helix, plus (ii) the total costs and expenses incurred by Helix for financial accounting purposes with respect to such stock options and restricted stock. We consider the aggregate amounts paid under this agreement to be immaterial, and we settled all future amounts payable under this agreement with Helix by a single final lump sum payment in the fourth quarter of 2009.
Pursuant to the Tax Matters Agreement, Helix is generally responsible for all federal, state, local and foreign income taxes that are attributable to us for all tax periods ending on or before the IPO date, and we are generally responsible for all such taxes beginning after the IPO date. In addition, the agreement provides that for a period of up to ten years, we are required to make aggregate payments to Helix equal to 90% of tax benefits derived by us from tax basis adjustments resulting from the taxable gain recognized by Helix as a result of the distributions made to Helix as part of the IPO transaction, which amount was agreed to be approximately $11.3 million. As of December 31, 2010, the current and long-term tax benefits payable to Helix were $1.0 million and $0.7 million, respectively. The reduction in Helix’s percentage ownership of our common stock had no effect on this obligation.
Pursuant to the Registration Rights Agreement, we agreed to provide Helix with registration rights relating to the shares of our common stock held by them, and pursuant to a request made by Helix under its “demand” registration rights, on December 18, 2007, we filed a shelf registration statement on Form S-3 to register for re-sale all of the shares of our common stock held by Helix. The two secondary public offerings through which Helix sold shares of our common stock in 2009 were completed pursuant to this shelf registration statement. Helix retains the right to dispose of its remaining shares of our common stock either pursuant to the effective shelf registration statement we filed on Form S-3, or pursuant to its piggy-back registration rights granted under the Registration Rights Agreement.
In the ordinary course of business, we provided marine contracting services to Helix and recognized revenues of $33.0 million and $112.3 million in 2009 and 2008, respectively. Helix provided ROV services to us and we recognized operating expenses of $9.7 million and $23.6 million in 2009 and 2008, respectively. These services were performed at prevailing market rates. After we ceased to be an affiliate of Helix on September 23, 2009, we discontinued reporting transactions with Helix as related party transactions. Including the current tax benefit payable to Helix resulting from the tax step-up benefit, noted above, net amounts payable to and receivable from Helix are settled with cash periodically. At December 31, 2009, the net current amount due to Helix was $1.4 million. These amounts were included in accounts payable on our consolidated balance sheet.
4. Details of Certain Accounts
Other current assets consisted of the following as of December 31, 2010 and 2009:
|
Year Ended December 31,
|
||||||||
|
2010
|
2009
|
|||||||
|
Insurance claims to be reimbursed
|
$ | 1,806 | $ | 5,201 | ||||
|
Prepaid job costs
|
2,847 | 3,039 | ||||||
|
Prepaid insurance
|
4,102 | 5,023 | ||||||
|
Prepaid other
|
417 | 644 | ||||||
|
Supplies and spare parts inventory
|
2,154 | 2,610 | ||||||
|
Other receivables
|
4,379 | 4,541 | ||||||
|
Other
|
1,734 | 1,871 | ||||||
| $ | 17,439 | $ | 22,929 | |||||
Other long-term assets, net, consisted of the following as of December 31, 2010 and 2009:
|
Year Ended December 31,
|
||||||||
|
2010
|
2009
|
|||||||
|
Intangible assets with finite lives, net
|
$ | 2,773 | $ | 3,918 | ||||
|
Deferred financing costs
|
3,644 | 3,517 | ||||||
|
Equipment deposits and other
|
2,801 | 5,158 | ||||||
| $ | 9,218 | $ | 12,593 | |||||
Accrued liabilities consisted of the following as of December 31, 2010 and 2009:
|
Year Ended December 31,
|
||||||||
|
2010
|
2009
|
|||||||
|
Accrued payroll and related benefits
|
$ | 7,762 | $ | 18,548 | ||||
|
Insurance claims to be reimbursed
|
1,806 | 5,201 | ||||||
|
Accrued insurance
|
7,529 | 6,774 | ||||||
|
Interest rate swap
|
282 | 627 | ||||||
|
Accrued taxes other than income
|
2,320 | 847 | ||||||
|
Note payable
|
— | 1,585 | ||||||
|
Other
|
3,577 | 6,086 | ||||||
| $ | 23,276 | $ | 39,668 | |||||
5. Long-term Debt
We have a senior secured credit facility with certain financial institutions, consisting of a term loan and a $300 million revolving credit facility, both of which mature on December 11, 2012. As of December 31, 2010, we had outstanding debt of $165.3 million under the term loan with a weighted-average interest rate of 2.88%, with quarterly principal payments of $14.8 million, and a final payment of $61.5 million due on maturity. We had no outstanding borrowings and $217.8 million available for borrowings under the revolving credit facility at December 31, 2010. The amount we can borrow under our $300 million revolver is limited by outstanding borrowings, letters of credit, and our consolidated leverage (debt to EBITDA) ratio covenant. At December 31, 2010, we had $0.3 million of issued and outstanding letters of credit under our revolving credit facility.
Effective July 19, 2010, we amended the credit facility to, among other things, (i) increase our permitted consolidated leverage ratio covenant, (ii) amend the amortization of a portion of our term loan, and (iii) permit us to transfer in the future two of our saturation diving vessels operating internationally (the Eclipse and the Texas) to one of our international subsidiaries and to release such vessels as collateral upon any such future transfer (in December 2010 we completed the transfer of the Eclipse as permitted by the terms of the amendment).
Under the amendment, our permitted debt to EBITDA leverage ratio was increased from 3.75x to 4.75x for the period through June 30, 2011, decreasing to 4.25x through September 30, 2011 and thereafter returning to 3.75x. In addition, the amortization of a portion of the debt outstanding under the term loan was deferred until the maturity date, reducing our quarterly principal payments on the term loan from $20.0 million to $14.8 million, with a final payment of $61.5 million due on December 11, 2012. For lenders who agreed to forgo their quarterly term loan payment, the margin on their term loan commitments is now subject to a pricing grid, while those lenders who did not grant such consent had their term loan margin remain fixed at 2.25%. The interest rate margin on the revolving loan also increased but remains subject to fluctuation in relation to our consolidated leverage ratio as provided in the credit agreement.
At December 31, 2010 and December 31, 2009, we were in compliance with all debt covenants contained in our credit facility. The credit facility is secured by vessel mortgages on all of our vessels (except for the Sea Horizon and the Eclipse), a pledge of all of the stock of all of our domestic subsidiaries and 66% of the stock of three of our foreign subsidiaries, and a security interest in, among other things, all of our equipment, inventory, accounts receivable and general tangible assets.
Aggregate maturities of principal amounts under our credit facility for each year through maturity are as follows (in thousands):
|
2011
|
$ | 59,328 | ||
|
2012
|
106,008 | |||
| $ | 165,336 |
For the year ended December 31, 2010, we deferred fees in connection with the amendment to our credit facility of $1.6 million, which are being amortized over the remainder of the term of the credit facility ending upon the facility’s maturity in December 2012. As of December 31, 2010 and 2009, deferred financing costs totaled $3.6 million and $3.5 million, respectively.
6. Income Taxes
Income (loss) before income taxes was comprised of the following (in thousands):
|
Year Ended December 31,
|
||||||||||||
|
2010
|
2009
|
2008
|
||||||||||
|
Domestic and foreign summary:
|
||||||||||||
|
United States
|
$ | (293,034 | ) | $ | 107,426 | $ | 93,755 | |||||
|
Foreign
|
(28,258 | ) | 11,111 | 63,671 | ||||||||
|
Income (loss) before income taxes from continuing operations
|
$ | (321,292 | ) | $ | 118,537 | $ | 157,426 | |||||
Components of the provision for income taxes reflected in the statements of operations consist of the following (in thousands):
|
Year Ended December 31,
|
||||||||||||
|
2010
|
2009
|
2008
|
||||||||||
|
U.S.
|
$ | 10,299 | $ | 37,678 | $ | 14,129 | ||||||
|
Foreign
|
(2,988 | ) | 1,805 | 8,915 | ||||||||
|
Total current provision for income taxes
|
7,311 | 39,483 | 23,044 | |||||||||
|
U.S.
|
(12,058 | ) | 4,495 | 24,533 | ||||||||
|
Foreign
|
(4,120 | ) | (1,928 | ) | — | |||||||
|
Change in valuation allowance
|
3,424 | (140 | ) | 350 | ||||||||
|
Total deferred provision for income taxes
|
(12,754 | ) | 2,427 | 24,883 | ||||||||
|
Total provision for income taxes
|
$ | (5,443 | ) | $ | 41,910 | $ | 47,927 | |||||
The change in our valuation allowance is as follows (in thousands):
|
Year Ended December 31,
|
||||||||||||
|
2010
|
2009
|
2008
|
||||||||||
|
Beginning balance
|
$ | 3,177 | $ | 3,317 | $ | 2,967 | ||||||
|
Certain foreign jurisdictions net operating loss
|
3,424 | — | — | |||||||||
|
Equity investments
|
$ | — | $ | (140 | ) | $ | 350 | |||||
|
Change in valuation allowance
|
$ | 3,424 | $ | (140 | ) | $ | 350 | |||||
|
Ending balance
|
$ | 6,601 | $ | 3,177 | $ | 3,317 | ||||||
For the year ended December 31, 2010, we recorded a valuation allowance for certain foreign jurisdictions as they had cumulative losses or we expect them to have a loss for three consecutive years. Additional valuation allowances may be made in the future if in management’s opinion it is more likely than not that the tax benefit will not be utilized.
The primary differences between the U.S. statutory rate and our effective rate were as follows:
|
Year Ended December 31,
|
||||||||||||
|
2010
|
2009
|
2008
|
||||||||||
|
U.S. statutory rate
|
35.0 | % | 35.0 | % | 35.0 | % | ||||||
|
Foreign activity taxed at local rates
|
(1.8 | ) | 0.0 | (6.8 | ) | |||||||
|
Change in valuation allowance
|
(1.1 | ) | (0.1 | ) | 0.2 | |||||||
|
Goodwill impairment
|
(30.3 | ) | — | — | ||||||||
|
Other
|
(0.1 | ) | 0.5 | 2.0 | ||||||||
|
Effective rate
|
1.7 | % | 35.4 | % | 30.4 | % | ||||||
Deferred income taxes result from the effect of transactions that are recognized in different periods for financial and tax reporting purposes. The nature of these differences and the income tax effect of each as of December 31, 2010 and 2009 were as follows (in thousands):
|
December 31,
|
||||||||
|
2010
|
2009
|
|||||||
|
Deferred tax liabilities:
|
||||||||
|
Depreciation
|
$ | 116,307 | $ | 127,571 | ||||
|
Deferred drydock costs
|
4,312 | 5,855 | ||||||
|
Prepaid and other
|
(743 | ) | 3,469 | |||||
|
Total deferred tax liabilities
|
119,876 | 136,895 | ||||||
|
Deferred tax assets:
|
||||||||
|
Reserves, accrued liabilities and other
|
(9,655 | ) | (9,512 | ) | ||||
|
Net operating loss
|
(7,263 | ) | (6,426 | ) | ||||
|
Foreign tax credit
|
(3,550 | ) | (5,344 | ) | ||||
|
Total deferred tax assets
|
(20,468 | ) | (21,282 | ) | ||||
|
Valuation allowance
|
6,601 | 3,177 | ||||||
|
Net deferred tax liability
|
$ | 106,009 | $ | 118,790 | ||||
|
Deferred income tax is presented as:
|
||||||||
|
Current deferred tax asset
|
$ | (3,425 | ) | $ | (3,183 | ) | ||
|
Non current deferred tax liability
|
109,434 | 121,973 | ||||||
|
Net deferred tax liability
|
$ | 106,009 | $ | 118,790 | ||||
We do not provide U.S. tax on unrepatriated earnings of foreign subsidiaries where management intends to keep the earnings permanently invested overseas. For 2010, the amount of permanently invested losses was $31.8 million. We have cumulative net unremitted earnings from foreign subsidiaries of approximately $37.4 million as of December 31, 2010. A determination of the unrecognized deferred tax liability for temporary differences related to investments in foreign subsidiaries is not practicable due to uncertainty regarding the use of foreign tax credits which may become available as a result of a repatriation of earnings.
For U.S federal income tax purposes, we have net operating loss (“NOL”) carryforwards of approximately $8.9 million that, if not utilized, will expire at various times beginning in 2016. Additionally, we have foreign NOL carryforwards of approximately $22.1 million, which do not expire. We provide a valuation allowance against NOL carryforwards for each jurisdiction based on our consideration of existing temporary differences and expected future earning levels in each jurisdiction. For U.S. federal income tax purposes, we have foreign tax credit carryforward of approximately $3.6 million, which if not utilized, begin to expire in 2016.
Under U.S. federal tax law, the amount and availability of tax benefits are subject to a variety of interpretations and restrictive tests applicable to Cal Dive and our subsidiaries. The utilization of such tax benefits could be limited or effectively lost upon certain changes in ownership. The utilization of our U.S. NOL carryforwards is limited due to changes in control for tax purposes occurring both prior to, and in connection with, our acquisition of Horizon on December 11, 2007. As a result, U.S. NOLs of approximately $8.9 million have an annual limit of approximately $0.6 million. We estimate that the limitation of the tax benefits for periods prior to December 11, 2007 that can be utilized during the NOL carryforward period will not adversely affect our cash flow.
The changes in our unrecognized tax benefits are as follows (in thousands):
|
Year Ended December 31,
|
||||||||||||
|
2010
|
2009
|
2008
|
||||||||||
|
Balance as of January 1
|
$ | 767 | $ | 1,900 | $ | — | ||||||
|
Increases related to prior year tax positions
|
188 | 755 | 1,900 | |||||||||
|
Settlements with taxing authorities
|
— | (1,888 | ) | — | ||||||||
|
Balance as of December 31
|
$ | 955 | $ | 767 | $ | 1,900 | ||||||
Our unrecognized tax benefit of $1.0 million, $0.8 million, and $1.9 million at December 31, 2010, 2009 and 2008, respectively, would reduce our provision for income taxes if recognized and reduce the effective tax rate.
The change in our interest and penalty related to our unrecognized tax benefits are as follows (in thousands):
| Year Ended December 31, | ||||||||||||
| 2010 | 2009 | 2008 | ||||||||||
|
Balance as of January 1
|
$ | 1,984 | $ | 3,500 | $ | — | ||||||
|
Changes related to prior year tax positions
|
(1,745 | ) | (113 | ) | 3,500 | |||||||
|
Settlements with taxing authorities
|
— | (1,403 | ) | — | ||||||||
|
Balance as of December 31
|
$ | 239 | $ | 1,984 | $ | 3,500 | ||||||
We recorded a $1.6 million income tax benefit and a $0.9 million income tax expense in net unrecognized income tax benefit, interest and penalty in 2010 and 2009, respectively. During 2008, we recorded a $5.4 million long-term liability for unrecognized tax benefits, interest and penalty. We recorded this as a $5.0 million increase to goodwill as part of the Horizon purchase price allocation and $0.4 million as income tax expense.
Our unrecognized tax benefit of $1.0 million and $0.8 million at December 31, 2010 and 2009, respectively, would reduce our provision for income taxes if not recognized and affect the effective tax rate. To the extent accrued interest and penalties of $0.2 million and $2.2 million at December 31, 2010 and December 31, 2009, respectively, relating to unrecognized tax benefits, are not actually assessed, the liability will be reversed with an impact on our provision for income taxes and affect the effective tax rate. We do not expect a material change to the unrecognized tax benefits during the next 12 months.
We file tax returns in the U.S. and in various state, local and non-U.S. jurisdictions. Our two major jurisdictions are the U.S. and Mexico. We anticipate that any potential adjustments to our federal, state, local and non-U.S. jurisdiction tax returns by tax authorities would not have a material impact on our financial position. Our returns for the tax period 2007 through 2009 and Horizon’s returns for 2007 remain subject to examination by the U.S. Internal Revenue Service. Our 2006 through 2010, as well as Horizon’s 2005 through 2007 tax years remain subject to examination by the appropriate international governmental agencies and Horizon’s U.S. NOL carryforward is subject to review.
Tax Assessment
During the fourth quarter of 2006, Horizon received a tax assessment related to fiscal 2001 from the Servicio de Administracion Tributaria (“SAT”), the Mexican taxing authority, for approximately $283.5 million pesos, translated to approximately $25.1 million using the foreign exchange rate at December 31, 2010, including penalties and interest. The SAT’s assessment claims unpaid taxes related to services performed among our subsidiaries as well as penalties and accrued interest. We have consulted with our Mexican counsel and believe that under the Mexico and United States double taxation treaty these services are not taxable and the tax assessment itself is invalid. Accordingly, we have not recorded a liability for the SAT’s assessment for the 2001 tax year in our consolidated financial statements. On February 14, 2008, we received notice from the SAT upholding the original assessment. On April 21, 2008, we filed a petition in Mexico tax court disputing the assessment. We believe that our position is supported by law and intend to vigorously defend our position. All pleadings have been filed and we are awaiting the court’s decision. However, the ultimate timing and outcome of this litigation and our potential liability from this assessment, if any, cannot be determined at this time. Nonetheless, an unfavorable outcome with respect to the Mexico tax assessment could have a material adverse effect on our financial position, results of operations, and cash flows.
The SAT also claimed unpaid taxes related to services performed among our subsidiaries for Horizon’s 2002 through 2007 taxable years. During 2009, we successfully completed negotiations with the SAT with respect to their claim of unpaid taxes related to Horizon’s 2002 through 2007 taxable years, and paid an aggregate of approximately $3.3 million in settlement of these periods. Horizon’s 2002 through 2004 tax audits were closed in 2009, settling this particular claim by the SAT. In 2009 we also filed amendments for tax years 2005 through 2007 using the same methodology used in the settlement for the 2002 through 2004 years. The amended returns were accepted by the Mexican tax authority in March 2010, effectively settling this particular claim. Even though we have settled this issue for these years, under Mexican tax law there is a five-year statute of limitations, so our tax years 2005 through 2010 remain open for examination in Mexico.
We believe our recorded assets and liabilities are reasonable; however, tax laws and regulations are subject to interpretation and tax litigation is inherently uncertain. As a result, our assessments involve a series of complex judgments about future events and rely heavily on estimates and assumptions.
In December 2006, we entered into the Tax Matters Agreement with Helix. The following is a summary of the material terms of the Tax Matters Agreement:
|
·
|
Liability for Taxes. Each party has agreed to indemnify the other for all taxes for which it is responsible under the Tax Matters Agreement. Helix is generally responsible for all federal, state, local and foreign income taxes that are attributable to us for all tax periods ending on or before December 14, 2006. We are generally responsible for all federal, state, local and foreign income taxes that are attributable to us beginning after December 14, 2006. We are also responsible for all taxes other than income taxes attributable to us for all tax periods.
|
|
·
|
Tax Benefit Payments. As a result of certain taxable income recognized by Helix in conjunction with our IPO, we will become entitled to certain tax benefits that are expected to be realized by us in the ordinary course of our business and otherwise would not have been available to us. These benefits are generally attributable to increased tax deductions for amortization of tangible and intangible assets and to increased tax basis in nonamortizable assets. Under the Tax Matters Agreement, for ten years following the date of our IPO, we will be required to make annual payments to Helix equal to 90% of our tax savings realized as a result of these increased tax benefits. The timing of our payments will depend upon, among other things, the amount of our taxable income and the timing at which certain assets are sold or disposed. At December 31, 2010 and 2009, this tax benefit was $1.7 million and $2.7 million, respectively. The current portion of $1.0 million and $1.0 million as of December 31, 2010 and 2009, respectively, is recorded as a component of accounts payable. The long-term portion of $0.7 million and $1.7 million as of December 31, 2010 and 2009, respectively, is recorded in other long-term liabilities.
|
7. Earnings (Loss) Per Share
On January 1, 2009, we adopted an update to accounting standards which provides that unvested share-based payment awards which receive non-forfeitable dividend rights or dividend equivalents (whether paid or unpaid) are considered participating securities and are required to be included in computing earnings per share under the two-class method. The adoption of this update to accounting standards, which requires retrospective application, decreased our previously reported basic and fully-diluted EPS of $1.05 by $0.02 for the year ended December 31, 2008.
Basic EPS is computed by dividing net income attributable to common shares by the basic weighted-average shares of outstanding common stock. The calculation of diluted EPS is similar to basic EPS, except the denominator includes dilutive common stock equivalents. The components of basic and diluted EPS for common shares under the two-class method for the three years ended December 31, 2010, 2009 and 2008 were as follows (in thousands, except per share amounts):
|
Year Ended December 31,
|
||||||||||||
|
2010
|
2009
|
2008
|
||||||||||
|
Numerator:
|
||||||||||||
|
Net income (loss)
|
$ | (315,849 | ) | $ | 76,627 | $ | 109,499 | |||||
|
Less: Net income allocated to unvested restricted stock
|
— | 2,205 | 1,444 | |||||||||
|
Net income (loss) attributable to common shares
|
$ | (315,849 | ) | $ | 74,422 | $ | 108,055 | |||||
|
Denominator:
|
||||||||||||
|
Basic weighted average shares outstanding
|
91,067 | 91,884 | 104,418 | |||||||||
|
Dilutive employee stock purchase plan(1)
|
— | 43 | — | |||||||||
|
Diluted weighted-average shares outstanding
|
91,067 | 91,927 | 104,418 | |||||||||
|
Earnings (Loss) per Share:
|
||||||||||||
|
Total basic
|
$ | (3.47 | ) | $ | 0.81 | $ | 1.03 | |||||
|
Total diluted
|
$ | (3.47 | ) | $ | 0.81 | $ | 1.03 | |||||
_____________________________________
|
(1)
|
No losses were allocated to unvested restricted shares outstanding in the computation of diluted earnings per share because to do so would be anti-dilutive.
|
8. Commitments and Contingencies
Lease Commitments
We lease several facilities worldwide and accommodations for certain employees located outside the U.S. under noncancelable operating leases. Future minimum rentals under these leases are approximately $3.6 million in 2011, $3.0 million in 2012, $2.8 million in 2013, $2.8 million in 2014 and $3.7 million thereafter. Total rental expense under these operating leases was approximately $5.0 million, $5.4 million and $5.2 million for the years ended December 31, 2010, 2009 and 2008, respectively.
During 2007 through February 2008, we chartered a vessel for use in the Middle East. Expense for this charter was $2.7 million for the year ended December 31, 2008.
Insurance
We carry hull and increased value insurance, which provides coverage for physical damage to an agreed amount for each vessel. We maintain deductibles that vary between $25,000 and $500,000 based on the value of each vessel. With our July 1, 2010 renewal and certain insured value changes, our marine package annual aggregate deductible was increased from $1,250,000 to $3,000,000. We also carry protection and indemnity (“P&I”) insurance, which covers liabilities arising from the operation of the vessel, and general liability insurance, which covers liabilities arising from construction operations. The deductible on both the P&I and general liability is $100,000 per occurrence. Onshore employees are covered by workers’ compensation which is subject to a $250,000 per occurrence deductible. Offshore employees, including divers and tenders and marine crews, are covered by a maritime employers liability (“MEL”) policy, which covers Jones Act exposures. The MEL policy has a deductible of $100,000 per occurrence plus a $2 million annual aggregate for claims prior to July 1, 2009. For claims arising after July 1, 2009, the MEL insurance policy deductible was increased to $250,000 per occurrence with $750,000 in coverage available above the deductible. However, this $750,000 coverage layer is subject to a $3.0 million annual aggregate deductible. In addition, we carry umbrella liability insurance with a total limit of $500 million in excess of primary limits, subject to an additional aggregate deductible of $1 million for MEL claims only. Our self-insured retention on our medical and health benefits program for employees is $400,000 per participant.
We incur maritime employers’ liability, workers’ compensation and other insurance claims in the normal course of business, which management believes are covered by insurance. We analyze each claim for potential exposure and estimate the ultimate liability of each claim. Amounts due from insurance companies, above the applicable deductible limits, are reflected in other current assets in the consolidated balance sheets. Such amounts were $1.8 million and $5.2 million as of December 31, 2010 and 2009, respectively. See related accrued liabilities at Note 4 - “Details of Certain Accounts.” We have not historically incurred significant losses as a result of claims denied by our insurance carriers.
During 2009, we recognized an insurance recovery of $3.9 million for a specific claim incurred in a prior year during the normal course of business, which we have reflected as a reduction to cost of sales in the accompanying consolidated statement of operations.
Litigation and Claims
We are involved in various legal proceedings, primarily involving claims for personal injury under the General Maritime Laws of the United States and the Jones Act as a result of alleged negligence. In addition, we from time to time incur other claims, such as contract disputes, in the normal course of business. Although these matters have the potential of significant additional liability, we believe the outcome of all such matters and proceedings will not have a material adverse effect on our consolidated financial position, results of operations or cash flows. Pursuant to the terms of the Master Agreement, we assumed and will indemnify Helix for liabilities related to our business.
9. Major Customers and Concentration of Credit Risk
Our customers consist primarily of major and independent oil and natural gas producers, pipeline transmission companies and offshore engineering and construction firms. We generally do not require material collateral to support contractual payment obligations. We perform ongoing credit evaluations of our customers and provide allowances for probable credit losses when necessary. The percent of revenue of major customers that accounted for 10% or more of our consolidated revenues for each of the last three years was as follows: 2010 — Chevron Corporation 16%, BP Exploration and Production 13%, and Apache Corporation 10%; 2009 — Chevron Corporation 13%; and 2008 — GDF Suez 14%; Helix 13% and Chevron Corporation 11%.
10. Employee Benefit Plans
Defined Contribution Plan
Under a defined contribution 401(k) retirement plan provided by us for the purpose of providing retirement benefits for substantially all of our employees, both the employees and we have made contributions to the plan. We matched a portion of each employee’s contribution, and our contributions were in the form of cash and determined annually as 50% of each employee’s contribution up to 5% of the employee’s salary. Our costs related to our employees participating in these plans totaled $3.1 million and $2.1 million for the years ended December 31, 2009 and 2008, respectively. In the first quarter of 2010, we suspended our matching contributions indefinitely.
Stock-Based Compensation Plans
Long-Term Incentive Plan
Under an incentive plan adopted by us on December 9, 2006, as amended and restated and approved by our stockholders on May 7, 2007, up to 9,000,000 shares of our common stock may be issued to key personnel and non-employee directors. The plan is administered by the compensation committee of the board of directors, which has broad authority to select the persons to whom awards will be made, fix the terms and conditions of each award, and construe, interpret and apply the provisions of the plan and any award made under the plan. Our Chief Executive Officer has the authority to grant incentives (for no more than 100,000 shares per fiscal year) as inducements to hire or promote candidates who will not be Section 16 officers. The committee may grant stock options, restricted stock or restricted stock units. Awards of restricted stock granted to employees under the plan typically vest 20% per year over a five-year period or 33% per year over a three-year period, and subject to certain exceptions, are not transferable until the restrictions lapse.
The following table summarizes information about our restricted shares for the years ended December 31, 2010, 2009 and 2008:
|
2010
|
2009
|
2008
|
||||||||||||||||||||||
|
Shares
|
Fair Value(1)
|
Shares
|
Fair Value(1)
|
Shares
|
Fair Value(1)
|
|||||||||||||||||||
|
Restricted shares outstanding:
|
||||||||||||||||||||||||
|
Beginning of year
|
3,235,138 | $ | 8.01 | 2,776,195 | $ | 8.61 | 1,062,339 | $ | 12.73 | |||||||||||||||
|
Granted
|
1,557,994 | $ | 5.77 | 1,178,227 | $ | 7.09 | 2,057,946 | $ | 7.17 | |||||||||||||||
|
Vested
|
(854,547 | ) | $ | 8.33 | (595,662 | ) | $ | 8.99 | (263,702 | ) | $ | 12.80 | ||||||||||||
|
Forfeited
|
(85,760 | ) | $ | 7.36 | (123,622 | ) | $ | 8.02 | (80,388 | ) | $ | 12.62 | ||||||||||||
|
End of year
|
3,852,825 | $ | 7.05 | 3,235,138 | $ | 8.01 | 2,776,195 | $ | 8.61 | |||||||||||||||
|
|
||||||||||||||||||||||||
____________________________
(1) Represents the weighted average grant date market value.
Compensation cost, determined by multiplying the number of restricted shares granted by the closing market price of our stock on the grant date, is recognized over the respective vesting periods on a straight-line basis. For the years ended December 31, 2010, 2009 and 2008, compensation expense related to restricted shares was $7.2 million, $5.4 million and $4.5 million, respectively. We have an assumed forfeiture rate of 2%. The total fair value of shares vested during 2010 was $5.1 million. Future compensation cost associated with unvested restricted stock awards at December 31, 2010 totaled approximately $25.5 million. The weighted average vesting period related to nonvested restricted stock awards at December 31, 2010 was approximately 3.3 years.
In December 2010 and 2009, we granted to certain of our officers a total of 488,323 and 403,206 performance share units, respectively, which constitute restricted stock units under this plan. During 2010, 51,036 performance share units granted in December 2009 were forfeited. Each performance share unit represents a contingent right to receive the cash value of one share of our common stock dependent upon our total shareholder return relative to a peer group of companies over a three-year performance period ending on December 31, 2013 (in the case of the December 2010 grant) and December 31, 2012 (in the case of the December 2009 grant). The awards vest 100% on December 31, 2013 and December 31, 2012, respectively, and are payable in cash unless the compensation committee determines to pay in stock. A maximum of 200% of the number of performance shares granted may be earned if performance at the maximum level is achieved. For the year ended December 31, 2010 compensation expense related to performance share units was $0.4 million.
Employee Stock Purchase Plan
In December 2006, we adopted the Cal Dive International, Inc. Employee Stock Purchase Plan, which allows employees to acquire shares of common stock through payroll deductions over a six-month period. The purchase price is equal to 85% of the fair market value of our common stock on either the first or the last day of the subscription period, whichever was lower. Purchases under the plan are limited to 10% of an employee’s base salary. We may issue a total of 1,500,000 shares of common stock under the plan. From the plan’s inception through December 31, 2009, we issued 1,144,925 shares of common stock to our employees. We recognized compensation expense related to stock purchases under the Cal Dive ESPP of $1.5 million and $1.2 million for the years ended December 31, 2009 and 2008, respectively. We had no compensation expense related to stock purchases under the Cal Dive ESPP for the year ended December 31, 2010 because we suspended the employee stock purchase plan indefinitely in the first quarter of 2010.
11. Business Segment Information
We have one reportable segment, Marine Contracting. We perform a portion of our marine contracting services in foreign waters. For the years ended December 31, 2010, 2009 and 2008, we earned revenues of $110.2 million, $273.9 million and $250.9 million, respectively, from foreign locations. Net property and equipment in foreign locations were $166.0 million and $179.3 million at December 31, 2010 and 2009, respectively. The remainder of our revenues were generated in the U.S. Gulf of Mexico and other U.S. waters.
12. Accumulated Other Comprehensive Income
The components of accumulated other comprehensive income as of December 31, 2010 and 2009 were as follows (in thousands):
|
December 31,
|
||||||||
|
2010
|
2009
|
|||||||
|
Cumulative foreign currency translation adjustment
|
$ | 2,118 | $ | 1,322 | ||||
|
Unrealized loss on interest rate swap
|
(149 | ) | (408 | ) | ||||
|
Accumulated other comprehensive income
|
$ | 1,969 | $ | 914 | ||||
Supplemental Quarterly Financial Information (Unaudited)
The offshore marine construction industry in the Gulf of Mexico may be seasonal as a result of weather conditions and the timing of capital expenditures by the oil and natural gas companies. Historically, a substantial portion of our services has been performed during the summer and fall months, and as a result, a disproportionate portion of our revenues and net income is earned during this period. The following is a summary of consolidated quarterly financial information for 2010 and 2009 (in thousands, except per share data):
|
Quarter Ended
|
||||||||||||||||
|
March 31
|
June 30
|
September 30
|
December 31
|
|||||||||||||
|
(in thousands, except per share data)
|
||||||||||||||||
|
Fiscal 2010
|
||||||||||||||||
|
Revenues
|
$ | 57,418 | $ | 124,217 | $ | 193,793 | $ | 161,040 | ||||||||
|
Gross profit (loss)
|
$ | (15,409 | ) | $ | 7,457 | $ | 46,721 | $ | 23,673 | |||||||
|
Net income (loss)
|
$ | (19,129 | ) | $ | (10,966 | ) | $ | (283,372 | ) | $ | (2,382 | ) | ||||
|
Earnings (loss) per common share:
|
||||||||||||||||
|
Basic and fully-diluted
|
$ | (0.20 | ) | $ | (0.12 | ) | $ | (3.11 | ) | $ | (0.03 | ) | ||||
|
Fiscal 2009
|
||||||||||||||||
|
Revenues
|
$ | 207,053 | $ | 260,316 | $ | 214,597 | $ | 147,396 | ||||||||
|
Gross profit
|
$ | 38,805 | $ | 70,761 | $ | 70,131 | $ | 36,188 | ||||||||
|
Net income
|
$ | 12,252 | $ | 28,627 | $ | 32,908 | $ | 2,840 | ||||||||
|
Earnings per common share:
|
||||||||||||||||
|
Basic and fully-diluted
|
$ | 0.12 | $ | 0.30 | $ | 0.35 | $ | 0.03 | ||||||||
Item 9. Changes in and Disagreements with Accountants on Accounting and Financial Disclosure
None.
Item 9A. Controls and Procedures
Disclosure Controls and Procedures
Our CEO and CFO, with the participation of management, evaluated the effectiveness of our disclosure controls and procedures (as defined in Rules 13a-15(e) and 15d-15(e) under the Securities Exchange Act of 1934) as of the end of the period covered by this annual report on Form 10-K. Based on their evaluation, they have concluded that our disclosure controls and procedures are effective as of the end of the period covered by this report.
Changes in Internal Control Over Financial Reporting
There has been no change in our internal control over financial reporting that occurred during the quarter ended December 31, 2010 that has materially affected, or is reasonably likely to materially affect, our internal control over financial reporting.
MANAGEMENT’S REPORT ON INTERNAL CONTROL OVER FINANCIAL REPORTING
Our management is responsible for establishing and maintaining adequate internal control over financial reporting, as such term is defined in Rules 13a-15(f) and 15d-15(f) under the Securities Exchange Act of 1934, as amended. Our internal control system was designed to provide reasonable assurance to management and the Board of Directors regarding the reliability of financial reporting and the preparation and fair presentation of financial statements for external purposes in accordance with U.S. generally accepted accounting principles.
Because of its inherent limitations, internal control over financial reporting may not prevent or detect misstatements. Also, projections of any evaluation of effectiveness to future periods are subject to the risk that controls may become inadequate because of changes in conditions, or that the degree of compliance with the policies or procedures may deteriorate.
In making its assessment, management has utilized the criteria set forth by the Committee of Sponsoring Organizations of the Treadway Commission (COSO) in Internal Control-Integrated Framework. Based on this assessment, management has concluded that, as of December 31, 2010, our internal control over financial reporting is effective to provide reasonable assurance regarding the reliability of financial reporting and the preparation of financial statements for external purposes in accordance with U.S. generally accepted accounting principles.
Ernst & Young LLP, the independent registered public accounting firm that audited our financial statements included in this annual report, has issued an audit report on our internal control over financial reporting as of December 31, 2010. This report appears on the following page.
REPORT OF INDEPENDENT REGISTERED PUBLIC ACCOUNTING FIRM
The Board of Directors and Stockholders of
Cal Dive International, Inc. and Subsidiaries
We have audited Cal Dive International, Inc. and subsidiaries’ internal control over financial reporting as of December 31, 2010, based on criteria established in Internal Control—Integrated Framework issued by the Committee of Sponsoring Organizations of the Treadway Commission (the COSO criteria). Cal Dive International, Inc. and subsidiaries’ management is responsible for maintaining effective internal control over financial reporting, and for its assessment of the effectiveness of internal control over financial reporting included in the accompanying Management’s Report On Internal Control Over Financial Reporting. Our responsibility is to express an opinion on the company’s internal control over financial reporting based on our audit.
We conducted our audit in accordance with the standards of the Public Company Accounting Oversight Board (United States). Those standards require that we plan and perform the audit to obtain reasonable assurance about whether effective internal control over financial reporting was maintained in all material respects. Our audit included obtaining an understanding of internal control over financial reporting, assessing the risk that a material weakness exists, testing and evaluating the design and operating effectiveness of internal control based on the assessed risk, and performing such other procedures as we considered necessary in the circumstances. We believe that our audit provides a reasonable basis for our opinion.
A company’s internal control over financial reporting is a process designed to provide reasonable assurance regarding the reliability of financial reporting and the preparation of financial statements for external purposes in accordance with generally accepted accounting principles. A company’s internal control over financial reporting includes those policies and procedures that (1) pertain to the maintenance of records that, in reasonable detail, accurately and fairly reflect the transactions and dispositions of the assets of the company; (2) provide reasonable assurance that transactions are recorded as necessary to permit preparation of financial statements in accordance with generally accepted accounting principles, and that receipts and expenditures of the company are being made only in accordance with authorizations of management and directors of the company; and (3) provide reasonable assurance regarding prevention or timely detection of unauthorized acquisition, use, or disposition of the company’s assets that could have a material effect on the financial statements.
Because of its inherent limitations, internal control over financial reporting may not prevent or detect misstatements. Also, projections of any evaluation of effectiveness to future periods are subject to the risk that controls may become inadequate because of changes in conditions, or that the degree of compliance with the policies or procedures may deteriorate.
In our opinion, Cal Dive International, Inc. and subsidiaries maintained, in all material respects, effective internal control over financial reporting as of December 31, 2010, based on the COSO criteria.
We also have audited, in accordance with the standards of the Public Company Accounting Oversight Board (United States), the consolidated balance sheets of Cal Dive International, Inc. and subsidiaries as of December 31, 2010 and 2009, and the related consolidated statements of operations, stockholders’ equity and comprehensive income (loss), and cash flows for each of the three years in the period ended December 31, 2010 of Cal Dive International, Inc. and subsidiaries and our report dated March 2, 2011 expressed an unqualified opinion thereon.
/s/ Ernst & Young LLP
Houston, Texas
March 2, 2011
PART III
Item 10. Directors, Executive Officers and Corporate Governance
Code of Ethics
We have adopted a Code of Business Conduct and Ethics, applicable to all employees, officers and directors, as well as a Code of Ethics for Chief Executive Officer and Senior Financial Officers specific to those officers. Copies of these documents are available free of charge on our website at www.caldive.com.
The remaining information required by this Item 10 is incorporated by reference from our definitive Proxy Statement, to be filed pursuant to Regulation 14A under the Securities Exchange Act of 1934 in connection with our 2011 Annual Meeting of Stockholders.
Item 11. Executive Compensation
The information required by this Item 11 is incorporated by reference from our definitive Proxy Statement to be filed pursuant to Regulation 14A under the Securities Exchange Act of 1934 in connection with our 2011 Annual Meeting of Stockholders.
|
Security Ownership of Certain Beneficial Owners and Management and Related Stockholder Matters.
|
The information required by this Item 12 is incorporated by reference from our definitive Proxy Statement to be filed pursuant to Regulation 14A under the Securities Exchange Act of 1934 in connection with our 2011 Annual Meeting of Stockholders.
Item 13. Certain Relationships and Related Transactions, and Director Independence
The information required by this Item 13 is incorporated by reference from our definitive Proxy Statement to be filed pursuant to Regulation 14A under the Securities Exchange Act of 1934 in connection with our 2011 Annual Meeting of Stockholders.
Item 14. Principal Accounting Fees and Services
The information required by this Item 14 is incorporated by reference from our definitive Proxy Statement to be filed pursuant to Regulation 14A under the Securities Exchange Act of 1934 in connection with our 2011 Annual Meeting of Stockholders.
PART IV
Item 15. Exhibits, Financial Statement Schedules
(a) The following documents are filed as a part of this report:
(1) Consolidated Financial Statements
|
Page
|
|
|
38
|
|
|
39
|
|
|
40
|
|
|
41
|
|
|
42
|
|
|
43
|
(2) Financial Statement Schedules.
The following financial statement schedule is filed with this report:
Schedule II — Valuation and Qualifying Accounts.
All other financial statement schedules are omitted because the information is not required or because the information required is in the consolidated financial statements or notes thereto included in Item 8 of this Form 10-K.
(3) Exhibits.
The exhibits listed in the Exhibit Index.
SIGNATURES
Pursuant to the requirements of Section 13 or 15(d) of the Securities Exchange Act of 1934, the registrant has duly caused this report to be signed on its behalf by the undersigned, thereunto duly authorized.
|
CAL DIVE INTERNATIONAL, INC.
|
||
|
By:
|
/s/ Brent D. Smith
|
|
|
Brent D. Smith
Executive Vice President,
Chief Financial Officer and Treasurer
|
||
March 2, 2011
Pursuant to the requirements of the Securities Exchange Act of 1934, this report has been signed below by the following persons on behalf of the registrant and in the capacities and on the dates indicated.
|
Signature
|
Title
|
Date
|
|
/s/ Todd A. Dittmann
|
Director
|
March 2, 2011
|
|
Todd A. Dittmann
|
||
|
/s/ David E. Preng
|
Director
|
March 2, 2011
|
|
David E. Preng
|
||
|
/s/ William L. Transier
|
Director
|
March 2, 2011
|
|
William L. Transier
|
||
|
/s/ Owen E. Kratz
|
Director
|
March 2, 2011
|
|
Owen E. Kratz
|
||
|
/s/ John T. Mills
|
Director
|
March 2, 2011
|
|
John T. Mills
|
||
|
/s/ Quinn J. Hébert
|
Chairman, President and
|
March 2, 2011
|
|
Quinn J. Hébert
|
Chief Executive Officer
(Principal Executive Officer)
|
|
|
/s/ Brent D. Smith
|
Executive Vice President, Chief
|
March 2, 2011
|
|
Brent D. Smith
|
Financial Officer and Treasurer
(Principal Financial and
Accounting Officer)
|
SCHEDULE II
Valuation and Qualifying Accounts
Years Ended December 31, 2010, 2009, and 2008
(in thousands)
|
Balance at
Beginning
of Period
|
Charged to
Costs and
Expenses
|
Deductions
|
Charged
to Other
Accounts
|
Balance
at End of
Period
|
||||||||||||||||
|
2010
|
||||||||||||||||||||
|
Allowance for doubtful accounts
|
$ | 7,286 | $ | (167 | ) | $ | (1,080 | ) | $ | — | $ | 6,039 | ||||||||
|
Valuation allowance on deferred tax assets
|
3,177 | 3,424 | — | — | 6,601 | |||||||||||||||
|
2009
|
||||||||||||||||||||
|
Allowance for doubtful accounts
|
$ | 4,604 | $ | 7,992 | $ | (5,310 | ) | $ | — | $ | 7,286 | |||||||||
|
Valuation allowance on deferred tax assets
|
3,317 | — | (140 | ) | — | 3,177 | ||||||||||||||
|
2008
|
||||||||||||||||||||
|
Allowance for doubtful accounts
|
$ | 1,400 | $ | — | $ | (867 | ) | $ | 4,071 | $ | 4,604 | |||||||||
|
Valuation allowance on deferred tax assets
|
2,967 | 350 | — | — | 3,317 | |||||||||||||||
EXHIBIT INDEX
|
Filed
|
||||||||||||
|
Exhibit
|
with this
|
Incorporated by Reference
|
||||||||||
|
Number
|
Exhibit Title
|
Form 10-K
|
Form
|
File No.
|
Date Filed
|
|||||||
|
3.1
|
Amended and Restated Certificate of Incorporation of Cal Dive International, Inc.
|
10-K
|
000-33206
|
3/1/07
|
||||||||
|
3.2
|
Amended and Restated Bylaws of Cal Dive International, Inc.
|
8-K
|
000-33206
|
8/31/10
|
||||||||
|
4.1
|
Specimen Common Stock certificate of Cal Dive International, Inc.
|
S-1
|
333-134609
|
5/31/06
|
||||||||
|
10.1
|
Master Agreement between Cal Dive International, Inc. and Helix Energy Solutions Group, Inc.
|
10-K
|
000-33206
|
3/1/07
|
||||||||
|
10.2
|
Registration Rights Agreement between Cal Dive International, Inc. and Helix Energy Solutions Group, Inc.
|
10-K
|
000-33206
|
3/1/07
|
||||||||
|
10.3
|
Tax Matters Agreement between Cal Dive International, Inc. and Helix Energy Solutions Group, Inc.
|
10-K
|
000-33206
|
3/1/07
|
||||||||
|
10.4
|
Credit Agreement dated December 11, 2007 among Cal Dive International, Inc., CDI Vessel Holdings LLC and Bank of America, N.A., as Administrative Agent, Swing Line Lender and L/C Issuer, together with the other lenders parties thereto
|
8-K
|
000-33206
|
12/17/07
|
||||||||
|
10.5
|
Amendment No. 3 to Credit Agreement, dated as of July 19, 2010, among Cal Dive International, Inc., CDI Vessel Holdings LLC and Bank of America, N.A., as Administrative Agent, Swing Line Lender and L/C Issuer, together with the other lenders parties hereto
|
8-K
|
001-33206
|
7/23/10
|
||||||||
|
10.6
|
Stock Repurchase Agreement, dated as of January 23, 2009, by and between Cal Dive International, Inc. and Helix Energy Solutions Group, Inc.
|
8-K
|
000-33206
|
1/26/09
|
||||||||
|
10.7
|
Stock Repurchase Agreement dated as of May 29, 2009 by and between Cal Dive International, Inc. and Helix Energy Solutions Group, Inc.
|
8-K
|
001-33206
|
6/1/09
|
||||||||
|
10.8*
|
Severance and Change of Control Agreement, dated as of January 1, 2008, by and between Cal Dive International, Inc. and Quinn J. Hébert
|
10-K
|
000-33206
|
2/28/08
|
||||||||
|
10.9*
|
Severance and Change of Control Agreement, dated as of January 1, 2008, by and between Cal Dive International, Inc. and Scott T. Naughton
|
10-K
|
000-33206
|
2/28/08
|
||||||||
|
10.10*
|
Severance and Change of Control Agreement, dated as of January 1, 2008, by and between Cal Dive International, Inc. and Lisa M. Buchanan
|
10-K
|
000-33206
|
2/28/08
|
||||||||
|
10.11*
|
Amendment No. 1 to Severance and Change of Control Agreement, dated as of January 1, 2009, between Cal Dive International, Inc. and Quinn J. Hébert
|
X
|
||||||||||
|
10.12*
|
Amendment No. 1 to Severance and Change of Control Agreement, dated as of January 1, 2009, between Cal Dive International, Inc. and Scott T. Naughton
|
10-K
|
000-33206
|
2/23/09
|
||||||||
|
10.13*
|
Amendment No. 1 to Severance and Change of Control Agreement, dated as of January 1, 2009, between Cal Dive International, Inc. and Lisa M. Buchanan
|
10-K
|
000-33206
|
2/23/09
|
||||||||
|
10.14*
|
Form of Amendment No. 2 to Severance and Change of Control Agreement, dated as of September 10, 2010, by and between Cal Dive International, Inc. and each of Quinn J. Hébert, Scott T. Naughton and Lisa M. Buchanan
|
8-K
|
001-33206
|
9/16/10
|
||||||||
| Filed | |||||||||||||
| Exhibit | with this | Incorporated by Reference | |||||||||||
| Number | Exhibit Title | Form 10-K | Form | File No. | Date Filed | ||||||||
|
10.15*
|
Severance and Change of Control Agreement, dated as of November 4, 2009, by and between Cal Dive International, Inc. and Bruce P. Koch
|
8-K
|
000-33206
|
11/5/09
|
|||||||||
|
10.16*
|
Severance and Change of Control Agreement, dated as of August 25, 2010, by and between Cal Dive International, Inc. and Brent D. Smith
|
8-K
|
001-33206
|
8/31/10
|
|||||||||
|
10.17*
|
Form of Indemnity Agreement by and between Cal Dive International, Inc. and each of its directors and executive officers
|
8-K
|
000-33206
|
5/11/07
|
|||||||||
|
10.18*
|
Amended and Restated Annual Performance Bonus Plan
|
10-K
|
001-33206
|
2/26/10
|
|||||||||
|
10.19*
|
Cal Dive International, Inc. Amended and Restated 2006 Long-Term Incentive Plan
|
8-K
|
000-33206
|
12/16/09
|
|||||||||
|
10.20*
|
Form of Restricted Stock Agreement for 2006 Grants to Quinn J. Hébert, Scott T. Naughton, G. Kregg Lunsford, and Lisa M. Buchanan
|
10-K
|
000-33206
|
3/1/07
|
|||||||||
|
10.21*
|
Amendment No. 1 to Restricted Stock Award Agreement, dated as of December 19, 2007, by and among Cal Dive International, Inc. and Quinn J. Hébert, Scott T. Naughton, G. Kregg Lunsford and Lisa M. Buchanan
|
10-K
|
000-33206
|
2/28/08
|
|||||||||
|
10.22*
|
Amendment No. 2 to Restricted Stock Award Agreement, dated as of December 11, 2008, by and among Cal Dive International, Inc. and Quinn J. Hébert, Scott T. Naughton, G. Kregg Lunsford and Lisa M. Buchanan
|
8-K
|
000-33206
|
12/17/08
|
|||||||||
|
10.23*
|
Form of Restricted Stock Award Agreement for 2008 Grants to Quinn J. Hébert, Scott T. Naughton, G. Kregg Lunsford and Lisa M. Buchanan
|
10-K
|
000-33206
|
2/28/08
|
|||||||||
|
10.24*
|
Form of Restricted Stock Award Agreement for 2008 Grants to Outside Directors
|
10-K
|
000-33206
|
2/23/09
|
|||||||||
|
10.25*
|
Form of Restricted Stock Award Agreement between Cal Dive International, Inc. and each of its executive officers for 2009 grants
|
8-K
|
000-33206
|
12/16/09
|
|||||||||
|
10.26*
|
Form of Performance Share Unit Award Agreement between Cal Dive International, Inc. and each of its executive officers for 2009 grants
|
8-K
|
000-33206
|
12/16/09
|
|||||||||
|
10.27*
|
Form of Restricted Stock Award Agreement between Cal Dive International, Inc. and each of its outside directors for 2010 grants
|
X
|
|||||||||||
|
10.28*
|
Form of Performance Share Unit Award Agreement between Cal Dive International, Inc. and each of its executive officers for 2010 grants
|
X
|
|||||||||||
|
14.1
|
Code of Ethics
|
10-K
|
000-33206
|
3/1/07
|
|||||||||
|
21.1
|
Subsidiaries of Cal Dive International, Inc.
|
X
|
|||||||||||
|
23.1
|
Consent of Ernst & Young LLP
|
X
|
|||||||||||
|
31.1
|
Certification Pursuant to Rule 13a-14(a) under the Securities Exchange Act of 1934 by Quinn J. Hébert, Chief Executive Officer
|
X
|
|||||||||||
|
31.2
|
Certification Pursuant to Rule 13a-14(a) under the Securities Exchange Act of 1934 by Brent D. Smith, Chief Financial Officer
|
X
|
|||||||||||
|
32.1
|
Section 1350 Certification by Chief Executive Officer and Chief Financial Officer
|
X
|
|||||||||||
|
*Indicates management contract or compensatory plan or arrangement.
|
|||||||||||||
67