Attached files
| file | filename |
|---|---|
| 8-K - FORM 8-K - NEWELL BRANDS INC. | d8k.htm |
Exhibit 99.1

|
> News Release |
Newell Rubbermaid Reports First Quarter 2011 Results
» Normalized EPS of $0.30; a 20% Increase Compared to Prior Year
» Reaffirms Full Year 2011 Guidance
» Announces 60% Dividend Increase
ATLANTA, April 29, 2011 – Newell Rubbermaid (NYSE: NWL) today announced first quarter 2011 financial results, including normalized diluted earnings per share of $0.30, a 20 percent improvement over prior year results, gross margin of 37.7 percent and 0.3 percent lower net sales. The company also announced it will raise its quarterly dividend 60 percent to 8 cents per share.
“First quarter results represent a solid start to the year, especially our earnings and gross margin performance,” said Mark Ketchum, President and Chief Executive Officer. “We remain confident in our ability to meet our full year guidance of 4 to 5 percent core sales growth, gross margin expansion of 50 to 75 basis points and normalized EPS growth of 10 to 12 percent. Our international businesses led the way, building on already strong momentum, with core sales growth of almost 5 percent. Developing markets, where we have substantially increased our focus and investment, grew double digits in the first quarter.”
“Our topline performance fell short of expectations driven mainly by consumer trade down behavior and reduced promotional activity affecting two key businesses,” added Ketchum. “We are taking steps to respond to these trends by introducing additional value priced items and restoring promotional activity behind our new product launches. These actions, in concert with already strong growth trends in our other businesses, give us confidence in our full year growth projections. In addition, our Board of Directors’ decision to increase our quarterly dividend shows further confidence in our track record of strong cash flows and improving credit metrics.”
Net sales in the first quarter were $1.30 billion, a decline of 0.3 percent compared with the prior year. Core sales contracted 1.7 percent and foreign currency translation had a positive 1.4 percent impact on sales. The company estimates that core sales in last year’s first quarter were favorably impacted by approximately 2.6 percent due to pre-buying by certain customers in anticipation of the April 2010 SAP go live, and last year’s fourth quarter core sales were favorably impacted by customer order acceleration to qualify for annual volume rebates. Together, these two events accounted for approximately $40 million in timing shifts. Adjusting for these timing differences, first quarter 2011 core sales growth would have been 1.5 percent.
Gross margin for the quarter was 37.7 percent, up 160 basis points from last year as pricing, favorable mix and productivity more than offset the impact of input cost inflation.
First quarter operating income, on a normalized basis, was $141.7 million, or 10.9 percent of sales, excluding $11.1 million of restructuring and restructuring-related costs incurred in connection with the European Transformation Plan. In 2010, normalized operating income was $146.1 million, or 11.2 percent of sales, excluding Project Acceleration restructuring costs of $16.0 million.
3 Glenlake Parkway | Atlanta, GA 30328 | Phone +1 (770) 418-7000 | www.newellrubbermaid.com | NYSE: NWL

|
|
> News Release |
The normalized tax rate for the quarter was 25.0 percent compared to 37.2 percent in the prior year. The year-over-year tax rate improvement was driven by a change in the geographical mix of earnings, as well as the 2010 impact of non-cash tax charges associated with the vesting of equity-based compensation and the expiration of certain domestic tax credits.
Normalized earnings were $0.30 per diluted share compared to prior year normalized results of $0.25 per diluted share, driven by improved gross margin, reduced interest expense and a lower tax rate. For the first quarter 2011, normalized diluted earnings per share exclude $0.04 per diluted share for restructuring and restructuring-related costs associated with the European Transformation Plan, net of tax and $0.01 per diluted share for a loss related to the retirement of convertible notes. For the first quarter 2010, normalized earnings per share excluded $0.04 for Project Acceleration restructuring costs, net of tax, and $0.02 of dilution related to the conversion feature of the convertible notes issued in March 2009 and the impact of associated hedge transactions. (A reconciliation of the “as reported” results to “normalized” results is included below.)
Net income, as reported, was $75.7 million, or $0.25 per diluted share, for the first quarter. This compares to net income of $58.4 million, or $0.19 per diluted share, in the prior year.
“A notable milestone in the quarter was the completion of the accelerated share repurchase program, which marks the conclusion of our capital structure optimization plan,” said CEO Mark Ketchum. “The objectives of the plan were to reduce interest cost, eliminate future share dilution and strengthen the balance sheet with a simpler, more shareholder-friendly capital structure. I am pleased to announce that we successfully accomplished all of these objectives. With the completion of the capital structure optimization plan, the company in effect repurchased 27.9 million of the 40 million shares that were issued in convertible debt exchanges. The anticipated interest savings resulting from this initiative will more than offset overall share dilution, with the impact expected to be $0.02 accretive to diluted earnings per share.”
The company used operating cash of $108.3 million during the first quarter, compared to cash generation of $29.4 million in the comparable period last year. Higher inventory levels in anticipation of international expansion and new product introductions and the timing of customer program and income tax payments are the primary contributors to the year-over-year change in operating cash flow. Capital expenditures were $44.9 million in the first quarter compared to $31.5 million in the prior year.
3 Glenlake Parkway | Atlanta, GA 30328 | Phone +1 (770) 418-7000 | www.newellrubbermaid.com | NYSE: NWL
|
|
> News Release |
A reconciliation of the first quarter 2011 and last year’s results is as follows:
| Q1 2011 | Q1 2010 | |||||||
| Diluted earnings per share (as reported) |
$ | 0.25 | $ | 0.19 | ||||
| Restructuring and restructuring-related costs, net of tax |
$ | 0.04 | $ | 0.04 | ||||
| Convertible notes dilution |
$ | 0.00 | $ | 0.02 | ||||
| Loss related to the retirement of convertible notes |
$ | 0.01 | $ | 0.00 | ||||
| “Normalized” EPS |
$ | 0.30 | $ | 0.25 | ||||
2011 Full Year Outlook
The company reiterated its 2011 guidance for core sales growth of four to five percent and estimates that foreign currency will have a positive one to two point impact on sales growth. Gross margin is still expected to improve 50 to 75 basis points with the combination of productivity, mix and pricing more than offsetting input cost inflation.
The company also reaffirmed its expectation of a year-over-year increase in normalized earnings per diluted share of 10 to 12 percent in 2011.
The company’s 2011 normalized EPS expectation excludes between $80 and $85 million of restructuring and other Plan-related costs associated with the company’s European Transformation Plan. The company expects to realize annualized net income improvement of $55 to $65 million upon completion of the European Transformation Plan in 2012, and estimates the initiative will result in aggregate restructuring and other Plan-related costs of $110 to $115 million. (A reconciliation of the “as reported” results to “normalized” results is included below.)
Operating cash flow is expected to exceed $550 million for the full year, including approximately $90 to $100 million in restructuring and restructuring-related cash payments. The company plans to fund capital expenditures of approximately $200 million during the year.
3 Glenlake Parkway | Atlanta, GA 30328 | Phone +1 (770) 418-7000 | www.newellrubbermaid.com | NYSE: NWL
|
|
> News Release |
A reconciliation of the 2011 earnings outlook is as follows:
| FY 2011 | ||||
| Diluted earnings per share |
$ | 1.42 to $1.45 | ||
| Restructuring and restructuring-related costs, net of tax |
$ | 0.22 to $0.26 | ||
| Loss related to the retirement of convertible notes |
$ | 0.01 | ||
| “Normalized” EPS |
$ | 1.67 to $1.70 | ||
Conference Call
The company’s first quarter 2011 earnings conference call is scheduled for today, April 29, 2011, at 9:00 am ET. To listen to the webcast, use the link provided under Events & Presentations in the Investor Relations section of Newell Rubbermaid’s Web site at www.newellrubbermaid.com. The webcast will be available for replay for two weeks. A brief supporting slide presentation will be available prior to the call under Quarterly Earnings in the Investor Relations section on the company’s Web site.
Non-GAAP Financial Measures
This release contains non-GAAP financial measures within the meaning of Regulation G promulgated by the Securities and Exchange Commission. Included in this release is a reconciliation of these non-GAAP financial measures to the most directly comparable financial measures calculated in accordance with GAAP.
About Newell Rubbermaid
Newell Rubbermaid Inc., an S&P 500 company, is a global marketer of consumer and commercial products with 2010 sales of approximately $5.8 billion and a strong portfolio of brands, including Rubbermaid®, Sharpie®, Graco®, Calphalon®, Irwin®, Lenox®, Levolor®, Paper Mate®, Dymo®, Waterman®, Parker®, Goody®, and Aprica®.
This press release and additional information about Newell Rubbermaid are available on the company’s Web site, www.newellrubbermaid.com.
Contacts:
| Nancy O’Donnell |
David Doolittle | |
| Vice President, Investor Relations |
Vice President, Corporate Communications | |
| +1 (770) 418-7723 |
+1 (770) 418-7519 |
3 Glenlake Parkway | Atlanta, GA 30328 | Phone +1 (770) 418-7000 | www.newellrubbermaid.com | NYSE: NWL
|
|
> News Release |
Caution Concerning Forward-Looking Statements
Statements in this press release that are not historical in nature constitute forward-looking statements. These forward-looking statements relate to information or assumptions about the effects of sales, income/(loss), earnings per share, operating income or gross margin improvements or declines, Project Acceleration, the European Transformation Plan, the Capital Structure Optimization Plan, capital and other expenditures, cash flow, dividends, restructuring and restructuring related costs, costs and cost savings, inflation or deflation, particularly with respect to commodities such as oil and resin, debt ratings, and management’s plans, projections and objectives for future operations and performance. These statements are accompanied by words such as “anticipate,” “expect,” “project,” “will,” “believe,” “estimate” and similar expressions. Actual results could differ materially from those expressed or implied in the forward-looking statements. Important factors that could cause actual results to differ materially from those suggested by the forward-looking statements include, but are not limited to, our dependence on the strength of retail, commercial and industrial sectors of the economy in light of the global economic slowdown; currency fluctuations; competition with other manufacturers and distributors of consumer products; major retailers’ strong bargaining power; changes in the prices of raw materials and sourced products and our ability to obtain raw materials and sourced products in a timely manner from suppliers; our ability to develop innovative new products and to develop, maintain and strengthen our end-user brands; our ability to expeditiously close facilities and move operations while managing foreign regulations and other impediments; our ability to implement successfully information technology solutions throughout our organization; our ability to improve productivity and streamline operations; changes to our credit ratings; significant increases in the funding obligations related to our pension plans due to declining asset values or otherwise; the imposition of tax liabilities greater than our provisions for such matters; the risks inherent in our foreign operations and those factors listed in the company’s Annual Report on Form 10-K for 2010 filed with the Securities and Exchange Commission. Changes in such assumptions or factors could produce significantly different results. The information contained in this news release is as of the date indicated. The company assumes no obligation to update any forward-looking statements contained in this news release as a result of new information or future events or developments.
NWL-EA
3 Glenlake Parkway | Atlanta, GA 30328 | Phone +1 (770) 418-7000 | www.newellrubbermaid.com | NYSE: NWL
Newell Rubbermaid Inc.
CONSOLIDATED STATEMENTS OF OPERATIONS (UNAUDITED)
(in millions, except per share data)
Reconciliation of “As Reported” Results to “Normalized” Results
| Three Months Ended March 31, | ||||||||||||||||||||||||||||
| 2011 | 2010 | YOY | ||||||||||||||||||||||||||
| As Reported | Excluded Items (1) | Normalized | As Reported | Excluded Items (2) | Normalized | % Change | ||||||||||||||||||||||
| Net sales |
$ | 1,302.7 | $ | — | $ | 1,302.7 | $ | 1,306.4 | $ | — | $ | 1,306.4 | (0.3 | )% | ||||||||||||||
| Cost of products sold |
811.8 | — | 811.8 | 834.7 | — | 834.7 | ||||||||||||||||||||||
| GROSS MARGIN |
490.9 | — | 490.9 | 471.7 | — | 471.7 | 4.1 | % | ||||||||||||||||||||
| % of sales |
37.7 | % | 37.7 | % | 36.1 | % | 36.1 | % | ||||||||||||||||||||
| Selling, general & administrative expenses |
354.5 | (5.3 | ) | 349.2 | 325.6 | — | 325.6 | 7.2 | % | |||||||||||||||||||
| % of sales |
27.2 | % | 26.8 | % | 24.9 | % | 24.9 | % | ||||||||||||||||||||
| Restructuring costs |
5.8 | (5.8 | ) | — | 16.0 | (16.0 | ) | — | ||||||||||||||||||||
| OPERATING INCOME |
130.6 | 11.1 | 141.7 | 130.1 | 16.0 | 146.1 | (3.0 | )% | ||||||||||||||||||||
| % of sales |
10.0 | % | 10.9 | % | 10.0 | % | 11.2 | % | ||||||||||||||||||||
| Nonoperating expenses: |
||||||||||||||||||||||||||||
| Interest expense, net |
21.9 | — | 21.9 | 32.0 | — | 32.0 | ||||||||||||||||||||||
| Loss related to extinguishment of debt |
4.8 | (4.8 | ) | — | — | — | — | |||||||||||||||||||||
| Other expense (income), net |
1.5 | — | 1.5 | (0.3 | ) | — | (0.3 | ) | ||||||||||||||||||||
| 28.2 | (4.8 | ) | 23.4 | 31.7 | — | 31.7 | (26.2 | )% | ||||||||||||||||||||
| INCOME BEFORE INCOME TAXES |
102.4 | 15.9 | 118.3 | 98.4 | 16.0 | 114.4 | 3.4 | % | ||||||||||||||||||||
| % of sales |
7.9 | % | 9.1 | % | 7.5 | % | 8.8 | % | ||||||||||||||||||||
| Income taxes |
26.7 | 2.9 | 29.6 | 40.0 | 2.5 | 42.5 | (30.4 | )% | ||||||||||||||||||||
| Effective rate |
26.1 | % | 25.0 | % | 40.7 | % | 37.2 | % | ||||||||||||||||||||
| NET INCOME (3) |
$ | 75.7 | $ | 13.0 | $ | 88.7 | $ | 58.4 | $ | 13.5 | $ | 71.9 | 23.4 | % | ||||||||||||||
| % of sales |
5.8 | % | 6.8 | % | 4.5 | % | 5.5 | % | ||||||||||||||||||||
| EARNINGS PER SHARE: |
||||||||||||||||||||||||||||
| Basic |
$ | 0.26 | $ | 0.04 | $ | 0.30 | $ | 0.21 | $ | 0.05 | $ | 0.26 | ||||||||||||||||
| Diluted |
$ | 0.25 | $ | 0.05 | $ | 0.30 | $ | 0.19 | $ | 0.06 | $ | 0.25 | ||||||||||||||||
| AVERAGE SHARES OUTSTANDING: |
||||||||||||||||||||||||||||
| Basic |
294.2 | 294.2 | 281.1 | 281.1 | ||||||||||||||||||||||||
| Diluted |
298.2 | 298.2 | 307.8 | 282.9 | ||||||||||||||||||||||||
| (1) | Items excluded from “normalized” results for 2011 consist of $5.3 million of restructuring related costs and $5.8 million of restructuring costs incurred in connection with the European Transformation Plan, net of tax effects, as well as the net of tax impact of $4.8 million of debt extinguishment costs incurred to exchange substantially all of the remaining convertible notes issued March 2009. |
| (2) | Items excluded from “normalized” results for 2010 consist of $16.0 million of restructuring costs, including asset impairment charges and employee termination and other costs, and the associated tax effects, as well as the dilutive impact of the conversion feature of the convertible notes issued in March 2009 and the associated hedge transactions. |
| (3) | Net income attributable to noncontrolling interests was not material in either of the periods presented. |
Newell Rubbermaid Inc.
CONSOLIDATED BALANCE SHEETS (UNAUDITED)
(in millions)
| March 31, 2011 |
March 31, 2010 |
|||||||
| Assets: |
||||||||
| Cash and cash equivalents |
$ | 139.7 | $ | 253.0 | ||||
| Accounts receivable, net |
967.2 | 915.8 | ||||||
| Inventories, net |
844.7 | 728.6 | ||||||
| Deferred income taxes |
181.4 | 187.9 | ||||||
| Prepaid expenses and other |
171.2 | 151.5 | ||||||
| Total Current Assets |
2,304.2 | 2,236.8 | ||||||
| Property, plant and equipment, net |
535.2 | 550.2 | ||||||
| Goodwill |
2,791.8 | 2,730.1 | ||||||
| Other intangible assets, net |
662.6 | 642.8 | ||||||
| Other assets |
343.4 | 256.2 | ||||||
| Total Assets |
$ | 6,637.2 | $ | 6,416.1 | ||||
| Liabilities and Stockholders’ Equity: |
||||||||
| Accounts payable |
$ | 548.9 | $ | 501.3 | ||||
| Accrued compensation |
101.2 | 94.8 | ||||||
| Other accrued liabilities |
618.8 | 612.7 | ||||||
| Short-term debt |
325.0 | — | ||||||
| Current portion of long-term debt |
411.1 | 495.3 | ||||||
| Total Current Liabilities |
2,005.0 | 1,704.1 | ||||||
| Long-term debt |
1,796.3 | 2,013.4 | ||||||
| Other noncurrent liabilities |
797.2 | 883.0 | ||||||
| Stockholders’ Equity - Parent |
2,035.2 | 1,812.1 | ||||||
| Stockholders’ Equity - Noncontrolling Interests |
3.5 | 3.5 | ||||||
| Total Stockholders’ Equity |
2,038.7 | 1,815.6 | ||||||
| Total Liabilities and Stockholders’ Equity |
$ | 6,637.2 | $ | 6,416.1 | ||||
Newell Rubbermaid Inc.
CONSOLIDATED STATEMENTS OF CASH FLOW (UNAUDITED)
(in millions)
| Three Months Ended March 31, | ||||||||
| 2011 | 2010 | |||||||
| Operating Activities: |
||||||||
| Net income |
$ | 75.7 | $ | 58.4 | ||||
| Adjustments to reconcile net income to net cash (used in) provided by operating activities: |
||||||||
| Depreciation and amortization |
40.7 | 44.2 | ||||||
| Loss related to extinguishment of debt |
4.8 | — | ||||||
| Deferred income taxes |
35.4 | 21.3 | ||||||
| Non-cash restructuring costs |
(0.5 | ) | 0.9 | |||||
| Stock-based compensation expense |
8.1 | 10.5 | ||||||
| Other |
4.1 | 9.0 | ||||||
| Changes in operating assets and liabilities, excluding the effects of acquisitions: |
||||||||
| Accounts receivable |
45.1 | (29.4 | ) | |||||
| Inventories |
(131.7 | ) | (46.1 | ) | ||||
| Accounts payable |
70.3 | 71.1 | ||||||
| Accrued liabilities and other |
(260.3 | ) | (110.5 | ) | ||||
| Net cash (used in) provided by operating activities |
$ | (108.3 | ) | $ | 29.4 | |||
| Investing Activities: |
||||||||
| Acquisitions and acquisition related activity |
$ | (18.9 | ) | $ | (1.5 | ) | ||
| Capital expenditures |
(44.9 | ) | (31.5 | ) | ||||
| Proceeds from sales of noncurrent assets |
2.7 | — | ||||||
| Net cash used in investing activities |
$ | (61.1 | ) | $ | (33.0 | ) | ||
| Financing Activities: |
||||||||
| Net proceeds from short-term borrowings |
$ | 190.0 | $ | — | ||||
| Proceeds from issuance of debt, net of debt issuance costs |
— | 1.4 | ||||||
| Payments on and for the settlement of notes payable and debt |
(0.5 | ) | (2.9 | ) | ||||
| Cash consideration paid in convertible note exchange |
(3.1 | ) | — | |||||
| Cash dividends |
(14.7 | ) | (13.9 | ) | ||||
| Other, net |
(3.9 | ) | (2.9 | ) | ||||
| Net cash provided by (used in) financing activities |
$ | 167.8 | $ | (18.3 | ) | |||
| Currency rate effect on cash and cash equivalents |
$ | 1.7 | $ | (3.4 | ) | |||
| Increase (decrease) in cash and cash equivalents |
$ | 0.1 | $ | (25.3 | ) | |||
| Cash and cash equivalents at beginning of period |
139.6 | 278.3 | ||||||
| Cash and cash equivalents at end of period |
$ | 139.7 | $ | 253.0 | ||||
Newell Rubbermaid Inc.
Financial Worksheet
(In Millions)
| 2011 | 2010 | |||||||||||||||||||||||||||||||||||||||||||||||||||||||
| Reconciliation (1) | Reconciliation (2) | Year-over-year changes | ||||||||||||||||||||||||||||||||||||||||||||||||||||||
| Reported | Excluded | Normalized | Operating | Reported | Excluded | Normalized | Operating | Net Sales | Normalized OI | |||||||||||||||||||||||||||||||||||||||||||||||
| Net Sales | OI | Items | OI | Margin | Net Sales | OI | Items | OI | Margin | $ | % | $ | % | |||||||||||||||||||||||||||||||||||||||||||
| Q1: |
||||||||||||||||||||||||||||||||||||||||||||||||||||||||
| Home & Family |
$ | 534.1 | $ | 56.6 | $ | — | $ | 56.6 | 10.6 | % | $ | 556.9 | $ | 68.8 | $ | — | $ | 68.8 | 12.4 | % | $ | (22.8 | ) | (4.1 | )% | $ | (12.2 | ) | (17.7 | )% | ||||||||||||||||||||||||||
| Office Products |
364.9 | 54.9 | — | 54.9 | 15.0 | % | 351.6 | 47.3 | — | 47.3 | 13.5 | % | 13.3 | 3.8 | % | 7.6 | 16.1 | % | ||||||||||||||||||||||||||||||||||||||
| Tools, Hardware & Commercial Products |
403.7 | 49.4 | — | 49.4 | 12.2 | % | 397.9 | 51.6 | — | 51.6 | 13.0 | % | 5.8 | 1.5 | % | (2.2 | ) | (4.3 | )% | |||||||||||||||||||||||||||||||||||||
| Restructuring Costs |
(5.8 | ) | 5.8 | — | (16.0 | ) | 16.0 | — | ||||||||||||||||||||||||||||||||||||||||||||||||
| Corporate |
(24.5 | ) | 5.3 | (19.2 | ) | (21.6 | ) | — | (21.6 | ) | 2.4 | 11.1 | % | |||||||||||||||||||||||||||||||||||||||||||
| Total |
$ | 1,302.7 | $ | 130.6 | $ | 11.1 | $ | 141.7 | 10.9 | % | $ | 1,306.4 | $ | 130.1 | $ | 16.0 | $ | 146.1 | 11.2 | % | $ | (3.7 | ) | (0.3 | )% | $ | (4.4 | ) | (3.0 | )% | ||||||||||||||||||||||||||
| (1) | Excluded items are related to restructuring and restructuring related costs incurred in connection with the European Transformation Plan. |
| (2) | Excluded items are related to Project Acceleration costs. |
Newell Rubbermaid Inc.
Calculation of Free Cash Flow (1)
| Three Months Ended March 31, | ||||||||
| 2011 | 2010 | |||||||
| Free Cash Flow (in millions): |
||||||||
| Net cash (used in) provided by operating activities |
$ | (108.3 | ) | $ | 29.4 | |||
| Capital expenditures |
(44.9 | ) | (31.5 | ) | ||||
| Free Cash Flow |
$ | (153.2 | ) | $ | (2.1 | ) | ||
| (1) | Free Cash Flow is defined as cash flow (used in) provided by operating activities less capital expenditures. |
Newell Rubbermaid Inc.
Three Months Ended March 31, 2011
In Millions
Currency Analysis
| 2011 | 2010 | Year-Over-Year (Decrease) Increase | ||||||||||||||||||||||||||
| Sales as Reported |
Currency Impact |
Adjusted Sales |
Sales as Reported |
Excluding Currency |
Including Currency |
Currency Impact |
||||||||||||||||||||||
| By Segment | ||||||||||||||||||||||||||||
| Home & Family |
$ | 534.1 | $ | (5.6 | ) | $ | 528.5 | $ | 556.9 | (5.1 | )% | (4.1 | )% | 1.0 | % | |||||||||||||
| Office Products |
364.9 | (7.4 | ) | 357.5 | 351.6 | 1.7 | % | 3.8 | % | 2.1 | % | |||||||||||||||||
| Tools, Hardware & Commercial Products |
403.7 | (5.9 | ) | 397.8 | 397.9 | (0.0 | )% | 1.5 | % | 1.5 | % | |||||||||||||||||
| Total Company |
$ | 1,302.7 | $ | (18.9 | ) | $ | 1,283.8 | $ | 1,306.4 | (1.7 | )% | (0.3 | )% | 1.4 | % | |||||||||||||
| By Geography | ||||||||||||||||||||||||||||
| United States |
$ | 868.0 | $ | — | $ | 868.0 | $ | 904.6 | (4.0 | )% | (4.0 | )% | 0.0 | % | ||||||||||||||
| Canada |
81.5 | (5.1 | ) | 76.4 | 78.0 | (2.1 | )% | 4.5 | % | 6.5 | % | |||||||||||||||||
| Total North America |
949.5 | (5.1 | ) | 944.4 | 982.6 | (3.9 | )% | (3.4 | )% | 0.5 | % | |||||||||||||||||
| Europe, Middle East and Africa |
188.5 | (1.8 | ) | 186.7 | 188.8 | (1.1 | )% | (0.2 | )% | 1.0 | % | |||||||||||||||||
| Latin America |
73.1 | (5.4 | ) | 67.7 | 55.7 | 21.5 | % | 31.2 | % | 9.7 | % | |||||||||||||||||
| Asia Pacific |
91.6 | (6.6 | ) | 85.0 | 79.3 | 7.2 | % | 15.5 | % | 8.3 | % | |||||||||||||||||
| Total International |
353.2 | (13.8 | ) | 339.4 | 323.8 | 4.8 | % | 9.1 | % | 4.3 | % | |||||||||||||||||
| Total Company |
$ | 1,302.7 | $ | (18.9 | ) | $ | 1,283.8 | $ | 1,306.4 | (1.7 | )% | (0.3 | )% | 1.4 | % | |||||||||||||
 Q1 2011 Earnings Call Presentation
April 29, 2011 |
 2
Forward-Looking Statement
Statements in this presentation that are not historical in nature constitute forward-looking
statements. These forward-looking statements relate to information or assumptions about the
effects of sales, income/(loss), earnings per share, operating income or gross margin
improvements or declines, Project Acceleration, the European Transformation Plan, the Capital
Structure Optimization Plan, capital and other expenditures, cash flow, dividends,
restructuring and restructuring-related costs, costs and cost savings, inflation or deflation,
particularly with respect to commodities such as oil and resin, debt ratings, and management's plans,
projection and objectives for future operations and performance. These statements are
accompanied by words such as "anticipate," "expect," "project,"
"will," "believe," "estimate" and similar expressions. Actual results could differ
materially from those expressed or implied in the forward-looking statements. Important factors
that could cause actual results to differ materially from those suggested by the
forward-looking statements include, but are not limited to, our dependence on the strength
of retail, commercial and industrial sectors of the economy in light of the global economic
slowdown; currency fluctuations; competition with other manufacturers and distributors of
consumer products; major retailers' strong bargaining power; changes in the prices of raw materials
and source products and our ability to obtain raw materials and sourced products in a timely
manner from suppliers; our ability to develop innovative new products and to develop, maintain
and strengthen our end-user brands; our ability to expeditiously close facilities and move
operations while managing foreign regulations and other impediments; our ability to implement
successfully information technology solutions throughout our organization; our ability to
improve productivity and streamline operations; changes to our credit ratings; significant increases
in the funding obligations related to our pension plans due to declining asset values or otherwise;
the imposition of tax liabilities greater than our provisions for such matters; the risks
inherent in our foreign operations and those factors listed in the company’s Annual Report
on Form 10-K for 2010 filed with the Securities and Exchange Commission. Changes in such
assumptions or factors could produce significantly different results. The information contained
in this presentation is as of the date indicated. The company assumes no obligation to update
any forward-looking statements contained in this presentation as a result of new information or future
events or developments. |
 3
Normalized EPS of $0.30; 20% improvement versus the prior year
primarily driven by gross margin expansion, a lower tax rate and
reduced interest expense, partially offset by higher SG&A
Net Sales of $1.30 billion, a 0.3% decrease versus the prior year,
including a 1.7% decline in core sales partially offset by favorable
foreign currency of 1.4%
Gross Margin expansion of 160 basis points to 37.7%
•
Pricing, favorable product mix and productivity more than offset
the impact of input cost inflation
Operating Cash used during the quarter was $108.3 million,
compared to cash generation of $29.4 million last year, due to higher
inventory to support international expansion and new product
launches
Q1 2011 Summary |
   4
Q1 2011 Sales:
Percent Change by Segment
Q1 2011
Home &
Family
Office
Products
Tools,
Hardware &
Commercial
Products
Total
Core Sales
(5.1)
1.7
0.0
(1.7)
Currency Translation
1.0
2.1
1.5
1.4
Total
(4.1)
3.8
1.5
(0.3) |
    5
Full Year 2011 Outlook
Net Sales Growth
Core Sales Growth
Currency Translation
Gross Margin Expansion
"Normalized" EPS** Growth
Cash Flow from Operations
Capital Expenditures
FY 2011 Outlook*
Approximately $200 million
4% to 5%
5% to 7%
> $550 million
50 to 75 basis points
10% to 12%
+1% to +2%
*
Reflects outlook communicated in the Q1 2011 Earnings Release and Earnings
Call **
See reconciliation included in the Appendix |
 6
Innovations Discussed on the
Q1 2011 Earnings Call
Rubbermaid®
Glass
with Easy Find Lids™
Sleek, crystal clear, tempered
glass is oven, microwave,
dishwasher, and freezer safe
and looks great on the table
Features Easy Find Lids
organization system -
lids
snap to the bottom of the
container and to each other,
and bases neatly nest inside
each other for compact
storage
Built-in gasket creates a leak-
proof seal to keep foods
fresher, longer |
 7
Innovations Discussed on the
Q1 2011 Earnings Call
Graco®
Signature Series™
Smart Seat™
All-in-One Car Seat
Convertible “grow-with-me”
car seat fits children from 5
to 100 lbs.
Features a convenient stay-
in-car base so parents only
have to install it one time
Side impact tested &
SafeSeat
Engineered –
Steel-reinforced frame & car
seat base provides strength
and durability |
 8
Innovations Discussed on the
Q1 2011 Earnings Call
Century by Graco®
Line of products targeted to
the value-conscious
consumer
Includes a travel system
which leverages our Graco®
SnugRide®
car seat system |
 9
Innovations Discussed on the
Q1 2011 Earnings Call
Levolor®
Size-in-Store
Blinds and Shades
Continued expansion of
Levolor®
Size-in-Store
system driving shelf
space and market share
gains
Best-in-class technology
makes it easy for
consumers to get
perfectly sized blinds and
shades immediately
trimmed to the exact size
while in store |
 10
Innovations Discussed on the
Q1 2011 Earnings Call
Recently acquired by
Dymo Mimio, Headsprout® is
a leader in the development
and implementation of
innovative adaptive software
that adjusts automatically to
each student's pace for
learning
Acquisition strengthens the
Dymo Mimio portfolio of
innovative and integrated
hardware, software and
services and will help
accelerate classroom
penetration
|
 11
Innovations Discussed on the
Q1 2011 Earnings Call
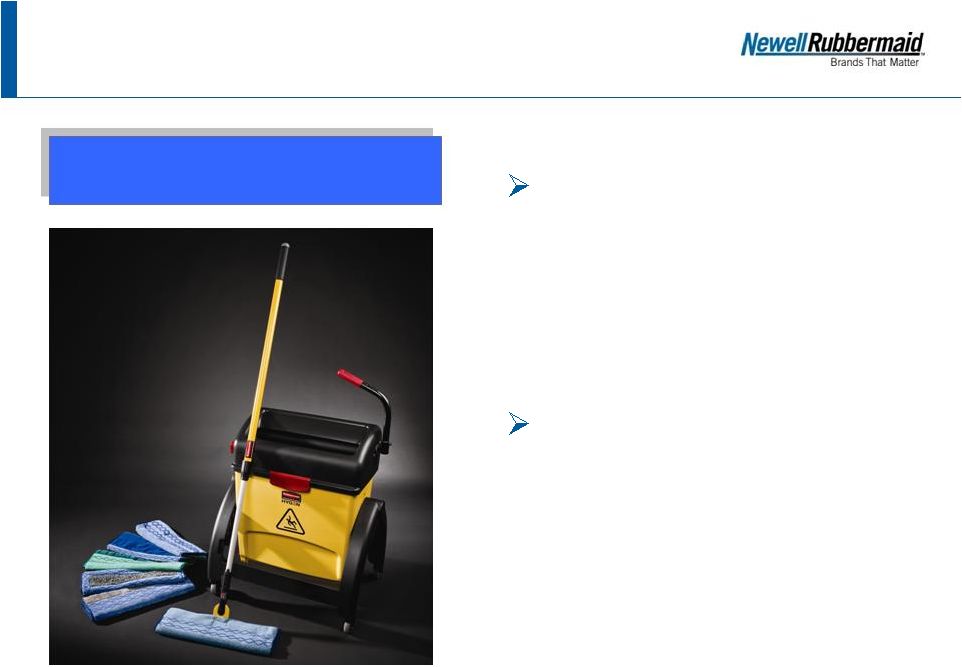
Rubbermaid®
HYGEN™
Clean Water System
Revolutionary floor
cleaning system features a
patented integrated water
filter for generating clean
water from dirty mopping
water
Offers a wide assortment of
microfiber flat mops
engineered to remove over
99 percent of microbes |
 12
Innovations Discussed on the
Q1 2011 Earnings Call
IRWIN®
VISE-GRIP®
GrooveLock
Pliers
Simple push of press-n-slide
button adjusts lower jaw 2X
faster than traditional groove
joint pliers
Multi-Groove Ratcheting
System has twice the groove
positions than any other
groove joint pliers, providing
precise jaw positioning to grip
any type of surface
Anti-pinch, non-slip
ProTouch™
Grips provide
comfort, control, and less
hand fatigue |
 13
Innovations Discussed on the
Q1 2011 Earnings Call
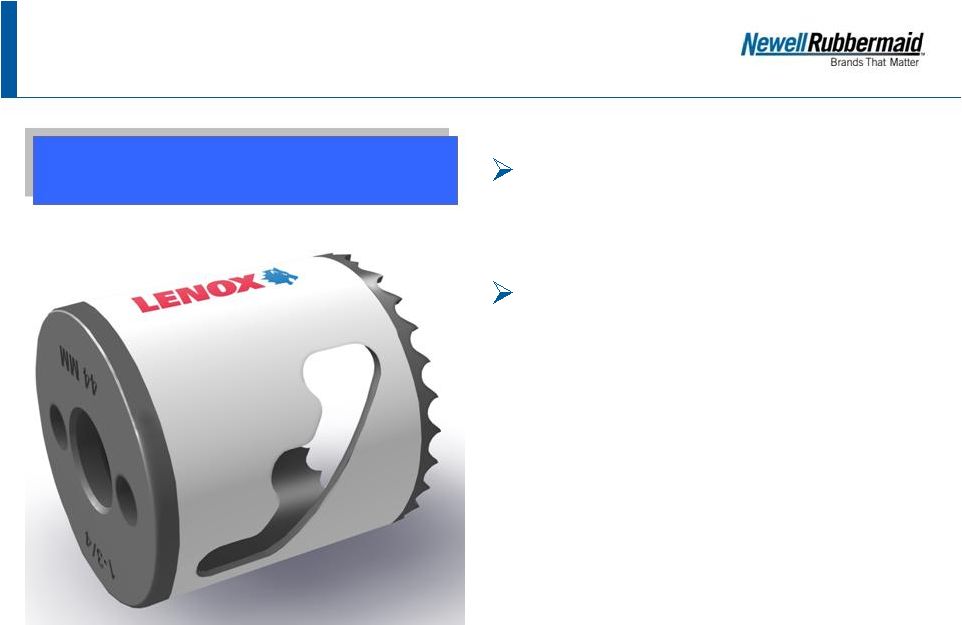
New patent-pending design
features a staircase slot for
easy plug removal
Enhanced tooth form, thin
kerf
design and advanced
coating provides up to two
times longer cutting life when
cutting holes in wood and
metal
LENOX®
Bi-Metal SPEED SLOT
Hole Saw |
 Appendix |
 15
Reconciliation: Q1 2011 and
Q1 2010 “Normalized”
EPS
Q1 2011
Q1 2010
Diluted earnings per share (as reported):
$0.25
$0.19
Restructuring and restructuring-related costs,
net of tax [ 1 ]
$0.04
$0.04
Convertible notes dilution
$0.00
$0.02
Loss related to the retirement of convertible
notes
$0.01
$0.00
"Normalized" EPS:
$0.30
$0.25
[ 1 ] Items excluded from "normalized" results for 2011 consist of restructuring and
restructuring- related costs incurred in connection with the European Transformation Plan,
net of tax effects. Items excluded from "normalized" results for 2010 consist of
Project Acceleration restructuring costs, net of tax effects. |
 16
Reconciliation: Full Year 2011 Outlook
and “Normalized”
EPS
FY 2011
Diluted earnings per share
$1.42 to $1.45
Restructuring and restructuring-related costs, net of
tax [ 1 ]
$0.22 to $0.26
Loss related to the retirement of convertible notes
$0.01
"Normalized" EPS:
$1.67 to $1.70
[ 1 ] Items excluded from "normalized" results consist of restructuring and
restructuring-related costs incurred in connection with the European Transformation Plan,
net of tax effects. |
 17
Reconciliation: Q1 2011 and Q1 2010 Operating
Income to Operating Income Excluding Charges
Q1 2011
Q1 2010
Net Sales
$1,302.7
$1,306.4
Operating income (as reported)
$130.6
$130.1
Restructuring and restructuring-related costs [ 1 ]
$11.1
$16.0
Operating income (excluding charges)
$141.7
$146.1
Operating Income (excluding charges), as a
percent of net sales
10.9%
11.2%
[ 1 ] Items excluded from "normalized" results for 2011 consist of restructuring and
restructuring- related costs incurred in connection with the European Transformation Plan,
net of tax effects. Items excluded from "normalized" results for 2010 consist of
Project Acceleration restructuring costs, net of tax effects.
$ millions |
 18
Reconciliation: Q1 2011 and
Q1 2010 Free Cash Flow
Q1 2011
Q1 2010
Operating Cash Flow
($108.3)
$29.4
Capital Expenditures
(44.9)
(31.5)
Free Cash Flow
($153.2)
($2.1)
Free Cash Flow is defined as cash flow (used)/provided by operating actvities less capital
expenditures.
$ millions |