Attached files
| file | filename |
|---|---|
| EX-32.2 - EXHIBIT 32.2 - NEWELL BRANDS INC. | nwl-ex322x123116.htm |
| EX-32.1 - EXHIBIT 32.1 - NEWELL BRANDS INC. | nwl-ex321x123116.htm |
| EX-31.2 - EXHIBIT 31.2 - NEWELL BRANDS INC. | nwl-ex312x123116.htm |
| EX-31.1 - EXHIBIT 31.1 - NEWELL BRANDS INC. | nwl-ex311x123116.htm |
| EX-23.2 - EXHIBIT 23.2 - NEWELL BRANDS INC. | nwl-ex232x123116.htm |
| EX-23.1 - EXHIBIT 23.1 - NEWELL BRANDS INC. | nwl-ex231x123116.htm |
| EX-21.1 - EXHIBIT 21.1 - NEWELL BRANDS INC. | nwl-ex211x123116.htm |
| EX-12 - EXHIBIT 12 - NEWELL BRANDS INC. | nwl-ex12x123116.htm |
| EX-10.49 - EXHIBIT 10.49 - NEWELL BRANDS INC. | nwl-ex1049x123116.htm |
| EX-10.38 - EXHIBIT 10.38 - NEWELL BRANDS INC. | nwl-ex1038x123116.htm |
| EX-10.15 - EXHIBIT 10.15 - NEWELL BRANDS INC. | nwl-ex1015x123116.htm |
| EX-4.20 - EXHIBIT 4.20 - NEWELL BRANDS INC. | nwl-ex420x123116.htm |
| EX-4.19 - EXHIBIT 4.19 - NEWELL BRANDS INC. | nwl-ex419x123116.htm |
UNITED STATES
SECURITIES AND EXCHANGE COMMISSION
Washington, D.C. 20549
FORM 10-K
ANNUAL REPORT PURSUANT TO
SECTION 13 OR 15(d) OF THE
SECURITIES EXCHANGE ACT OF 1934
FOR THE FISCAL YEAR ENDED DECEMBER 31, 2016 | COMMISSION FILE NUMBER 1-9608 | |
NEWELL BRANDS INC.
(EXACT NAME OF REGISTRANT AS SPECIFIED IN ITS CHARTER)
DELAWARE | 36-3514169 | |
(State or other jurisdiction of | (I.R.S. Employer | |
incorporation or organization) | Identification No.) | |
221 River Street | 07030 | |
Hoboken, New Jersey | (Zip Code) | |
(Address of principal executive offices) | ||
Registrant’s telephone number, including area code: (201) 610-6600
Securities registered pursuant to Section 12(b) of the Act:
TITLE OF EACH CLASS Common Stock, $1 par value per share | NAME OF EACH EXCHANGE ON WHICH REGISTERED New York Stock Exchange | ||
Securities registered pursuant to Section 12(g) of the Act: None
Indicate by check mark if the registrant is a well-known seasoned issuer, as defined in Rule 405 of the Securities Act. Yes þ No ¨
Indicate by check mark if the registrant is not required to file reports pursuant to Section 13 or 15(d) of the Act. Yes ¨ No þ
Indicate by check mark whether the Registrant (1) has filed all reports required to be filed by Section 13 or 15(d) of the Securities Exchange Act of 1934 during the preceding 12 months (or for such shorter period that the Registrant was required to file such reports), and (2) has been subject to such filing requirements for the past 90 days. Yes þ No ¨
Indicate by check mark whether the registrant has submitted electronically and posted on its corporate Web site, if any, every Interactive Data File required to be submitted and posted pursuant to Rule 405 of Regulation S-T (§ 232.405 of this chapter) during the preceding 12 months (or for such shorter period that the registrant was required to submit and post such files). Yes þ No ¨
Indicate by check mark if disclosure of delinquent filers pursuant to Item 405 of Regulation S-K (§ 229.405 of this chapter) is not contained herein, and will not be contained, to the best of Registrant’s knowledge, in definitive proxy or information statements incorporated by reference in Part III of this Form 10-K or any amendment to this Form 10-K. ¨
Indicate by check mark whether the registrant is a large accelerated filer, an accelerated filer, a non-accelerated filer, or a smaller reporting company. See the definitions of “large accelerated filer,” “accelerated filer” and “smaller reporting company” in Rule 12b-2 of the Exchange Act. (Check one):
Large Accelerated Filer þ | Accelerated Filer o | |
Non-Accelerated Filer o | Smaller Reporting Company o | |
(Do not check if a smaller reporting company) | ||
Indicate by check mark whether the registrant is a shell company (as defined in Rule 12b-2 of the Act). Yes ¨ No þ
There were 482.4 million shares of the Registrant’s Common Stock outstanding (net of treasury shares) as of January 31, 2017. The aggregate market value of the shares of Common Stock (based upon the closing price on the New York Stock Exchange on June 30, 2016) beneficially owned by non-affiliates of the Registrant was approximately $23.1 billion. For purposes of the foregoing calculation only, which is required by Form 10-K, the Registrant has included in the shares owned by affiliates those shares owned by directors and officers of the Registrant, and such inclusion shall not be construed as an admission that any such person is an affiliate for any purpose.
* * *
DOCUMENTS INCORPORATED BY REFERENCE
Portions of the Registrant’s Definitive Proxy Statement for its Annual Meeting of Stockholders are incorporated by reference into Part III of this Annual Report on Form 10-K.
TABLE OF CONTENTS
Statement of Computation of Earnings to Fixed Charges | ||
Significant Subsidiaries | ||
Consent of Independent Registered Public Accounting Firm | ||
302 Certification of Chief Executive Officer | ||
302 Certification of Chief Financial Officer | ||
906 Certification of Chief Executive Officer | ||
906 Certification of Chief Financial Officer | ||
2
PART I
ITEM 1. BUSINESS
“Newell Brands” or the “Company” refers to Newell Brands Inc. (formerly, Newell Rubbermaid Inc.) alone or with its wholly owned subsidiaries, as the context requires. When this report uses the words “we,” “us” or “our,” it refers to the Company and its subsidiaries unless the context otherwise requires. The Company was founded in Ogdensburg, NY in 1903 and is incorporated in Delaware. The Company’s principal executive office is located at 221 River Street, Hoboken, New Jersey 07030, and the Company’s telephone number is 201-610-6600.
Website Access to Securities and Exchange Commission Reports
The Company makes available free of charge on or through its website its annual reports on Form 10-K, quarterly reports on Form 10-Q, current reports on Form 8-K, and amendments to those reports filed or furnished pursuant to Section 13(a) or 15(d) of the Securities Exchange Act of 1934 as soon as practicable after the Company files them with, or furnishes them to, the Securities and Exchange Commission. The Company’s Internet website can be found at www.newellbrands.com. The information on the Company’s website is not incorporated by reference into this annual report on Form 10-K.
GENERAL
Newell Brands is a global marketer of consumer and commercial products that help people make life better every day, where they live, learn, work and play. Our products are marketed under a strong portfolio of leading brands, including Paper Mate®, Sharpie®, Dymo®, Expo®, Parker®, Elmer’s®, Coleman®, Jostens®, Marmot®, Rawlings®, Irwin®, Lenox®, Oster®, Sunbeam®, FoodSaver®, Mr. Coffee®, Rubbermaid Commercial Products®, Graco®, Baby Jogger®, NUK®, Calphalon®, Rubbermaid®, Contigo®, First Alert®, Waddington and Yankee Candle®. The Company sells its products in nearly 200 countries around the world and has operations on the ground in nearly 100 of these countries.
This past year was one of the most transformational in its history as the Company more than doubled its size and extended its successful operating model across a broader set of categories acquired through the combination with Jarden Corporation. On April 15, 2016, Jarden Corporation (“Jarden”) became a direct wholly-owned subsidiary of Newell Brands Inc. Jarden is a global consumer products company with brands such as Yankee Candle®, Crock-Pot®, FoodSaver®, Mr. Coffee®, Oster®, Coleman®, First Alert®, Rawlings®, Jostens®, K2®, Marker®, Marmot®, Völkl® and many others. Following the Jarden Acquisition, the Company was renamed Newell Brands Inc.
This transformative transaction created a global consumer goods company with estimated annualized sales for 2016 of $16 billion and a portfolio of leading brands in large, growing, unconsolidated, global markets. The scaled enterprise is expected to accelerate profitable growth over time with leading brands in a global market that exceeds $100 billion, with business and capability development supported by the efficiencies of the combined company. Management believes the scale of Newell Brands in key categories, channels and geographies creates a much broader opportunity to deploy the Company’s advantaged set of brand development and commercial capabilities for accelerated growth and margin expansion. The Company’s intent is to design a benchmarked, efficient set of structures that support long-term business development.
The Company anticipates significant annualized cost synergies will be realized by Newell Brands, driven by efficiencies of scale and efficiencies in procurement, cost to serve and infrastructure. The Company anticipates incremental annualized cost synergies of at least $500 million over four years, driven by efficiencies of scale and new efficiencies in procurement, cost to serve and infrastructure that the combination unlocks. The Company currently expects to incur approximately $500 million of restructuring and integration-related costs over the same period to generate and unlock the more than $500 million of annualized cost synergies.
After the completion of the Jarden Acquisition, the Company initiated a comprehensive strategic assessment of the business and in the third quarter of 2016 launched a new corporate strategy that focuses the portfolio, prioritizes investment in the categories with the greatest potential for growth, and extends the Company’s advantaged capabilities in insights, product design, innovation, and e-commerce to the broadened portfolio. The investments in new capabilities are designed to unlock the growth potential of the portfolio and will be funded by a commitment to release cost savings of $800 million through the combination of the completion of Project Renewal and delivery of $500 million in cost synergies associated with the Jarden integration. This new corporate strategy is called the New Growth Game Plan and builds on the successful track record of growth acceleration, margin development, and value creation associated with the transformation of Newell Rubbermaid Inc. from 2011 through 2016.
3
The Company has maintained continuity of operations through 2016 by preserving both legacy organizations’ operating segments. The 2016 segment information includes results of operations of Jarden since the acquisition date and are included in the following segments: Branded Consumables, Consumer Solutions, Outdoor Solutions and Process Solutions. The key brands included in each segment are as follows:
• | Writing: Sharpie®, Paper Mate®, Expo®, Prismacolor®, Mr. Sketch®, Elmer’s®, X-Acto®, Parker®, Waterman® and Dymo® Office |
• | Home Solutions: Rubbermaid®, Contigo®, bubba®, Calphalon® and Goody® |
• | Tools: Irwin®, Lenox®, hilmorTM and Dymo® Industrial |
• | Commercial Products: Rubbermaid Commercial Products® |
• | Baby & Parenting: Graco®, Baby Jogger®, Aprica® and Teutonia® |
• | Branded Consumables: Yankee Candle®, Waddington, Ball®, Diamond®, First Alert®, NUK®, Quickie® and Pine Mountain® |
• | Consumer Solutions: Crock-Pot®, FoodSaver®, Holmes®, Mr. Coffee®, Oster®, Rainbow® and Sunbeam® |
• | Outdoor Solutions: Coleman®, Jostens®, Berkley®, Shakespeare®, Rawlings®, Völkl®, K2® and Marmot® |
• | Process Solutions: Jarden Plastic Solutions, Jarden Applied Materials and Jarden Zinc Products |
During 2016, the Company began the process of driving the New Growth Game Plan into action, announcing a series of portfolio changes. Based on the Company’s strategy to allocate resources to its businesses with the greater right to win in the marketplace, during 2016 the Company divested its Décor business, including Levolor® and Kirsch® window coverings and drapery hardware business, which was included in the Home Solutions segment. Both the divested Décor business and the 2015 divestiture of the Rubbermaid medical cart business, which was included in the Commercial Products segment, did not qualify as discontinued operations pursuant to U.S. Generally Accepted Accounting Principles (“U.S. GAAP”). As a result, the medical cart business was included in the Company’s consolidated results from continuing operations in the Commercial Products segment until it was sold in August 2015, and the Décor business was included in the Company’s consolidated results from continuing operations in the Home Solutions segment until it was sold in June 2016.
During 2016, the Company committed to plans to divest several other businesses and brands to strengthen the portfolio to better align and focus the portfolio for growth and margin development. The affected businesses and brands are as follows: the Tools business, including the Irwin®, Lenox®, and hilmorTM brands in the Tools segment; the Winter Sports business, including the Völkl® and K2® brands and the Zoot® and Squadra® brands in the Outdoor Solutions segment; the heaters, fans, and humidifiers business with related brands in the Consumer Solutions segment; the Rubbermaid® consumer storage totes business in the Home Solutions segment; the Lehigh business, primarily ropes, cordage and chains under the Lehigh® brand and the firebuilding business, including the Pine Mountain® brand in the Branded Consumables segment; and the stroller business under the Teutonia® brand in the Baby and Parenting segment. These divestitures do not qualify as discontinued operations pursuant to U.S. GAAP, and as a result, are and will continue to be included in the Company’s consolidated results from continuing operating in each of the respective segments until the businesses are sold.
In the Company’s 2015 results, the Endicia on-line postage business and the Culinary electrics and retail businesses were classified as discontinued operations based on the Company’s commitment in 2014 to sell these businesses. Endicia was included in the Writing segment and the Culinary businesses were included in the Home Solutions segment. The Company completed the sale of Endicia in November 2015 and ceased operations in its Culinary electrics and retail businesses in the first quarter of 2015.
JARDEN ACQUISITION
On April 15, 2016, Jarden Corporation (“Jarden”) became a direct wholly-owned subsidiary of Newell Brands, as a result of a series of merger transactions (the “Jarden Acquisition”). The Jarden Acquisition was effected pursuant to an Agreement and Plan of Merger, dated as of December 13, 2015 (the “Merger Agreement”) between the Company, Jarden and two wholly-owned subsidiaries of the Company. Following the Jarden Acquisition, the Company was renamed Newell Brands Inc. See Footnote 10 of the Notes to Condensed Consolidated Financial Statements for further information. The Company is committed to maintaining its investment grade credit rating by using strong cash flow from the combined enterprise to prioritize debt reduction in the short term, while simultaneously investing in the Company’s growth platforms and maintaining its dividend per share.
STRATEGIC INITIATIVES
Newell Brands is committed to building leading brands through understanding the needs of consumers and using those insights to create innovative, highly differentiated product solutions that offer superior performance and value. As a result of the Jarden Acquisition, the Company’s advertising and promotion investments in support of its brands increased by $217.1 million compared to 2015, and the Company intends to continue to leverage its portfolio of leading brands to create a margin structure that allows for further increases in brand investment.
4
During 2016, the Company launched the New Growth Game Plan, which is its strategy to simplify the organization and free up resources to invest in growth initiatives and strengthened capabilities in support of the Company’s brands. The changes being implemented in the execution of the New Growth Game Plan are considered key enablers to building a bigger, faster-growing, more global and more profitable company.
The New Growth Game Plan encompasses the following strategic elements:
The Newell Brands Vision
The Newell Brands vision for the company is grounded in three core characteristics of the business: its geographic reach with sales in nearly 200 countries and territories, its presence in a broad set of large growing household product categories, and its portfolio of leading brands that make a difference in the lives of consumers every day. The Company asserts that through the broad geographic reach of its business system, through its category presence and leading brands that touch consumers at home, in school, at work, and where they play, that Newell Brands can have a big impact on consumers’ lives. The Company’s vision is that Newell Brands makes life better for hundreds of millions of consumers every day, where they live, learn, work, and play.
The Newell Brands DNA and Ambition
The Newell Brands DNA represents an aspirational set of behaviors that define the culture the company aspires to create. The Newell Brands DNA and Ambition serve as a call to action for the Company’s employees, challenging them to grow, transform, lead, and win. The Company captures our ambition with our employees as follows:
We believe growth and scale benefits drive value creation and we achieve our potential by putting the consumer first in everything that we do. Our portfolio is a powerful collection of leading brands in large, growing, unconsolidated global categories. Over time we are choice-fully building a more international business that reaches the consumer wherever they want to buy our brands. Our strategy is designed to achieve meaningful relative market share advantage in our core categories. We will win by combining Brand Development (insights, product design, innovation, brand communication) with Every Day Great Execution, partnering with our customers to build our categories and maximize reach, availability, and visibility. We are a transformative company in the stretching ambitions we pursue. The clarity of our strategy and the decisive way that we put our choices into action is a distinctive characteristic of our leaders. Money flows to growth and we are true to our entrepreneurial roots by focusing on impact in the market place. This process creates growth missions for our empowered teams. We build our people as we build new business. We expect our people and our ideas to be judged as leaders in our business community. Our brands are better together. We win by acting as one operating company that has the scale and capabilities to outgrow, out execute, and out spend our competition. Our strong financial foundation of cash generation creates a platform for scaling this model through strategic M&A in our core categories.
The Newell Brands Portfolio Roles
Newell Brands allocates resources to the business with the greater growth and market share consolidation potential. There are three portfolio roles that shape performance objectives and resource allocation: Win Bigger, Develop for Growth, and Grow Entrepreneurially.
Win Bigger businesses have innovations and brands that are ready now for investment. Develop for Growth businesses are businesses where investments in insights, design, and innovation can set the stage for future growth acceleration. Both Win Bigger and Develop for Growth businesses are resourced with Brand Development leaders and Commercial Delivery leaders. Grow Entrepreneurially businesses are leaner organizations that leverage the scale of the larger corporation for back office support, but operate as more independent focused organizations.
The Newell Brands Operating Model
As part of the New Growth Game Plan, in late 2016 the Company began to transform from a holding company to an operating company, consolidating its business units into global divisions while investing to extend its design, innovation and brand development capabilities across a broader set of categories. These organization changes were initiated in the third quarter and this major phase of the transformation was completed by year end. These new global divisions will become the key commercial nodes in the Company, including a new Global eCommerce Division, which will have responsibility for all ecommerce activity across the enterprise.The divisions will generally align to the four areas of strategic focus for the Company of Live, Learn, Work, and Play. The new structure will be effective January 1, 2017.
5
In 2016, the original business units were run in nine operating segments. The Company’s nine business segments and the key brands included in each of the segments are as follows:
Segment | Key Brands | Description of Primary Products | ||
Writing | Sharpie®, Paper Mate®, Expo®, Prismacolor®, Mr. Sketch®, Elmer's®, X-Acto®, Parker®, Waterman®, Dymo® Office | Writing instruments, including markers and highlighters, pens and pencils; art products; activity-based adhesive and cutting products; fine writing instruments; labeling solutions | ||
Home Solutions | Rubbermaid®, Contigo®, bubba®, Calphalon®, Goody® | Indoor/outdoor organization, food storage and home storage products; durable beverage containers; gourmet cookware, bakeware and cutlery; hair care accessories | ||
Tools | Irwin®, Lenox®, hilmor™, Dymo® Industrial | Hand tools and power tool accessories; industrial bandsaw blades; tools for HVAC systems; label makers and printers for industrial use | ||
Commercial Products | Rubbermaid Commercial Products® | Cleaning and refuse products; hygiene systems; material handling solutions | ||
Baby & Parenting | Graco®, Baby Jogger®, Aprica®, Teutonia® | Infant and juvenile products such as car seats, strollers, highchairs and playards | ||
Branded Consumables | Yankee Candle®, Waddington, Ball®, Diamond®, First Alert®, NUK®, Quickie®, Pine Mountain® | Branded consumer products; consumable and fundamental household staples | ||
Consumer Solutions | Crock-Pot®, FoodSaver®, Holmes®, Mr. Coffee®, Oster®, Rainbow®, Sunbeam® | Household products, including kitchen appliances and home environment products | ||
Outdoor Solutions | Coleman®, Jostens®, Berkley®, Shakespeare®, Rawlings®, Völkl®, K2®, Marmot® | Products for outdoor and outdoor-related activities | ||
Process Solutions | Jarden Plastic Solutions, Jarden Applied Materials, Jarden Zinc Products | Plastic products including container closures, contact lens packaging, medical disposables, plastic cutlery and rigid packaging | ||
Writing
The Company’s Writing segment is comprised of the Writing & Creative Expression business which has market share growth potential by further building strong brands like Sharpie®, Paper Mate®, and Expo® and deploying the portfolio into new geographies, the Elmer’s®, Labeling and Fine Writing businesses that focus investment on innovation and brand support in existing markets. The Writing segment designs, manufactures or sources and distributes writing instruments, adhesives, cutting products and labeling solutions, primarily for use in business and the home. The Segment’s largest writing instrument factory is based in the U.S.A (Tennessee - 2). The segment’s product offerings include markers, highlighters, activity-based adhesives, cutting products and everyday and fine writing instruments and accessories. Permanent/waterbase markers, dry erase markers, highlighters and art supplies are primarily sold under the Sharpie®, Expo®, Sharpie® Accent®, Prismacolor® and Mr. Sketch® trademarks. Ballpoint pens and inks, roller ball pens, mechanical pencils and correction supplies are primarily sold under the Paper Mate®, InkJoy®, Uni-Ball® (used under exclusive license from Mitsubishi Pencil Co. Ltd. and its subsidiaries in North America and certain areas in Latin America), Sharpie®, Mongol® and Liquid Paper® trademarks. Activity-based adhesives and cutting products are primarily sold under the Elmer’s®, Krazy Glue® (a trademark of Toagosei Co. Ltd. used with permission) and X-Acto® trademarks. Fine writing instruments are primarily sold under the Parker®, Waterman® and Rotring® trademarks. The Writing segment’s on-demand labeling solutions are primarily sold under the Dymo® Office trademark.
The Writing segment generally markets its products directly to mass merchants, warehouse clubs, grocery/drug stores, office superstores, office supply stores, contract stationers, travel retail, on-line and other retailers.
Home Solutions
The Company’s Food & Beverage business within the Home Solutions segment is a business with significant growth and geographic expansion opportunities, while the consumer storage and organization, cookware, and hair care accessories businesses within the Home Solutions segment concentrates innovation and investment in the brands in existing markets. The Home Solutions segment
6
designs, manufactures or sources and distributes a wide range of consumer products under multiple brand names. The Segment’s largest food storage and cookware factories are based in the U.S.A. (Ohio - 2, Kansas). Indoor/outdoor organization and home storage products are primarily sold under the Rubbermaid® and Roughneck® trademarks. Food storage and on-the-go hydration and thermal bottles are primarily sold under the Rubbermaid®, TakeAlongs®, Contigo®, Avex® and bubba® trademarks. Aluminum and stainless steel cookware and bakeware are sold under the Calphalon® trademark. Hair care accessories and grooming products are marketed primarily under the Goody® trademark.
The Home Solutions segment primarily markets its products directly to mass merchants and specialty, grocery/drug and department stores.
Tools
The Tools segment designs, manufactures or sources and distributes hand tools and power tool accessories, industrial bandsaw blades, tools and industrial labeling solutions. The Segment has two key factories that are based in the U.S.A. (Maine, Massachusetts). Hand tools and power tool accessories are primarily sold under the Irwin® trademark, while industrial bandsaw blades and cutting and drilling accessories are sold under the Lenox® trademark. Heating, ventilation and air conditioning (HVAC) tools are sold under the hilmorTM trademark, and industrial label makers are sold under the Dymo® trademark.
The Tools segment primarily markets its products through distributors and directly to mass merchants, home centers, industrial/construction outlets and other professional customers. During the fourth quarter of 2016, the Company entered into an agreement to sell the Tools business for an estimated price of $1.95 billion, subject to working capital adjustments. The transaction is expected to close in early 2017, subject to certain customary conditions, including regulatory approvals.
Commercial Products
The Company’s Commercial Products segment is a business with higher growth opportunities within the framework of the New Growth Game Plan. The Commercial Products segment designs, manufactures or sources and distributes cleaning and refuse products, hygiene systems and material handling solutions. The Segment’s largest commercial products factory is based in the U.S.A. (Virginia). Rubbermaid Commercial Products® primarily sells its products under the Rubbermaid® and Brute® trademarks.
The Commercial Products segment primarily markets its products through distributors and directly to mass merchants, home centers, commercial products distributors, select contract customers and other professional customers.
Baby & Parenting
The Company’s Baby & Parenting segment focuses on optimizing the business and market share in existing markets and geographies within the framework of the New Growth Game Plan. The Baby & Parenting segment designs and distributes infant and juvenile products such as car seats, strollers, swings, highchairs and playards, and primarily sells its products under the Graco®, Baby Jogger®, City Mini®, City Select®, Aprica® and Teutonia® trademarks. The Baby & Parenting segment sources substantially all of its products.
The Baby & Parenting segment primarily markets its products directly to mass merchants, department stores, distributors and on-line retailers.
Branded Consumables
The Company’s Branded Consumables segment is a legacy Jarden segment that manufactures or sources, markets and distributes a broad line of branded consumer products, many of which are affordable, consumable and fundamental household staples, and primarily sells its products under the Yankee Candle®, Waddington, Ball®, Diamond®, First Alert®, NUK®, Quickie®, Pine Mountain® trademarks. The Segment’s largest candle, playing card, baby nurturing, and plastic cutlery and serve-ware factories are based in the U.S.A. (Massachusetts - 2, Wisconsin, Kentucky). The Company believes the home fragrance business with this segment offers higher growth and geographic expansion opportunities in the New Growth Game Plan, as demonstrated in the January 2017 acquisition of Smith Mountain Industries, a leading provider of premium home fragrance products, primarily under the WoodWick® Candle brand.
The Branded Consumables segment primarily markets its products directly to club, department store, drug/grocery, mass merchant, specialty retailers, casinos and distributors as well as company-operated retail stores and direct to consumer web-based sales for Yankee Candle.
7
Consumer Solutions
Consumer Solutions is a legacy Jarden segment that manufactures or sources, markets and distributes a diverse line of household products, including kitchen appliances and home environment products, and primarily sells its products under the Crock-Pot®, FoodSaver®, Holmes®, Mr. Coffee®, Oster®, Rainbow®, and Sunbeam® trademarks. The Consumer Solutions segment also has rights to sell various small appliance products, in substantially all of Europe under the Breville® brand name. The Consumer Solutions segment also utilizes an extensive licensing strategy to extend the reach of the brands across categories, geographies and strategic product extensions. The Consumer Solutions segment focuses investment on innovation and brand support in existing markets within the New Growth Game Plan.
The Consumer Solutions segment primarily markets its products directly to club, department store, drug/grocery, mass merchant, specialty retailers and distributors.
Outdoor Solutions
Outdoor Solutions is a legacy Jarden segment that manufactures or sources, markets and distributes global consumer active lifestyle products for outdoor and outdoor-related activities, and primarily sells its products under the Coleman®, Jostens®, Berkley®, Shakespeare®, Rawlings®, Völkl®, K2®, Marmot® trademarks. The businesses within Outdoor Solutions segment, such as camping, fishing and technical apparel, invest and innovate in brands in existing markets within the New Growth Game Plan.
The Outdoor Solutions segment primarily markets its products directly to club, department store, drug/grocery, mass merchant, sporting goods and specialty retailers and distributors.
Process Solutions
Process Solutions is a legacy Jarden segment that manufactures, markets and distributes a wide variety of plastic products including closures, contact lens packaging, medical disposables, plastic cutlery and rigid packaging. The materials business produces specialty nylon polymers, conductive fibers and monofilament used in various products. We also manufacture a line of industrial zinc products marketed globally for use in the architectural, automotive, construction, electrical component and plumbing markets. The Segment’s largest factory is based in the U.S.A. (South Carolina).
The Process Solutions segment primarily markets its products through distributors and directly to mass merchants, home centers, commercial products distributors, select contract customers and other professional customers. The zinc products business within the Process Solution segment is the sole source supplier of copper-plated zinc penny blanks to the United States Mint and a major supplier to the Royal Canadian Mint, as well as a supplier of brass, bronze and nickel-plated finishes on steel and zinc for coinage to other international markets.
OTHER INFORMATION
Multi-Product Offering
The Company’s broad product offering in multiple categories permits it to more effectively meet the needs of its customers. With families of leading brand names and profitable and innovative new products, the Company can assist volume purchasers in selling a more profitable product mix. As a potential single source for an entire product line, the Company can use program merchandising to improve product presentation, optimize display space for both sales and income, and encourage impulse buying by retail consumers.
Foreign Operations
Information regarding the Company’s 2016, 2015 and 2014 foreign operations and financial information by geographic area is included in Footnote 18 of the Notes to Consolidated Financial Statements and is incorporated by reference herein. Information regarding risks relating to the Company’s foreign operations is set forth in Part I, Item 1A, of this report and is incorporated by reference herein.
Please refer to Management’s Discussion and Analysis of Financial Condition and Results of Operations and Footnote 1 of the Notes to Consolidated Financial Statements for further information regarding the Company’s Venezuelan operations.
Raw Materials and Sourced Finished Goods
The Company has multiple foreign and domestic sources of supply for substantially all of its material requirements. The raw materials and various purchased components required for its products have generally been available in sufficient quantities. The Company’s product offerings require the purchase of resin, corrugate, glass, plastic, expanded polystyrene, extinguisher powder,
8
nylon, paper, plastic resin, sawdust, tin plate, wax and wood, natural rubber, electrical components, glass fiber, magnesium, adhesives, various paper-related packaging materials and metals, including steel, stainless steel, aluminum copper and gold.
The Company’s resin purchases principally comprise polyethylene, polypropylene and copolyester. Over the long-term, the Company has experienced inflation in raw material prices, labor and sourced products, and in 2016, inflation in labor and sourced products offset deflation in raw material prices. In 2017, the Company expects continued labor and sourced product inflation and moderate inflation in raw material prices. On an annualized basis, resin and metals consumed as raw materials generally represent 8% to 15% of annual cost of products sold, with neither resin nor metals purchased as raw materials individually representing more than 10% of cost of products sold.
The Company also relies on third-party manufacturers as a source for finished goods. Historically, the Company has experienced inflation in sourced product costs due to currency fluctuations and increased input and labor costs. For a limited number of product lines, a single manufacturer or a limited number of manufacturers may supply substantially all of the finished goods for a product line. In particular, certain businesses within the Baby & Parenting and Home Solutions segments rely on third-party manufacturers for substantially all of their products. Specifically, the Company’s Baby & Parenting segment has a single source of supply for products that comprise a majority of Baby & Parenting’s sales and which owns the intellectual property for many of those products.
See Management’s Discussion and Analysis of Financial Condition and Results of Operations for further discussion.
Backlog
The dollar value of unshipped factory orders is not material.
Seasonal Variations
Sales of the Company’s products tend to be seasonal, with sales, operating income and operating cash flow in the first quarter generally lower than any other quarter during the year, driven principally by reduced volume and the mix of products sold in the first quarter. The seasonality of the Company’s sales volume combined with the accounting for fixed costs, such as depreciation, amortization, rent, personnel costs and interest expense, impacts the Company’s results on a quarterly basis. In addition, the Company tends to generate the majority of its operating cash flow in the second, third and fourth quarters of the year due to seasonal variations in operating results, the timing of annual performance-based compensation payments, customer program payments, working capital requirements and credit terms provided to customers.
Patents and Trademarks
The Company has many patents, trademarks, brand names and trade names that are, in the aggregate, important to its business. The Company’s most significant registered trademarks are Sharpie®, Paper Mate®, Elmer’s®, Parker®, Waterman®, Dymo®, Rubbermaid®, Contigo®, Goody®, Calphalon®, Irwin®, Lenox®, Graco®, Baby Jogger®, Aprica®, Bionaire®, Coleman®, Crock-Pot®, First Alert®, FoodSaver®, Health o Meter®, Holmes®, K2®, Marmot®, Mr. Coffee®, Oster®, Pine Mountain®, Quickie®, Rawlings®, Ride®, Rival®, Shakespeare®, Starterlogg®, Stearns®, Sunbeam® and Völkl®.
Customers/Competition
The Company’s principal customers are large mass merchandisers, such as discount stores, home centers, warehouse clubs, office superstores, craft stores, direct-to-consumer channels, specialty retailers and wholesalers, commercial distributors, e-commerce companies and Yankee Candle retail stores. Additionally we distribute our Jostens and Waddington products through the academic and achievement channel and foodservice channel, respectively. The dominant share of the market represented by large mass merchandisers, together with consumer shopping patterns, contributes to a market environment in which dominant multi-category retailers and e-commerce companies have strong negotiating power with suppliers. This environment may limit the Company’s ability to recover cost increases through selling prices.
Current trends among retailers and e-commerce companies include fostering high levels of competition among suppliers, demanding innovative new products and products tailored to each of their unique requirements and requiring suppliers to maintain or reduce product prices and deliver products with shorter lead times. Other trends, in the absence of a strong new product development effort or strong end-user brands, are for retailers and e-commerce companies to import generic products directly from foreign sources and to source and sell products, under their own private label brands, which compete with the Company’s products. The combination of these market influences has created an intensely competitive environment in which the Company’s principal customers continuously evaluate which product suppliers to use, resulting in downward pricing pressures and the need for big, consumer-meaningful brands, the ongoing introduction and commercialization of innovative new products, continuing improvements in category management and customer service, and the maintenance of strong relationships with large, high-volume purchasers. The Company competes with numerous manufacturers and distributors of consumer products, many of which are large and well-established. Our Yankee Candle retail stores compete primarily with specialty candle and personal care retailers and a
9
variety of other retailers, including department stores, gift stores and national specialty retailers that carry candles along with personal care items, giftware and housewares.
The Company’s principal methods of meeting its competitive challenges are creating and maintaining leading brands and differentiated products that deliver superior value and performance; delivering superior customer service and consistent on-time delivery; producing and procuring products at a competitive cost; and experienced management. In addition, the Company focuses on building consumer loyalty and increased consumer demand through increased investment in consumer insights and using those insights to develop innovative products and product features that meet consumers’ needs.
The Company has also positioned itself to respond to the competitive challenges in the retail environment by developing strong relationships with large, high-volume purchasers. The Company markets its strong multi-product offering through virtually every category of high-volume retailers, including discount, drug/grocery and variety chains; warehouse clubs; department, hardware and specialty stores; home centers; office superstores; contract stationers; and e-commerce companies. The Company’s largest customer, Wal-Mart (which includes Sam’s Club), accounted for approximately 13.5%, 10.9% and 10.6% of net sales in 2016, 2015 and 2014, respectively, across substantially all segments. The Company’s top-ten customers in 2016 included (in alphabetical order): amazon, Bed, Bath & Beyond, Costco, Lowe’s, Office Depot, Staples, Target, The Home Depot, Toys ‘R’ Us and Wal-Mart.
Environmental Matters
Information regarding the Company’s environmental matters is included in the Management’s Discussion and Analysis of Financial Condition and Results of Operations section of this report and in Footnote 19 of the Notes to Consolidated Financial Statements and is incorporated by reference herein.
Research and Development
The Company’s research and development efforts focus on developing new, differentiated and innovative products to meet consumers’ needs. The Company’s product development efforts begin with consumer insights and the Company has consolidated its consumer marketing and insight capabilities into a global center of excellence and is investing further to strengthen these capabilities. The Company continues to invest to strengthen its product design and research and development capabilities and has consolidated its design and innovation capabilities into a center of excellence. The Company’s enhanced marketing and insight and research and development capabilities have been leveraged to implement a new ideation process throughout the business, resulting in idea fragments that feed the development of product concepts.
Information regarding the Company’s research and development costs for each of the past three years is included in Footnote 1 of the Notes to Consolidated Financial Statements and is incorporated by reference herein.
Employees
As of December 31, 2016, the Company had approximately 53,400 employees worldwide. Approximately 4,500 of the Company’s employees are covered by collective bargaining agreements or are located in countries that have collective arrangements decreed by statute. Management believes that our relationships with our employees and collective bargaining unions are satisfactory.
ITEM 1A. RISK FACTORS
The ownership of the Company’s common stock involves a number of risks and uncertainties. Potential investors should carefully consider the risks and uncertainties described below and the other information in this Annual Report on Form 10-K before deciding whether to invest in the Company’s securities. The Company’s business, financial condition or results of operations could be materially adversely affected by any of these risks. The risks described below are not the only ones facing the Company. Additional risks that are currently unknown to the Company or that the Company currently considers to be immaterial may also impair its business or adversely affect its financial condition or results of operations.
The Company is subject to risks related to its dependence on the strength of retail, commercial and industrial sectors of the economy in various parts of the world.
The Company’s business depends on the strength of the retail, commercial and industrial sectors of the economy in various parts of the world, primarily in North America, and to a lesser extent Europe, Latin America and Asia. These sectors of the economy are affected primarily by factors such as consumer demand and the condition of the retail industry, which, in turn, are affected by general economic conditions. With continuing challenging global economic conditions, particularly outside of the U.S., there has been considerable pressure on consumer demand, and the resulting impact on consumer spending has had and may continue to have an adverse effect on demand for the Company’s products, as well as its financial condition and results of operations. The Company could also be negatively impacted by economic crises in specific countries or regions. Such events could negatively
10
impact the Company’s overall liquidity and/or create significant credit risks relative to its local customers and depository institutions. Consumer demand and the condition of these sectors of the economy may also be impacted by other external factors such as war, terrorism, geopolitical uncertainties, public health issues, natural disasters and other business interruptions. The impact of these external factors is difficult to predict, and one or more of these factors could adversely impact the Company’s business.
The Company is subject to intense competition in a marketplace dominated by large retailers and e-commerce companies.
The Company competes with numerous other manufacturers and distributors of consumer and commercial products, many of which are large and well-established. The Company’s principal customers are large mass merchandisers, such as discount stores, home centers, warehouse clubs, office superstores, commercial distributors and e-commerce companies. The dominant share of the market represented by these large mass merchandisers, together with changes in consumer shopping patterns, has contributed to the formation of dominant multi-category retailers and e-commerce companies that have strong negotiating power with suppliers. Current trends among retailers and e-commerce companies include fostering high levels of competition among suppliers, demanding innovative new products and products tailored to each of their unique requirements, requiring suppliers to maintain or reduce product prices in response to competitive, economic or other factors, and requiring product delivery with shorter lead times. Other trends are for retailers and e-commerce companies to import products directly from foreign sources and to source and sell products under their own private label brands, typically at lower prices, that compete with the Company’s products.
The combination of these market influences and retailer consolidation has created an intensely competitive environment in which the Company’s principal customers continuously evaluate which product suppliers to use, resulting in downward pricing pressures and the need for big, consumer-meaningful brands, the ongoing introduction and commercialization of innovative new products, continuing improvements in category management and customer service, and the maintenance of strong relationships with large, high-volume purchasers. The Company also faces the risk of changes in the strategy or structure of its major customers, such as overall store and inventory reductions. The intense competition in the retail and e-commerce sectors, combined with the overall economic environment, may result in a number of customers experiencing financial difficulty, or failing in the future. In particular, a loss of, or a failure by, one of the Company’s large customers could adversely impact the Company’s sales and operating cash flows. To address these challenges, the Company must be able to respond to competitive factors, and the failure to respond effectively could result in a loss of sales, reduced profitability and a limited ability to recover cost increases through price increases.
The Company’s sales are dependent on purchases from several large customers and any significant decline in these purchases or pressure from these customers to reduce prices could have a negative effect on the Company’s future financial performance.
The Company’s customer base is relatively fragmented. Although we have long-established relationships with many customers, the Company generally does not have any long-term supply or binding contracts or guarantees of minimum purchases with its largest customers. Purchases by these customers are generally made using individual purchase orders. As a result, these customers may cancel their orders, change purchase quantities from forecast volumes, delay purchases for a number of reasons beyond the Company’s control or change other terms of the business relationship. Significant or numerous cancellations, reductions, delays in purchases or changes in business practices or by customers could have a material adverse effect on the Company’s business, results of operations and financial condition. In addition, because many of the Company’s costs are fixed, a reduction in customer demand could have an adverse effect on the Company’s gross profit margins and operating income.
The Company depends on a continuous flow of new orders from large, high-volume retail customers; however, the Company may be unable to continually meet the needs of these customers. Retailers are increasing their demands on suppliers to:
• | reduce lead times for product delivery, which may require the Company to increase inventories and could impact the timing of reported sales; |
• | improve customer service, such as with direct import programs, whereby product is supplied directly to retailers from third-party suppliers; and |
• | adopt new technologies related to inventory management such as Radio Frequency Identification, otherwise known as RFID technology, which may have substantial implementation costs. |
The Company cannot provide any assurance that it can continue to successfully meet the needs of its customers. A substantial decrease in sales to any of its major customers could have a material adverse effect on the Company’s business, results of operations and financial condition.
The Company’s customers may further consolidate, which could materially adversely affect its sales and margins.
The Company’s customers have steadily consolidated over the last two decades. The Company expects any customers that consolidate will take actions to harmonize pricing from their suppliers, close retail outlets and rationalize their supply chain, which could adversely affect the Company’s business and results of operations. There can be no assurance that, following consolidation,
11
the Company’s large customers will continue to buy from the Company across different product categories or geographic regions, or at the same levels as prior to consolidation, which could negatively impact the Company’s financial results. Further, if the consolidation trend continues, it could result in future pricing and other competitive pressures that could reduce the Company’s sales and margins and have a material adverse effect on the Company’s business, results of operations and financial condition.
The Company’s plans to continue to improve productivity and reduce complexity and costs may not be successful, which would materially adversely affect its ability to compete.
The Company’s success depends on its ability to continuously improve its manufacturing operations to gain efficiencies, reduce supply chain costs and streamline or redeploy nonstrategic selling, general and administrative expenses in order to produce products at a best-cost position and allow the Company to invest in innovation and brand building, including advertising and promotion. The Company is currently in the process of implementing Project Renewal and delivering the cost synergies related to the acquisition of Jarden. Both efforts are global initiatives designed to reduce the complexity of the organization and increase investment in the Company’s most significant growth platforms. Project Renewal and the Company’s cost saving plans associated with the Jarden integration may not be completed substantially as planned, may be more costly to implement than expected, or may not result in, in full or in part, the positive effects anticipated. In addition, such initiatives require the Company to implement a significant amount of organizational change, which could have a negative impact on employee engagement, divert management’s attention from other concerns, and if not properly managed, impact the Company’s ability to retain key employees, cause disruptions in the Company’s day-to-day operations and have a negative impact on the Company’s financial results. It is also possible that other major productivity and streamlining programs may be required in the future.
If the Company is unable to commercialize a continuing stream of new products that create demand, the Company’s ability to compete in the marketplace may be adversely impacted.
The Company’s strategy includes investment in new product development and a focus on innovation. Its long-term success in the competitive retail environment and the industrial and commercial markets depends on its ability to develop and commercialize a continuing stream of innovative new products and line extensions that create demand. New product development and commercialization efforts, including efforts to enter markets or product categories in which the Company has limited or no prior experience, have inherent risks. These risks include the costs involved, such as development and commercialization, product development or launch delays, and the failure of new products and line extensions to achieve anticipated levels of market acceptance or growth in sales or operating income. The Company also faces the risk that its competitors will introduce innovative new products that compete with the Company’s products. In addition, sales generated by new products or line extensions could cause a decline in sales of the Company’s existing products. If new product development and commercialization efforts are not successful, the Company’s financial results could be adversely affected.
If the Company does not continue to develop and maintain leading brands or realize the anticipated benefits of increased advertising and promotion spend, its operating results may suffer.
The Company’s ability to compete successfully also depends increasingly on its ability to develop and maintain leading brands so that the Company’s retailer and other customers will need the Company’s products to meet consumer demand. Leading brands allow the Company to realize economies of scale in its operations. The development and maintenance of such brands require significant investment in brand-building and marketing initiatives. While the Company plans to continue to increase its expenditures for advertising and promotion and other brand-building and marketing initiatives over the long term, the initiatives may not deliver the anticipated results and the results of such initiatives may not cover the costs of the increased investment.
The Company incurred substantial additional indebtedness in connection with the Jarden Acquisition which could materially adversely affect the Company and its financial position, including decreasing its business flexibility and increasing its borrowing costs.
The Company incurred an additional $6.5 billion of debt (excluding approximately $4.1 billion of Jarden debt refinanced in connection with the acquisition) in connection with the completion of the Jarden Acquisition. Following completion of the Jarden Acquisition, the Company substantially increased its debt compared to its recent historical levels. This increased level of debt will increase the Company’s interest expense and could have the effect, among other things, of reducing the Company’s flexibility to respond to changing business and economic conditions. In addition, if the Company is unable to timely reduce its level of indebtedness, the Company will be subject to increased demands on its cash resources, which could increase its total debt-to-capitalization ratios, decrease its interest coverage ratios, result in a breach of covenants or otherwise adversely affect the business and financial results of the Company.
12
An increase in interest rates could have a material adverse effect on our business.
While the vast majority of the company’s debt is fixed, fluctuations in interest rates can increase borrowing costs on the portion that is variable and interest rate increases on this portion of the company’s debt could have a material adverse effect on our business. In response to the last global economic recession, extraordinary monetary policy actions of the U.S. Federal Reserve and other central banking institutions, including the utilization of quantitative easing, were taken to create and maintain a low interest rate environment. However, in December 2015, the U.S. Federal Reserve raised its benchmark interest rate by a quarter of a percentage point for the first time since 2006, and in December 2016, the U.S. Federal Reserve again raised its benchmark interest rate by a quarter of a percentage point. While it is unclear whether such action suggests a change in previous monetary policy positions, any such change or market expectation of such change may result in significantly higher long-term interest rates. Such a transition may be abrupt and may, among other things, reduce the availability and/or increase the costs of obtaining new debt and refinancing existing indebtedness.
If the Company is unable to make strategic acquisitions and to integrate its acquired businesses, the Company’s future growth and profitability could be adversely impacted.
The Company’s ability to continue to make strategic acquisitions and to integrate the acquired businesses successfully remain important factors in the Company’s future growth. In December 2016, the Company announced the acquisition of Sistema Plastics, a New Zealand-based provider of food storage containers primarily under the Sistema® brand. In January 2017, the Company completed the acquisition of Smith Mountain Industries, a provider of home fragrance products, primarily under the WoodWick® Candle brand, and in April 2016, the Company completed the acquisition of Jarden Corporation, which had recently acquired Jostens, Inc. and Waddington Group Inc. The Company’s ability to successfully integrate these or any other acquired business is dependent upon its ability to identify suitable acquisition candidates, integrate and manage product lines that have been acquired, obtain anticipated cost savings and operating income improvements within a reasonable period of time, assume unknown liabilities, known contingent liabilities that become realized or known liabilities that prove greater than anticipated, and manage unanticipated demands on the Company’s management, operational resources and financial and internal control systems. Furthermore, the Company’s ability to finance major acquisitions may be adversely affected by the Company’s financial position and access to credit markets. In addition, significant additional borrowings would increase the Company’s borrowing costs and could adversely affect its credit rating and could constrain the Company’s future access to capital. The Company may not successfully manage these or other risks it may encounter in acquiring and integrating a business or product line, which could have a material adverse effect on its business.
Circumstances associated with divestitures and product line exits could adversely affect the Company’s results of operations and financial condition.
The Company continually evaluates the performance and strategic fit of its businesses and products. In June 2016, the Company completed the sale of its Décor business, which comprises its Levolor® and Kirsch® window coverings brands. During 2016, the Company entered into an agreement to sell its Tools business, which comprises the Irwin®, Lenox®, and hilmorTM brands, and announced its intention to divest several other businesses and brands, including its Winter Sports business, including the Völkl® and K2® brands and the Rubbermaid® consumer storage totes business. The Company may decide to sell or discontinue other businesses or products in the future based on an evaluation of performance and strategic fit. A decision to divest or discontinue a business or product may result in asset impairments, including those related to goodwill and other intangible assets, and losses upon disposition, both of which could have an adverse effect on the Company’s results of operations and financial condition. In addition, the Company may encounter difficulty in finding buyers or executing alternative exit strategies at acceptable prices and terms and in a timely manner and prospective buyers may have difficulty obtaining financing. Divestitures and business discontinuations could involve additional risks, including the following:
• | difficulties in the separation of operations, services, products and personnel; |
• | the diversion of management's attention from other business concerns; |
• | the retention of certain current or future liabilities in order to induce a buyer to complete a divestiture; |
• | the disruption of the Company’s business; and |
• | the potential loss of key employees. |
The Company may not be successful in managing these or any other significant risks that it may encounter in divesting or discontinuing a business or exiting product lines, which could have a material adverse effect on its business.
The Company’s operating results can be adversely affected by changes in the cost or availability of raw materials, energy, transportation and other necessary supplies and services.
Pricing and availability of raw materials, energy, transportation and other necessary supplies and services for use in the Company’s businesses can be volatile due to numerous factors beyond its control, including general, domestic and international economic
13
conditions, labor costs, production levels, competition, consumer demand, import duties and tariffs and currency exchange rates. This volatility can significantly affect the availability and cost of raw materials, energy, transportation and other supplies and services for the Company, and may, therefore, have a material adverse effect on the Company’s business, results of operations and financial condition.
The Company’s success is dependent, in part, on its continued ability to reduce its exposure to increases in those costs through a variety of programs, including periodic purchases, future delivery purchases, long-term contracts, sales price adjustments and certain derivative instruments, while maintaining and improving margins and market share. Also, the Company relies on third-party manufacturers as a source for its products. These manufacturers are also subject to price volatility and labor cost and other inflationary pressures, which may, in turn, result in an increase in the amount the Company pays for sourced products. During periods of rising prices of raw materials, there can be no assurance that the Company will be able to pass any portion of such increases on to customers. Conversely, when raw material prices decline, customer demands for lower prices could result in lower sale prices and, to the extent the Company has existing inventory, lower margins. As a result, fluctuations in raw material prices could have a material adverse effect on the Company’s business, results of operations and financial condition.
Some of the products we manufacture require particular types of glass, metal, paper, plastic, resin, wax, wood or other materials. Supply shortages for a particular type of material can delay production or cause increases in the cost of manufacturing the Company’s products. This could have a material adverse effect on the Company’s business, results of operations and financial condition.
The Company’s operations are dependent upon third-party vendors and suppliers whose failure to perform adequately could disrupt the Company’s business operations.
The Company currently sources a significant portion of parts and products from third parties. The Company’s ability to select and retain reliable vendors and suppliers who provide timely deliveries of quality parts and products will impact the Company’s success in meeting customer demand for timely delivery of quality products. In many cases, the Company does not enter into long-term contracts with its primary vendors and suppliers, instead buying parts and products on a “purchase order” basis. As a result, the Company may be subject to unexpected changes in pricing or supply of products.
The ability of third-party suppliers to timely deliver finished goods and/or raw materials, and the ability of the Company’s own facilities to timely deliver finished goods, may be affected by events beyond their control, such as inability of shippers to timely deliver merchandise due to work stoppages or slowdowns, or significant weather and health conditions (such as SARS) affecting manufacturers and/or shippers. Any adverse change in the Company’s relationships with its third-party suppliers, the financial condition of third-party suppliers, the ability of third-party suppliers to manufacture and deliver outsourced parts or products on a timely basis, or the Company’s ability to import products from third-party suppliers or its own facilities could have a material adverse effect on the Company’s business, results of operations and financial condition.
In addition, the financial condition of the Company’s vendors and suppliers may be adversely affected by general economic conditions, such as credit difficulties and the uncertain macroeconomic environment in recent years. In addition, in some instances the Company maintains single-source or limited-source sourcing relationships, either because multiple sources are not available or the relationship is advantageous due to performance, quality, support, delivery, capacity or price considerations. For example, the Company’s Baby & Parenting business has a single source of supply for products that comprise a majority of Baby & Parenting’s sales and which owns intellectual property rights in respect of many of those products. Should any of these single source suppliers fail to manufacture sufficient supply, go out of business or discontinue a particular component, the Company may not be able to find alternative vendors and suppliers in a timely manner, if at all. Any inability of the Company’s vendors and suppliers to timely deliver quality parts and products or any unanticipated change in supply, quality or pricing of products could be disruptive and costly to the Company.
The Company cannot assure you that it could quickly or effectively replace any of its suppliers if the need arose, and the Company cannot assure you that it could retrieve tooling and molds possessed by any of its third-party suppliers. The Company’s dependence on these few suppliers could also adversely affect its ability to react quickly and effectively to changes in the market for its products.
Changes in foreign, cultural, political and financial market conditions could impair the Company’s international operations and financial performance.
Some of the Company’s operations are conducted or products are sold in countries where economic growth has slowed, such as Brazil; or where economies have suffered economic, social and/or political instability or hyperinflation; or where the ability to repatriate funds has been significantly delayed or impaired. Current government economic and fiscal policies in these economies, including stimulus measures and currency exchange rates and controls, may not be sustainable and, as a result, the Company’s sales or profits related to those countries may decline. The economies of other foreign countries important to the Company’s operations could also suffer slower economic growth or economic, social and/or political instability or hyperinflation in the future. The Company’s international operations (and particularly its business in emerging markets), including manufacturing and sourcing
14
operations (and the international operations of the Company’s customers), are subject to inherent risks which could adversely affect the Company, including, among other things:
• | protectionist policies restricting or impairing the manufacturing, sales or import and export of the Company’s products; |
• | new restrictions on access to markets; |
• | lack of developed infrastructure; |
• | inflation (including hyperinflation) or recession; |
• | devaluations or fluctuations in the value of currencies; |
• | changes in and the burdens and costs of compliance with a variety of laws and regulations, including the Foreign Corrupt Practices Act, tax laws, accounting standards, trade protection measures and import and export licensing requirements, environmental laws and occupational health and safety laws; |
• | social, political or economic instability; |
• | acts of war and terrorism; |
• | natural disasters or other crises; |
• | reduced protection of intellectual property rights in some countries; |
• | increases in duties and taxation; |
• | restrictions on transfer of funds and/or exchange of currencies; |
• | expropriation of assets or forced relocations of operations; and |
• | other adverse changes in policies, including monetary, tax and/or lending policies, encouraging foreign investment or foreign trade by host countries. |
Should any of these risks occur, the Company’s ability to manufacture, source, sell or export its products or repatriate profits could be impaired; the Company could experience a loss of sales and profitability from its international operations; and/or the Company could experience a substantial impairment or loss of assets, any of which could have a material adverse impact on the Company’s business.
The Company has foreign currency translation and transaction risks that may materially adversely affect the Company’s operating results, financial condition and liquidity.
The financial position and results of operations of many of the Company’s international subsidiaries are initially recorded in various foreign currencies and then translated into U.S. Dollars at the applicable exchange rate for inclusion in the Company’s financial statements. The strengthening of the U.S. Dollar against these foreign currencies ordinarily has a negative impact on the Company’s reported sales, operating margin and operating income (and conversely, the weakening of the U.S. Dollar has a positive impact). For the year ended December 31, 2016, foreign currency unfavorably affected reported sales by $113.1 million compared to the year ended December 31, 2015. The volatility of foreign exchange rates may materially adversely affect the Company’s operating results.
The margin impacts from changes in foreign currency are because the Company’s costs for produced and sourced products are largely denominated in U.S. Dollars, and the Company’s international operations generally sell the Company’s products at prices denominated in local currencies. When local currencies decline in value relative to the U.S. Dollar in the regions in which the Company sells products whose costs are denominated in U.S. Dollars, the Company’s international businesses would need to increase the local currency sales prices of the products and/or reduce costs through productivity or other initiatives in order to maintain the same level of profitability. The Company may not be able to increase the selling prices of its products in its international businesses due to market dynamics, competition or otherwise and may not realize cost reductions through productivity or other initiatives. As a result, gross margins and overall operating results of the Company’s international businesses would be adversely affected when the U.S. Dollar strengthens.
The Company has been adversely impacted by developments in Venezuela, including the significant devaluations of the Venezuelan Bolivar that have occurred in recent years, the declining availability of U.S. Dollars and the implementation of pricing and exchange controls in Venezuela. As of December 31, 2015, the Company determined that it no longer could exercise control over the operations of its Venezuela subsidiary. Accordingly, the Company deconsolidated its Venezuela subsidiary on December 31, 2015 and recorded a pretax charge of $172.7 million.
Future government actions, such as currency devaluations, import authorization controls, foreign exchange controls, price or profit controls or expropriation or other forms of government take-over, could adversely impact the Company’s business, results of operations, cash flows and financial condition.
See Management’s Discussion and Analysis of Financial Condition and Results of Operations and Footnote 1 of the Notes to Consolidated Financial Statements for further information.
15
A failure of one or more key information technology systems, networks, processes, associated sites or service providers could have a material adverse impact on the Company’s business or reputation.
The Company relies extensively on information technology (IT) systems, networks and services, including Internet sites, data hosting and processing facilities and tools and other hardware, software and technical applications and platforms, some of which are managed, hosted, provided and/or used by third parties or their vendors, to assist in conducting business. The various uses of these IT systems, networks and services include, but are not limited to:
• | ordering and managing materials from suppliers; |
• | converting materials to finished products; |
• | shipping products to customers; |
• | marketing and selling products to consumers; |
• | collecting and storing customer, consumer, employee, investor and other stakeholder information and personal data; |
• | processing transactions; |
• | summarizing and reporting results of operations; |
• | hosting, processing and sharing confidential and proprietary research, business plans and financial information; |
• | complying with regulatory, legal or tax requirements; |
• | providing data security; and |
• | handling other processes necessary to manage the Company’s business. |
Increased IT security threats and more sophisticated computer crime, including advanced persistent threats, pose a potential risk to the security of the Company’s IT systems, networks and services, as well as the confidentiality, availability and integrity of the Company’s data. The Company’s operations, especially its retail operations, involve the storage and transmission of employees’, customers’ and consumers’ proprietary information, such as credit card and bank account numbers. The Company’s payment services may be susceptible to credit card and other payment fraud schemes, including unauthorized use of credit cards, debit cards or bank account information, identity theft or merchant fraud. If the IT systems, networks or service providers relied upon fail to function properly, or if the Company suffers a loss or disclosure of customers’ and consumers’ data, business or stakeholder information, due to any number of causes, ranging from catastrophic events to power outages to security breaches, and business continuity plans do not effectively address these failures on a timely basis, the Company may suffer interruptions in its ability to manage operations, a risk of government enforcement action, litigation and possible liability, and reputational, competitive and/or business harm, which may adversely impact the Company’s results of operations and/or financial condition.
As techniques used to obtain unauthorized access or to sabotage systems change frequently and generally are not recognized until launched against a target, the Company may be unable to anticipate these techniques or implement adequate preventative measures. If an actual or perceived breach of the Company’s security occurs, the public perception of the effectiveness of the Company’s security measures could be harmed and the Company could lose customers and consumers, which could adversely affect its business.
Impairment charges could have a material adverse effect on the Company’s financial results.
Future events may occur that would adversely affect the reported value of the Company’s assets and require impairment charges. Such events may include, but are not limited to, strategic decisions made in response to changes in economic and competitive conditions, the impact of the economic environment on the Company’s sales and customer base, the unfavorable resolution of litigation, a material adverse change in the Company’s relationship with significant customers or business partners, or a sustained decline in the Company’s stock price. The Company continues to evaluate the impact of economic and other developments on the Company and its business units to assess whether impairment indicators are present. Accordingly, the Company may be required to perform impairment tests based on changes in the economic environment and other factors, and these tests could result in impairment charges in the future.
The Company’s businesses and operations are subject to regulation in the U.S. and abroad.
Changes in laws, regulations and related interpretations may alter the environment in which the Company does business. This includes changes in environmental, competitive and product-related laws, as well as changes in accounting standards, taxation and other regulations. Accordingly, the Company’s ability to manage regulatory, tax and legal matters (including environmental, human resource, product liability, patent and intellectual property matters), and to resolve pending legal and environmental matters without significant liability could require the Company to record significant reserves in excess of amounts accrued to date or pay significant fines during a reporting period, which could materially impact the Company’s results. In addition, new regulations may be enacted in the U.S. or abroad that may require the Company to incur additional personnel-related, environmental or other costs on an ongoing basis, significantly restrict the Company’s ability to sell certain products, or incur fines or penalties for noncompliance, any of which could adversely affect the Company’s results of operations.
16
As a U.S.-based multinational company, the Company is also subject to tax regulations in the U.S. and multiple foreign jurisdictions, some of which are interdependent. For example, certain income that is earned and taxed in countries outside the U.S. is not taxed in the U.S. until those earnings are actually repatriated or deemed repatriated. If these or other tax regulations should change, the Company’s financial results could be impacted.
The Company may incur significant costs in order to comply with environmental remediation obligations.
In addition to operational standards, environmental laws also impose obligations on various entities to clean up contaminated properties or to pay for the cost of such remediation, often upon parties that did not actually cause the contamination. Accordingly, the Company may be liable, either contractually or by operation of law, for remediation costs even if the contaminated property is not presently owned or operated by the Company, is a landfill or other location where it has disposed wastes, or if the contamination was caused by third parties during or prior to the Company’s ownership or operation of the property. Given the nature of the past industrial operations conducted by the Company and others at these properties, there can be no assurance that all potential instances of soil or groundwater contamination have been identified, even for those properties where an environmental site assessment has been conducted. We do not believe that any of the Company’s existing remediation obligations, including at third-party sites where it has been named a potentially responsible party, will have a material adverse effect upon its business, results of operations or financial condition. However, future events, such as changes in existing laws or policies or their enforcement, or the discovery of currently unknown contamination, may give rise to additional remediation liabilities that may be material. See “Environmental Matters” under Footnote 19 of the notes to the Company’s consolidated financial statements in this Annual Report on Form 10-K for the year ended December 31, 2016 for a further discussion of these and other environmental-related matters.
The Company may not be able to attract, retain and develop key personnel.
The Company’s success at implementing Project Renewal, the Growth Game Plan, the integration of Jarden and its future performance depends in significant part upon the continued service of its executive officers and other key personnel. The loss of the services of one or more executive officers or other key employees could have a material adverse effect on the Company’s business, prospects, financial condition and results of operations. The Company’s success also depends, in part, on its continuing ability to attract, retain and develop highly qualified personnel. Competition for such personnel is intense, and there can be no assurance that the Company can retain its key employees or attract, assimilate and retain other highly qualified personnel in the future.
The resolution of the Company’s tax contingencies may result in additional tax liabilities, which could adversely impact the Company’s cash flows and results of operations.
The Company is subject to income tax in the U.S. and numerous jurisdictions outside the U.S. Significant estimation and judgment are required in determining the Company’s worldwide provision for income taxes. In the ordinary course of the Company’s business, there are many transactions and calculations where the ultimate tax determination is uncertain. The Company is regularly under audit by various worldwide tax authorities. Although the Company believes its tax estimates are reasonable, the final outcome of tax audits and related litigation could be materially different than that reflected in its historical income tax provisions and accruals. There can be no assurance that the resolution of any audits or litigation will not have an adverse effect on future operating results.
The Company’s business involves the potential for product recalls, product liability and other claims against it, which could affect its earnings and financial condition.
As a manufacturer and distributor of consumer products, the Company is subject to the Consumer Products Safety Act of 1972, which empowers the Consumer Products Safety Commission to exclude from the market products that are found to be unsafe or hazardous. Under certain circumstances, the Consumer Products Safety Commission could require the Company to repurchase or recall one or more of its products. Additionally, other laws and agencies, such as the National Highway Transportation Safety Administration, regulate certain consumer products sold by the Company in the United States and abroad, and more restrictive laws and regulations may be adopted in the future. Any repurchase or recall of the Company’s products could be costly and damaging to the Company’s reputation. If the Company were required to remove, or it voluntarily removed, its products from the market, the Company’s reputation could be tarnished and the Company might have large quantities of finished products that it could not sell. The Company also faces exposure to product liability claims in the event that one of its products is alleged to have resulted in property damage, bodily injury or other adverse effects. In addition to the risk of substantial monetary judgments or fines or penalties that may result from any governmental investigations, product liability claims or regulatory actions could result in negative publicity that could harm the Company’s reputation in the marketplace, adversely impact the value of its end-user brands, or result in an increase in the cost of producing the Company’s products.
Although the Company maintains product liability insurance in amounts that it believes are reasonable, that insurance is, in most cases, subject to large self-insured retentions for which the Company is responsible, and the Company cannot assure you that it
17
will be able to maintain such insurance on acceptable terms, if at all, in the future or that product liability claims will not exceed the amount of insurance coverage. Additionally, the Company does not maintain product recall insurance. As a result, product recalls or product liability claims could have a material adverse effect on the Company’s business, results of operations and financial condition. In addition, the Company faces potential other types of litigation arising out of alleged defects in its products or otherwise, such as class action lawsuits. The Company does not maintain insurance against many types of claims involving alleged defects in its products that do not involve personal injury or property damage. The Company spends substantial resources ensuring compliance with governmental and other applicable standards. However, compliance with these standards does not necessarily prevent individual or class action lawsuits, which can entail significant cost and risk. As a result, these types of claims could have a material adverse effect on the Company’s business, results of operations and financial condition.
The Company’s product liability insurance program is an occurrence-based program based on its current and historical claims experience and the availability and cost of insurance. The Company currently either self-insures or administers a high retention insurance program for most product liability risks. Historically, product liability awards have rarely exceeded the Company’s individual per occurrence self-insured retention. The Company cannot assure you, however, that its future product liability experience will be consistent with its past experience or that claims and awards subject to self-insured retention will not be material.
See Footnote 19 of the notes to the consolidated financial statements included in this Annual Report on Form 10-K for the year ended December 31, 2016 for a further discussion of these and other regulatory and litigation-related matters.
If the Company fails to adequately protect its intellectual property rights, competitors may manufacture and market similar products, which could adversely affect the Company’s market share and results of operations.
The Company’s success with its proprietary products depends, in part, on its ability to protect its current and future technologies and products and to defend its intellectual property rights, including its patent and trademark rights. If the Company fails to adequately protect its intellectual property rights, competitors may manufacture and market similar products.
The Company holds numerous design and utility patents covering a wide variety of products. The Company cannot be sure that it will receive patents for any of its patent applications or that any existing or future patents that it receives or licenses will provide competitive advantages for its products. The Company also cannot be sure that competitors will not challenge, invalidate or avoid the application of any existing or future patents that the Company receives or licenses. In addition, patent rights may not prevent competitors from developing, using or selling products that are similar or functionally equivalent to the Company’s products.
A reduction in the Company’s credit ratings could materially and adversely affect its business, financial condition and results of operations.
The Company’s credit ratings impact the cost and availability of future borrowings and, accordingly, the Company’s cost of capital. The Company’s credit ratings reflect each rating organization’s opinion of its financial strength, operating performance and ability to meet its debt obligations. The Company cannot be sure that any of its current ratings will remain in effect for any given period of time or that a rating will not be lowered by a rating agency if, in its judgment, circumstances in the future so warrant. A downgrade by Moody’s Investor Services, Inc. (“Moody’s”) or Standard & Poor’s Ratings Services (“Standard & Poor’s”), which would reduce the Company’s senior debt below investment-grade, would increase the Company’s borrowing costs, which would adversely affect the Company’s financial results. Specifically, the interest rate payable on Notes issued in March 2016 are subject to adjustment from time to time if either Moody’s or Standard & Poor’s downgrades (or subsequently upgrades) its rating assigned to the Notes, though the interest on these notes will permanently cease to be subject to any adjustment (notwithstanding any subsequent decrease in ratings by either credit Rating Agency), if such Notes become rated “Baa1” or higher by Moody’s and BBB+ or higher by S&P, in each case with stable or positive outlook. In addition, in the event of a reduction in credit rating, the Company would likely be required to pay a higher interest rate in future financings, and its potential pool of investors and funding sources could decrease. If the Company’s short-term ratings were to be lowered, it would limit, or eliminate entirely, the Company’s access to the commercial paper market. The ratings from credit agencies are not recommendations to buy, sell or hold the Company’s securities, and each rating should be evaluated independently of any other rating.
The level of returns on pension and postretirement plan assets and the actuarial assumptions used for valuation purposes could affect the Company’s earnings and cash flows in future periods. Changes in government regulations could also affect the Company’s pension and postretirement plan expenses and funding requirements.
The funding obligations for the Company’s pension plans are impacted by the performance of the financial markets, particularly the equity markets, and interest rates. Funding obligations are determined under government regulations and are measured each year based on the value of assets and liabilities on a specific date. If the financial markets do not provide the long-term returns that are expected under the governmental funding calculations, the Company could be required to make larger contributions. The equity markets can be, and recently have been, very volatile, and therefore the Company’s estimate of future contribution requirements can change dramatically in relatively short periods of time. Similarly, changes in interest rates and legislation enacted
18
by governmental authorities can impact the timing and amounts of contribution requirements. An adverse change in the funded status of the plans could significantly increase the Company’s required contributions in the future and adversely impact its liquidity.
Assumptions used in determining projected benefit obligations and the fair value of plan assets for the Company’s pension and postretirement benefit plans are determined by the Company in consultation with outside actuaries. In the event that the Company determines that changes are warranted in the assumptions used, such as the discount rate, expected long-term rate of return on assets, expected health care costs, or mortality rates, the Company’s future pension and postretirement benefit expenses could increase or decrease. Due to changing market conditions or changes in the participant population, the assumptions that the Company uses may differ from actual results, which could have a significant impact on the Company’s pension and postretirement liabilities and related costs and funding requirements.
ITEM 1B. UNRESOLVED STAFF COMMENTS
Not applicable.
ITEM 2. PROPERTIES
Our corporate offices are located in leased office space in Hoboken, New Jersey, Atlanta, Georgia, Boca Raton, Florida and in Norwalk, Connecticut. At December 31, 2016, the Company and its subsidiaries lease or own facilities throughout the U.S., some of which have multiple buildings and warehouses, and these U.S. facilities encompass approximately 35.6 million square feet. We lease or own international facilities encompassing approximately 19.4 million square feet primarily in Asia, Canada, Europe and Latin America. Of the U.S. and international manufacturing and warehouse facilities, approximately 26.4 million square feet of space is owned, while the remaining 28.6 million square feet of space is leased. The approximate percentage of the facility square footage used by each segment is as follows: Writing — 7.9%, Home Solutions — 12.1%, Tools — 3.5%, Commercial Products — 3.5%, Baby & Parenting — 0.9%, Branded Consumables — 29.5%, Consumer Solutions — 9.1%, Outdoor Solutions — 24.1%, Process Solutions — 2.3%, and Corporate 7.1%.
In general, our properties are well-maintained, considered adequate and are utilized for their intended purposes. See Note 7 to our consolidated financial statements, Property, Plant and Equipment, which discloses amounts invested in land, buildings and machinery and equipment. Also see Note 12 (Commitments) to our consolidated financial statements, which discloses the Company’s operating lease commitments.
ITEM 3. LEGAL PROCEEDINGS
Information regarding legal proceedings is included in Footnote 19 of the Notes to Consolidated Financial Statements and is incorporated by reference herein.
ITEM 4. MINE SAFETY DISCLOSURES
Not applicable.
SUPPLEMENTARY ITEM — EXECUTIVE OFFICERS OF THE REGISTRANT | ||||
Name | Age | Present Position with the Company | ||
Michael B. Polk | 56 | Chief Executive Officer | ||
Mark S. Tarchetti | 41 | President | ||
William A. Burke | 56 | Executive Vice President, Chief Operating Officer | ||
Ralph J. Nicoletti | 59 | Executive Vice President, Chief Financial Officer | ||
Fiona C. Laird | 55 | Executive Vice President, Chief Human Resources and Communications Officer | ||
Bradford R. Turner | 44 | Chief Legal Officer and Corporate Secretary | ||
Richard B. Davies | 54 | Executive Vice President, Chief Development Officer | ||
Michael B. Polk has been the Chief Executive Officer of the Company since April 2016 and served as President and Chief Executive Officer from July 2011 to April 2016. He joined the Company’s Board of Directors in November 2009. Prior to assuming his current role, Mr. Polk was President, Global Foods, Home & Personal Care, Unilever (a consumer packaged goods manufacturer and marketer) since 2010. He joined Unilever in 2003 as Chief Operating Officer, Unilever Foods USA and subsequently became President, Unilever USA in 2005. From 2007 to 2010, he served as President, Unilever Americas. Prior to joining Unilever, he spent 16 years at Kraft Foods Inc. and three years at The Procter & Gamble Company. At Kraft Foods, he was President, Kraft Foods Asia Pacific; President, Biscuits and Snacks Sector; and was a member of the Kraft Foods Management Committee. Mr. Polk also serves as a director of Colgate-Palmolive Company.
19
Mark S. Tarchetti has been President since April 2016. Prior to this role, he served as Executive Vice President from January 2016 to March 2016; and Executive Vice President and Chief Development Officer from January 2013 to December 2015. From September 2011 to December 2012, Mr. Tarchetti was the Director of Tarchetti & Co. Ltd., a consulting firm he founded where he advised clients, including the Company, on business strategy and change management. From 1997 to 2011, he served in a variety of senior strategic, business and finance roles at Unilever, including as Head of Corporate Strategy from 2009 to 2011, Vice President of Corporate Strategy in 2008, Finance Director of the UK Home & Personal Care business from 2007 to 2008, and Global Head of Financial Planning & Analysis from 2004 to 2007.
William A. Burke has been Executive Vice President, Chief Operating Officer since January 2017 and served as President, Jarden Group from April 2016 to January 2017. Prior to this role, he served as Executive Vice President from January 2016 to March 2016; Executive Vice President and Chief Operating Officer from October 2012 to December 2015; President, Newell Professional from January 2012 to September 2012; President, Tools, Hardware & Commercial Products from January 2009 through December 2011; and, President, Tools and Hardware from December 2007 to January 2009. Prior to these roles, he was President, North American Tools from 2004 through 2006. He served as President of the Company’s Lenox division from 2003 through 2004. From 1982 through 2002, he served in a variety of positions with The Black & Decker Corporation (a manufacturer and marketer of power tools and accessories), culminating as Vice President and General Manager of Product Service.
Ralph J. Nicoletti has been Executive Vice President and Chief Financial Officer since June 2016. Prior to this role, he served as Executive Vice President and Chief Financial Officer of Tiffany & Company from April 2014 to May 2016. From June 2011 to March 2014, he served as Chief Financial Officer of Cigna Corporation. From February 2007 to May 2011, he served as Executive Vice President and Chief Financial Officer of Alberto Culver. Prior to that time, he held various senior finance positions at Kraft Foods, including Senior Vice President of Finance of Kraft Foods North America.
Fiona C. Laird has been Executive Vice President and Chief Human Resources and Communications Officer since May 2016. Prior to this role, she served as Executive Vice President, Human Resources for Global Categories, Marketing, Communications, and R&D at Unilever from July 2011 to May 2016. From June 2005 to July 2011, she served as Senior Vice President, Human Resources and Communications for Unilever’s North and Latin American geographies. Prior to that, she served in numerous HR, communications, and legal roles at Unilever.
Bradford R. Turner has been Chief Legal Officer and Corporate Secretary since April 2016. Prior to this role, he served as Senior Vice President, General Counsel and Corporate Secretary from March 2015 to March 2016. Mr. Turner joined the Company in 2004 and has served in various legal roles including Vice President and Deputy General Counsel from October 2011 to March 2015, and Group Vice President & General Counsel - Office Products from June 2007 to October 2011.
Richard B. Davies has been Executive Vice President and Chief Development Officer since January 2016 and served as Chief Marketing Officer from December 2012 through December 2015. Prior to these roles, from 1982 to 2012, he held positions of increasing responsibility at Unilever, most recently serving as its Global Senior Vice President - Consumer and Market Insights from 2008 to 2012.
20
PART II
ITEM 5. MARKET FOR REGISTRANT’S COMMON EQUITY, RELATED STOCKHOLDER MATTERS AND ISSUER PURCHASES OF EQUITY SECURITIES
The Company’s common stock is listed on the New York Stock Exchange (symbol: NWL). As of January 31, 2017, there were 11,012 stockholders of record. The following table sets forth the high and low sales prices of the common stock on the New York Stock Exchange Composite Tape for the calendar periods indicated:
2016 | 2015 | |||||||||||||||
Quarters | High | Low | High | Low | ||||||||||||
First | $ | 45.57 | $ | 33.26 | $ | 40.37 | $ | 36.33 | ||||||||
Second | 49.49 | 43.11 | 42.00 | 37.95 | ||||||||||||
Third | 55.45 | 47.07 | 44.51 | 38.17 | ||||||||||||
Fourth | 53.22 | 44.24 | 50.90 | 39.39 | ||||||||||||
The Company has paid regular cash dividends on its common stock since 1947. For 2016 and 2015, the Company paid a quarterly cash dividend of $0.19 per share in each quarter. The payment of dividends to holders of the Company’s common stock remains at the discretion of the Board of Directors and will depend upon many factors, including the Company’s financial condition, earnings, legal requirements and other factors the Board of Directors deems relevant.
Performance Graph
The following Performance Graph and related information shall not be deemed “soliciting material” or to be “filed” with the Securities and Exchange Commission, nor shall such information be incorporated by reference into any future filing under the Securities Act of 1933 or Securities Exchange Act of 1934, each as amended, except to the extent that the Company specifically incorporates it by reference into such filing.
The graph below compares total stockholder return on the Company’s common stock from December 31, 2011 through December 31, 2016 with the cumulative total return of (a) the Standard and Poor’s (“S&P”) 500 Index, and (b) the DJ Consumer Goods Index, assuming a $100 investment made on December 31, 2011. Each of the three measures of cumulative total return assumes reinvestment of dividends, if applicable. The stock performance shown on the graph below is based on historical data and is not indicative of, or intended to forecast, possible future performance of the Company’s common stock.
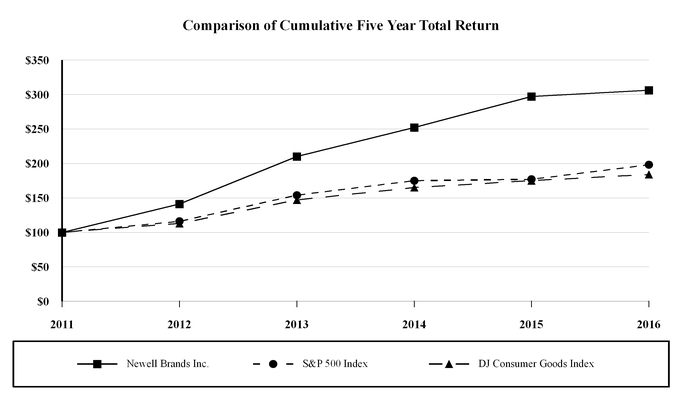
21
ISSUER PURCHASES OF EQUITY SECURITIES
The following table provides information about the Company’s purchases of equity securities during the quarter ended December 31, 2016:
Calendar Month | Total Number of Shares Purchased(2) | Average Price Paid per Share | Total Number of Shares Purchased as Part of Publicly Announced Plans or Programs(1) | Maximum Approximate Dollar Value of Shares that May Yet Be Purchased Under the Plans or Programs(1) | |||||||||
October 2016 | — | $ | — | — | $ | 255,912,171 | |||||||
November 2016 | 5,397 | 47.97 | — | 255,912,171 | |||||||||
December 2016 | 11,136 | 45.64 | — | 255,912,171 | |||||||||
Total | 16,533 | $ | 46.40 | — | |||||||||
(1) | All shares purchased by the Company during the quarter ended December 31, 2016 were acquired to satisfy employees' tax withholding and payment obligations in connection with the vesting of awards of restricted stock units, which are repurchased by the Company based on their fair market value on the vesting date. |
(2) | Under the Company’s share repurchase program (“SRP”), the Company may repurchase its own shares of common stock through a combination of 10b5-1 automatic trading plans, discretionary market purchases or in privately negotiated transactions. The Company suspended its repurchase of shares in the fourth quarter of 2015 due to the cash requirements associated with the Jarden Acquisition, so the Company did not repurchase shares pursuant to the SRP during the three months ended December 31, 2016. |
22
ITEM 6. SELECTED FINANCIAL DATA
The following is a summary of certain consolidated financial data relating to the Company as of and for the year ended December 31, (in millions, except per share data). The summary has been derived in part from, and should be read in conjunction with, the Consolidated Financial Statements of the Company included elsewhere in this report and the schedules thereto.
2016(1) | 2015(1) | 2014(1) | 2013(2) | 2012(2) | ||||||||||||||||
STATEMENTS OF OPERATIONS DATA | ||||||||||||||||||||
Net sales | $ | 13,264.0 | $ | 5,915.7 | $ | 5,727.0 | $ | 5,607.0 | $ | 5,508.5 | ||||||||||
Cost of products sold | 8,865.2 | 3,611.1 | 3,523.6 | 3,482.1 | 3,414.4 | |||||||||||||||
Gross profit | 4,398.8 | 2,304.6 | 2,203.4 | 2,124.9 | 2,094.1 | |||||||||||||||
Selling, general and administrative expenses | 3,221.1 | 1,573.9 | 1,480.5 | 1,399.5 | 1,403.5 | |||||||||||||||
Pension settlement charge | 2.7 | 52.1 | 65.4 | — | — | |||||||||||||||
Restructuring costs, net (3) | 74.9 | 77.2 | 52.8 | 110.3 | 52.9 | |||||||||||||||
Operating income | 1,100.1 | 601.4 | 604.7 | 615.1 | 637.7 | |||||||||||||||
Nonoperating (income) expenses: | ||||||||||||||||||||
Interest expense, net | 404.5 | 79.9 | 60.4 | 60.3 | 76.1 | |||||||||||||||
Loss related to extinguishment of debt/credit facility | 47.6 | — | 33.2 | — | 10.9 | |||||||||||||||
Venezuela deconsolidation charge | — | 172.7 | — | — | — | |||||||||||||||
Other (income) expense, net | (166.5 | ) | 11.3 | 49.0 | 18.5 | (1.3 | ) | |||||||||||||
Net nonoperating (income) expenses | 285.6 | 263.9 | 142.6 | 78.8 | 85.7 | |||||||||||||||
Income before income taxes | 814.5 | 337.5 | 462.1 | 536.3 | 552.0 | |||||||||||||||
Income tax expense | 286.0 | 78.2 | 89.1 | 120.0 | 161.5 | |||||||||||||||
Income from continuing operations | 528.5 | 259.3 | 373.0 | 416.3 | 390.5 | |||||||||||||||
(Loss) income from discontinued operations | (0.7 | ) | 90.7 | 4.8 | 58.3 | 10.8 | ||||||||||||||
Net income | $ | 527.8 | $ | 350.0 | $ | 377.8 | $ | 474.6 | $ | 401.3 | ||||||||||
Weighted-average shares outstanding: | ||||||||||||||||||||
Basic | 421.3 | 269.3 | 276.1 | 288.6 | 291.2 | |||||||||||||||
Diluted | 423.1 | 271.5 | 278.9 | 291.8 | 293.6 | |||||||||||||||
Earnings (loss) per share: | ||||||||||||||||||||
Basic: | ||||||||||||||||||||
Income from continuing operations | $ | 1.25 | $ | 0.96 | $ | 1.35 | $ | 1.44 | $ | 1.34 | ||||||||||
Income from discontinued operations | — | 0.34 | 0.02 | 0.20 | 0.04 | |||||||||||||||
Net income | $ | 1.25 | $ | 1.30 | $ | 1.37 | $ | 1.64 | $ | 1.38 | ||||||||||
Diluted: | ||||||||||||||||||||
Income from continuing operations | $ | 1.25 | $ | 0.96 | $ | 1.34 | $ | 1.43 | $ | 1.33 | ||||||||||
Income from discontinued operations | — | 0.33 | 0.02 | 0.20 | 0.04 | |||||||||||||||
Net income | $ | 1.25 | $ | 1.29 | $ | 1.35 | $ | 1.63 | $ | 1.37 | ||||||||||
Dividends | $ | 0.76 | $ | 0.76 | $ | 0.66 | $ | 0.60 | $ | 0.43 | ||||||||||
BALANCE SHEET DATA | ||||||||||||||||||||
Inventories, net | $ | 2,116.0 | $ | 721.8 | $ | 708.5 | $ | 684.4 | $ | 696.4 | ||||||||||
Working capital (4), (5) | 3,192.5 | 504.9 | 403.6 | 551.9 | 568.3 | |||||||||||||||
Total assets (4) | 33,837.5 | 7,259.5 | 6,564.3 | 5,967.8 | 6,215.6 | |||||||||||||||
Short-term debt, including current portion of long-term debt | 601.9 | 388.8 | 397.4 | 174.8 | 211.9 | |||||||||||||||
Long-term debt, net of current portion | 11,290.9 | 2,669.1 | 2,084.5 | 1,661.6 | 1,706.5 | |||||||||||||||
Total stockholders’ equity | $ | 11,384.4 | $ | 1,826.4 | $ | 1,854.9 | $ | 2,075.0 | $ | 2,000.2 | ||||||||||
(1) | Supplemental data regarding 2016, 2015 and 2014 is provided in Item 7, Management’s Discussion and Analysis of Financial Condition and Results of Operations. |
23
(2) | Statements of Operations data for 2013 and 2012 have been adjusted to reclassify the results of operations of the Endicia and Culinary electrics and retail businesses to discontinued operations. Statement of Operations data for 2012 have been adjusted to reclassify the results of operations of the Hardware and Teach businesses to discontinued operations. |
(3) | Restructuring costs include asset impairment charges, employee severance and termination benefits, employee relocation costs, and costs associated with exited contractual commitments and other restructuring costs. |
(4) | In November 2015, the Financial Accounting Standards Board issued Accounting Standards Update (“ASU”) 2015-17, Income Taxes (Topic 740), requiring deferred tax assets and liabilities to be classified as noncurrent assets and liabilities in the balance sheet. ASU 2015-17 is effective for annual periods beginning after December 15, 2016, and interim periods within those annual periods. Early adoption is permitted as of the beginning of an interim or annual reporting period. The Company adopted ASU 2015-17 retrospectively as of December 31, 2015. Accordingly, working capital and total assets in the Selected Financial Data have been adjusted to give effect to the retrospective adoption of ASU 2015-17. See Note 16 of the Notes to Consolidated Financial Statements for additional information. |
(5) | Working capital is defined as current assets less current liabilities. |
Acquisitions of Businesses
On April 15, 2016, the Company acquired Jarden for total consideration of $18.7 billion including cash paid, shares issued and debt assumed, net of cash acquired. Jarden is a leading global consumer products company whose brands include Yankee Candle®, Crock-Pot®, FoodSaver®, Mr. Coffee®, Oster®, Coleman®, First Alert®, Rawlings®, Jostens®, K2®, Marker®, Marmot®, Völkl® and many others. The Jarden Acquisition was accounted for using the purchase method of accounting, and accordingly, Jarden’s results of operations are included in the Company’s results of operations since the acquisition date. Jarden is included in its legacy segments: Branded Consumables, Consumer Solutions, Outdoor Solutions and Process Solutions.
On October 22, 2015, the Company completed the acquisition of Elmer’s Products, Inc. (“Elmer’s”) for a purchase price of $571.4 million, which is net of $16.8 million of cash acquired and is subject to customary working capital adjustments. Elmer’s, whose brands include Elmer’s®, Krazy Glue® (a trademark of Toagosei Co. Ltd. used with permission) and X-Acto®, is a provider of activity-based adhesive and cutting products that inspire creativity in the classroom, at home, in the office, in the workshop and at the craft table. The Acquisition was accounted for using the purchase method of accounting, and accordingly, the results of operations of Elmer’s are included in the Company’s consolidated financial statements beginning October 22, 2015. Elmer’s is included in the Company’s Writing segment.
On December 15, 2014, the Company acquired Baby Jogger Holdings, Inc. (“Baby Jogger”), a designer and marketer of premium infant and juvenile products focused on activity strollers and related accessories. Baby Jogger is headquartered in the U.S. and markets and sells its products in North America, Europe and Asia. The Baby Jogger acquisition gives the Baby & Parenting segment a premium brand and the opportunity to expand its geographic footprint. The Company acquired Baby Jogger for net cash consideration of $210.1 million, a portion of which was used to repay Baby Jogger’s outstanding debt obligations at closing. The acquisition was accounted for using the purchase method of accounting. As a result, the results of operations of Baby Jogger are included in the Company’s consolidated financial statements beginning December 15, 2014.
On October 22, 2014, the Company acquired the assets of bubba brands, inc. (“bubba”) for $82.4 million. bubba is a designer and marketer of durable beverage containers in North America. The acquisition was accounted for using the purchase method of accounting. As a result, the results of operations of bubba are included in the Company’s consolidated financial statements beginning October 22, 2014.
On September 4, 2014, the Company acquired Ignite Holdings, LLC (“Ignite”) for $313.1 million, which is net of $7.2 million of cash acquired. A portion of the purchase price was used to repay Ignite’s outstanding debt obligations at closing. Ignite is a designer and marketer of durable beverage containers sold in North America under the Contigo® and Avex® brands. The acquisition was accounted for using the purchase method of accounting, and accordingly, the results of operations of Ignite are included in the Company’s consolidated financial statements beginning September 4, 2014.
The Ignite and bubba acquisitions give the Company’s Home Solutions segment access to additional channels in the on-the-go hydration and thermal bottle market in North America and fit with the Company’s strategy of accelerating growth by leveraging its capabilities across additional product categories, geographies and channels.
Divestitures and Planned Divestitures
During 2016, the Company committed to plans to divest several businesses and brands to strengthen the portfolio to better align with the long-term growth plan. The affected businesses and brands, which will all be reported in future periods continuing operations until sold, are as follows: the Tools business, including the Irwin®, Lenox®, and hilmorTM brands in the Tools segment; the Winter Sports business, including the Völkl® and K2® brands and the Zoot® and Squadra® brands in the Outdoor Solutions segment; the heaters, fans, and humidifiers business with related brands in the Consumer Solutions segment; the Rubbermaid® consumer storage totes business in the Home Solutions segment; the Lehigh business, primarily ropes, cordage and chains under the Lehigh® brand and the firebuilding business including the Pine Mountain® brand in the Branded Consumables segment; and the stroller business under the Teutonia® brand in the Baby and Parenting segment. The assets and liabilities of these businesses
24
and brands subject to the divestiture, including $1,231.9 million of property, plant and equipment, intangible assets and goodwill, have been classified as current assets held for sale and current liabilities held for sale as of December 31, 2016.
In October 2016, the Company entered into a definitive agreement for the sale of the Tools business for a purchase price of approximately $1.95 billion, subject to working capital adjustments. The transaction is expected to close in early 2017, subject to certain customary conditions, including regulatory approvals.
In June 2016, the Company sold its Levolor® and Kirsch® window coverings brands (“Décor”), which was included in the Company’s Home Solutions segment. The results of operations of the Décor business are included in the Company’s operating results from continuing operations through the date of sale.
In August 2015, the Company sold its Rubbermaid medical cart business, which was included in the Company’s Commercial Products segment. The results of operations of the Rubbermaid medical cart business are included in the Company’s operating results from continuing operations through the date of sale.
Quarterly Summaries
Summarized quarterly data for the last two years is as follows (in millions, except per share data) (unaudited):
Calendar Year | 1st | 2nd | 3rd | 4th (2) | Year | |||||||||||||||
2016 | ||||||||||||||||||||
Net sales | $ | 1,314.9 | $ | 3,858.6 | $ | 3,954.6 | $ | 4,135.9 | $ | 13,264.0 | ||||||||||
Gross profit | $ | 505.6 | $ | 1,095.7 | $ | 1,274.8 | $ | 1,522.7 | $ | 4,398.8 | ||||||||||
Income from continuing operations | $ | 40.3 | $ | 135.8 | $ | 186.5 | $ | 165.9 | $ | 528.5 | ||||||||||
Income (loss) from discontinued operations | $ | 0.2 | $ | (0.6 | ) | $ | — | $ | (0.3 | ) | $ | (0.7 | ) | |||||||
Net income | $ | 40.5 | $ | 135.2 | $ | 186.5 | $ | 165.6 | $ | 527.8 | ||||||||||
Earnings per share(1): | ||||||||||||||||||||
Basic | ||||||||||||||||||||
Income from continuing operations | $ | 0.15 | $ | 0.30 | $ | 0.39 | $ | 0.34 | $ | 1.25 | ||||||||||
Income from discontinued operations | — | — | — | — | — | |||||||||||||||
Net income | $ | 0.15 | $ | 0.30 | $ | 0.39 | $ | 0.34 | $ | 1.25 | ||||||||||
Diluted | ||||||||||||||||||||
Income from continuing operations | $ | 0.15 | $ | 0.30 | $ | 0.38 | $ | 0.34 | $ | 1.25 | ||||||||||
Income from discontinued operations | — | — | — | — | — | |||||||||||||||
Net income | $ | 0.15 | $ | 0.30 | $ | 0.38 | $ | 0.34 | $ | 1.25 | ||||||||||
Calendar Year | 1st | 2nd | 3rd | 4th (3) | Year | |||||||||||||||
2015 | ||||||||||||||||||||
Net sales | $ | 1,264.0 | $ | 1,560.9 | $ | 1,530.0 | $ | 1,560.8 | $ | 5,915.7 | ||||||||||
Gross profit | $ | 487.5 | $ | 621.0 | $ | 598.9 | $ | 597.2 | $ | 2,304.6 | ||||||||||
Income (loss) from continuing operations | $ | 56.9 | $ | 148.1 | $ | 134.0 | $ | (79.7 | ) | $ | 259.3 | |||||||||
(Loss) income from discontinued operations | $ | (2.8 | ) | $ | 0.4 | $ | 0.2 | $ | 92.9 | $ | 90.7 | |||||||||
Net income | $ | 54.1 | $ | 148.5 | $ | 134.2 | $ | 13.2 | $ | 350.0 | ||||||||||
Earnings (loss) per share(1): | ||||||||||||||||||||
Basic | ||||||||||||||||||||
Income (loss) from continuing operations | $ | 0.21 | $ | 0.55 | $ | 0.50 | $ | (0.30 | ) | $ | 0.96 | |||||||||
Income (loss) from discontinued operations | (0.01 | ) | — | — | 0.35 | 0.34 | ||||||||||||||
Net income | $ | 0.20 | $ | 0.55 | $ | 0.50 | $ | 0.05 | $ | 1.30 | ||||||||||
Diluted | ||||||||||||||||||||
Income (loss) from continuing operations | $ | 0.21 | $ | 0.55 | $ | 0.49 | $ | (0.30 | ) | $ | 0.96 | |||||||||
Income (loss) from discontinued operations | (0.01 | ) | — | — | 0.35 | 0.33 | ||||||||||||||
Net income | $ | 0.20 | $ | 0.55 | $ | 0.50 | $ | 0.05 | $ | 1.29 | ||||||||||
(1) | Earnings per share calculations each quarter are based on weighted average number of shares outstanding each period, and the sum of the quarterly amounts may not necessarily equal the annual earnings per share amounts. |
25
( 2) | During the fourth quarter of 2016, the Company recorded deferred tax expense of $164.2 million associated with the book and tax basis difference related to the pending Tools divestiture, partially offset by a deferred tax benefit of $40.0 million due to statutory tax rate changes in France related to Jarden acquired intangible assets. |
(3) | During the fourth quarter of 2015, the Company deconsolidated its Venezuelan operations and recorded a pretax charge of $172.7 million. The charge consisted of the write-off of the Venezuelan operations’ net assets of $74.7 million, as well as $58.3 million of Venezuela-related assets held by other subsidiaries, resulting in $133.0 million of total charges associated with the deconsolidation of Venezuela’s net assets. In addition, in accordance with applicable accounting standards for foreign currency and the transition to the cost method for the Company’s Venezuelan operations, the Company wrote-off the currency translation adjustment that arose prior to the application of hyperinflationary accounting in 2010 that was included in other comprehensive income in equity. The write-off of the currency translation adjustment resulted in a pretax charge of $39.7 million. |
26
ITEM 7. MANAGEMENT’S DISCUSSION AND ANALYSIS OF FINANCIAL CONDITION AND RESULTS OF OPERATIONS
The following discussion and analysis provides information which management believes is relevant to an assessment and understanding of the Company’s consolidated results of operations and financial condition. The discussion should be read in conjunction with the accompanying Consolidated Financial Statements and Notes thereto.
Business Overview
Newell Brands is a global marketer of consumer and commercial products that help people get more out of life every day, where they live, learn, work and play. Our products are marketed under a strong portfolio of leading brands, including Paper Mate®, Sharpie®, Dymo®, Expo®, Parker®, Elmer’s®, Coleman®, Jostens®, Marmot®, Rawlings®, Irwin®, Lenox®, Oster®, Sunbeam®, FoodSaver®, Mr. Coffee®, Rubbermaid Commercial Products®, Graco®, Baby Jogger®, NUK®, Calphalon®, Rubbermaid®, Contigo®, First Alert®, Waddington and Yankee Candle®.
Acquisition of Jarden Corporation
On April 15, 2016, Jarden Corporation (“Jarden”) became a direct wholly-owned subsidiary of Newell Brands, as a result of a series of merger transactions (the “Jarden Acquisition”). The Jarden Acquisition was effected pursuant to an Agreement and Plan of Merger, dated as of December 13, 2015 (the “Merger Agreement”) between the Company, Jarden and two wholly-owned subsidiaries of the Company. Following the Jarden Acquisition, the Company was renamed Newell Brands Inc. Jarden is a leading, global consumer products company with leading brands such as Yankee Candle®, Crock-Pot®, FoodSaver®, Mr. Coffee®, Oster®, Coleman®, First Alert®, Rawlings®, Jostens®, K2®, Marker®, Marmot®, Völkl® and many others.
This transformative transaction created a global consumer goods company named Newell Brands with estimated annual pro forma sales for 2016 of $16 billion and a portfolio of leading brands in large, growing, unconsolidated, global markets. The scaled enterprise is expected to accelerate profitable growth with leading brands in a global market that exceeds $100 billion, with business and capability development supported by the efficiencies of the combined company. Management believes the scale of Newell Brands in key categories, channels and geographies creates a much broader opportunity to deploy the Company’s advantaged set of brand development and commercial capabilities for accelerated growth and margin expansion. The Company’s intent is to design a benchmarked, efficient set of structures that support long-term business development.
The Company anticipates incremental annualized cost synergies of at least $500 million over four years, driven by efficiencies of scale and new efficiencies in procurement, cost to serve and infrastructure that the combination unlocks. The Company currently expects to incur approximately $500 million of restructuring and integration-related costs over the same period to generate and unlock the more than $500 million of annualized cost synergies.
Pursuant to the Merger Agreement, each share of Jarden common stock was converted into the right to receive and became exchangeable for merger consideration consisting of (1) 0.862 of a share of the Company’s common stock plus (2) $21.00 in cash. On April 15, 2016, the Company provided for the issuance of up to 189.4 million shares of common stock and the payment of up to $4.6 billion for 100% of the outstanding equity interests of Jarden, which consisted of 219.7 million shares of Jarden common stock outstanding and eligible to receive the merger consideration. Based on the closing price of a share of the Company’s common stock on April 15, 2016 of $44.33 per share and after conversion of substantially all of Jarden’s convertible notes, the total consideration paid or payable for shares of Jarden common stock was approximately $15.3 billion, including $5.4 billion of cash and $9.9 billion of common stock. Stockholders of Newell Rubbermaid and former Jarden stockholders (including holders of Jarden convertible notes) owned 55% and 45%, respectively, of Newell Brands upon completion of the merger.
The Company paid $5.2 billion in addition to $4.1 billion for the repayment of certain Jarden debt, net of $661.9 million of cash acquired. A total of $222.2 million in cash otherwise payable in connection with the acquisition has not been paid as of December 31, 2016, as this amount was payable in respect of shareholders who have exercised their judicial rights of appraisal under Delaware law. The total merger consideration otherwise payable to the dissenting stockholders was approximately $626.5 million based on the Company’s stock price as of the closing date.
The Company financed the $5.4 billion cash portion of the merger consideration and the repayment of $4.1 billion of outstanding Jarden debt with proceeds from the issuance of $8.0 billion of medium-term and long-term notes in March 2016 and $1.5 billion of borrowings under a term loan facility. See Footnote 10 of the Notes to Consolidated Financial Statements for further information. The Company is committed to maintaining its investment grade credit rating by using strong cash flow from the combined enterprise to prioritize debt reduction in the short term, while simultaneously investing in the Company’s growth platforms and maintaining its dividend per share.
27
The Jarden Acquisition was accounted for using the purchase method of accounting, and Jarden’s assets, liabilities and results of operations are included in the Company’s financial statements from the acquisition date of April 15, 2016.
Business Strategy
During 2016, the Company launched the New Growth Game Plan, which is its strategy to simplify the organization and free up resources to invest in growth initiatives and strengthened capabilities in support of the Company’s brands. The changes being implemented in the execution of the New Growth Game Plan are considered key enablers to building a bigger, faster-growing, more global and more profitable company.
As part of the New Growth Game Plan, in late 2016 the Company began to transform from a holding company to an operating company, consolidating its business units into global divisions while investing to extend its design, innovation and brand development capabilities across a broader set of categories. These organization changes were initiated in the third quarter and this major phase of the transformation was completed by year end. These new global divisions will become the key commercial nodes in the Company, including a new Global eCommerce Division, which will have responsibility for all ecommerce activity across the enterprise.The divisions will generally align to the four areas of strategic focus for the Company of Live, Learn, Work, and Play. The new structure will be effective January 1, 2017.
Organizational Structure
The Company’s nine business segments and the key brands included in each segment during 2016 are as follows:
Segment | Key Brands | Description of Primary Products | ||
Writing | Sharpie®, Paper Mate®, Expo®, Prismacolor®, Mr. Sketch®, Elmer's®, X-Acto®, Parker®, Waterman®, Dymo® Office | Writing instruments, including markers and highlighters, pens and pencils; art products; activity-based adhesive and cutting products; fine writing instruments; labeling solutions | ||
Home Solutions | Rubbermaid®, Contigo®, bubba®, Calphalon®, Goody® | Indoor/outdoor organization, food storage and home storage products; durable beverage containers; gourmet cookware, bakeware and cutlery; hair care accessories | ||
Tools | Irwin®, Lenox®, hilmor™, Dymo® Industrial | Hand tools and power tool accessories; industrial bandsaw blades; tools for HVAC systems; label makers and printers for industrial use | ||
Commercial Products | Rubbermaid Commercial Products® | Cleaning and refuse products; hygiene systems; material handling solutions | ||
Baby & Parenting | Graco®, Baby Jogger®, Aprica®, Teutonia® | Infant and juvenile products such as car seats, strollers, highchairs and playards | ||
Branded Consumables | Yankee Candle®, Waddington, Ball®, Diamond®, First Alert®, NUK®, Quickie®, Pine Mountain® | Branded consumer products; consumable and fundamental household staples | ||
Consumer Solutions | Crock-Pot®, FoodSaver®, Holmes®, Mr. Coffee®, Oster®, Rainbow®, Sunbeam® | Household products, including kitchen appliances and home environment products | ||
Outdoor Solutions | Coleman®, Jostens®, Berkley®, Shakespeare®, Rawlings®, Völkl®, K2®, Marmot® | Products for outdoor and outdoor-related activities | ||
Process Solutions | Jarden Plastic Solutions, Jarden Applied Materials, Jarden Zinc Products | Plastic products including container closures, contact lens packaging, medical disposables, plastic cutlery and rigid packaging | ||
On April 15, 2016, the Company acquired Jarden for total consideration of $18.7 billion including cash paid, shares issued and debt assumed, net of cash acquired. The Acquisition was accounted for using the purchase method of accounting, and accordingly, Jarden’s results of operations are included in the Company’s results of operations since the acquisition date, including net sales of $7.3 billion for the year ended December 31, 2016. Jarden is included in its legacy segments: Branded Consumables, Consumer Solutions, Outdoor Solutions and Process Solutions.
28
In October 2015, the Company acquired Elmer’s Products, Inc. (“Elmer’s”) for a purchase price of $571.4 million. Elmer’s, whose brands include Elmer’s®, Krazy Glue® (a trademark of Toagosei Co. Ltd. used with permission) and X-Acto®, is a provider of activity-based adhesive and cutting products that inspire creativity in the classroom, at home, in the office, in the workshop and at the craft table. The acquisition was accounted for using the purchase method of accounting, and accordingly, Elmer’s results of operations were included in the Company’s statement of operations since the acquisition date, including net sales of $36.3 million for the year ended December 31, 2015. Elmer’s is reported as part of our Writing segment.
Based on the Company’s strategy to allocate resources to its businesses relative to each business’ growth potential and, in particular, those businesses with the greater right to win in the marketplace, the Company has divested and decided to divest certain businesses as explained in further detail below.
In June 2016, the Company sold its Décor business, including Levolor® and Kirsch® window coverings and drapery hardware, for consideration, net of fees, of $223.5 million. The net assets of the Décor business were $63.3 million, including $19.2 million of goodwill, resulting in a pretax gain of $160.2 million, which is included in other (income) expense, net for the year ended December 31, 2016.
During 2016, the Company committed to plans to divest several businesses and brands to strengthen the portfolio to better align with the long-term growth plan. The affected businesses and brands, which will all be reported in future periods continuing operations, are as follows: the Tools business, including the Irwin®, Lenox®, and hilmorTM brands in the Tools segment; the Winter Sports business, including the Völkl® and K2® brands and the Zoot® and Squadra® brands in the Outdoor Solutions segment; the heaters, fans, and humidifiers business with related brands in the Consumer Solutions segment; the Rubbermaid® consumer storage totes business in the Home Solutions segment; the Lehigh business, primarily ropes, cordage and chains under the Lehigh® brand and firebuilding business, primarily under the Pine Mountain® brand, in the Branded Consumables segment; and the stroller business under the Teutonia® brand in the Baby and Parenting segment.
During October 2016, the Company entered into an agreement to sell the Tools business for an estimated price of $1.95 billion, subject to working capital adjustments. The transaction is expected to close in early 2017, subject to certain customary conditions, including regulatory approvals, and the Company anticipates this will result in a pretax gain of approximately $0.9 billion. The Tools business generated 5.5% and 12.9% of the Company’s consolidated net sales for the year ended December 31, 2016 and 2015, respectively.
During 2015, the Company divested its Rubbermaid medical cart business. The Rubbermaid medical cart business focused on optimizing nurse work flow and medical records processing in hospitals and was included in the Commercial Products segment. The Company sold substantially all of the assets of the Rubbermaid medical cart business in August 2015. The Rubbermaid medical cart business was included in the Company’s consolidated results from continuing operations, including net sales of $26.5 million, until it was sold in August 2015.
The Endicia on-line postage and the Culinary electrics and retail businesses were classified as discontinued operations since 2014 when the Company committed to sell these businesses. Endicia was included in our Writing segment, and the Culinary businesses were included in our Home Solutions segment. During 2015, the Company sold Endicia for a sales price of $208.7 million, subject to customary working capital adjustments. During 2015, the Company ceased operations in its Culinary electrics and retail businesses.
Market and Performance Overview
The Company operates in the consumer and commercial products markets, which are generally impacted by overall economic conditions in the regions in which the Company operates. The following is a summary of the Company’s results for the year ended 2016:
• | Reported net sales increased 124.2%. Net sales were favorably impacted by volume growth, pricing, the acquisition of Elmer’s, and the Jarden Acquisition, which, contributed a 123.3% increase in net sales. Net sales were adversely impacted by foreign currency, divestitures and the deconsolidation of the Company’s Venezuelan operations on December 31, 2015. Reported net sales increased 125.4%, 180.7%, 57.6% and 93.0% in North America, Europe, Latin America and Asia Pacific, respectively, primarily due to the Jarden Acquisition. |
• | Gross margin was 33.2%, a decline of 580 basis points compared to the prior year period. The decline was primarily due to the negative impact of the $479.5 million inventory step-up for the Jarden Acquisition that is included in cost of products sold for the year ended December 31, 2016, foreign currency, mix from the deconsolidation of Venezuela and mix from acquisitions, including the Jarden Acquisition, which were partially offset by the benefits of synergies, productivity and pricing. |
29
• | Selling, general and administrative expenses (“SG&A”) increased $1,647.2 million to $3,221.1 million, due primarily to the SG&A of the Jarden business from the acquisition date and costs associated with the Jarden Acquisition. SG&A also increased due to increases in advertising and promotion in support of the Company’s brands and innovation, costs associated with increased incentive and other compensation and costs associated with the acquisition and integration of Jarden. These costs were partially offset by a reduction in overhead costs due to Project Renewal initiatives, costs associated with the Graco product recall in the prior year period and the impacts of foreign currency. |
The Company’s advertising and promotion strategy is to invest behind innovation, including new product launches, and in building brands. During 2016, the Company increased advertising and promotion investments by $24.5 million (excluding the impacts of the Jarden Acquisition). The Company plans to continue increasing advertising and promotion in support of its brands to drive growth. The Company’s investments in brand-building and consumer demand creation and commercialization activities during the year ended December 31, 2016 included the following:
• | advertising campaigns supporting Paper Mate® InkJoy® gel pens as well as Prismacolor® and Mr. Sketch® color pencils and markers in art and coloring; |
• | continued advertising support for Sharpie® markers and highlighters, including Sharpie Clear View® highlighters which have a unique, see through tip for more precise highlighting; |
• | advertising campaigns supporting the launch of Rubbermaid® FreshWorksTM, our latest food storage innovation; |
• | advertising support for Calphalon® self-sharpening cutlery with SharpInTM technology, which makes knives stay sharp for a life-time; |
• | advertising for the Graco 4Ever® All-in-One convertible car seat, Extend2FitTM car seat, and Aprica® Fladea car seat; and |
• | advertising for Yankee Candle in the fourth quarter of 2016. |
• | The Company continued the execution of Project Renewal and initiated projects to integrate Elmer’s and merge the legacy Newell Rubbermaid and Jarden operations, resulting in $74.9 million of restructuring costs for the year ended December 31, 2016. |
• | The Company completed the offering and sale of $8.0 billion principal amount of unsecured senior notes in March 2016 and entered into and expanded other financing arrangements during the first half of 2016. The proceeds were used in April 2016 to finance the Jarden Acquisition, which included $5.2 billion for the cash portion of the merger consideration and $4.1 billion to repay certain Jarden debt obligations. As a result of these financing activities, a commitment by Goldman Sachs & Co. to fund the $10.5 billion senior unsecured bridge facility (the “Jarden Bridge Facility”) was terminated during the first half of 2016, and the Company repaid $1.1 billion of the $1.5 billion of borrowings under a term loan facility, resulting in a $47.6 million loss on extinguishment of debt. |
• | The Company completed the divestiture of the Décor business, which resulted in $223.5 million of consideration, net of fees, and a pretax gain on the sale of the business of $160.2 million. The proceeds from the sale of the Décor business were used to repay debt. |
• | The Company reported an effective tax rate of 35.1% for the year ended December 31, 2016, compared to 23.2% in 2015. The tax rate for the year ended December 31, 2016 was impacted by the Jarden Acquisition and the resulting change in the geographical mix in earnings as well as a deferred tax charge of $164.2 million associated with the book and tax basis difference related to the pending Tools divestiture. The tax rate was offset in the current year by a deferred tax benefit of $40.0 million related to statutory tax rate changes in France that primarily affected deferred taxes on Jarden acquired intangible assets and a reduction in the valuation allowance of $17.9 million related to certain deferred tax assets of the Company’s UK operations. The tax rate for the year ended December 31, 2015 was impacted by the geographical mix of earnings, the strengthening of the U.S. Dollar against foreign currencies and the implied tax rate associated with the $7.6 million income tax benefit on the $172.7 million Venezuela deconsolidation charge, which were partially offset by benefits from the impact of increased foreign tax credits. |
• | The Company added members to the Newell Brands executive management team to lead the combined business, relocated its headquarters to Hoboken, New Jersey and opened its new office building for the Atlanta business hub in Atlanta, Georgia. |
• | On October 3, 2016, the Company and Jarden Receivables, LLC, a wholly-owned subsidiary of the Company (“Jarden Receivables”), entered into a loan and servicing agreement and related receivables sale and contribution agreement and |
30
performance undertaking (collectively, the “New Receivables Facility”) in order to, among other things, replace the Company's existing $400.0 million receivables facility (the "Receivables Facility") and Jarden's $500.0 million receivables purchase agreement (the "Jarden Securitization Facility") with a new $950.0 million, three-year securitization program.
• | On October 12, 2016, the Company entered into an agreement to sell the Tools business for an estimated sale price of $1.95 billion, subject to working capital adjustments. The transaction is expected to close in early 2017, subject to certain customary conditions, including regulatory approvals. |
Acquisitions
On April 15, 2016, the Company acquired Jarden for total consideration of $18.7 billion including cash paid, shares issued and debt assumed, net of cash acquired. The Jarden Acquisition was accounted for using the purchase method of accounting, and accordingly, Jarden’s results of operations are included in the Company’s results of operations since the acquisition date, including net sales of $7.3 billion. Jarden is included in the Company’s Branded Consumables, Consumer Solutions, Outdoor Solutions and Process Solutions segments.
In October 2015, the Company acquired Elmer’s for $571.4 million. The acquisition was accounted for using the purchase method of accounting, and accordingly, Elmer’s results of operations were included in the Company’s statement of operations since the acquisition date, including net sales of $36.3 million for 2015. Elmer’s is included in the Writing segment.
During 2014, the Company completed the acquisitions of Ignite Holdings, LLC (“Ignite”) and Baby Jogger Holdings, Inc. (“Baby Jogger”) and acquired the assets of bubba brands, inc. (“bubba”). The Ignite and bubba acquisitions give the Company’s Home Solutions segment access to additional channels in the on-the-go hydration and thermal bottle market in North America and fit with the Company’s strategy of accelerating growth by leveraging its capabilities across additional product categories, geographies and channels. The Baby Jogger acquisition gives the Baby & Parenting segment a premium brand and the opportunity to expand its geographic footprint. The results of operations of Ignite, bubba and Baby Jogger are included in the Company’s consolidated financial statements beginning on the respective acquisition dates of each business in 2014, which included net sales of $51.1 million, $13.4 million and $4.4 million for Ignite, bubba and Baby Jogger, respectively, in 2014.
• | On September 4, 2014, the Company acquired Ignite for $313.1 million, which is net of $7.2 million of cash acquired. A portion of the purchase price was used to repay Ignite’s outstanding debt obligations at closing. Ignite is a designer and marketer of durable beverage containers in North America sold under the Contigo® and Avex® brands. |
• | On October 22, 2014, the Company acquired the assets of bubba for $82.4 million. bubba is a designer and marketer of durable beverage containers in North America. |
• | On December 15, 2014, the Company acquired Baby Jogger, a designer and marketer of premium infant and juvenile products focused on activity strollers and related accessories, for $210.1 million. Baby Jogger is headquartered in the U.S. and markets and sells its products in North America, Europe and Asia under the Baby Jogger brand and its City Mini® and City Select® sub-brands. |
Key Initiatives
Project Renewal
During April 2015, the Company committed to a further expansion of Project Renewal (the “April 2015 Expansion”), a program initially launched in October 2011 to reduce the complexity of the organization and increase investment in growth platforms within the business, funded by a reduction in structural SG&A costs. Project Renewal is designed to simplify and align the business around two key activities — Brand & Category Development and Market Execution & Delivery. Project Renewal encompasses projects centered around five work streams:
• | Organizational Simplification: The Company de-layered its top structure and further consolidated its businesses from nine Global Business Units (“GBUs”) to three operating groups that manage five operating segments. |
• | EMEA Simplification: The Company is focusing its resources on fewer products and countries, while simplifying go-to-market, delivery and back office support structures. |
• | Best Cost Finance: The Company is delivering a simplified approach to decision support, transaction processing and information management by leveraging SAP and the streamlined business segments to align resources with the Growth Game Plan. |
31
• | Best Cost Back Office: The Company is driving “One Newell” efficiencies in customer and consumer services and sourcing functions. |
• | Supply Chain Footprint: The Company is further optimizing manufacturing and distribution facilities across its global supply chain. |
Through Project Renewal, the Company was realigned from a holding company comprised of global business units, each with its own support structure, to an operating company with three operating groups that manage five operating segments. The operating company structure is centered around four primary capabilities: Design; Marketing & Insight; Supply Chain; and Customer Development. The Company has developed centers of excellence in each of these capabilities and has realigned its back office support structure functions (Human Resources, Finance/IT and Legal) to support the four primary capabilities. This realignment has led to efficiencies and cost reductions, allowing the Company to increase investments in its brands and capabilities. In addition, through Project Renewal, the Company has simplified its go-to-market and back office structures in EMEA which has resulted in significant Project Renewal costs and savings in the EMEA region.
Pursuant to an expansion of Project Renewal in October 2014, the Company is: (i) further streamlining its supply chain function, including reducing overhead and realigning the supply chain management structure; (ii) investing in value analysis and value engineering efforts to reduce product and packaging costs; (iii) reducing operational and manufacturing complexity in its Writing segment; and (iv) further streamlining its distribution and transportation functions.
Under the April 2015 Expansion, the Company is implementing additional activities designed to further streamline business partnering functions (e.g., Finance/IT, Legal and Human Resources), optimize global selling and trade marketing functions and rationalize the Company’s real estate portfolio. The April 2015 Expansion is expected to generate annualized incremental overhead cost savings of approximately $150 million when fully implemented by the end of 2017, which includes savings expected to be realized during 2018 from projects completed in 2017. In connection with the April 2015 Expansion, the Company expects to incur approximately $150 million of additional costs, including cash costs of approximately $135 million. The additional costs include pretax restructuring charges in the range of $125 to $135 million, a majority of which are expected to be facility exit costs and employee-related cash costs, including severance, retirement and other termination benefits.
Cumulative costs of the expanded Project Renewal are now expected to be approximately $690 to $725 million pretax, with cash costs of approximately $645 to $675 million. Project Renewal in total is expected to generate annualized cost savings of approximately $620 to $675 million by the end of 2017, which includes savings expected to be realized during 2018 from projects completed in 2017. Through December 31, 2016, the Company has realized annualized savings of approximately $510 million. The majority of these savings have been, and the majority of future savings from Project Renewal initiatives are expected to be, reinvested in the business to strengthen brand building and selling capabilities in priority markets around the world.
Since inception of Project Renewal through December 31, 2016, the Company had incurred $319.7 million and $208.8 million of restructuring and other project-related costs, respectively. The majority of the restructuring costs represent employee-related cash costs, including severance, retirement and other termination benefits and costs. Other project-related costs represent organizational change implementation costs, including advisory and consultancy costs, compensation and related costs of personnel dedicated to transformation projects, and other costs associated with the implementation of Project Renewal. Through December 31, 2016, the Company estimates it has reduced its headcount by approximately 2,900 employees as a result of Project Renewal initiatives.
The following table summarizes the estimated costs and savings relating to Project Renewal, as well as the actual results through December 31, 2016 (amounts in millions):
Total Project | Through December 31, 2016 | Remaining through December 31, 2017* | |||
Cost | $690 - $725 | $529 | $161- $196 | ||
Savings | $620 - $675 | $510 | $110 - $165 | ||
In 2016, the Company has continued to execute existing projects as well as initiate new activities relating to Project Renewal as follows:
• | Ongoing reconfiguration and consolidation of the Company’s manufacturing footprint and distribution centers to reduce overhead, improve operational efficiencies and better utilize existing assets, including the ongoing implementation of projects to better align the Writing segment’s worldwide supply chain footprint. |
32
• | Ongoing evaluations of the Company’s overhead structure, supply chain organization and processes, customer development organization alignment, and pricing structure to optimize and transform processes, simplify the organization and reduce costs, including the implementation of technology-based solutions to better manage pricing initiatives and merchandising support. |
• | Initiated a project to enhance the Baby & Parenting segment’s route-to-market in certain parts of North America. |
• | Continued implementation of plans to relocate the Company’s Atlanta business hub within Atlanta, Georgia in early 2016. The Company moved into the new building in April 2016. |
Foreign Currency - Venezuela
Until December 31, 2015, the Company accounted for its Venezuelan operations using highly inflationary accounting, and therefore, the Company remeasured assets, liabilities, sales and expenses denominated in Bolivar Fuertes (“Bolivars”) into U.S. Dollars using the applicable exchange rate, and the resulting translation adjustments were included in earnings. As of December 31, 2015, the Company determined it could no longer exercise control over its Venezuela operations because the availability of U.S. Dollars had declined significantly over the past several years in each of Venezuela’s three exchange mechanisms. As a result, the Company deconsolidated its Venezuelan operations.
Prior to the deconsolidation of the Venezuela operations on December 31, 2015, the results of the Company’s Venezuelan operations have been included in the Company’s Consolidated Statements of Operations for 2015 and all prior periods. As of December 31, 2015, the Company began accounting for its investment in its Venezuelan operations using the cost method of accounting, and the cost basis was adjusted to nil as of December 31, 2015.
During the years ended December 31, 2015 and 2014, the Venezuelan operations generated 2.2% and 1.4% of consolidated net sales, respectively and $51.1 million and $30.0 million of the Company’s reported annual operating income, respectively.
As a result of deconsolidating its Venezuelan operations, the Company recorded a charge of $172.7 million in 2015. The charge consisted of the write-off of the Company’s Venezuelan operations’ net assets of $74.7 million, as well as $58.3 million of Venezuela receivable-related assets held by other subsidiaries, resulting in $133.0 million of total charges associated with the deconsolidation of Venezuela’s net assets. In addition, in accordance with applicable accounting standards for foreign currency and the transition to the cost method for Venezuela’s operations, the Company was required to write-off the currency translation adjustment that arose prior to the application of hyperinflationary accounting in 2010 that was included in other comprehensive loss in equity. The write-off of the currency translation adjustment resulted in a pre-tax charge of $39.7 million.
The Company plans to continue operating its business in Venezuela. Since the Company holds all of the equity interests but does not have the power to direct the activities that most significantly affect the Venezuela entity’s economic performance, the Company considers the Venezuela entity a variable interest entity for which the Company is not the primary beneficiary. The Company has determined that the Venezuela entity’s assets can only be used to settle its obligations. As of December 31, 2016, the Company has no outstanding exposures or commitments with respect to its Venezuelan operations. Further, dividends and payments for intercompany receivables due from the Company’s Venezuelan operations will be recorded as other income upon receipt.
33
CONSOLIDATED RESULTS OF OPERATIONS
The Company believes the selected data and the percentage relationship between net sales and major categories in the Consolidated Statements of Operations are important in evaluating the Company’s operations. The following table sets forth items from the Consolidated Statements of Operations as reported and as a percentage of net sales for the years ended December 31, (in millions, except percentages):
2016 | 2015 | 2014 | ||||||||||||||||||
Net sales | $ | 13,264.0 | 100.0 | % | $ | 5,915.7 | 100.0 | % | $ | 5,727.0 | 100.0 | % | ||||||||
Cost of products sold | 8,865.2 | 66.8 | 3,611.1 | 61.0 | 3,523.6 | 61.5 | ||||||||||||||
Gross profit | 4,398.8 | 33.2 | 2,304.6 | 39.0 | 2,203.4 | 38.5 | ||||||||||||||
Selling, general and administrative expenses | 3,221.1 | 24.3 | 1,573.9 | 26.6 | 1,480.5 | 25.9 | ||||||||||||||
Pension settlement charge | 2.7 | — | 52.1 | 0.9 | 65.4 | 1.1 | ||||||||||||||
Restructuring costs, net | 74.9 | 0.6 | 77.2 | 1.3 | 52.8 | 0.9 | ||||||||||||||
Operating income | 1,100.1 | 8.3 | 601.4 | 10.2 | 604.7 | 10.6 | ||||||||||||||
Nonoperating (income) expenses: | ||||||||||||||||||||
Interest expense, net | 404.5 | 3.0 | 79.9 | 1.4 | 60.4 | 1.1 | ||||||||||||||
Loss related to extinguishment of debt/credit facility | 47.6 | 0.4 | — | — | 33.2 | 0.6 | ||||||||||||||
Venezuela deconsolidation charge | — | — | 172.7 | 2.9 | — | — | ||||||||||||||
Other (income) expense, net | (166.5 | ) | (1.3 | ) | 11.3 | 0.2 | 49.0 | 0.9 | ||||||||||||
Net nonoperating expenses | 285.6 | 2.2 | 263.9 | 4.5 | 142.6 | 2.5 | ||||||||||||||
Income before income taxes | 814.5 | 6.1 | 337.5 | 5.7 | 462.1 | 8.1 | ||||||||||||||
Income tax expense | 286.0 | 2.2 | 78.2 | 1.3 | 89.1 | 1.6 | ||||||||||||||
Income from continuing operations | 528.5 | 4.0 | 259.3 | 4.4 | 373.0 | 6.5 | ||||||||||||||
(Loss) income from discontinued operations | (0.7 | ) | — | 90.7 | 1.5 | 4.8 | 0.1 | |||||||||||||
Net income | $ | 527.8 | 4.0 | % | $ | 350.0 | 5.9 | % | $ | 377.8 | 6.6 | % | ||||||||
Results of Operations — 2016 vs. 2015
Net sales for the year ended December 31, 2016 were $13,264.0 million, representing an increase of $7,348.3 million, or 124.2%, from $5,915.7 million for the year ended December 31, 2015. The Jarden Acquisition contributed $7,296.9 million of the increase in net sales, or 123.3% of the increase. Net sales were also favorably impacted by volume growth, pricing and the acquisition of Elmer’s. Net sales were adversely impacted by foreign currency, divestitures and the deconsolidation of the Company’s Venezuelan operations on December 31, 2015.
Gross margin, as a percentage of net sales, for the year ended December 31, 2016 was 33.2%, or $4,398.8 million, compared to 39.0%, or $2,304.6 million, for the year ended December 31, 2015. The 580 basis point decline was driven primarily by the negative impact of the $479.5 million charge for the inventory step-up related to the Jarden Acquisition, foreign currency, and mix effect of the Jarden Acquisition and deconsolidation of Venezuela, partially offset by the benefits of productivity, input cost deflation and pricing.
SG&A expenses for the year ended December 31, 2016 were 24.3% of net sales, or $3,221.1 million, versus 26.6% of net sales, or $1,573.9 million, for the year ended December 31, 2015. The $1,647.2 million increase was primarily driven by the SG&A associated with the Jarden business. The increase was also driven by $261.3 million of costs during the year ended December 31, 2016 associated with the acquisition and integration of Jarden and an increase in incentive-related and other compensation costs. These increases were partially offset by overhead cost savings from Project Renewal, $10.0 million of SG&A costs associated with the Graco product recall during the year ended December 31, 2015, a $41.5 million decrease in Project Renewal-related SG&A costs, which decreased from $78.0 million for the year ended December 31, 2015 to $36.5 million for the year ended December 31, 2016, and the impacts of foreign currency.
The Company recorded restructuring costs of $74.9 million and $77.2 million for the years ended December 31, 2016 and 2015, respectively. The restructuring costs for the year ended December 31, 2016 primarily related to the integration of Jarden and Project Renewal and consisted mostly of employee severance, termination benefits and employee relocation costs. The restructuring costs for the year ended December 31, 2015 primarily related to Project Renewal and consisted of $6.7 million of facility and other exit costs, including impairments, $54.9 million of employee severance, termination benefits and employee relocation costs
34
and $15.6 million of exited contractual commitments and other restructuring costs. See Footnote 5 of the Notes to Consolidated Financial Statements for further information.
Operating income for the year ended December 31, 2016 was $1,100.1 million, or 8.3% of net sales, versus $601.4 million, or 10.2% of net sales, for the year ended December 31, 2015. The 190 basis point decrease in operating margin was primarily attributable to the $479.5 million charge for the inventory step-up related to the Jarden Acquisition and the $261.3 million of SG&A costs associated with the acquisition and integration of Jarden.
Net nonoperating expenses for the year ended December 31, 2016 were $285.6 million versus $263.9 million for the year ended December 31, 2015. Interest expense for the year ended December 31, 2016 was $404.5 million, compared to $79.9 million for the year ended December 31, 2015, reflecting the impact of higher overall borrowings used to finance the Jarden Acquisition in April 2016 and the Elmer’s acquisition in the fourth quarter of 2015. Nonoperating expenses for the year ended December 31, 2016 include $47.6 million of costs associated with the termination of the Jarden Bridge Facility and the partial repayment of the term loan facility. This was offset by the gain on the sale of the Décor business of $160.2 million.
The Company reported an effective tax rate of 35.1% for the year ended December 31, 2016, compared to 23.2% in 2015. The tax rate for the year ended December 31, 2016 was impacted by the Jarden Acquisition and the resulting change in the geographical mix in earnings as well as a deferred tax charge of $164.2 million associated with the book and tax basis difference related to the pending Tools divestiture. The tax rate was offset in the current year by a deferred tax benefit of $40.0 million related to statutory tax rate changes in France that primarily affected deferred taxes on Jarden acquired intangible assets and a reduction in the valuation allowance of $17.9 million related to certain deferred tax assets of the Company’s UK operations. The tax rate for the year ended December 31, 2015 was impacted by the geographical mix of earnings, the strengthening of the U.S. Dollar against foreign currencies and the implied tax rate associated with the $7.6 million income tax benefit on the $172.7 million Venezuela deconsolidation charge, which were partially offset by benefits from the impact of increased foreign tax credits.
Results of Operations — 2015 vs. 2014
Net sales for 2015 were $5,915.7 million, representing an increase of $188.7 million, or 3.3%, from $5,727.0 million for 2014. Acquisitions drove a 4.7% increase in net sales along with growth in North America across all five segments, with strong sales growth in the Writing, Commercial Products and Baby & Parenting segments as well as favorable impacts of additional sell-in in advance of advertising and marketing support planned for 2016. Negative foreign exchange more than offset Latin America’s improved pricing and volumes, EMEA’s growth in Writing, Commercial Products and Tools segments and Asia Pacific’s growth in Baby & Parenting and Commercial Products segments.
Gross margin, as a percentage of net sales, for 2015 was 39.0%, or $2,304.6 million, compared to 38.5%, or $2,203.4 million, for 2014, as the benefits of productivity, pricing, the adverse impact of the Graco product recall on the prior year’s results and lower input costs (including resin) more than offset the impacts of unfavorable foreign currency and sourced product, labor and other input cost inflation.
SG&A expenses for 2015 were 26.6% of net sales, or $1,573.9 million, versus 25.9% of net sales, or $1,480.5 million, for 2014. SG&A expenses increased $93.4 million as a result of a $42.3 million increase in advertising and promotion investments, primarily relating to the Writing segment’s continued investment in advertising in North America, Latin America and Asia Pacific and increased advertising in the Tools, Commercial Products and Baby & Parenting segments. The increase was also driven by a $36.1 million year-over-year increase in Project Renewal related costs, including advisory costs for process transformation and optimization initiatives, which increased from $41.9 million for 2014 to $78.0 million for 2015. The increase was also attributable to $55.5 million of incremental SG&A expenses of Ignite, bubba, Baby Jogger and Elmer’s and a $30.7 million increase in annual incentive compensation expense. These increases were partially offset by the impacts of foreign currency and overhead cost savings from Project Renewal, which includes an estimated $8.0 million of annual costs for personnel that transitioned to the Transformation Office at the beginning of 2015 and are included in Project Renewal related costs in 2015.
In 2015 and 2014, the Company offered certain U.S. pension plan participants who have deferred vested benefits under the Company’s U.S. pension plan the opportunity to make a one-time election to receive a lump sum distribution of the present value of their benefits. Based on participants that accepted the offers, the Company paid $70.6 million and $98.6 million of lump sum distributions from plan assets in 2015 and 2014, respectively, which resulted in $52.1 million and $65.4 million of non-cash settlement charges during the fourth quarters of 2015 and 2014, respectively.
The Company recorded restructuring costs of $77.2 million and $52.8 million for 2015 and 2014, respectively. The year-over-year increase in restructuring costs is primarily a result of larger projects being initiated in North America in 2015 associated with reducing structural overhead costs. The restructuring costs for 2015 primarily related to Project Renewal and consisted of $6.7 million of facility and other exit costs, including impairments, $54.9 million of employee severance, termination benefits and employee relocation costs and $15.6 million of exited contractual commitments and other restructuring costs. The restructuring
35
costs in 2014 primarily related to Project Renewal and consisted of $7.5 million of facility and other exit costs, including impairments, $22.9 million of employee severance, termination benefits and employee relocation costs and $22.4 million of exited contractual commitments and other restructuring costs. See Footnote 5 of the Notes to Consolidated Financial Statements for further information.
Operating income for 2015 was $601.4 million, or 10.2% of net sales, versus $604.7 million, or 10.6% of net sales, for 2014. The 40 basis point decline in operating margin was primarily attributable to a 70 basis point increase in SG&A as a percentage of net sales, which, as explained above, includes the impact of increased advertising and promotion spend, and increased restructuring costs, partially offset by a 50 basis point increase in gross margin.
Net nonoperating expenses for 2015 were $263.9 million versus $142.6 million for 2014. Interest expense for 2015 was $79.9 million, compared to $60.4 million for 2014. The increase is attributable to interest expense incurred during 2015 in connection with the bridge loan related to the acquisition of Elmer’s and the overall impact of higher overall borrowings to finance the acquisition of Elmer’s during the fourth quarter of 2015 and the acquisitions of Ignite, bubba and Baby Jogger in the second half of 2014. Nonoperating expenses in 2015 included a charge of $172.7 million associated with deconsolidating the Company’s Venezuelan operations. These increases in nonoperating expenses were partially offset by the year-over-year decrease in foreign exchange losses associated with the adoption of and declines in the SICAD exchange rate used to remeasure the net monetary assets of the Company’s Venezuelan operations, which declined from $45.6 million during 2014 to $9.2 million during 2015, and the $33.2 million loss on extinguishment of debt incurred in 2014 associated with the repayment of $439.4 million principal amount of medium-term notes.
The Company recognized an effective income tax rate of 23.2% for 2015, which compared to an effective income tax rate of 19.3% for 2014. During 2015, the Company’s effective tax rate was adversely impacted by the geographical mix of earnings, the strengthening of the U.S. Dollar against foreign currencies and the implied tax rate associated with the $7.6 million income tax benefit on the $172.7 million Venezuela deconsolidation charge, which were partially offset by benefits from the impact of increased foreign tax credits. During 2014, the Company recognized discrete income tax benefits of $15.5 million related to the resolution of certain tax contingencies and $18.4 million of net income tax benefits associated with the reduction of valuation allowances on certain international deferred tax assets.
For the year ended December 31, 2015, the Company recorded income of $90.7 million, net of tax, associated with discontinued operations, primarily due to the $95.6 million net gain recognized from the sale of the Endicia business. The Company recorded income of $4.8 million, net of tax, during the year ended December 31, 2015, which primarily relates to the Company’s Hardware, Endicia and Culinary electrics and retail businesses. See Footnote 3 of the Notes to Consolidated Financial Statements for further information.
Business Segment Operating Results:
2016 vs. 2015 Business Segment Operating Results
Net sales by segment were as follows for the years ended December 31, (in millions, except percentages):
2016 | 2015 | % Change | ||||||||
Writing | $ | 1,941.9 | $ | 1,763.5 | 10.1 | % | ||||
Home Solutions | 1,568.4 | 1,704.2 | (8.0 | ) | ||||||
Tools | 760.7 | 790.0 | (3.7 | ) | ||||||
Commercial Products | 776.6 | 809.7 | (4.1 | ) | ||||||
Baby & Parenting | 919.5 | 848.3 | 8.4 | |||||||
Branded Consumables | 2,839.2 | — | NMF | |||||||
Consumer Solutions | 1,766.3 | — | NMF | |||||||
Outdoor Solutions | 2,415.9 | — | NMF | |||||||
Process Solutions | 275.5 | — | NMF | |||||||
Total net sales | $ | 13,264.0 | $ | 5,915.7 | 124.2 | % | ||||
36
Operating income (loss) by segment was as follows for the years ended December 31, (in millions, except percentages):
2016 | 2015 | % Change | ||||||||
Writing(1) (2) | $ | 462.7 | $ | 430.8 | 7.4 | % | ||||
Home Solutions(1) (3) | 179.2 | 238.4 | (24.8 | ) | ||||||
Tools(1) (7) | 85.4 | 85.1 | 0.4 | |||||||
Commercial Products(1) | 113.1 | 100.8 | 12.2 | |||||||
Baby & Parenting(1) (4) | 114.4 | 55.2 | 107.2 | |||||||
Branded Consumables(5) | 330.5 | — | NMF | |||||||
Consumer Solutions(5) | 147.1 | — | NMF | |||||||
Outdoor Solutions(5) | 90.1 | — | NMF | |||||||
Process Solutions(5) | 14.8 | — | NMF | |||||||
Restructuring costs | (74.9 | ) | (77.2 | ) | 3.0 | |||||
Corporate(1) (6) | (362.3 | ) | (231.7 | ) | (56.4 | ) | ||||
Total operating income | $ | 1,100.1 | $ | 601.4 | 82.9 | % | ||||
(1) | Includes Project Renewal-related costs of $15.1 million, $2.8 million, $2.5 million, $1.2 million, $28.3 million and $0.2 million in Writing, Home Solutions, Tools, Commercial Products, Baby & Parenting, and Corporate, respectively, for the year ended December 31, 2016 . Includes Project Renewal-related costs of $3.5 million, $2.3 million, $0.5 million, $4.7 million and $78.9 million in Writing, Home Solutions, Tools, Commercial Products, and Corporate, respectively, for the year ended December 31, 2015. |
(2) | For 2016, includes $1.4 million of acquisition and integration costs. For 2015, includes $2.6 million of costs associated with Venezuelan inventory resulting from changes in the exchange rate for the Venezuelan Bolivar and $1.2 million of acquisition and integration costs. |
(3) | For 2016, includes $2.1 million of acquisition, integration and divestiture costs. For 2015, $1.5 million of acquisition and integration costs associated with the Ignite and bubba acquisitions. |
(4) | Includes $1.7 million for 2015 of acquisition and integration costs associated with the Baby Jogger acquisition and $10.2 million of charges relating to the Graco harness buckle recall for 2015. |
(5) | Operating income for the year ended December 31, 2016 includes non-cash charges to cost of sales for the costs associated with the fair value step-up of Jarden inventory for the Branded Consumables, Consumer Solutions, Outdoor Solutions and Process Solutions segments of $137.9 million, $103.4 million, $230.2 million and $8.0 million, respectively. |
(6) | For 2016, includes $61.7 million of costs associated with the Jarden Acquisition. For 2015, includes $10.8 million of costs associated with the Jarden Acquisition and a $52.1 million non-cash charge associated with the settlement of U.S. pension liabilities for certain participants with plan assets. |
(7) | For 2016, includes $3.5 million of costs associated with the pending Tools divestiture. |
Writing
Net sales for the year ended December 31, 2016 were $1,941.9 million, an increase of $178.4 million, or 10.1%, from $1,763.5 million for the year ended December 31, 2015. The increase in net sales reflects double-digit growth in North America attributable to the Elmer’s acquisition, increased advertising and promotion, robust merchandising efforts, overall innovation-led growth, and volume and distribution gains. The acquisition of Elmer’s contributed 11.6% of the increase in net sales, and the deconsolidation of the Venezuelan operations negatively impacted the Writing segment’s net sales by 7.3%. The Writing segment’s net sales were adversely impacted by foreign currency.
Operating income for the year ended December 31, 2016 was $462.7 million, or 23.8% of net sales, an increase of $31.9 million, or 7.4%, from $430.8 million, or 24.4% of net sales, for the year ended December 31, 2015. The 60 basis point decline in operating margin is primarily the result of the mix effect associated with the deconsolidation of Venezuela and the impact of negative foreign currency. SG&A decreased 170 basis points as a percentage of net sales.
Home Solutions
Net sales for the year ended December 31, 2016 were $1,568.4 million, a decrease of $135.8 million, or 8.0%, from $1,704.2 million for the year ended December 31, 2015. The decrease in net sales was due to the timing impact of a transition of a key distribution center in the beverageware business, continued planned contraction of the lower margin Rubbermaid Consumer Storage business and partially offset by continued strong growth in the Rubbermaid food storage and beverageware businesses. The net sales of the Décor business, which was divested on June 30, 2016, declined and negatively impacted the Home Solutions segment’s net sales. The Home Solutions segment’s net sales were adversely impacted by foreign currency.
Operating income for the year ended December 31, 2016 was $179.2 million, or 11.4% of net sales, a decrease of $59.2 million, or 24.8%, from $238.4 million, or 14.0% of net sales, for the year ended December 31, 2015. The 260 basis point decline in operating margin is primarily due to an increase in advertising and promotion investment to support the launches of Rubbermaid® FreshWorksTM and Rubbermaid® Fasten+GoTM partially offset by the benefits of productivity and lower input costs. SG&A increased 150 basis points as a percentage of net sales due to the increased advertising and promotion investment and costs associated with the divestiture of Décor.
37
Tools
Net sales for the year ended December 31, 2016 were $760.7 million, a decrease of $29.3 million, or 3.7%, from $790.0 million for the year ended December 31, 2015. Net sales growth in North America and EMEA were more than offset by a net sales decline in Latin America due to continuing macroeconomic challenges in Brazil. The Tools segment’s net sales were adversely impacted by foreign currency.
Operating income for the year ended December 31, 2016 was $85.4 million, or 11.2% of net sales, an increase of $0.3 million, or 0.4%, from $85.1 million, or 10.8% of net sales, for the year ended December 31, 2015. The 40 basis point increase in operating margin was primarily attributable to reduced advertising and promotion spending and overhead cost savings. SG&A decreased 120 basis points as a percentage of net sales due to reduced advertising and promotion spending and overhead cost savings.
Commercial Products
Net sales for the year ended December 31, 2016 were $776.6 million, a decrease of $33.1 million, or 4.1%, from $809.7 million for the year ended December 31, 2015. The divested Rubbermaid medical cart business negatively impacted the Commercial Products segment’s net sales by 3.3%, and complexity reduction initiatives in the North American distribution channel further contributed to the Commercial Products segment’s net sales decline. The Commercial Products segment’s net sales were also adversely impacted by foreign currency.
Operating income for the year ended December 31, 2016 was $113.1 million, or 14.6% of net sales, an increase of $12.3 million, or 12.2%, from $100.8 million, or 12.4% of net sales, for the year ended December 31, 2015. The 220 basis point increase in operating margin was primarily driven by pricing, productivity, input cost deflation and overhead cost savings from Project Renewal. SG&A decreased 170 basis points as a percentage of net sales due to overhead cost savings.
Baby & Parenting
Net sales for the year ended December 31, 2016 were $919.5 million, an increase of $71.2 million, or 8.4%, from $848.3 million for the year ended December 31, 2015. The increase in net sales was driven by growth in North America and Asia Pacific due to new product launches and advertising and promotion investment. Foreign currency favorably impacted net sales for the Baby & Parenting segment.
Operating income for the year ended December 31, 2016 was $114.4 million, or 12.4% of net sales, an increase of $59.2 million, or 107.2%, from $55.2 million, or 6.5% of net sales, for the year ended December 31, 2015. Baby & Parenting’s operating margin increased by 590 basis points due to the leverage of fixed costs with the increase in net sales, productivity, product mix and Graco product recall and acquisition costs incurred in the prior year period. The leverage of fixed costs and the Graco product recall costs in the prior year period, partially offset by an increase in advertising and promotion investment, contributed to SG&A decreasing 250 basis points as a percentage of net sales.
Branded Consumables
Net sales for the year ended December 31, 2016 were $2,839.2 million. Operating income for the year ended December 31, 2016 was $330.5 million, or 11.6% of net sales. Operating income was unfavorably impacted by $137.9 million of costs of products sold during the year ended December 31, 2016 associated with the fair value step-up of Jarden inventory.
Consumer Solutions
Net sales for the year ended December 31, 2016 were $1,766.3 million driven by strong sales in North America and Latin America. Operating income for the year ended December 31, 2016 was $147.1 million, or 8.3% of net sales. Operating income in the Consumer Solutions segment was unfavorably impacted by $103.4 million of costs of products sold during the year ended December 31, 2016 associated with the fair value step-up of Jarden inventory.
Outdoor Solutions
Net sales for the year ended December 31, 2016 were $2,415.9 million. Operating income for the year ended December 31, 2016 was $90.1 million, or 3.7% of net sales. Operating income in the Outdoor Solutions segment was unfavorably impacted by $230.2 million of costs of products sold during the year ended December 31, 2016 associated with the fair value step-up of Jarden inventory.
Process Solutions
Net sales for the year ended December 31, 2016 were $275.5 million. Operating income for the year ended December 31, 2016 was $14.8 million, or 5.4% of net sales. Operating income in the Process Solutions segment was unfavorably impacted by $8.0 million of costs of products sold during the year ended December 31, 2016 associated with the fair value step-up of Jarden inventory.
38
2015 vs. 2014 Business Segment Operating Results
Net sales by segment were as follows for the years ended December 31, (in millions, except percentages):
2015 | 2014 | % Change | |||||||||
Writing | $ | 1,763.5 | $ | 1,708.9 | 3.2 | % | |||||
Home Solutions | 1,704.2 | 1,575.4 | 8.2 | ||||||||
Tools | 790.0 | 852.2 | (7.3 | ) | |||||||
Commercial Products | 809.7 | 837.1 | (3.3 | ) | |||||||
Baby & Parenting | 848.3 | 753.4 | 12.6 | ||||||||
Total net sales | $ | 5,915.7 | $ | 5,727.0 | 3.3 | % | |||||
Operating income (loss) by segment was as follows for the years ended December 31, (in millions, except percentages):
2015 | 2014 | % Change | |||||||||
Writing(1) | $ | 430.8 | $ | 416.6 | 3.4 | % | |||||
Home Solutions(2) | 238.4 | 196.0 | 21.6 | ||||||||
Tools(3) | 85.1 | 94.6 | (10.0 | ) | |||||||
Commercial Products(4) | 100.8 | 101.3 | (0.5 | ) | |||||||
Baby & Parenting(5) | 55.2 | 40.6 | 36.0 | ||||||||
Restructuring costs | (77.2 | ) | (52.8 | ) | (46.2 | ) | |||||
Corporate(6) | (231.7 | ) | (191.6 | ) | (20.9 | ) | |||||
Total operating income | $ | 601.4 | $ | 604.7 | (0.5 | )% | |||||
(1) | For 2015, includes $3.5 million of project-related costs associated with Project Renewal, $2.6 million of costs associated with Venezuelan inventory resulting from changes in the exchange rate for the Venezuelan Bolivar, and $1.2 million of acquisition and integration costs. For 2014, includes $5.2 million of costs associated with Venezuelan inventory resulting from changes in the exchange rate for the Venezuelan Bolivar. |
(2) | For 2015, includes $2.3 million of project-related costs associated with Project Renewal and $1.5 million of acquisition, integration and divestiture costs. For 2014, includes $4.2 million of acquisition and integration costs associated with the Ignite and bubba acquisitions. |
(3) | Includes $0.5 million and $1.7 million for 2015 and 2014, respectively, of project-related costs associated with Project Renewal. |
(4) | Includes $4.7 million and $0.4 million for 2015 and 2014, respectively, of project-related costs associated with Project Renewal. |
(5) | Includes $1.7 million and $1.3 million for 2015 and 2014, respectively, of acquisition and integration costs associated with the Baby Jogger acquisition and $10.2 million and $15.0 million of charges relating to the Graco harness buckle recall for 2015 and 2014, respectively. |
(6) | For 2015, includes $78.9 million of project-related costs associated with Project Renewal, $10.8 million of costs associated with the Jarden Acquisition and a $52.1 million non-cash charge associated with the settlement of U.S. pension liabilities for certain participants with plan assets, For 2014, includes $31.7 million of project-related costs associated with Project Renewal, $10.2 million of advisory costs for process transformation and optimization initiatives and a $65.4 million non-cash charge associated with the settlement of U.S. pension liabilities for certain participants with plan assets. |
Writing
Net sales for 2015 were $1,763.5 million, an increase of $54.6 million, or 3.2%, from $1,708.9 million for 2014. The Elmer’s acquisition had a favorable impact of 2.2% on net sales along with market share growth in North America attributable to innovation, increased advertising and promotion and merchandising efforts. While Latin America market share growth resulted from strengthened innovation and marketing, broadened core distribution and pricing and EMEA experienced pricing and distribution gains, this was more than offset by unfavorable foreign currency movements.
Operating income for 2015 was $430.8 million, or 24.4% of net sales, an increase of $14.2 million, or 3.4%, from $416.6 million, or 24.4% of net sales, for 2014. Operating margin remained flat year-over-year, as pricing, productivity and overhead cost management were offset by negative foreign currency impacts and increased advertising and promotion spending. The increased advertising and promotion spending resulted in SG&A increasing 80 basis points as a percentage of net sales.
Home Solutions
Net sales for 2015 were $1,704.2 million, an increase of $128.8 million, or 8.2%, from $1,575.4 million for 2014. The Ignite and bubba acquisitions had a favorable impact of 9.9% on net sales for the Home Solutions segment. Growth in the Food & Beverage business was partially offset by planned declines in the lower margin Rubbermaid Consumer Storage business and the absence of prior year new customer pipeline fill and the transition to new product lines on Calphalon. The Décor business’ net sales decline negatively impacted the Home Solutions segment’s net sales by 1.1% along with unfavorable foreign currency movements with the businesses.
39
Operating income for 2015 was $238.4 million, or 14.0% of net sales, an increase of $42.4 million, or 21.6%, from $196.0 million, or 12.4% of net sales, for 2014. The 160 basis point increase in operating margin is primarily a result of the positive mix effect of the Food & Beverage business, input cost deflation (including resin), productivity and Project Renewal savings, partially offset by increased advertising and promotion. Project Renewal savings and overhead cost management offset the increase in advertising and promotion, resulting in SG&A remaining flat as a percentage of net sales.
Tools
Net sales for 2015 were $790.0 million, a decrease of $62.2 million, or 7.3%, from $852.2 million for 2014. This decrease was entirely related to the unfavorable foreign currency. Excluding the impacts of foreign currency, EMEA experienced growth due to innovation, distribution gains and pricing, Latin America continued growth on Irwin® offerings, North America and EMEA grew from the Lenox® industrial tools business, and Asia Pacific increased slightly as Irwin sales growth in Australia was offset by declines in the industrial bandsaw business due to slowing industrial output in China.
Operating income for 2015 was $85.1 million, or 10.8% of net sales, a decrease of $9.5 million, or 10.0%, from $94.6 million, or 11.1% of net sales, for 2014. The 30 basis point decrease in operating margin was primarily attributable to increased advertising and promotion and the impact of negative foreign currency partially offset by Project Renewal-related overhead cost savings. SG&A decreased 70 basis points as a percentage of net sales due to overhead cost savings.
Commercial Products
Net sales for 2015 were $809.7 million, a decrease of $27.4 million, or 3.3%, from $837.1 million for 2014. The divestiture of the Rubbermaid medical cart business in 2015 negatively impacted net sales by 5.1% along with the unfavorable impact of foreign currency. Excluding the impacts of foreign currency, these declines were partially offset by increases in the North America, EMEA and Asia Pacific regions, mainly driven by innovation, marketing support, advertising and promotion and pricing.
Operating income for 2015 was $100.8 million, or 12.4% of net sales, a decrease of $0.5 million, or 0.5%, from $101.3 million, or 12.1% of net sales, for 2014. The 30 basis point increase in operating margin was primarily driven by pricing, productivity and input cost deflation, largely offset by higher advertising and promotion spend and the negative impact of foreign currency. Increased advertising and promotion resulted in SG&A increasing 110 basis points as a percentage of net sales.
Baby & Parenting
Net sales for 2015 were $848.3 million, an increase of $94.9 million, or 12.6%, from $753.4 million for 2014. The acquisition of Baby Jogger had a favorable impact of 10.5% on net sales for the Baby & Parenting segment. Excluding the acquisition, North America high-single digit net sales growth attributable to innovation, advertising and promotion, and the comparison to the prior year period which reflected the impacts of the Graco harness buckle recall, and Asia Pacific sales growth attributable to innovation were partially offset by declines in EMEA resulting from softness across Europe and economic challenges in Russia as well as unfavorable foreign currency impacts.
Operating income for 2015 was $55.2 million, or 6.5% of net sales, an increase of $14.6 million, or 36.0%, from $40.6 million, or 5.4% of net sales, for 2014. The 110 basis point increase in operating margin was largely due to contributions from Baby Jogger and new product development, partially offset by increased advertising and promotion in support of innovation and the negative impact of foreign currency. Operating income for 2015 and 2014 includes $10.2 million and $15.0 million, respectively, of costs associated with the Graco harness buckle recall. The segment’s ability to leverage the increase in net sales associated with base business growth, the addition of Baby Jogger sales and the decrease in Graco harness buckle recall costs more than offset the increase in advertising and promotion, which resulted in SG&A decreasing 100 basis points as a percentage of net sales.
Liquidity and Capital Resources
Cash Flows
Cash and cash equivalents increased (decreased) as follows for the years ended December 31, (in millions):
2016 | 2015 | 2014 | |||||||||
Cash provided by operating activities | $ | 1,828.5 | $ | 565.8 | $ | 634.1 | |||||
Cash used in investing activities | (8,824.8 | ) | (649.9 | ) | (751.9 | ) | |||||
Cash provided by financing activities | 7,340.4 | 172.3 | 119.0 | ||||||||
Currency effect on cash and cash equivalents | (31.4 | ) | (12.8 | ) | (28.1 | ) | |||||
Increase in cash and cash equivalents | $ | 312.7 | $ | 75.4 | $ | (26.9 | ) | ||||
40
In the cash flow statement, the changes in operating assets and liabilities are presented excluding the effects of changes in foreign currency exchange rates and the effects of acquisitions, divestitures and reclassifications of assets and liabilities to held for sale. Accordingly, the amounts in the cash flow statement differ from changes in the operating assets and liabilities that are presented in the balance sheets.
Sources
Historically, the Company’s primary sources of liquidity and capital resources have included cash provided by operations, proceeds from divestitures, proceeds from the issuance of debt and the use of available borrowing facilities.
Cash provided by operating activities for 2016 was $1,828.5 million compared to $565.8 million for 2015. The increase in operating cash flow was primarily due to the impact of the operating cash flow attributable to the Jarden Acquisition based on favorable timing of the acquisition during the second quarter, partially offset by higher interest payments associated with higher debt levels resulting from financing the Jarden Acquisition.
Additionally, the Company made payments of $91.2 million during 2016 associated with the settlement of forward-starting interest rate swaps used to hedge benchmark treasury rates for the $8.0 billion public debt issuance in March 2016 used to finance the Jarden Acquisition.
The Company also paid transaction costs associated with the Jarden Acquisition totaling $50.7 million, and $31.8 million of higher annual incentive compensation paid in March 2016 relating to the Company’s 2015 performance.
Cash provided by operating activities for 2015 was $565.8 million compared to $634.1 million for 2014. The decrease in operating cash flow was primarily due to the impact of the following items:
• | a $70.0 million voluntary contribution to the Company’s primary U.S. pension plan during 2015, which is included in accrued liabilities and other in the Consolidated Statements of Cash Flows; |
• | a $69.6 million year-over-year increase in cash used to build inventories in 2015 compared to 2014, partially attributable to inventory builds in 2015 to support new product launches; |
• | a $45.9 million year-over-year increase in project-related costs associated with Project Renewal and advisory costs for process transformation and optimization, including advisory and consulting costs and personnel costs associated with employees dedicated to Project Renewal initiatives; and |
• | a $67.0 million year-over-year decrease in cash provided by accounts payable, primarily attributable to the timing and management of purchases and payments. |
partially offset by:
• | a $107.1 million year-over-year decrease in cash used for increases in accounts receivable due to the timing of sales in the fourth quarter of 2015 compared to the fourth quarter of 2014; and |
• | a $60.6 million increase in the Company’s income tax liability during 2015, which is included in accrued liabilities and other in the Consolidated Statements of Cash Flows, primarily associated with an estimated $60.0 million income tax payment due in the first quarter of 2016 associated with the gain realized on the sale of the Endicia business. |
During 2016, the Company had net payments of $641.4 million related to its short-term borrowing arrangements compared to net payments of $57.0 million related to short-term borrowing arrangements in 2015. The net payments of $57.0 million related to short-term borrowing arrangements in 2015 primarily relates to $50.3 million of issuance costs incurred in connection with a $400 million bridge facility the Company entered into in advance of the Elmer’s acquisition (the “Elmer’s Bridge Facility”), which has since been terminated, and a $10.5 billion bridge facility contemplated by the commitment letter that the Company entered into with Goldman Sachs & Co. in connection with the Jarden Acquisition (the “Jarden Bridge Facility”), which has been terminated. The Company’s short-term borrowings, which include commercial paper and the receivables facility, were $601.9 million at December 31, 2016 compared to $388.8 million at December 31, 2015. During 2014, the Company received net proceeds of $217.3 million on its short-term borrowing arrangements compared to net payments of $35.8 million related to short-term borrowing arrangements in 2013. The Company’s short-term borrowings, which include commercial paper and the receivables facility, were $390.7 million at December 31, 2014 compared to $174.0 million at December 31, 2013. The increase in short-term borrowings in 2014 is primarily due to borrowings to fund the Company’s ongoing share repurchase program and to finance acquisitions.
In March 2016, the Company completed the offering and sale of $8.0 billion principal amount of unsecured senior notes, consisting of $1.0 billion of aggregate principal amount of 2.60% notes due March 2019 (the “2019 Notes”), $1.0 billion of aggregate
41
principal amount of 3.15% notes due April 2021 (the “2021 Notes”), $1.75 billion of aggregate principal amount of 3.85% notes due April 2023 (the “2023 Notes”), $2.0 billion of aggregate principal amount of 4.20% notes due April 2026 (the “2026 Notes”), $500.0 million of aggregate principal amount of 5.375% notes due April 2036 (the “2036 Notes”) and $1.75 billion of aggregate principal amount of 5.50% notes due April 2046 (the “2046 Notes” and together with the 2019 Notes, the 2021 Notes, the 2023 Notes, the 2026 Notes and the 2036 Notes, the “Notes”). In April 2016, the Company borrowed $1.5 billion pursuant to a senior unsecured term loan facility with a syndicate of banks (the “Term Loan Facility”). The aggregate net proceeds from the issuance of the Notes and Term Loan Facility of $9.4 billion were used in April 2016 to pay the cash portion of the merger consideration in the Jarden Acquisition and to repay certain of Jarden’s outstanding debt at closing. The Company repaid $1.1 billion of the Term Loan Facility during 2016.
In October 2015, the Company completed the offering and sale of $600.0 million of medium-term notes, consisting of $300.0 million aggregate principal amount of 2.15% notes due 2018 (the “2018 Notes”) and $300.0 million aggregate principal amount of 3.90% notes due 2025 (the “2025 Notes”). The aggregate net proceeds from the issuance of the medium-term notes were $594.5 million, which were used for the acquisition of Elmer’s and for general corporate purposes. In November 2014, the Company completed the offering and sale of $850.0 million of medium-term notes, consisting of $350.0 million principal amount of 2.875% notes due 2019 (the “2019 Notes”) and $500.0 million principal amount of 4.0% notes due 2024 (the “2024 Notes”). The aggregate net proceeds were $841.8 million and were used to repay $439.4 million principal amount of medium-term notes and to repay short-term borrowings incurred in connection with the acquisitions of Ignite, bubba and Baby Jogger.
During 2016, the Company generated $247.8 million of proceeds from the sale of divested businesses and fixed assets, which primarily represents the $226.3 million of net proceeds, excluding fees, from the divestiture of the Décor business. The proceeds from the sale of the Décor business were used to repay debt.
During 2015, the Company sold its Endicia business for aggregate net proceeds of $208.7 million. The Company recognized a pretax gain of $154.2 million, with related tax expense of $58.6 million. The related tax expense primarily represents an income tax liability which was paid and included as a use of cash in the Company’s cash flow from operating activities in the first quarter of 2016.
During 2016, the Company received $9.6 million in connection with the exercise of employee stock options, which compares to $24.3 million received in 2015 and $76.6 million received in 2014. During 2016, the Company used $22.2 million to repurchase its common stock to satisfy employees’ tax withholding obligations in connection with the vesting of restricted stock units, which compares to $30.0 million and $15.9 million used in 2015 and 2014, respectively.
Uses
Historically, the Company’s primary uses of liquidity and capital resources have included capital expenditures, payments on debt, dividend payments, share repurchases and acquisitions.
Capital expenditures were $441.4 million, $211.4 million and $161.9 million for 2016, 2015 and 2014, respectively. Capital expenditures incurred for capitalized software projects included in capital expenditures were $34.3 million, $38.8 million and $20.8 million for 2016, 2015 and 2014, respectively. The increase in capital expenditures in 2016 was largely attributable to purchases of equipment in the U.S. to support the consolidation of facilities in the Commercial Products segment, investments in assets to improve the Company’s resin manufacturing network in the Home Solutions and Commercial Products segments, the purchase of the Company’s new headquarters building, sales and marketing-related software initiatives and the implementation of SAP in Asia Pacific.
During 2016, the Company completed the Jarden Acquisition. The total consideration consisted of $5.4 billion in cash in addition to $9.9 billion of the Company’s common stock. The Company paid $5.2 billion in addition to $4.1 billion for the repayment of certain Jarden debt, net of $661.9 million of cash acquired. A total of $222.2 million in cash otherwise payable in connection with the acquisition has not been paid as of December 31, 2016. This amount was payable (along with the equity portion of the merger consideration) to the former holders of 10.6 million Jarden shares who have exercised their judicial rights of appraisal under Delaware law. Absent consent by the Company, these dissenting shareholders are no longer entitled to the merger consideration, but are instead entitled only to the judicially determined fair value of their shares, plus interest accruing from the date of the Jarden Acquisition, payable in cash. However, it is possible that the Company could issue a consent to or reach agreement with one or more of these shareholders resulting in the issuance of Company shares (in lieu of or along with the payment of cash) in settlement of the dissenters’ claims.
During 2016, the Company repaid $1.1 billion of borrowings under the Term Loan Facility.
42
During 2015, the Company completed the acquisition of Elmer’s. The purchase price of $571.4 million is net of $16.8 million of cash acquired and is subject to customary working capital adjustments and was paid from proceeds received from the issuance of the 2018 Notes and 2025 Notes.
During 2014, the Company completed the acquisitions of Ignite and Baby Jogger and acquired the assets of bubba. The total net purchase price for these three businesses in 2014 was $602.3 million, which was paid from proceeds received from the issuance of the 2019 Notes and 2024 Notes and short-term borrowings.
During 2015, the Company deconsolidated its Venezuelan operations, which resulted in a $97.5 million reduction in cash and cash equivalents.
During 2014, the Company used aggregate net proceeds of $841.8 million from the issuance of the 2019 Notes and 2024 Notes and short-term borrowings to redeem $168.7 million of the $550.0 million outstanding 4.7% medium-term notes due 2020, redeem the $250.0 million of outstanding 2.0% medium-term notes due 2015, redeem the $20.7 million of outstanding 10.6% medium-term notes due 2019, finance acquisitions and for general corporate purposes.
Aggregate dividends paid were $328.6 million, $206.3 million and $182.5 million for 2016, 2015 and 2014, respectively. In February 2015, the Company’s Board of Directors approved a 12% increase in the quarterly dividend from $0.17 per share to $0.19 per share, effective with the quarterly dividend paid in March 2015. The Company’s Board of Directors previously approved a 13.3% increase in the Company’s quarterly dividend from $0.15 per share to $0.17 per share, effective with the quarterly dividend paid in June 2014.
Under the Company’s stock repurchase program (“SRP”), which expires at the end of 2017, the Company may repurchase its own shares of common stock through a combination of 10b5-1 automatic trading plans, discretionary market purchases or in privately negotiated transactions. During 2016, the Company did not repurchase shares. During 2015 and 2014, the Company repurchased approximately 4.5 million and 11.3 million shares, respectively, of its common stock under its existing stock repurchase program (“SRP”) valued at approximately $180.4 million and $363.2 million, respectively. At December 31, 2016, approximately $255.9 million remains available under the Stock Repurchase Program.
Cash used for restructuring activities was $59.9 million, $51.5 million and $71.8 million for 2016, 2015 and 2014, respectively, and is included in the cash provided by operating activities. These payments relate primarily to employee severance, termination benefits and relocation costs and vacant facility lease payments.
The Company made contributions of $34.5 million, $103.2 million and $34.9 million to its defined benefit plans for 2016, 2015 and 2014, respectively. The contributions are included in cash provided by operating activities.
Cash Conversion Cycle
The Company defines its cash conversion cycle as the sum of inventory and accounts receivable days outstanding (based on cost of products sold and net sales, respectively, for the most recent three-month period, including discontinued operations) minus accounts payable days outstanding (based on cost of products sold for the most recent three-month period, including discontinued operations) at the end of the year. The following table depicts the Company’s cash conversion cycle at December 31, (in number of days):
2016 | 2015 | 2014 | ||||||
Accounts receivable | 64 | 73 | 74 | |||||
Inventory | 85 | 71 | 67 | |||||
Accounts payable | (56 | ) | (64 | ) | (64 | ) | ||
Cash conversion cycle | 93 | 80 | 77 | |||||
The decrease in accounts receivable and accounts payable days and increase in inventory days from 2015 to 2016 is attributable to the inclusion of the Jarden business and the timing of the closing of the Jarden Acquisition with respect to sales, cash receipts, purchases and payments. The increase in the cash conversion cycle from 2015 to 2014 is primarily due to the increase in inventory days, driven by higher inventory balances at December 31, 2015 as compared to December 31, 2014, largely attributable to inventory builds for new product launches. The decrease in accounts payable days in 2016 compared to 2015 and 2014 is attributable to the timing and management of purchases and payments.
The acquisition of Elmer’s and divestiture of Endicia had the effect of increasing the cash conversion cycle by approximately 1 day in 2015 due to the timing of the transactions in the fourth quarter of 2015. The Company’s cash conversion cycle is impacted
43
by the seasonality of its businesses and generally tends to be longer in the first and second quarters, based on historical trends, due to inventory build-ups early in the year for seasonal sales activity and credit terms provided to customers.
Financial Position
The Company is committed to maintaining a strong financial position through maintaining sufficient levels of available liquidity, managing working capital and monitoring the Company’s overall capitalization.
• | Cash and cash equivalents at December 31, 2016 were $587.5 million, and the Company had $1.21 billion of total available borrowing capacity under the $1.25 billion unsecured syndicated revolving credit facility and $756.0 million of borrowing capacity under the $950.0 million receivables facility. |
• | Working capital at December 31, 2016 was $3.2 billion compared to $504.9 million at December 31, 2015, and the current ratio at December 31, 2016 was 1.74:1 compared to 1.25:1 at December 31, 2015. The improvement in working capital and the current ratio is primarily attributable to increased long-term borrowings to finance the cash requirements associated with the Jarden Acquisition. |
• | The Company monitors its overall capitalization by evaluating net debt to total capitalization. Net debt to total capitalization is defined as the sum of short- and long-term debt, less cash, divided by the sum of total debt and stockholders’ equity, less cash. Net debt to total capitalization decreased to 0.50:1 at December 31, 2016 from 0.60:1 at December 31, 2015. The decrease in net debt to total capitalization is primarily attributable to $9.5 billion of borrowings to finance the Jarden Acquisition offset by the $661.9 million of cash acquired in the Jarden Acquisition and the issuance of shares for the Jarden Acquisition valued at $9.5 billion. |
The Company has from time to time refinanced, redeemed or repurchased its debt and taken other steps to reduce its debt or lease obligations or otherwise improve its overall financial position and balance sheet. Going forward, depending on market conditions, its cash positions and other considerations, the Company may continue to take such actions.
Borrowing Arrangements
The Company maintains a $1.25 billion revolving credit facility that matures in January 2022 (the “Facility”). Under the Facility, the Company may borrow funds on a variety of interest rate terms. The Facility also provides for the issuance of up to $100.0 million of letters of credit, so long as there is a sufficient amount available for borrowing under the Facility. At December 31, 2016, net availability under the Facility was approximately $1.21 billion.
In October 2016, the Company entered into a new $950.0 million receivables purchase agreement (the “Securitization Facility”) that matures in October 2019 and bears interest at a margin over a variable interest rate. The Securitization Facility replaced the Company’s existing Receivable Facility and Jarden Securitization Facility. Under the Securitization Facility, on an ongoing basis certain operating subsidiaries will sell their receivables to a special purpose entity Jarden Receivables, LLC (“Jarden Receivables”), which is a wholly-owned consolidated indirect subsidiary of the Company. Jarden Receivables funds these purchases with borrowings under a loan agreement, which are secured by the accounts receivable. There is no recourse to the Company for the unpaid portion of any loans under this loan agreement. At December 31, 2016, the borrowing rate margin and the unused line fee on the securitization were 0.80% and 0.40% per annum, respectively. At December 31, 2016, net availability under the Facility was approximately $756.0 million.
The following table presents the maximum and average daily borrowings outstanding under the Company’s short-term borrowing arrangements during the years ended December 31, (in millions):
2016 | 2015 | ||||||||||||||
Short-term Borrowing Arrangement | Maximum | Average | Maximum | Average | |||||||||||
Commercial paper | $ | 508.0 | $ | 236.6 | $ | 551.2 | $ | 336.7 | |||||||
Receivables Facility and Securitization Facility | 859.4 | 529.7 | 400.0 | 332.5 | |||||||||||
On January 26, 2016, the Company entered into a credit agreement (the “Term Loan Credit Agreement”) for a $1.5 billion senior unsecured term loan facility with a syndicate of banks. In April 2016, the Company borrowed $1.5 billion pursuant to the Term Loan Credit Agreement, and the borrowings were used to pay a portion of the cash portion of the merger consideration in connection with the Jarden Acquisition. The Term Loan Credit Agreement provides for a maturity date of three years from the closing date of the Jarden Acquisition and requires the Company to repay 5% of the initial borrowings by each of April 2017 and April 2018, 45% of the borrowings by October 2018 and the remaining 45% of the borrowings by April 2019. At the Company’s election, borrowings under the Term Loan Credit Agreement bear interest either at (i) the eurodollar rate plus an applicable margin, or (ii) the base rate plus an applicable margin. During the year ended December 31, 2016, the Company repaid $1.1 billion of the
44
borrowings outstanding under the Term Loan Credit Agreement. The interest rate on the Term Loan Credit Agreement was approximately at 2.31% at December 31, 2016.
In March 2016, the Company completed the offering and sale of the Notes for aggregate net proceeds of $7.9 billion, which were used to pay the cash portion of the merger consideration in the Jarden Acquisition and to repay certain outstanding debt of Jarden at closing. The weighted average term of the Notes was 12.8 years, and the weighted-average interest rate, including amortization of issuance costs and the settled forward-starting interest rate swaps, was 4.38%.
In March 2016, the Company commenced exchange offers (the “Exchange Offers”) pursuant to which the Company offered to issue new senior notes (the “Newell Notes”) in exchange for €300 million aggregate principal amount of the outstanding 3.75% senior notes due October 2021 issued by Jarden and of the $300 million aggregate principal amount of the outstanding 5.00% senior notes due November 2023 issued by Jarden (collectively, the “Existing Jarden Notes”). The Exchange Offers expired and were settled in April 2016. The aggregate principal amount of each series of Newell Notes issued in the Exchange Offers totaled €271.9 million of 3.75% senior notes due October 2021 and $295.1 million of 5.00% senior notes due November 2023. Following the completion of the Exchange Offers and the Jarden Acquisition, a subsidiary of the Company assumed debt obligations associated with the Existing Jarden Notes (as modified) that were not tendered in the Exchange Offers, which included €28.1 million in aggregate principal amount of 3.75% senior notes due October 2021 and $4.9 million in aggregate principal amount of 5.00% senior notes due November 2023. In October 2016, the Company completed a registered exchange offer to satisfy its obligations under a registration rights agreement, pursuant to which it offered to exchange the Newell Notes for registered notes having substantially identical terms. All of the $295.1 million of 5.00% senior notes due November 2023 and €259.9 million of the €271.9 million of 3.75% senior notes due October 2021 participated in the registered exchange offer.
The indentures governing the Company’s medium-term and long-term notes contain usual and customary nonfinancial covenants. The Company’s borrowing arrangements other than the medium-term and long-term notes contain usual and customary nonfinancial covenants and certain financial covenants, including minimum interest coverage and maximum debt-to-total-capitalization ratios. As defined by the agreements governing these other borrowing arrangements, minimum interest coverage ratio is computed as adjusted Earnings before Interest, Taxes, Depreciation and Amortization (“EBITDA”) divided by adjusted interest expense for the four most recent quarterly periods. Generally, maximum debt-to-total-capitalization is calculated as the sum of short-term and long-term debt divided by the sum of (i) total debt, (ii) total stockholders’ equity, (iii) $750.0 million related to impairment charges incurred by the Company (amended under the Revolving Credit Agreement to add an additional $250.0 million of charges incurred after January 1, 2015) and (iv) up to $1.0 billion related to the component of accumulated other comprehensive income (loss) for all foreign currency translation and the cumulative foreign exchange gains (losses) incurred since January 1, 2015 arising from (i) the appreciation or depreciation of the Venezuelan Bolivar relative to the U.S. Dollar due to the highly inflationary accounting for Venezuela and (ii) the cumulative gains or losses resulting from the deconsolidation of a foreign entity. For purposes of calculating debt-to-total capitalization, the Company’s borrowing arrangements, as amended, provide for the exclusion of any debt incurred to finance the Jarden Acquisition from the calculation until after the closing of the Jarden Acquisition. As of December 31, 2016, the Company had complied with all covenants under the indentures and its other borrowing arrangements, and the Company could access the full borrowing capacity available under the Facility and the Securitization Facility and utilize the $2.0 billion for general corporate purposes without exceeding the debt-to-total-capitalization limit in its financial covenants. A failure to maintain the financial covenants would impair the Company’s ability to borrow under the Facility and the Securitization Facility and may result in the acceleration of the repayment of certain indebtedness.
The following table presents the average outstanding debt and weighted-average interest rates for the years ended December 31, (in millions, except percentages):
2016 | 2015 | 2014 | |||||||||
Average outstanding debt | $ | 10,692.0 | $ | 2,887.6 | $ | 2,085.2 | |||||
Average interest rate(1) | 3.7 | % | 2.8 | % | 3.0 | % | |||||
(1) | The average interest rate includes the impacts of fixed-for-floating interest rate swaps. |
As of December 31, 2016 and 2015, approximately 10.0% and 31.7%, respectively of the Company’s debt is considered variable-rate debt, by nature or through use of interest rate swaps.
Outlook
Overall, in the next twelve months, the Company believes that available cash and cash equivalents, cash flows generated from future operations, access to capital markets, and availability under the Facility and the New Receivables Facility will be adequate to support the cash needs of Newell Brands. The Company intends to use available cash, borrowing capacity, cash flows from future operations and alternative financing arrangements to invest in capital expenditures in support of the Company’s growth
45
platforms, to maintain its dividend per share and to repay debt maturities as they come due, including short-term debt and current portion of long-term debt totaling $601.9 million as of December 31, 2016, which included the Company’s outstanding commercial paper obligations and borrowings under the Receivables Facility and Jarden Securitization Facility replaced by the New Receivables Facility.
Contractual Obligations, Commitments and Off-Balance Sheet Arrangements
The Company has outstanding debt obligations maturing at various dates through 2046. Certain other items, such as purchase commitments and other executory contracts, are not recognized as liabilities in the Company’s consolidated financial statements but are required to be disclosed. Examples of items not recognized as liabilities in the Company’s consolidated financial statements are commitments to purchase raw materials or inventory that has not yet been received as of December 31, 2016, and future minimum lease payments for the use of property and equipment under operating lease agreements.
The following table summarizes the effect that lease and other material contractual obligations is expected to have on the Company’s cash flow in the indicated period. In addition, the table reflects the timing of principal and interest payments on borrowings outstanding as of December 31, 2016. Additional details regarding these obligations are provided in the Notes to Consolidated Financial Statements (in millions):
Payments Due by Period | |||||||||||||||
Total | 2017 | 2018-2019 | 2020-2021 | 2022+ | |||||||||||
Debt(1) | $ | 11,955.3 | $ | 599.0 | $ | 2,308.8 | $ | 1,693.7 | $ | 7,353.8 | |||||
Interest on debt(2) | 5,368.8 | 479.9 | 860.3 | 733.7 | 3,294.9 | ||||||||||
Operating lease obligations(3) | 1,025.3 | 219.1 | 340.2 | 205.2 | 260.8 | ||||||||||
Purchase obligations(4) | 1,062.4 | 852.2 | 205.9 | 3.3 | 1.0 | ||||||||||
Total contractual obligations(5) | $ | 19,411.8 | $ | 2,150.2 | $ | 3,715.2 | $ | 2,635.9 | $ | 10,910.5 | |||||
(1) | Amounts represent contractual obligations based on the earliest date that the obligation may become due, excluding interest, based on borrowings outstanding as of December 31, 2016. Includes $189.4 million in borrowings under the receivables facility that the Company intends to repay or refinance before maturity. For further information relating to these obligations, see Footnote 10 of the Notes to Consolidated Financial Statements. |
(2) | Amounts represent estimated interest payable on borrowings outstanding as of December 31, 2016, excluding the impact of fixed to floating rate interest rate swaps. Interest on floating-rate debt was estimated using the rate in effect as of December 31, 2016. For further information, see Footnote 10 of the Notes to Consolidated Financial Statements. |
(3) | Amounts represent contractual minimum lease obligations on operating leases as of December 31, 2016. For further information relating to these obligations, see Footnote 12 of the Notes to Consolidated Financial Statements. |
(4) | Primarily consists of purchase commitments entered into as of December 31, 2016, for finished goods, raw materials, components and services pursuant to legally enforceable and binding obligations, which include all significant terms. |
(5) | Total does not include contractual obligations reported on the December 31, 2016 balance sheet as current liabilities, except for current portion of long-term debt, short-term debt and accrued interest. |
The Company also has liabilities for uncertain tax positions and unrecognized tax benefits. The Company is under audit from time-to-time by the IRS and other taxing authorities, and it is possible that the amount of the liability for uncertain tax positions and unrecognized tax benefits could change in the coming year. While it is possible that one or more of these examinations may be resolved in the next year, the Company is not able to reasonably estimate the timing or the amount by which the liability will be settled over time; therefore, the $367.9 million in unrecognized tax benefits as of December 31, 2016 is excluded from the preceding table. See Footnote 16 of the Notes to Consolidated Financial Statements for additional information.
Additionally, the Company has obligations with respect to its pension and postretirement benefit plans, which are excluded from the preceding table. The timing and amounts of the funding requirements are uncertain because they are dependent on interest rates and actual returns on plan assets, among other factors. See Footnote 13 of the Notes to Consolidated Financial Statements for further information.
As of December 31, 2016, the Company had $80.0 million in standby letters of credit primarily related to the Company’s self-insurance programs, including workers’ compensation, product liability and medical. See Footnote 19 of the Notes to Consolidated Financial Statements for further information.
As of December 31, 2016, the Company did not have any significant off-balance sheet arrangements, as defined in Item 303(a)(4)(ii) of SEC Regulation S-K.
Critical Accounting Estimates
The Company’s accounting policies are more fully described in Footnote 1 of the Notes to Consolidated Financial Statements. As disclosed in that footnote, the preparation of financial statements in conformity with generally accepted accounting principles
46
requires management to make estimates and assumptions about future events that affect the amounts reported in the financial statements and accompanying footnotes. Future events and their effects cannot be determined with absolute certainty. Therefore, the determination of estimates requires the exercise of judgment. Actual results inevitably will differ from those estimates, and such differences may be material to the Consolidated Financial Statements. The following sections describe the Company’s critical accounting policies.
Sales Recognition
Sales of merchandise and freight billed to customers are recognized when title passes and all substantial risks of ownership transfer, which generally occurs either upon shipment or upon delivery based upon contractual terms. Sales are net of provisions for cash discounts, returns, customer discounts (such as volume or trade discounts), cooperative advertising and other sales-related discounts.
Customer Programs
The Company participates in various programs and arrangements with customers designed to increase the sale of products by these customers. Among the programs negotiated are arrangements under which allowances are earned by customers for attaining agreed-upon sales levels or for participating in specific marketing programs. Coupon programs are also developed on a customer- and territory-specific basis with the intent of increasing sales by all customers. The cost of all of these various programs, included as a reduction in net sales, totaled $1,144.3 million, $659.3 million and $594.2 million in 2016, 2015 and 2014, respectively.
Under customer programs and arrangements that require sales incentives to be paid in advance, the Company amortizes the amount paid over the period of benefit or contractual sales volume. When incentives are paid in arrears, the Company accrues the estimated amount to be paid based on the program’s contractual terms, expected customer performance and/or estimated sales volume. These estimates are determined using historical customer experience and other factors, which sometimes require significant judgment. Due to the length of time necessary to obtain relevant data from customers, among other factors, actual amounts paid can differ from these estimates.
Recovery of Accounts Receivable
The Company evaluates the collectibility of accounts receivable based on a combination of factors. When aware of a specific customer’s inability to meet its financial obligations, such as in the case of bankruptcy filings or deterioration in the customer’s operating results or financial position, the Company records a specific reserve for bad debt to reduce the related receivable to the amount the Company reasonably believes is collectible. The Company also records reserves for bad debt for all other customers based on a variety of factors, including the length of time the receivables are past due and historical collection experience. Accounts are reviewed for potential write-off on a case-by-case basis. Accounts deemed uncollectible are written off, net of expected recoveries. If circumstances related to specific customers change, the Company’s estimates of the recoverability of receivables could be further adjusted. The Company’s reserve for uncollectible accounts was $23.3 million and $14.6 million as of December 31, 2016 and 2015, respectively.
Inventory Reserves
The Company reduces its inventory value for estimated obsolete and slow-moving inventory in an amount equal to the difference between the cost of inventory and the net realizable value based upon assumptions about future demand and market conditions. Net provisions for excess and obsolete inventories, including shrink reserves, totaled $33.0 million, $23.3 million and $24.2 million in 2016, 2015 and 2014, respectively, and are included in cost of products sold. The Company’s reserve for excess and obsolete inventory and shrink reserves totaled $45.9 million and $32.9 million as of December 31, 2016 and 2015, respectively. If actual market conditions are less favorable than those projected by management, additional inventory write-downs may be required.
Business Combinations
The Company allocates purchase consideration to the tangible assets acquired, liabilities assumed and intangible assets acquired based on their estimated fair values. The excess of the fair value of purchase consideration over the fair values of these identifiable assets and liabilities is recorded as goodwill. When determining the fair values of assets acquired and liabilities assumed, the Company makes significant estimates and assumptions, especially with respect to intangible assets.
Critical estimates in valuing intangible assets include, but are not limited to, future expected cash flows from customer relationships, trade names and trademarks and acquired patents and developed technology; the period of time the Company expects to use the acquired intangible asset; and discount rates. In estimating the future cash flows, the Company considers demand, competition and other economic factors. The Company’s estimates are based upon assumptions believed to be reasonable, but which are inherently uncertain and unpredictable and, as a result, actual results may differ from estimates, which could result in impairment charges in the future. Estimates associated with the accounting for business combinations may change as additional information becomes available regarding the assets acquired and liabilities assumed, which could result in adjustments to the values of tangible
47
assets acquired, liabilities assumed and intangible assets acquired or could result in future income or expenses if such changes in estimates are identified beyond one year from the date of acquisition.
The Company considers various factors in determining whether an acquired trademark or trade name has an indefinite life. In assessing whether an acquired trademark or trade name has an indefinite life, the Company considers legal and regulatory provisions that may limit the useful life, customer loyalty, brand strength and positioning, the effects of obsolescence and other economic factors, the Company’s plans for incorporating the trademark or trade name into its brand portfolio and the Company’s historical experience in using and renewing similar assets. The Company considers all other acquired intangible assets definite-lived assets and generally amortizes the assets on a straight-line basis. The Company determines the amortizable life of acquired definite-lived intangible assets based on the number of years over which a significant amount of the discounted cash flows contributes to the estimated fair value of the asset.
The Company accounts for costs to exit or restructure certain activities of an acquired company separately from the business combination. A liability for costs associated with an exit or disposal activity is recognized and measured at its fair value in the consolidated statement of operations in the period in which the liability is incurred. When estimating the costs of exiting facilities, estimates are made regarding future sublease payments to be received, which can differ materially from actual results. As a result, the Company may be required to revise its estimates which may affect the Company’s results of operations and financial position in the period the revision is made.
Goodwill and Other Indefinite-Lived Intangible Assets
Goodwill
The Company performs its annual impairment testing of goodwill at a reporting unit level, and all of the Company’s goodwill is assigned to the Company’s reporting units. Reporting units are generally one level below the operating segment level. The Company performed its annual goodwill impairment testing as of July 1, 2016. As of the impairment testing date, as a result of the Jarden Acquisition in April 2016, the Company’s reporting units significantly increased to 25 reporting units, comprising the Company’s expanded nine operating segments. Acquired businesses, if any, including goodwill arising from such transactions, are typically integrated into the Company's existing reporting units; however, the 12 additional reporting units resulting from the Jarden Acquisition were not integrated into the Company’s existing reporting units. Additionally, the Company recently announced changes to its management and division structure which will be executed in early 2017 and result in realigning the Company’s reporting units and operating segments next year.
The Company had 25 reporting units with total goodwill of $10.2 billion of which approximately $8.3 billion related to goodwill acquired in the Jarden Acquisition.
The Company conducts its annual test of impairment of goodwill as of the first day of the third quarter because it generally coincides with its annual strategic planning process. The Company also tests for impairment if events and circumstances indicate that it is more likely than not that the fair value of a reporting unit is below its carrying amount. For example, if macroeconomic factors, such as consumer demand and consumer confidence, deteriorate materially such that the Company's reporting units’ projected sales and operating income decline significantly relative to previous estimates, the Company will perform an interim test to assess whether goodwill is impaired. The Company determined that no interim tests of impairment of goodwill were necessary during 2016.
In the Company’s goodwill impairment testing, if the carrying amount of a reporting unit is greater than its fair value, impairment may be present. Estimates made by management in performing its impairment testing may impact whether or not an impairment charge is necessary and the magnitude of the corresponding impairment charge to the extent one is recorded. The Company uses multiple valuation approaches in its impairment testing, each of which requires estimates to arrive at an estimate of fair value. For the Company's reporting units that are stable businesses and have a history of generating positive operating income and cash flows, the Company relies on a multiple of earnings approach to assess fair value. The material assumptions used to value a reporting unit using this approach are the reporting units’ estimated financial performance for the remainder of the year and the applicable multiple to apply to earnings before interest, taxes, depreciation and amortization (“EBITDA”). The estimated financial performance for the remainder of the year is based on the Company’s internal forecasting process. To determine the EBITDA multiple, the Company obtains information from third parties on EBITDA multiples observed for recent acquisitions and other transactions in the marketplace for comparable businesses. The Company also evaluates the EBITDA multiples of publicly traded companies that are in the same industry and are comparable to each reporting unit and compares the EBITDA multiples of the publicly traded companies to the multiples used by the Company to estimate the fair value of each reporting unit. The Company evaluates the EBITDA multiples used to value the reporting units relative to the Company's market capitalization plus an equity control premium. The equity control premium is defined as the sum of the individual reporting units’ estimated market values compared to the Company's market value, with the sum of the individual values typically being larger than the market value of
48
the Company. The Company considers premiums paid by acquirers of comparable businesses to determine the reasonableness of the implied control premium.
The EBITDA multiple observed in the marketplace for publicly traded companies that are comparable to the reporting units ranged from 6 to 14. In using the EBITDA multiples, the Company compared the aggregate value of all reporting units to the Company’s total market value to validate the aggregate values of the reporting units resulted in a reasonable implied equity control premium. The Company considers several factors in estimating the EBITDA multiple applicable to each reporting unit, including the reporting unit’s market position, brand awareness, gross and operating income margins, and prospects for growth, among other factors. After adjusting the EBITDA multiples for the reporting units, no potential goodwill impairment was indicated for reporting units for which this approach was used. Furthermore, the Company's equity market value at July 1, 2016 of approximately $23.5 billion was significantly in excess of its book value of stockholders' equity of approximately $11.3 billion. For the impairment test as of July 1, 2016, if each reporting unit’s EBITDA multiple were reduced by 0.5 from the 6 to 14 multiple used for each reporting unit, all reporting units where the EBITDA multiple approach was used to estimate the value of the reporting unit would have passed step one of the goodwill impairment test.
The Company relies on a discounted cash flow approach to value reporting units in certain circumstances, such as when the reporting unit is growing at a significantly slower rate than planned, is declining at a significantly faster rate than the overall market, has experienced significant losses, is in a stage of hyper-growth, is executing significant restructuring efforts, or is in a stage of development where it has not yet fully realized the benefits of scale and operating efficiencies. The Company also relies on a discounted cash flow approach when a reporting unit is recently acquired. As of July 1, 2016 and consistent with the aforementioned factors, the Company used the discounted cash flow approach for the annual impairment tests of its Elmer’s and Beverageware reporting units as well as the reporting units acquired in the Jarden Acquisition. The material assumptions used to value a reporting unit using the discounted cash flow approach are the future financial performance and cash flows of the reporting unit, the discount rate, long-term sales growth rate, working capital reductions and working capital investments required. Estimates of future financial performance include estimates of future sales growth rates, raw material and sourced product costs, currency fluctuations, and operating efficiencies to be realized. The Company determines a discount rate based on an estimate of a reasonable risk-adjusted return an investor would expect to realize on an investment in the reporting unit.
In using the discounted cash flow approach to value the Elmer’s reporting unit in 2016, the Company used average compound short-term and long-term sales growth rates of 3% and 2%, respectively, average operating margins generally ranging from 17% to 23%, and a discount rate of 10%. The Company concluded the Elmer’s reporting unit passed step 1 of the goodwill impairment test based on the estimated fair value determined using the discounted cash flow approach. If the discount rate used to estimate the fair value of the Elmer’s reporting unit increased 50 basis points, the Elmer’s reporting unit would still have passed step 1 of the goodwill impairment test.
In using the discounted cash flow approach to value the Beverageware reporting unit in 2016, the Company used average compound short-term and long-term sales growth rates of 6% and 3%, respectively, average operating margins generally ranging from 10% to 16%, and a discount rate of 14%. The Company concluded the Beverageware reporting unit passed step 1 of the goodwill impairment test based on the estimated fair value determined using the discounted cash flow approach. If the discount rate used to estimate the fair value of the Beverageware reporting unit increased 50 basis points, the Beverageware reporting unit would still have passed step 1 of the goodwill impairment test.
In using the discounted cash flow approach to value the reporting units from the Jarden Acquisition in 2016, the Company used discounted cash flow projections and related assumptions for sales growth, operating margins and discount rate that were consistent with the acquisition model. The Company concluded the reporting units from the Jarden Acquisition passed step 1 of the goodwill impairment testing based on the estimated fair values determined using the discounted cash flow approach. If the discount rates used to estimate the fair values of these reporting units were increased 50 basis points, these reporting units would not have passed step 1 of the goodwill impairment test since the Jarden Acquisition took place in April 2016, and therefore fair values approximate carrying values.
For reporting units held for sale for which an offer has been received from a prospective buyer, the Company relies on the value offered by the third party for the sale of the reporting unit to estimate the reporting unit’s fair value. In October 2016, the Company entered into an agreement to sell the Tools business (excluding Dymo industrial labeling) for $1.95 billion, and such value was used as the estimated fair value of the Construction Tools & Accessories and Industrial Products & Services reporting units. The estimated fair value exceeded the carrying value of the Construction Tools & Accessories and Industrial Products & Services reporting units, and the Company concluded the Construction Tools & Accessories and Industrial Products & Services reporting units reporting unit passed step 1 of the goodwill impairment test.
Apart from the reporting units related to the Jarden Acquisition described above, the Company has no reporting units with net assets whose estimated fair values at July 1, 2016 exceeded net assets by less than 10% of the reporting unit’s net assets.
49
Indefinite-Lived Intangible Assets
The Company first performs a qualitative assessment to determine whether it is necessary to perform the quantitative impairment test. The Company may bypass the qualitative assessment for any indefinite-lived intangible asset in any period and proceed directly to performing the quantitative impairment test. Additionally, the Company may resume performing the qualitative assessment in any subsequent period.
In performing the qualitative assessment for each of the Company's indefinite-lived intangible assets, the Company considered events and circumstances that could affect the significant inputs used to determine the fair value of the indefinite-lived intangible asset, including factors such as declines in actual or planned sales or negative or declining cash flows; input cost inflation that may have a negative effect on future cash flows; legal, regulatory, contractual, political, business or other factors; and, other entity-specific events such as changes in management, key personnel, strategy or customers. Based on the qualitative assessment, if the Company was unable to assert that it is not more likely than not that the indefinite-lived intangible asset is impaired, then the Company would proceed with the quantitative impairment test for such asset.
For the quantitative impairment test, the Company estimates the fair value of its indefinite-lived intangible assets by employing a discounted cash flow model using the relief-from-royalty method, which estimates royalties to be derived in the future use of the asset were the Company to license the use of the trade name. An impairment charge for indefinite-lived intangible assets is recorded if the carrying amount of an indefinite-lived intangible asset exceeds the estimated fair value on the measurement date.
The Company completed its annual impairment test of indefinite-lived intangible assets as of July 1, 2016 and determined that none of its significant indefinite-lived intangible assets were impaired. Prior to the Jarden Acquisition, there were $475.8 million of indefinite-lived intangible assets, and, as part of the Jarden Acquisition, the Company acquired indefinite-lived intangible assets with estimated fair values of $9.5 billion. Although the purchase price is still preliminary, the Company does not expect these values to change significantly as they were derived from assumptions consistent with the acquisition model. The Company performed the quantitative impairment test for the $37.0 million carrying value of the Aprica trade name due to competitive pressures and other factors that have recently adversely impacted Aprica sales in Japan. The Company concluded the Aprica trade name was not impaired. However, a 100 basis point decrease in the royalty rate used in the quantitative impairment test would have resulted in an impairment of the Aprica trade name of $10.4 million, and a 100 basis point increase in the discount rate used would have resulted in an impairment of $4.9 million. In addition, the Company performed a quantitative impairment test for the $200.0 million carrying value of the Elmer’s trade name due to the recent acquisition of the Elmer’s business. The Company concluded the Elmer’s trade name was not impaired. However, a 100 basis point decrease in the royalty rate used in the quantitative impairment test would have resulted in an impairment of the Elmer’s trade name of $16.4 million, and a 100 basis point increase in the discount rate used would have resulted in an impairment of $18.0 million. The Company also performed the quantitative impairment test for the $102.0 million carrying value of the Baby Jogger trade name due to the recent acquisition of the Baby Jogger business. The Company concluded the Baby Jogger trade name was not impaired. A 100 basis point decrease in the royalty rate used in the quantitative impairment test or a 100 basis point increase in the discount rate used would not result in an impairment of the Baby Jogger trade name.
The Company considers qualitative and quantitative factors in determining whether impairment testing of the trademark and trade name assets is necessary at dates other than the annual impairment testing date, such as whether the Company has plans to abandon or significantly reduce the use of a trademark or trade name. Based on consideration of these factors, the Company determined that no impairment indicators have been present, and therefore, impairment testing as of a date other than July 1, 2016 was not required during 2016.
Potential for Future Impairments
The Company had 25 reporting units with total goodwill of $10.2 billion and $9.9 billion of indefinite-lived intangible assets as of December 31, 2016. The Company cannot predict the occurrence of events that might adversely affect the reported value of goodwill and other intangible assets. Such events may include, but are not limited to, strategic decisions made in response to economic and competitive conditions, the impact of the economic environment on the Company’s customer base and net sales, a material negative change in its relationships with significant customers, or sustained declines in the Company’s market capitalization relative to its reported stockholders' equity. The Company periodically evaluates the impact of economic and other conditions on the Company and its reporting units to assess whether impairment indicators are present. The Company may be required to perform additional impairment tests based on changes in the economic environment and other factors, which could result in impairment charges in the future. Although management cannot predict when improvements in macroeconomic conditions will occur, if consumer confidence and consumer spending decline significantly in the future or if commercial and industrial economic activity deteriorates significantly from current levels, it is reasonably likely the Company will be required to record impairment charges in the future. Additionally, there are significant synergy savings projected for the Company as a result of the Jarden Acquisition.
50
If these synergy savings are not realized, or are realized by reporting units which differ significantly from the estimated projections, it is reasonably likely that the Company would be required to record impairment charges in the future.
Capitalized Software Costs
The Company capitalizes costs associated with internal-use software during the application development stage after both the preliminary project stage has been completed and the Company’s management has authorized and committed to funding for further project development. Capitalized internal-use software costs include: (i) external direct costs of materials and services consumed in developing or obtaining the software; (ii) payroll and payroll-related costs for employees who are directly associated with and who devote time directly to the project; and (iii) interest costs incurred while developing the software. Capitalization of these costs ceases no later than the point at which the project is substantially complete and ready for its intended purpose. The Company expenses as incurred research and development, general and administrative, and indirect costs associated with internal-use software. In addition, the Company expenses as incurred training, maintenance and other internal-use software costs incurred during the post-implementation stage. Costs associated with upgrades and enhancements of internal-use software are capitalized only if such modifications result in additional functionality of the software. The Company capitalized $37.0 million of internal-use software costs during 2016, which primarily relate to employee, consultant and related personnel costs incurred in the rollout of SAP in Asia Pacific. Capitalized software costs net of accumulated amortization were $229.1 million at December 31, 2016, which excludes $44.6 million of capitalized internal-use software classified as assets held for sale. Capitalized interest costs included in capitalized software were not material as of December 31, 2016.
The Company amortizes internal-use software costs using the straight-line method over the estimated useful life of the software, which typically ranges from 3 to 12 years. Capitalized software costs are evaluated annually for indicators of impairment, including but not limited to a significant change in available technology or the manner in which the software is being used. Impaired items are written down to their estimated fair values.
Other Long-Lived Assets
The Company continuously evaluates whether impairment indicators related to its property, plant and equipment and other long-lived assets are present. These impairment indicators may include a significant decrease in the market price of a long-lived asset or asset group, a significant adverse change in the extent or manner in which a long-lived asset or asset group is being used or in its physical condition, or a current-period operating or cash flow loss combined with a history of operating or cash flow losses or a forecast that demonstrates continuing losses associated with the use of a long-lived asset or asset group. If impairment indicators are present, the Company estimates the future cash flows for the asset or group of assets. The sum of the undiscounted future cash flows attributable to the asset or group of assets is compared to their carrying amount. The cash flows are estimated utilizing various assumptions regarding future sales and expenses, working capital and proceeds from asset disposals on a basis consistent with the Company’s forecasts. If the carrying amount exceeds the sum of the undiscounted future cash flows, the Company discounts the future cash flows using a discount rate required for a similar investment of like risk and records an impairment charge as the difference between the fair value and the carrying value of the asset group. Generally, the Company performs its testing of the asset group at the product-line level, as this is the lowest level for which identifiable cash flows are available.
Product Liability Reserves
The Company has a self-insurance program for product liability that includes reserves for self-retained losses and certain excess and aggregate risk transfer insurance. The Company uses historical loss experience combined with actuarial evaluation methods, review of significant individual files and the application of risk transfer programs in determining required product liability reserves. The Company’s actuarial evaluation methods take into account claims incurred but not reported when determining the Company’s product liability reserve. The Company has product liability reserves of $81.7 million as of December 31, 2016. While the Company believes that it has adequately reserved for these claims, the ultimate outcome of these matters may exceed the amounts recorded by the Company, and such additional losses may be material to the Company’s Consolidated Financial Statements.
Legal and Environmental Reserves
The Company is subject to losses resulting from extensive and evolving federal, state, local, and foreign laws and regulations, as well as contract and other disputes. The Company evaluates the potential legal and environmental losses relating to each specific case and estimates the probability and amount of loss based on historical experience and estimates of cash flows for certain environmental matters. The estimated losses take into account anticipated costs associated with investigative and remediation efforts where an assessment has indicated that a probable liability has been incurred and the cost can be reasonably estimated. No insurance recovery is taken into account in determining the Company’s cost estimates or reserve, nor do the Company’s cost estimates or reserve reflect any discounting for present value purposes, except with respect to long-term operations and maintenance, Comprehensive Environmental Response Compensation and Liability Act (“CERCLA”) and other matters which are estimated
51
at present value. As of December 31, 2016, the Company had a reserve of $41.9 million for such environmental response costs in the aggregate, which is included in other accrued liabilities and other noncurrent liabilities in the Consolidated Balance Sheet.
Income Taxes
In accordance with relevant authoritative guidance, the Company accounts for deferred income taxes using the asset and liability approach. Under this approach, deferred income taxes are recognized based on the tax effects of temporary differences between the financial statement and tax bases of assets and liabilities, as measured by current enacted tax rates. Valuation allowances are recorded to reduce the deferred tax assets to an amount that will more likely than not be realized. No provision is made for the U.S. income taxes on the undistributed earnings of non-U.S. subsidiaries, as substantially all such earnings are permanently reinvested.
The Company’s income tax provisions are based on calculations and assumptions that are subject to examination by the IRS and other tax authorities. Although the Company believes that the positions taken on previously filed tax returns are reasonable, it has established tax, interest and penalty reserves in recognition that various taxing authorities may challenge the positions taken, which could result in additional liabilities for taxes, interest and penalties. The Company regularly reviews its deferred tax assets for recoverability considering historical profitability, projected future taxable income, the expected timing of the reversals of existing temporary differences and tax planning strategies.
For uncertain tax positions, the Company applies the provisions of relevant authoritative guidance, which requires application of a “more likely than not” threshold to the recognition and derecognition of tax positions. The Company’s ongoing assessments of the more likely than not outcomes of tax authority examinations and related tax positions require significant judgment and can increase or decrease the Company’s effective tax rate as well as impact operating results.
The Company’s provision for income taxes is subject to volatility and could be favorably or adversely affected by earnings being higher or lower in countries that have lower tax rates and higher or lower in countries that have higher tax rates; by changes in the valuation of deferred tax assets and liabilities; by expiration of or lapses in tax-related legislation; by expiration of or lapses in tax incentives; by tax effects of nondeductible compensation; by changes in accounting principles; by liquidity needs driving repatriations of non-U.S. cash to the U.S.; or by changes in tax laws and regulations, including possible U.S. changes to the taxation of earnings of foreign subsidiaries, the deductibility of expenses attributable to foreign income, or the foreign tax credit rules.
The Company’s effective tax rate differs from the statutory rate, primarily due to the tax impact of state taxes, foreign tax rates, tax credits, the domestic manufacturing deduction, tax audit settlements and valuation allowance adjustments. Significant judgment is required in evaluating uncertain tax positions, determining valuation allowances recorded against deferred tax assets, and ultimately, the income tax provision.
It is difficult to predict when resolution of income tax matters will occur and when recognition of certain income tax assets and liabilities is appropriate, and the Company’s income tax expense in the future may continue to differ from the statutory rate because of the effects of similar items. For example, if items are favorably resolved or management determines a deferred tax asset is realizable that was previously reserved, the Company will recognize period tax benefits. Conversely, to the extent tax matters are unfavorably resolved or management determines a valuation allowance is necessary for a tax asset that was not previously reserved, the Company will recognize incremental period tax expense. These matters are expected to contribute to the tax rate differing from the statutory rate and continued volatility in the Company’s effective tax rate.
See Footnote 16 of the Notes to Consolidated Financial Statements for further information.
Pensions and Postretirement Benefits
The Company records annual amounts relating to its pension and postretirement plans based on calculations, which include various actuarial assumptions, including discount rates, assumed rates of return, compensation increases, turnover rates and health care cost trend rates. The Company reviews its actuarial assumptions on an annual basis and makes modifications to the assumptions based on current rates and trends when it is deemed appropriate to do so. The effect of modifications is generally deferred and amortized over future periods. The Company believes that the assumptions utilized in recording its obligations under its plans are reasonable based on its experience, market conditions and the input from its actuaries and investment advisors. The pension and postretirement obligations are measured as of December 31 for 2016 and 2015.
The Company employs a total return investment approach for its pension and postretirement benefit plans whereby a mix of equities and fixed income investments are used to maximize the long-term return of pension and postretirement plan assets. The intent of this strategy is to minimize plan expenses by outperforming plan liabilities over the long run. Risk tolerance is established through careful consideration of plan liabilities, plan funded status, and corporate financial condition. The investment portfolios contain a diversified blend of equity and fixed-income investments. Furthermore, equity investments are diversified across
52
geography and market capitalization through investments in U.S. large-capitalization stocks, U.S. small-capitalization stocks and international securities. Investment risk is measured and monitored on an ongoing basis through annual liability measurements, periodic asset/liability studies and quarterly investment portfolio reviews.
The expected long-term rate of return for plan assets is based upon many factors including expected asset allocations, historical asset returns, current and expected future market conditions, risk and active management premiums. The target asset allocations for the Company’s domestic pension plans may vary by plan, based in part due to plan demographics, funded status and liability duration. In general, the Company’s target asset allocations for the domestic pension plans are as follows: equities approximately 25% to 40%; bonds approximately 20% to 40%; and cash, alternative investments and other, approximately 25% to 45%. Actual asset allocations may vary from the targeted allocations for various reasons, including market conditions and the timing of transactions. The Company maintains numerous international defined benefit pension plans. The asset allocations for the international investment may vary by plan and jurisdiction and are primarily based upon the plan structure and plan participant profile. At December 31, 2016, the domestic plan assets were allocated as follows: Equities: approximately 37.0% and Other Investments (alternative investments, fixed-income securities, cash and other): approximately 63.0%.
For 2016, 2015 and 2014, the actual return (loss) on plan assets for the Company’s U.S. pension plan assets was approximately $71.0 million, $(14.0) million and $74.0 million, respectively, versus an expected return on plan assets of approximately $69.0 million, $58.0 million and $58.0 million, respectively. The actual amount of future contributions will depend, in part, on long-term actual return on assets and future discount rates. Pension contributions for all of the Company’s pension plans for 2017 are estimated to be approximately $27.0 million, compared to approximately $28.0 million in 2016.
The weighted average expected return on plan assets assumption for 2016 was approximately 5.5% for the Company’s pension plans. The weighted average discount rate at the 2016 measurement date used to measure the pension and postretirement benefit obligations was approximately 3.5%. A 25 basis points decrease in the discount rate at the 2016 measurement date would increase the pension plans’ projected benefit obligation by approximately $71.0 million.
The healthcare cost trend rates used in valuing the Company’s postretirement benefit obligation are established based upon actual healthcare cost trends and consultation with actuaries and benefit providers. At the 2016 measurement date, the current weighted average healthcare cost trend rate assumption was approximately 8.7%. The current healthcare cost trend rate gradually decreases to an ultimate healthcare cost trend rate of 4.5%. A one percentage point change in assumed healthcare cost trend rates would not have a material effect on the postretirement benefit obligation or the service and interest cost components of postretirement benefit costs.
See Footnote 13 of the Notes to Consolidated Financial Statements for additional information regarding the Company’s pension and postretirement benefit plans.
Restructuring
The Company has and expects to continue to engage in restructuring activities, which requires management to utilize significant estimates related to the timing and amount of severance and other employee separation costs for workforce reductions and other separation programs, realizable values of assets made redundant or obsolete, lease cancellation costs, sublease income and other exit costs, including environmental and legal contingencies associated with restructuring activities. The Company accrues for severance and other employee separation costs under these activities when it is probable that benefits will be paid and the amount is reasonably estimable. The rates used in determining severance accruals are based on existing plans, historical experience and previously negotiated settlements. The Company accrues for future lease costs, net of management’s estimate for future sublease income, when the leased property has been vacated and is no longer being used. When estimating the costs of exiting facilities, estimates are made regarding future sublease payments to be received, which can differ materially from actual results and result in additional restructuring costs in future periods. Environmental and legal contingencies associated with restructuring activities are accrued when the liability is probable of being incurred and is estimable. The total restructuring liabilities included in accrued liabilities and other in the Consolidated Balance Sheets as of December 31, 2016 and 2015 were $71.9 million and $67.4 million, respectively. Due to the estimates required for future payments for employee separation programs, vacated leased properties and contingencies, actual amounts paid can differ from these estimates.
Recent Accounting Pronouncements
See Item 8 of Part II, “Financial Statements and Supplementary Data—Footnote 1—Description of Business and Significant Accounting Policies—Recent Accounting Pronouncements.”
53
International Operations
For 2016, 2015 and 2014, the Company’s non-U.S. businesses accounted for approximately 28%, 27% and 31% of net sales, respectively (see Footnote 18 of the Notes to Consolidated Financial Statements).
Forward-Looking Statements
Forward-looking statements in this Report are made in reliance upon the safe harbor provisions of the Private Securities Litigation Reform Act of 1995. Such forward-looking statements may relate to, but are not limited to, information or assumptions about the effects of sales (including pricing), income/(loss), earnings per share, return on equity, return on invested capital, operating income, operating margin or gross margin improvements or declines, Project Renewal, capital and other expenditures, working capital, cash flow, dividends, capital structure, debt to capitalization ratios, debt ratings, availability of financing, interest rates, restructuring and other project costs, impairment and other charges, potential losses on divestitures, impacts of changes in accounting standards, pending legal proceedings and claims (including environmental matters), future economic performance, costs and cost savings, inflation or deflation with respect to raw materials and sourced products, productivity and streamlining, changes in foreign exchange rates, product recalls, expected benefits and synergies and financial results from recently completed acquisitions and planned acquisitions and divestitures and management’s plans, goals and objectives for future operations, performance and growth or the assumptions relating to any of the forward-looking statements. These statements generally are accompanied by words such as “intend,” “anticipate,” “believe,” “estimate,” “project,” “target,” “plan,” “expect,” “will,” “should,” “would” or similar statements. The Company cautions that forward-looking statements are not guarantees because there are inherent difficulties in predicting future results. Actual results could differ materially from those expressed or implied in the forward-looking statements. Important factors that could cause actual results to differ materially from those suggested by the forward-looking statements include, but are not limited to, the Company’s dependence on the strength of retail, commercial and industrial sectors of the economy in light of the continuation of challenging economic conditions, particularly outside of the United States; competition with other manufacturers and distributors of consumer products; major retailers’ strong bargaining power and consolidation of the Company’s customers; the Company’s ability to improve productivity, reduce complexity and streamline operations; the Company’s ability to develop innovative new products and to develop, maintain and strengthen its end-user brands, including the ability to realize anticipated benefits of increased advertising and promotion spend; risks related to the substantial indebtedness that the Company incurred in connection with the Jarden Acquisition; risks related to a potential increase in interest rates; the Company’s ability to complete planned acquisitions and divestitures; difficulties integrating Jarden and other acquisitions and unexpected costs or expenses associated with acquisitions; changes in the prices of raw materials and sourced products and the Company’s ability to obtain raw materials and sourced products in a timely manner from suppliers; the risks inherent in the Company’s foreign operations, including currency fluctuations, exchange controls and pricing restrictions; a failure of one of the Company’s key information technology systems or related controls; future events that could adversely affect the value of the Company’s assets and require impairment charges; United States and foreign regulatory impact on the Company’s operations including environmental remediation costs; the potential inability to attract, retain and motivate key employees; the imposition of tax liabilities greater than the Company’s provisions for such matters; product liability, product recalls or regulatory actions; the Company’s ability to protect its intellectual property rights; changes to the Company’s credit ratings; significant increases in the funding obligations related to the Company’s pension plans due to declining asset values, declining interest rates or otherwise; and those matters set forth in this Report generally, including Item 1A herein. In addition, there can be no assurance that the Company has correctly identified and assessed all of the factors affecting the Company or that the publicly available and other information the Company receives with respect to these factors is complete or correct.
ITEM 7A. QUANTITATIVE AND QUALITATIVE DISCLOSURES ABOUT MARKET RISK
Market Risk
In general, business enterprises can be exposed to market risks including fluctuations in interest rates, foreign currency exchange rates and certain commodity prices, and that can affect the cost of operating, investing and financing under those conditions. The Company believes it has moderate exposure to these risks. The Company assesses market risk based on changes in interest rates, foreign currency rates and commodity prices utilizing a sensitivity analysis that measures the potential loss in earnings, fair values and cash flows based on a hypothetical 10% change in these rates and prices.
The Company is exposed to interest rate risk on its variable rate debt and price risk on its fixed rate debt. As such, the Company monitors the interest rate environment and uses interest rate swap agreements to manage its interest rate risk and price risk by balancing its exposure to fixed and variable interest rates while attempting to minimize interest costs. As of December 31, 2016, approximately $1.2 billion of the Company’s debt carries a variable rate of interest either by nature or through the use of interest rate swaps. The remainder of the debt (approximately $10.7 billion) carries a fixed rate of interest. Based upon the Company’s debt structure at December 31, 2016, a hypothetical 1% increase in these interest rates would increase interest expense by approximately $11.8 million and decrease the fair values of debt by approximately $711.2 million.
54
While the Company transacts business predominantly in U.S. dollars and most of its revenues are collected in U.S. dollars, a substantial portion of the Company’s operating costs are denominated in other currencies, such as the Brazilian Real, British Pound, Canadian dollar, Chinese Renminbi, European Euro, Japanese Yen and Mexican Peso. Changes in the relation of these and other currencies to the U.S. dollar will affect Company’s sales and profitability and could result in exchange losses. For 2016, approximately 28% of the Company’s sales were denominated in foreign currencies, the most significant of which were: European Euro-approximately 9.0%; and Canadian dollar-approximately 5.4%. The primary purpose of the Company’s foreign currency hedging activities is to mitigate the foreign currency exchange rate exposure on the cash flows related to forecasted inventory purchases and sales. A hypothetical 10% change in foreign currency exchange rates would not have a material effect on foreign currency gains and losses related to the foreign currency derivatives or the net fair value of the Company’s foreign currency derivatives.
The Company is exposed to the price risk that the rising cost of commodities has on certain of its raw materials. As such, the Company monitors the commodities markets and from time to time the Company enters into commodity-based derivatives in order to mitigate the impact that the rising price of these commodities has on the cost of certain of the Company’s raw materials. A hypothetical 10% change in the commodity prices underlying the derivatives would not have a material effect on the related gains and losses included in the Company’s results of operations. In this sensitivity analysis, all other assumptions are constant and assumes that a change in one currency’s rate relative to the U.S. dollar would not impact another currency’s rates relative to the U.S. dollar.
The Company is exposed to credit loss in the event of non-performance by the counterparties to its derivative financial instruments, all of which are highly rated institutions; however, the Company does not anticipate non-performance by such counterparties.
The Company does not enter into derivative financial instruments for trading purposes.
55
ITEM 8. FINANCIAL STATEMENTS AND SUPPLEMENTARY DATA
MANAGEMENT’S REPORT ON INTERNAL CONTROL OVER FINANCIAL REPORTING
The Company’s management is responsible for establishing and maintaining adequate internal control over financial reporting. Newell Brands Inc. internal control over financial reporting is designed to provide reasonable assurance regarding the reliability of financial reporting and the preparation of financial statements for external purposes in accordance with generally accepted accounting principles. Because of its inherent limitations, internal control over financial reporting may not prevent or detect misstatements. Also, projections of any evaluation of effectiveness to future periods are subject to the risk that controls may become inadequate because of changes in conditions, or that the degree of compliance with the policies or procedures may deteriorate.
The Company’s management assessed the effectiveness of the Company’s internal control over financial reporting as of December 31, 2016. In making its assessment, the Company’s management used the criteria set forth by the Committee of Sponsoring Organizations of the Treadway Commission (COSO) in Internal Control-Integrated Framework (2013). Based on the results of its evaluation, the Company’s management concluded that, as of December 31, 2016, the Company’s internal control over financial reporting is effective based on those criteria.
The Company completed its acquisition of Jarden Corporation (“Jarden”) in a purchase business combination on April 15, 2016. Management’s assessment did not include the internal control over financial reporting of Jarden. Jarden is a wholly-owned subsidiary whose total assets and net sales excluded from management’s assessment constituted approximately 15% of the Company’s total assets as of December 31, 2016, and approximately 55% of the Company’s net sales for the year ended December 31, 2016.
The Company’s independent registered public accounting firm, PricewaterhouseCoopers LLP, has audited the consolidated financial statements of Newell Brands Inc. as of and for the year ended December 31, 2016 and the effectiveness of Newell Brands Inc.’s internal control over financial reporting as of December 31, 2016. Their integrated audit report is presented herein.
NEWELL BRANDS INC. |
Hoboken, New Jersey |
March 1, 2017 |
56
REPORT OF INDEPENDENT REGISTERED PUBLIC ACCOUNTING FIRM
To the Board of Directors and Stockholders of Newell Brands Inc.
In our opinion, the accompanying consolidated balance sheet as of December 31, 2016 and the related consolidated statements of operations, comprehensive income, stockholders’ equity and cash flows for the year then ended present fairly, in all material respects, the financial position of Newell Brands Inc. and its subsidiaries as of December 31, 2016, and the results of their operations and their cash flows for the year then ended in conformity with accounting principles generally accepted in the United States of America. In addition, in our opinion, the financial statement schedule as of and for the year ended December 31, 2016 listed in the index appearing under Item 15(a)(2) presents fairly, in all material respects, the information set forth therein when read in conjunction with the related consolidated financial statements. Also in our opinion, the Company maintained, in all material respects, effective internal control over financial reporting as of December 31, 2016, based on criteria established in Internal Control-Integrated Framework (2013) issued by the Committee of Sponsoring Organizations of the Treadway Commission (COSO). The Company’s management is responsible for these financial statements and financial statement schedule, for maintaining effective internal control over financial reporting and for its assessment of the effectiveness of internal control over financial reporting, included in the accompanying Management’s Report on Internal Control Over Financial Reporting. Our responsibility is to express opinions on these financial statements, on the financial statement schedule, and on the Company’s internal control over financial reporting based on our integrated audit. We conducted our audit in accordance with the standards of the Public Company Accounting Oversight Board (United States). Those standards require that we plan and perform the audit to obtain reasonable assurance about whether the financial statements are free of material misstatement and whether effective internal control over financial reporting was maintained in all material respects. Our audit of the financial statements included examining, on a test basis, evidence supporting the amounts and disclosures in the financial statements, assessing the accounting principles used and significant estimates made by management, and evaluating the overall financial statement presentation. Our audit of internal control over financial reporting included obtaining an understanding of internal control over financial reporting, assessing the risk that a material weakness exists, and testing and evaluating the design and operating effectiveness of internal control based on the assessed risk. Our audit also included performing such other procedures as we considered necessary in the circumstances. We believe that our audit provides a reasonable basis for our opinions.
A company’s internal control over financial reporting is a process designed to provide reasonable assurance regarding the reliability of financial reporting and the preparation of financial statements for external purposes in accordance with generally accepted accounting principles. A company’s internal control over financial reporting includes those policies and procedures that (i) pertain to the maintenance of records that, in reasonable detail, accurately and fairly reflect the transactions and dispositions of the assets of the company; (ii) provide reasonable assurance that transactions are recorded as necessary to permit preparation of financial statements in accordance with generally accepted accounting principles, and that receipts and expenditures of the company are being made only in accordance with authorizations of management and directors of the company; and (iii) provide reasonable assurance regarding prevention or timely detection of unauthorized acquisition, use, or disposition of the company’s assets that could have a material effect on the financial statements.
Because of its inherent limitations, internal control over financial reporting may not prevent or detect misstatements. Also, projections of any evaluation of effectiveness to future periods are subject to the risk that controls may become inadequate because of changes in conditions, or that the degree of compliance with the policies or procedures may deteriorate.
As described in Management’s Report on Internal Control Over Financial Reporting, management has excluded Jarden Corporation from its assessment of internal control over financial reporting as of December 31, 2016 because it was acquired by the Company in a purchase business combination during 2016. We have also excluded Jarden Corporation from our audit of internal control over financial reporting. Jarden Corporation is a wholly-owned subsidiary whose total assets and total net sales represent approximately 15% and 55%, respectively, of the related consolidated financial statement amounts as of and for the year ended December 31, 2016.
/s/ PricewaterhouseCoopers LLP | |
New York, New York | |
March 1, 2017 | |
57
REPORT OF INDEPENDENT REGISTERED PUBLIC ACCOUNTING FIRM
The Board of Directors and Stockholders of Newell Brands Inc. (formerly Newell Rubbermaid Inc.)
We have audited the accompanying consolidated balance sheet of Newell Brands Inc. and subsidiaries as of December 31, 2015, and the related consolidated statements of operations, comprehensive income, stockholders’ equity, and cash flows for the years ended December 31, 2015 and 2014. Our audits also included the financial statement schedule listed in the Index at Item 15(a)(2) for the years ended December 31, 2015 and 2014. These financial statements and schedule are the responsibility of the Company’s management. Our responsibility is to express an opinion on these financial statements and schedule based on our audits.
We conducted our audits in accordance with the standards of the Public Company Accounting Oversight Board (United States). Those standards require that we plan and perform the audit to obtain reasonable assurance about whether the financial statements are free of material misstatement. An audit includes examining, on a test basis, evidence supporting the amounts and disclosures in the financial statements. An audit also includes assessing the accounting principles used and significant estimates made by management, as well as evaluating the overall financial statement presentation. We believe that our audits provide a reasonable basis for our opinion.
In our opinion, the financial statements referred to above present fairly, in all material respects, the consolidated financial position of Newell Brands Inc. and subsidiaries at December 31, 2015, and the consolidated results of their operations and their cash flows for the years ended December 31, 2015 and 2014, in conformity with U.S. generally accepted accounting principles. Also, in our opinion, the related financial statement schedule for the years ended December 31, 2015 and 2014, when considered in relation to the basic financial statements taken as a whole, presents fairly in all material respects the information set forth therein.
/s/ Ernst & Young LLP | |
Atlanta, Georgia | |
February 29, 2016 | |
58
NEWELL BRANDS INC. AND SUBSIDIARIES
CONSOLIDATED STATEMENTS OF OPERATIONS
(Amounts in millions, except per share data)
Year Ended December 31, | 2016 | 2015 | 2014 | ||||||||
Net sales | $ | 13,264.0 | $ | 5,915.7 | $ | 5,727.0 | |||||
Cost of products sold | 8,865.2 | 3,611.1 | 3,523.6 | ||||||||
GROSS PROFIT | 4,398.8 | 2,304.6 | 2,203.4 | ||||||||
Selling, general and administrative expenses | 3,221.1 | 1,573.9 | 1,480.5 | ||||||||
Pension settlement charge | 2.7 | 52.1 | 65.4 | ||||||||
Restructuring costs, net | 74.9 | 77.2 | 52.8 | ||||||||
OPERATING INCOME | 1,100.1 | 601.4 | 604.7 | ||||||||
Nonoperating expenses: | |||||||||||
Interest expense, net | 404.5 | 79.9 | 60.4 | ||||||||
Loss related to extinguishment of debt/credit facility | 47.6 | — | 33.2 | ||||||||
Venezuela deconsolidation charge | — | 172.7 | — | ||||||||
Other (income) expense, net | (166.5 | ) | 11.3 | 49.0 | |||||||
Net nonoperating expenses | 285.6 | 263.9 | 142.6 | ||||||||
INCOME BEFORE INCOME TAXES | 814.5 | 337.5 | 462.1 | ||||||||
Income tax expense | 286.0 | 78.2 | 89.1 | ||||||||
INCOME FROM CONTINUING OPERATIONS | 528.5 | 259.3 | 373.0 | ||||||||
(Loss) income from discontinued operations, net of tax | (0.7 | ) | 90.7 | 4.8 | |||||||
NET INCOME | $ | 527.8 | $ | 350.0 | $ | 377.8 | |||||
Weighted average shares outstanding: | |||||||||||
Basic | 421.3 | 269.3 | 276.1 | ||||||||
Diluted | 423.1 | 271.5 | 278.9 | ||||||||
Earnings per share: | |||||||||||
Basic: | |||||||||||
Income from continuing operations | $ | 1.25 | $ | 0.96 | $ | 1.35 | |||||
Income from discontinued operations | — | 0.34 | 0.02 | ||||||||
Net income | $ | 1.25 | $ | 1.30 | $ | 1.37 | |||||
Diluted: | |||||||||||
Income from continuing operations | $ | 1.25 | $ | 0.96 | $ | 1.34 | |||||
Income from discontinued operations | — | 0.33 | 0.02 | ||||||||
Net income | $ | 1.25 | $ | 1.29 | $ | 1.35 | |||||
Dividends per share | $ | 0.76 | $ | 0.76 | $ | 0.66 | |||||
See Notes to Consolidated Financial Statements.
59
NEWELL BRANDS INC. AND SUBSIDIARIES
CONSOLIDATED STATEMENTS OF COMPREHENSIVE INCOME
(Amounts in millions)
Year Ended December 31, | 2016 | 2015 | 2014 | ||||||||
NET INCOME | $ | 527.8 | $ | 350.0 | $ | 377.8 | |||||
Other comprehensive (loss) income, net of tax: | |||||||||||
Foreign currency translation adjustments | (196.2 | ) | (123.9 | ) | (126.3 | ) | |||||
Change in unrecognized pension and postretirement costs | 22.3 | 89.4 | (28.4 | ) | |||||||
Derivative hedging gain (loss) | (37.1 | ) | (4.9 | ) | 5.5 | ||||||
Total other comprehensive (loss), net of tax | (211.0 | ) | (39.4 | ) | (149.2 | ) | |||||
COMPREHENSIVE INCOME (1) | $ | 316.8 | $ | 310.6 | $ | 228.6 | |||||
(1) Comprehensive income attributable to noncontrolling interests was not material.
See Notes to Consolidated Financial Statements.
60
NEWELL BRANDS INC. AND SUBSIDIARIES
CONSOLIDATED BALANCE SHEETS
(Amounts in millions, except par values)
December 31, | 2016 | 2015 | |||||
ASSETS | |||||||
CURRENT ASSETS: | |||||||
Cash and cash equivalents | $ | 587.5 | $ | 274.8 | |||
Accounts receivable, net of allowances of $38.5 for 2016 and $22.0 for 2015 | 2,746.9 | 1,250.7 | |||||
Inventories, net | 2,116.0 | 721.8 | |||||
Prepaid expenses and other | 288.4 | 147.8 | |||||
Assets held for sale | 1,745.7 | 98.4 | |||||
TOTAL CURRENT ASSETS | 7,484.5 | 2,493.5 | |||||
PROPERTY, PLANT AND EQUIPMENT, NET | 1,543.4 | 599.2 | |||||
GOODWILL | 10,218.9 | 2,791.2 | |||||
OTHER INTANGIBLE ASSETS, NET | 14,111.8 | 1,063.7 | |||||
DEFERRED INCOME TAXES | 95.3 | 38.5 | |||||
OTHER ASSETS | 383.6 | 273.4 | |||||
TOTAL ASSETS | $ | 33,837.5 | $ | 7,259.5 | |||
LIABILITIES AND STOCKHOLDERS’ EQUITY | |||||||
CURRENT LIABILITIES: | |||||||
Accounts payable | $ | 1,518.9 | $ | 642.4 | |||
Accrued compensation | 365.8 | 185.2 | |||||
Other accrued liabilities | 1,464.9 | 728.9 | |||||
Short-term debt and current portion of long-term debt | 601.9 | 388.8 | |||||
Liabilities held for sale | 340.5 | 43.3 | |||||
TOTAL CURRENT LIABILITIES | 4,292.0 | 1,988.6 | |||||
LONG-TERM DEBT | 11,290.9 | 2,669.1 | |||||
DEFERRED INCOME TAXES | 5,082.8 | 226.6 | |||||
OTHER NONCURRENT LIABILITIES | 1,787.4 | 548.8 | |||||
COMMITMENTS AND CONTINGENCIES (Footnote 12) | — | — | |||||
STOCKHOLDERS’ EQUITY: | |||||||
Preferred stock, authorized shares, 10.0 at $1.00 par value | — | — | |||||
None issued and outstanding | |||||||
Common stock, authorized shares, 800.0 at $1.00 par value | 504.8 | 287.5 | |||||
Outstanding shares, before treasury: | |||||||
2016 – 504.8 | |||||||
2015 – 287.5 | |||||||
Treasury stock, at cost: | (545.3 | ) | (523.1 | ) | |||
Shares held: | |||||||
2016 – 22.3 | |||||||
2015 – 20.3 | |||||||
Additional paid-in capital | 10,144.2 | 801.4 | |||||
Retained earnings | 2,289.9 | 2,090.9 | |||||
Accumulated other comprehensive loss | (1,044.8 | ) | (833.8 | ) | |||
STOCKHOLDERS’ EQUITY ATTRIBUTABLE TO PARENT | 11,348.8 | 1,822.9 | |||||
STOCKHOLDERS’ EQUITY ATTRIBUTABLE TO NONCONTROLLING INTERESTS | 35.6 | 3.5 | |||||
TOTAL STOCKHOLDERS’ EQUITY | 11,384.4 | 1,826.4 | |||||
TOTAL LIABILITIES AND STOCKHOLDERS’ EQUITY | $ | 33,837.5 | $ | 7,259.5 | |||
See Notes to Consolidated Financial Statements.
61
NEWELL BRANDS INC. AND SUBSIDIARIES
CONSOLIDATED STATEMENTS OF CASH FLOWS
(Amounts in millions)
Year Ended December 31, | 2016 | 2015 | 2014 | ||||||||
OPERATING ACTIVITIES: | |||||||||||
Net income | $ | 527.8 | $ | 350.0 | $ | 377.8 | |||||
Adjustments to reconcile net income to net cash provided by operating activities: | |||||||||||
Depreciation and amortization | 437.2 | 171.6 | 156.1 | ||||||||
Net gain from sale of businesses | (161.1 | ) | (154.2 | ) | (2.2 | ) | |||||
Loss related to extinguishment of debt/credit facility | 47.6 | — | 33.2 | ||||||||
Non-cash restructuring costs | 23.7 | 6.7 | 7.2 | ||||||||
Deferred income taxes | 33.4 | (7.2 | ) | 39.3 | |||||||
Stock-based compensation expense | 63.9 | 29.2 | 29.9 | ||||||||
Pension settlement charge | 2.7 | 52.1 | 65.4 | ||||||||
Venezuela deconsolidation charge | — | 172.7 | — | ||||||||
Other, net | 21.0 | 32.5 | 69.1 | ||||||||
Changes in operating assets and liabilities, excluding the effects of acquisitions and divestitures: | |||||||||||
Accounts receivable | (324.5 | ) | (33.8 | ) | (140.9 | ) | |||||
Inventories | 784.6 | (97.8 | ) | (28.2 | ) | ||||||
Accounts payable | 282.0 | 20.3 | 87.3 | ||||||||
Accrued liabilities and other | 90.2 | 23.7 | (59.9 | ) | |||||||
NET CASH PROVIDED BY OPERATING ACTIVITIES | 1,828.5 | 565.8 | 634.1 | ||||||||
INVESTING ACTIVITIES: | |||||||||||
Proceeds from sale of divested businesses and fixed assets | 247.8 | 214.8 | 19.0 | ||||||||
Acquisitions and acquisition-related activity, net of cash | (8,635.2 | ) | (573.7 | ) | (602.3 | ) | |||||
Capital expenditures | (441.4 | ) | (211.4 | ) | (161.9 | ) | |||||
Cash related to deconsolidated Venezuela operations | — | (97.5 | ) | — | |||||||
Other investing activities | 4.0 | 17.9 | (6.7 | ) | |||||||
NET CASH USED IN INVESTING ACTIVITIES | (8,824.8 | ) | (649.9 | ) | (751.9 | ) | |||||
FINANCING ACTIVITIES: | |||||||||||
Net short-term borrowings | (641.4 | ) | (57.0 | ) | 217.3 | ||||||
Proceeds from issuance of debt, net of debt issuance costs | 9,414.6 | 594.6 | 841.8 | ||||||||
Payments on and for the settlement of notes payable and debt | (1,100.0 | ) | — | (465.2 | ) | ||||||
Repurchase and retirement of shares of common stock | — | (180.4 | ) | (363.2 | ) | ||||||
Cash dividends | (328.6 | ) | (206.3 | ) | (182.5 | ) | |||||
Excess tax benefits related to stock-based compensation | 11.9 | 27.1 | 10.6 | ||||||||
Repurchase of restricted shares net of option proceeds and other | (16.1 | ) | (5.7 | ) | 60.7 | ||||||
Other, net | — | — | (0.5 | ) | |||||||
NET CASH PROVIDED BY FINANCING ACTIVITIES | 7,340.4 | 172.3 | 119.0 | ||||||||
Exchange rate effect on cash and cash equivalents | (31.4 | ) | (12.8 | ) | (28.1 | ) | |||||
INCREASE IN CASH AND CASH EQUIVALENTS | 312.7 | 75.4 | (26.9 | ) | |||||||
Cash and cash equivalents at beginning of period | 274.8 | 199.4 | 226.3 | ||||||||
CASH AND CASH EQUIVALENTS AT END OF PERIOD | $ | 587.5 | $ | 274.8 | $ | 199.4 | |||||
Supplemental cash flow disclosures — cash paid during the year for: | |||||||||||
Common stock issued for Jarden Acquisition | $ | 9,480.3 | $ | — | $ | — | |||||
Debt assumed, at fair value, in the Jarden Acquisition | 1,198.7 | — | — | ||||||||
Income taxes, net of refunds | 189.2 | 54.7 | 33.8 | ||||||||
Interest | 316.0 | 82.9 | 56.7 | ||||||||
See Notes to Consolidated Financial Statements.
62
NEWELL BRANDS INC. AND SUBSIDIARIES
CONSOLIDATED STATEMENTS OF STOCKHOLDERS’ EQUITY
(Amounts in millions)
Common Stock | Treasury Stock | Additional Paid-In Capital | Retained Earnings | Accumulated Other Comprehensive Loss | Stockholders’ Equity Attributable to Parent | Non-controlling Interests | Total Stockholders’ Equity | |||||||||||||||||||||||||
Balance at December 31, 2013 | $ | 297.5 | $ | (477.2 | ) | $ | 654.3 | $ | 2,242.1 | $ | (645.2 | ) | $ | 2,071.5 | $ | 3.5 | $ | 2,075.0 | ||||||||||||||
Comprehensive income | — | — | — | 377.8 | (149.2 | ) | 228.6 | — | 228.6 | |||||||||||||||||||||||
Cash dividends on common stock | — | — | — | (182.5 | ) | — | (182.5 | ) | — | (182.5 | ) | |||||||||||||||||||||
Stock-based compensation and other | 4.5 | (15.9 | ) | 109.7 | (1.3 | ) | — | 97.0 | — | 97.0 | ||||||||||||||||||||||
Common stock purchased and retired | (13.3 | ) | — | (25.0 | ) | (324.9 | ) | — | (363.2 | ) | — | (363.2 | ) | |||||||||||||||||||
Balance at December 31, 2014 | $ | 288.7 | $ | (493.1 | ) | $ | 739.0 | $ | 2,111.2 | $ | (794.4 | ) | $ | 1,851.4 | $ | 3.5 | $ | 1,854.9 | ||||||||||||||
Comprehensive income | — | — | — | 350.0 | (39.4 | ) | 310.6 | — | 310.6 | |||||||||||||||||||||||
Cash dividends on common stock | — | — | — | (206.3 | ) | — | (206.3 | ) | — | (206.3 | ) | |||||||||||||||||||||
Stock-based compensation and other | 3.3 | (30.0 | ) | 74.2 | 0.1 | — | 47.6 | — | 47.6 | |||||||||||||||||||||||
Common stock purchased and retired | (4.5 | ) | — | (11.8 | ) | (164.1 | ) | — | (180.4 | ) | — | (180.4 | ) | |||||||||||||||||||
Balance at December 31, 2015 | $ | 287.5 | $ | (523.1 | ) | $ | 801.4 | $ | 2,090.9 | $ | (833.8 | ) | $ | 1,822.9 | $ | 3.5 | $ | 1,826.4 | ||||||||||||||
Comprehensive income | — | — | — | 527.8 | (211.0 | ) | 316.8 | — | 316.8 | |||||||||||||||||||||||
Cash dividends on common stock | — | — | — | (328.6 | ) | — | (328.6 | ) | — | (328.6 | ) | |||||||||||||||||||||
Stock-based compensation and other | 3.4 | (22.2 | ) | 76.4 | (0.2 | ) | — | 57.4 | 32.1 | 89.5 | ||||||||||||||||||||||
Equity issued for acquisition | 213.9 | — | 9,266.4 | — | — | 9,480.3 | — | 9,480.3 | ||||||||||||||||||||||||
Balance at December 31, 2016 | $ | 504.8 | $ | (545.3 | ) | $ | 10,144.2 | $ | 2,289.9 | $ | (1,044.8 | ) | $ | 11,348.8 | $ | 35.6 | $ | 11,384.4 | ||||||||||||||
See Notes to Consolidated Financial Statements.
63
NEWELL BRANDS INC. AND SUBSIDIARIES
NOTES TO CONSOLIDATED FINANCIAL STATEMENTS
FOOTNOTE 1
Description of Business and Significant Accounting Policies
Description of Business
Newell Brands is a global marketer of consumer and commercial products that help people get more out of life every day, where they live, learn, work and play. Our products are marketed under a strong portfolio of leading brands, including Paper Mate®, Sharpie®, Dymo®, Expo®, Parker®, Elmer’s®, Coleman®, Jostens®, Marmot®, Rawlings®, Irwin®, Lenox®, Oster®, Sunbeam®, FoodSaver®, Mr. Coffee®, Rubbermaid Commercial Products®, Graco®, Baby Jogger®, NUK®, Calphalon®, Rubbermaid®, Contigo®, First Alert®, Waddington and Yankee Candle®. The Company’s multi-product offering consists of well-known, name brand consumer and commercial products in nine business segments: Writing, Home Solutions, Tools, Commercial Products, Baby & Parenting, Branded Consumables, Consumer Solutions, Outdoor Solutions and Process Solutions.
During 2014, the Company’s Endicia® and Culinary electrics and retail businesses were classified as discontinued operations based on the Company’s commitment in 2014 to sell the businesses. The Company completed the sale of Endicia in November 2015 and ceased operations in its Culinary electrics and retail businesses in the first quarter of 2015.
Principles of Consolidation
The consolidated financial statements include the accounts of the Company, its majority-owned subsidiaries and variable interest entities where the Company is the primary beneficiary, after elimination of intercompany transactions and balances.
Use of Estimates
The preparation of these consolidated financial statements requires the use of certain estimates by management in determining the Company’s assets, liabilities, sales and expenses, and related disclosures. Actual results could differ from those estimates.
Other Items
The Company holds a 29% investment in Sprue Aegis (“Sprue”). During the year ended December 31, 2016, the Company’s related party sales to Sprue were $23.2 million.
During the year ended December 31, 2016, the income attributable to noncontrolling interests was $2.0 million.
Concentration of Credit Risk
The Company sells products to customers in diversified industries and geographic regions and, therefore, has no significant concentrations of credit risk. The Company continuously evaluates the creditworthiness of its customers and generally does not require collateral.
The Company evaluates the collectibility of accounts receivable based on a combination of factors. When aware of a specific customer’s inability to meet its financial obligations, such as in the case of bankruptcy filings or deterioration in the customer’s operating results or financial position, the Company records a specific reserve for bad debt to reduce the related receivable to the amount the Company reasonably believes is collectible. The Company also records reserves for bad debt for all other customers based on a variety of factors, including the length of time the receivables are past due and historical collection experience. Accounts are also reviewed for potential write-off on a case-by-case basis. Accounts deemed uncollectible are written off, net of expected recoveries. If circumstances related to specific customers change, the Company’s estimates of the recoverability of receivables could be further adjusted.
The Company’s forward exchange contracts do not subject the Company to risk due to foreign exchange rate movement, because gains and losses on these instruments generally offset gains and losses on the assets, liabilities and other transactions being hedged. The Company is exposed to credit-related losses in the event of non-performance by counterparties to certain derivative financial instruments. The Company does not obtain collateral or other security to support derivative financial instruments subject to credit risk, but monitors the credit standing of the counterparties.
Sales Recognition and Customer Programs
Sales of merchandise and freight billed to customers are recognized when title passes and all substantial risks of ownership change, which generally occurs either upon shipment or upon delivery based upon contractual terms. Sales are net of provisions for cash
64
discounts, returns, customer discounts (such as volume or trade discounts), cooperative advertising and other sales-related discounts and programs.
Under customer programs and arrangements that require sales incentives to be paid in advance, the Company amortizes the amount paid over the period of benefit or contractual sales volume. When incentives are paid in arrears, the Company accrues the estimated amount to be paid based on the program’s contractual terms, expected customer performance and/or estimated sales volume. The aggregate cost of customer discounts (primarily volume discounts) and cooperative advertising, which are included as a reduction in net sales, was $1,144.3 million, $659.3 million and $594.2 million in 2016, 2015 and 2014, respectively.
The Company sells gift cards to customers in its retail stores, third-party retail stores and through consumer direct operations. Gift cards do not have an expiration date. At the point of sale of a gift card, the Company records deferred revenue. Gift card revenue is recognized when the gift card is redeemed by the customer or the likelihood of the gift card being redeemed by the customer is remote (“gift card breakage”). Gift card breakage income is recognized in proportion to the actual redemption of gift cards based on the Company's historical redemption pattern and is included in net sales in the Company’s consolidated statements of operations.
Cash and Cash Equivalents
Cash and cash equivalents include cash on hand and highly liquid investments that have a maturity of three months or less when purchased.
Inventories
Inventories are stated at the lower of cost or market value using the last-in, first-out (LIFO) or first-in, first-out (FIFO) methods (see Footnote 6 for additional information). The Company reduces its inventory value for estimated obsolete and slow-moving inventory in an amount equal to the difference between the cost of inventory and the net realizable value based upon estimates about future demand and market conditions. As of December 31, 2016 and 2015, the Company’s reserves for excess and obsolete inventory and shrink totaled $45.9 million and $32.9 million, respectively. If actual market conditions are less favorable than those projected by management, additional inventory write-downs may be required.
Property, Plant and Equipment
Property, plant and equipment are stated at cost. Expenditures for maintenance and repairs are expensed as incurred. Depreciation expense is calculated principally on the straight-line basis. Useful lives determined by the Company are as follows: buildings and improvements (20-40 years) and machinery and equipment (3-15 years).
Goodwill and Other Indefinite-Lived Intangible Assets
The Company conducts its annual test for impairment of goodwill and indefinite-lived intangible assets in the third quarter because it coincides with its annual strategic planning process.
The Company evaluates goodwill for impairment annually at the reporting unit level. The Company also tests for impairment if events and circumstances indicate that it is more likely than not that the fair value of a reporting unit is below its carrying amount. If the carrying amount of the reporting unit is greater than the fair value, impairment may be present. The Company assesses the fair value of each reporting unit for its goodwill impairment test based on a discounted cash flow model, an earnings multiple or an actual sales offer received from a prospective buyer, if available. Estimates critical to the Company’s fair value estimates using earnings multiples include the projected financial performance of the reporting unit and the applicable earnings multiple. Estimates critical to the Company’s fair value estimates under the discounted cash flow model include projected financial performance and cash flows of the reporting unit, the discount rate, long-term sales growth rate, product costs and the working capital investment required.
The Company measures the amount of any goodwill impairment based upon the estimated fair value of the underlying assets and liabilities of the reporting unit, including any unrecognized intangible assets, and estimates the implied fair value of goodwill. An impairment charge is recognized to the extent the recorded goodwill exceeds the implied fair value of goodwill.
The Company evaluates indefinite-lived intangible assets (primarily trademarks and trade names) for impairment annually. The Company also tests for impairment if events and circumstances indicate that it is more likely than not that the fair value of an indefinite-lived intangible asset is below its carrying amount. Estimates critical to the Company’s evaluation of indefinite-lived intangible assets for impairment include the discount rate, royalty rates used in its evaluation of trade names, projected average revenue growth and projected long-term growth rates in the determination of terminal values. An impairment charge is recorded if the carrying amount of an indefinite-lived intangible asset exceeds the estimated fair value on the measurement date.
See Footnote 8 for additional detail on goodwill and other intangible assets.
65
Other Long-Lived Assets
The Company tests its other long-lived assets for impairment in accordance with relevant authoritative guidance. The Company evaluates if impairment indicators related to its property, plant and equipment and other long-lived assets are present. These impairment indicators may include a significant decrease in the market price of a long-lived asset or asset group, a significant adverse change in the extent or manner in which a long-lived asset or asset group is being used or in its physical condition, or a current period operating or cash flow loss combined with a history of operating or cash flow losses or a forecast that demonstrates continuing losses associated with the use of a long-lived asset or asset group. If impairment indicators are present, the Company estimates the future cash flows for the asset or group of assets. The sum of the undiscounted future cash flows attributable to the asset or group of assets is compared to their carrying amount. The cash flows are estimated utilizing various projections of sales and expenses, working capital and proceeds from asset disposals on a basis consistent with the strategic plan. If the carrying amount exceeds the sum of the undiscounted future cash flows, the Company determines the assets’ fair value by discounting the future cash flows using a discount rate required for a similar investment of like risk and records an impairment charge as the difference between the fair value and the carrying value of the asset group. Generally, the Company performs its testing of the asset group at the product-line level, as this is the lowest level for which identifiable cash flows are available.
Shipping and Handling Costs
The Company records shipping and handling costs as a component of cost of products sold.
Product Liability Reserves
The Company has a self-insurance program for product liability that includes reserves for self-retained losses and certain excess and aggregate risk transfer insurance. The Company uses historical loss experience combined with actuarial evaluation methods, review of significant individual files and the application of risk transfer programs in determining required product liability reserves. The Company’s actuarial evaluation methods take into account claims incurred but not reported when determining the Company’s product liability reserve. While the Company believes that it has adequately reserved for these claims, the ultimate outcome of these matters may exceed the amounts recorded by the Company, and such additional losses may be material to the Company’s Consolidated Financial Statements.
Product Warranties
In the normal course of business, the Company offers warranties for a variety of its products. The specific terms and conditions of the warranties vary depending upon the specific product and markets in which the products were sold. The Company accrues for the estimated cost of product warranty at the time of sale based on historical experience.
Advertising Costs
The Company expenses production costs of print, radio, television and other advertisements as of the first date the advertisements take place, and the Company expenses all other advertising and marketing costs when incurred. Advertising and promotion costs are recorded in selling, general and administrative expenses and totaled $431.0 million, $213.9 million and $188.5 million in 2016, 2015 and 2014, respectively.
Research and Development Costs
Research and development costs relating to both future and current products are charged to selling, general and administrative expenses as incurred. These costs totaled $188.2 million, $112.6 million and $107.5 million in 2016, 2015 and 2014, respectively.
Derivative Financial Instruments
Derivative financial instruments are generally used to manage certain commodity, interest rate and foreign currency risks. These instruments primarily include interest rate swaps, forward starting interest rate swaps, forward exchange contracts and options. The Company’s forward exchange contracts and options do not subject the Company to exchange rate risk because gains and losses on these instruments generally offset gains and losses on the assets, liabilities and other transactions being hedged. However, these instruments, when settled, impact the Company’s cash flows from operations to the extent the underlying transaction being hedged is not simultaneously settled due to an extension, a renewal or otherwise.
On the date when the Company enters into a derivative, the derivative is designated as a hedge of the identified exposure. The Company measures effectiveness of its hedging relationships both at hedge inception and on an ongoing basis.
66
Foreign Currency Operations
Assets and liabilities of foreign subsidiaries are translated into U.S. Dollars at the rates of exchange in effect at year-end. The related translation adjustments are made directly to accumulated other comprehensive income (loss). Income and expenses are translated at the average monthly rates of exchange in effect during the year. Foreign currency transaction gains and losses are included in the results of operations and are generally classified in Other (income) expense, net, in the Consolidated Statement of Operations. Foreign currency transaction net losses for 2016, 2015 and 2014 were $2.2 million, $17.9 million and $48.9 million, respectively. International subsidiaries operating in highly inflationary economies remeasure nonmonetary assets at historical rates, while net monetary assets are remeasured at current rates, with the resulting remeasurement adjustment included in net income (loss) as other expense, net.
The Company designates certain foreign currency denominated, long-term intercompany financing transactions as being of a long-term investment nature and records gains and losses on the transactions arising from changes in exchange rates as translation adjustments.
Venezuelan Operations
Until December 31, 2015, the Company accounted for its Venezuelan operations using highly inflationary accounting, and therefore, the Company remeasured assets, liabilities, sales and expenses denominated in Bolivar Fuertes (“Bolivars”) into U.S. Dollars using the applicable exchange rate, and the resulting translation adjustments were included in earnings. As of December 31, 2015, the Company determined it could no longer exercise control over its Venezuela operations because the availability of U.S. Dollars had declined significantly over the past several years in each of Venezuela’s three exchange mechanisms. As a result, the Company deconsolidated its Venezuelan operations.
Prior to the deconsolidation of the Venezuela operations on December 31, 2015, the results of the Company’s Venezuelan operations have been included in the Company’s Consolidated Statements of Operations for 2015 and all prior periods. As of December 31, 2015, the Company began accounting for its investment in its Venezuelan operations using the cost method of accounting, and the cost basis was adjusted to nil as of December 31, 2015.
During the years ended December 31, 2015 and 2014, the Venezuelan operations generated 2.2% and 1.4% of consolidated net sales, respectively and $51.1 million and $30.0 million of the Company’s reported annual operating income, respectively.
As a result of deconsolidating its Venezuelan operations, the Company recorded a charge of $172.7 million in 2015. The charge consisted of the write-off of the Company’s Venezuelan operations’ net assets of $74.7 million, as well as $58.3 million of Venezuela receivable-related assets held by other subsidiaries, resulting in $133.0 million of total charges associated with the deconsolidation of Venezuela’s net assets. In addition, in accordance with applicable accounting standards for foreign currency and the transition to the cost method for Venezuela’s operations, the Company was required to write-off the currency translation adjustment that arose prior to the application of hyperinflationary accounting in 2010 that was included in other comprehensive loss in equity. The write-off of the currency translation adjustment resulted in a pre-tax charge of $39.7 million.
The Company plans to continue operating its business in Venezuela. Since the Company holds all of the equity interests but does not have the power to direct the activities that most significantly affect the Venezuela entity’s economic performance, the Company considers the Venezuela entity a variable interest entity for which the Company is not the primary beneficiary. The Company has determined that the Venezuela entity’s assets can only be used to settle its obligations. As of December 31, 2016, the Company has no outstanding exposures or commitments with respect to its Venezuelan operations. Further, dividends and payments for intercompany receivables due from the Company’s Venezuelan operations will be recorded as other income upon receipt.
Income Taxes
The Company accounts for deferred income taxes using the asset and liability approach. Under this approach, deferred income taxes are recognized based on the tax effects of temporary differences between the financial statement and tax bases of assets and liabilities, as measured by current enacted tax rates. Valuation allowances are recorded to reduce the deferred tax assets to an amount that will more likely than not be realized. No provision is made for the U.S. income taxes on the undistributed earnings of non-U.S. subsidiaries that are considered to be permanently invested.
The Company’s income tax provisions are based on calculations and assumptions that are subject to examination by various worldwide tax authorities. Although the Company believes that the positions taken on previously filed tax returns are reasonable, it has established tax, interest and penalty reserves in recognition that various taxing authorities may challenge the positions taken, which could result in additional liabilities for taxes, interest and penalties. The Company regularly reviews its deferred tax assets for recoverability considering historical profitability, projected future taxable income, the expected timing of the reversals of existing temporary differences and tax planning strategies.
67
The authoritative guidance requires application of a “more likely than not” threshold to the recognition and derecognition of tax positions. The Company’s ongoing assessments of the more likely than not outcomes of tax authority examinations and related tax positions require significant judgment and can increase or decrease the Company’s effective tax rate, as well as impact operating results.
Stock-Based Compensation
Stock-based compensation expense is adjusted for estimated forfeitures and is recognized on a straight-line basis over the requisite service period of the award, which is generally three years for stock options and one to three years for restricted stock units and performance-based restricted stock units. The Company estimates future forfeiture rates based on its historical experience. See Footnote 15 for additional information.
Recent Accounting Pronouncements
Changes to U.S. Generally Accepted Accounting Principles (“GAAP”) are established by the Financial Accounting Standards Board (“FASB”) in the form of accounting standards updates (“ASUs”) to the FASB’s Accounting Standards Codification. The Company considers the applicability and impact of all ASUs.
In April 2014, the FASB issued ASU No. 2014-08, “Reporting Discontinued Operations and Disclosures of Disposals of Components of an Entity.” Under ASU 2014-08, only disposals representing a strategic shift in operations that have a major effect on the Company’s operations and financial results are presented as discontinued operations. This guidance requires expanded disclosure that provides information about the assets, liabilities, income and expenses of discontinued operations. Additionally, the guidance requires additional disclosure for a disposal of a significant part of an entity that does not qualify for discontinued operations reporting. The Company adopted ASU 2014-08 on January 1, 2015, and the adoption did not impact the Company’s financial statements and disclosures. As required by ASU 2014-08, the businesses classified as discontinued operations as of December 31, 2014 continued to be classified as such after January 1, 2015.
In May 2014, the FASB issued ASU No. 2014-09, “Revenue from Contracts with Customers. Accounting Standard Codification 606 — Revenue Recognition,” which established Accounting Standards Codification Topic 606, “Revenue from Contracts with Customers” (“ASC 606”). ASC 606 will replace existing revenue recognition requirements in GAAP and will require entities to recognize revenue at an amount that reflects the consideration to which we expect to be entitled in exchange for transferring goods or services to a customer. To achieve this core principle, the standard provides a five-step analysis of transactions to determine when and how revenue is recognized. Other major provisions include the capitalization and amortization of certain contract costs, ensuring the time value of money is considered in the transaction price, and allowing estimates of variable consideration to be recognized before contingencies are resolved in certain circumstances. ASC 606 will also require significantly expanded disclosures regarding the qualitative and quantitative information of the Company’s nature, amount, timing, and uncertainty of revenue and cash flows arising from contracts with customers.
In May 2016, the FASB issued ASU 2016-12, “Revenue from Contracts with Customers (Topic 606): Narrow-Scope Improvements and Practical Expedients,” which updated ASU 2014-09. ASU 2016-12 clarifies certain core recognition principles including collectability, sales tax presentation, noncash consideration, contract modifications and completed contracts at transition and disclosures no longer required if the full retrospective transition method is adopted.
ASU 2014-09 and ASU 2016-12 are effective for annual reporting periods beginning after December 15, 2017, including interim periods within those annual periods.
The standard permits two methods of adoption, either retrospectively to each prior reporting period presented (full retrospective method), or retrospectively with the cumulative effect of initially applying the guidance recognized at the date of initial application (the modified retrospective method). The Company tentatively plans to use the modified retrospective transition method and to adopt ASC 606 on January 1, 2018.
The Company is currently evaluating the effect that the updated standard will have on the Company’s financial statements and related disclosures. To that end, the Company has identified a project manager as well as an implementation project team. The team has commenced the assessment phase of the project. Due to the large number of business units, the Company has chosen to start with an initial pilot assessment of four representative business units.
In January 2015, the FASB issued ASU No. 2015-01, “Income Statement—Extraordinary and Unusual Items (Subtopic 225-20), Simplifying Income Statement Presentation by Eliminating the Concept of Extraordinary Items,” which simplifies income statement presentation by eliminating the concept of extraordinary items. Previously, events or transactions that were both unusual in nature and infrequent in occurrence for a business entity were considered to be extraordinary items and required separate presentation, net of tax, after income from continuing operations. The presentation and disclosure guidance for items that are unusual in nature
68
or occur infrequently will be retained and will be expanded to include items that are both unusual and infrequently occurring. The guidance is effective for fiscal years beginning after December 15, 2015, with early adoption permitted. The Company adopted ASU 2015-01 on January 1, 2016, and the adoption of ASU 2015-01 did not have a material impact on the Company’s results of operations, cash flows or financial position.
In February 2015, the FASB issued ASU No. 2015-02, “Consolidation (Topic 810),” which amends previous guidance surrounding the consolidation model when assessing control over a legal entity and the primary beneficiary determination. The guidance is effective for fiscal years beginning after December 15, 2015, with early adoption permitted. The Company adopted ASU 2015-02 on January 1, 2016, and the adoption of ASU 2015-01 did not have a material impact on the Company’s results of operations, cash flows or financial position.
In April 2015, the FASB issued ASU No. 2015-03, “Simplifying the Presentation of Debt Issuance Costs,” which changes the presentation of debt issuance costs in financial statements. ASU 2015-03 requires an entity to present such costs in the balance sheet as a direct deduction from the related debt liability rather than as an asset. Amortization of the costs will continue to be reported as interest expense. The guidance is effective for fiscal years beginning after December 15, 2015, with early adoption permitted. The Company retrospectively adopted ASU 2015-03 on January 1, 2016, and the retrospective adoption of ASU 2015-03 had the effect of reducing the Company’s other assets and long-term debt by $18.5 million as of December 31, 2015. At December 31, 2016 total debt included $80.1 million of deferred debt issue costs.
In April 2015, the FASB issued ASU No. 2015-05, “Intangibles - Goodwill and Other -Internal-Use Software (Subtopic 350-40), Customers Accounting for Fees Paid in a Cloud Computing Arrangement,” to help entities evaluate the accounting for fees paid by a customer in a cloud computing arrangement. The amendments provide guidance to customers about whether a cloud computing arrangement includes a software license. If a cloud computing arrangement includes a software license element, then the customer should account for the software license element arrangement consistent with the acquisition of other software licenses. If a cloud computing arrangement does not include a software license, the customer should account for the arrangement as a service contract. The Company prospectively adopted this guidance as of January 1, 2016, and the adoption did not have a material impact on the Company’s results of operations, cash flows or financial condition.
In May 2015, the FASB issued ASU No. 2015-07, “Disclosures for Investments in Certain Entities That Calculate Net Asset Value per Share (or Its Equivalent) (“ASU 2015-07”). ASU 2015-07 removes the requirement to categorize within the fair value hierarchy all investments for which fair value is measured using the net asset value per share practical expedient and remove certain related disclosure requirements. ASU 2015-07 is effective for annual periods and for interim periods within those fiscal years, beginning after December 15, 2015. Effective December 31, 2016, the Company adopted the provisions of ASU 2015-07. Since this ASU 2015-07 requires only additional disclosures concerning plan assets (see Footnote 17 for disclosures related to the adoption of this Guidance), the adoption of this Guidance did not affect the consolidated financial position, results of operations or cash flows of the Company.
In July 2015, the FASB issued ASU No. 2015-11, “Simplifying the Measurement of Inventory,” which modifies existing requirements regarding measuring first-in, first-out and average cost inventory at the lower of cost or market. Under existing standards, the market amount requires consideration of replacement cost, net realizable value (“NRV”), and NRV less an approximately normal profit margin. ASU 2015-11 replaces market with NRV, defined as estimated selling prices in the ordinary course of business, less reasonably predictable costs of completion, disposal and transportation. This eliminates the need to determine and consider replacement cost or NRV less an approximately normal profit margin when measuring inventory. This guidance is effective for fiscal years beginning after December 15, 2016, with early adoption permitted. The Company is currently assessing the impact ASU 2015-11 will have on its financial position and results of operations.
In September 2015, the FASB issued ASU No. 2015-16, “Simplifying the Accounting for Measurement-Period Adjustments,” which requires an acquirer in a business combination to recognize measurement-period adjustments during the period in which the acquirer determines the amounts, including the effect on earnings of any amounts the acquirer would have recorded in previous periods if the accounting had been completed at the acquisition date, as opposed to retrospectively. This guidance is effective for fiscal years beginning after December 15, 2015, with early adoption permitted. The Company adopted ASU 2015-16 in the third quarter of 2015, and the adoption did not have a material impact on the Company’s results of operations, cash flows or financial position.
In November 2015, the FASB issued ASU No. 2015-17, “Income Taxes (Topic 740): Balance Sheet Classification of Deferred Taxes,” which simplifies the reporting of deferred tax positions, requiring deferred tax assets and liabilities to be classified as noncurrent in the Consolidated Balance Sheets, as opposed to current and noncurrent classification under current GAAP. This guidance is effective for fiscal years beginning after December 15, 2016, with early adoption permitted. The Company adopted ASU 2015-17 on a retrospective basis in the fourth quarter of 2015, and the adoption resulted in deferred tax assets and liabilities being presented as noncurrent on the Company’s consolidated balance sheet as of December 31, 2015 and 2014.
69
In February 2016, the FASB issued ASU No. 2016-02, “Leases (Topic 842),” which requires lessees to recognize a right-of-use asset and lease liability for all leases with terms of more than 12 months. Recognition, measurement and presentation of expenses will depend on classification as a finance or operating lease. ASU 2016-02 is effective for the Company on January 1, 2019. The Company is beginning to evaluate the impact the adoption of ASU 2016-02 will have on the Company’s consolidated financial statements.
In March 2016, the FASB issued ASU No. 2016-09, “Compensation-Stock Compensation: Improvement to Employee Share-Based Payment Accounting.” ASU 2016-09 provides guidance intended to simplify accounting for share-based payment transactions, including the income tax consequences, classification of awards as either equity or liabilities and classification on the statement of cash flows. The guidance is effective for interim and annual periods beginning after December 15, 2016. The adoption of ASU 2016-09 is expected to impact the recording of income taxes in the Company's financial position and results of operations, as well as the operating and financing cash flows on the Consolidated Statements of Cash Flows. The new standard requires: (1) excess tax benefits and tax deficiencies related to share-based awards to be recognized as income tax benefit or expense on a prospective basis in the reporting period in which they vest; (2) excess tax benefits from share-based payment arrangements to be presented within operating activities and withholding tax payments upon vesting of restricted stock units to be presented within financing activities within the cash flow statement; (3) permits the employer to repurchase more of an employee’s shares for tax withholding purposes and not classify the award as a liability that requires valuation on a mark-to-market basis; and (4) allows for a policy election to account for forfeitures as they occur. The Company will adopt this guidance beginning in the first quarter of 2017 and continue its policy of estimating forfeiture rates and presenting withholding tax payments on vested restricted share units as financing activities in the statement s of cash flows. The impact on the Company’s financial statements will be dependent on the timing of award vesting or exercises, tax rates and the intrinsic value when awards vest.
Other recently issued ASUs were assessed and determined to be either not applicable or are expected to have a minimal impact on the Company’s consolidated financial position and results of operations.
FOOTNOTE 2
Acquisitions and Mergers
Jarden Corporation
On April 15, 2016, Jarden became a direct wholly-owned subsidiary of Newell Brands Inc., as a result of a series of merger transactions (the “Jarden Acquisition”). The Jarden Acquisition was effected pursuant to an Agreement and Plan of Merger, dated as of December 13, 2015 (the “Merger Agreement”), among the Company, Jarden and two wholly-owned subsidiaries of the Company. Following the Jarden Acquisition, the Company was renamed Newell Brands Inc. Jarden is a leading, global consumer products company with leading brands, such as Yankee Candle®, Crock-Pot®, FoodSaver®, Mr. Coffee®, Oster®, Coleman®, First Alert®, Rawlings®, Jostens®, K2®, Marker®, Marmot®, Volkl® and many others. The Jarden Acquisition enables the Company to scale the enterprise with leading brands in global markets. The scale of the Company in key categories, channels and geographies enables it to deploy its strategy, which includes advantaged development and commercial capabilities, across a larger set of opportunities to generate accelerated growth and margin expansion. The Jarden Acquisition has been accounted for using the purchase method of accounting, and Jarden’s assets, liabilities and results of operations are included in the Company’s financial statements from the acquisition date.
Pursuant to the Merger Agreement, each share of Jarden common stock was converted into the right to receive and became exchangeable for merger consideration consisting of (1) 0.862 of a share of the Company’s common stock plus (2) $21.00 in cash. On April 15, 2016, the Company provided for the issuance of up to 189.4 million shares of common stock and the payment of up to $4.6 billion for 100% of the outstanding equity interests of Jarden, which represented 219.7 million shares of Jarden common stock outstanding and eligible to receive the merger consideration. As of December 31, 2016, the Company has been notified by Jarden shareholders owning 10.6 million shares of Jarden common stock that they are exercising their dissenters’ rights and are seeking an appraisal of such shares, and as a result, the merger consideration consisting of 9.1 million shares of the Company’s common stock issuable to these Jarden shareholders had not been issued and $222.2 million in cash had not been paid to these Jarden shareholders as of December 31, 2016.
The Jarden Acquisition constituted a make-whole fundamental change with respect to Jarden’s three series of outstanding convertible notes, making them eligible for conversion into shares of Jarden common stock and eligible to receive the merger consideration based on the number of Jarden shares into which the convertible notes may be converted. Jarden’s three series of convertible notes had an aggregate principal amount of $1.5 billion outstanding due in 2018, 2019 and 2034. During the year ended December 31, 2016, substantially all of the Jarden convertible note holders elected to convert their notes for the merger consideration and in certain cases, the make-whole premium, consisting of 32.7 million shares of the Company’s common stock and $795.9 million of cash.
70
Based on the closing price of a share of the Company’s common stock on April 15, 2016 of $44.33 per share, the total consideration paid or payable for shares of Jarden common stock was approximately $15.3 billion, including $5.4 billion of cash and $9.9 billion of the Company’s common stock. Upon completion of the Jarden Acquisition, stockholders of Newell Rubbermaid and stockholders and convertible note holders of Jarden immediately before the merger owned 55% and 45%, respectively, of the Company. As of December 31, 2016, the Company had paid $5.2 billion and issued 213.9 million shares valued at $9.5 billion for shares of Jarden common stock tendered in the Jarden Acquisition. With respect to the 10.6 million shares of Jarden common stock held by dissenting shareholders exercising their dissenters’ appraisal rights, the Company accrued the estimated value of the merger consideration payable to such shareholders of $626.5 million, and such amount is included in other noncurrent liabilities in the Consolidated Balance Sheet as of December 31, 2016. In addition, on April 15, 2016, the Company paid $4.1 billion to settle certain of Jarden’s outstanding debt obligations, which included accrued interest and change-in-control premiums.
The Company’s allocation of the total purchase price for the Jarden Acquisition to assets acquired and liabilities assumed is preliminary as the Company continues to finalize the valuation of property, plant and equipment and identifiable intangible assets (and the related deferred income tax liabilities) and the allocation of goodwill to its operating segments. The table below represents a preliminary allocation of the total purchase price to the identifiable tangible and intangible assets acquired and liabilities assumed in the Jarden Acquisition based on their estimated fair values on the date of acquisition (in millions):
Accounts receivable | $ | 1,369.5 | ||
Inventories | 2,488.7 | |||
Other current assets | 187.8 | |||
Property, plant and equipment | 1,046.5 | |||
Goodwill | 8,213.1 | |||
Identifiable intangible assets | 13,494.4 | |||
Other assets | 160.2 | |||
Total assets | $ | 26,960.2 | ||
Accounts payable | $ | 675.4 | ||
Other current liabilities | 818.8 | |||
Debt assumed, at fair value | 1,198.7 | |||
Deferred income tax liabilities | 4,966.2 | |||
Other noncurrent liabilities | 588.9 | |||
Total liabilities | $ | 8,248.0 | ||
Noncontrolling interests | 28.9 | |||
Total merger consideration, net of cash acquired | $ | 18,683.3 | ||
Debt repayments, net of cash acquired | $ | 3,388.9 | ||
Cash paid for the acquisition of Jarden common stock | 5,187.6 | |||
Total cash paid, net of cash acquired | 8,576.5 | |||
Accrual for merger consideration | 626.5 | |||
Fair value of 213.9 million shares of Company common stock issued | 9,480.3 | |||
Total merger consideration, net of cash acquired | $ | 18,683.3 | ||
The goodwill associated with the Jarden Acquisition is primarily related to synergies expected to arise after the acquisition.
The Company’s Consolidated Statements of Operations for the year ended December 31, 2016 includes $7.3 billion of net sales and $508.5 million of operating income related to Jarden.
The following unaudited pro forma financial information presents the combined results of operations of Newell Rubbermaid and Jarden for the years ended December 31, 2016 and 2015 as if the Jarden Acquisition had occurred on January 1, 2015. The unaudited pro forma financial information is not intended to represent or be indicative of the Company’s consolidated results of operations that would have been reported had the Jarden Acquisition been completed as of January 1, 2015 and should not be taken as indicative of the Company’s future consolidated results of operations. The Company expects to incur restructuring and other integration costs that are not included in the pro forma results of operations presented below. Pro forma adjustments are tax-effected at the Company’s estimated statutory tax rates.
71
December 31, | ||||||||
(in millions, except per share data) | 2016 | 2015 | ||||||
Net sales | $ | 15,657.6 | $ | 14,519.6 | ||||
Net income (loss) | 748.0 | (254.9 | ) | |||||
Earnings (loss) per share: | ||||||||
Basic | $ | 1.55 | $ | (0.53 | ) | |||
Diluted | 1.54 | (0.53 | ) | |||||
The unaudited pro forma financial information for the years ended December 31, 2016 and 2015 include $200.8 million and $181.0 million, respectively, for the amortization of acquired intangibles from the Jarden Acquisition based on the preliminary purchase price allocation. The unaudited pro forma financial information for the year ended December 31, 2015 also includes $898.1 million of non-recurring charges related to the Jarden Acquisition, which are comprised of charges for the elimination of the fair market value adjustment for manufacturer’s profit in inventory and other acquisition-related costs.
Elmer’s
During October 2015, the Company acquired Elmer’s Products, Inc. (“Elmer’s”) for a purchase price of $571.4 million, which is net of $16.8 million of cash acquired. Elmer’s, whose brands include Elmer’s®, Krazy Glue® (a trademark of Toagosei Co. Ltd., used with permission) and X-Acto®, is a provider of activity-based adhesive and cutting products that inspire creativity in the classroom, at home, in the office, in the workshop and at the craft table. Elmer’s is reported as part of the Company’s Writing segment. The Company’s 2015 consolidated statement of operations includes approximately $36.3 million of net sales related to Elmer’s. Pro forma results of operations of the Company would not be materially different as a result of the Elmer’s acquisition and therefore are not presented.
Ignite
On September 4, 2014, the Company acquired 100% of Ignite Holdings, LLC (“Ignite”) for $313.1 million. A portion of the purchase price was used to repay Ignite’s outstanding debt obligations at closing. Ignite is a designer and marketer of durable beverage containers sold under the Contigo® and Avex® brands.
bubba
On October 22, 2014, the Company acquired 100% of the assets of bubba brands, inc. (“bubba”) for $82.4 million. bubba is a designer and marketer of durable beverage containers in North America. The bubba acquisition expands the presence and distribution of the Company’s Home Solutions segment in the on-the-go thermal and hydration beverageware market.
Baby Jogger
On December 15, 2014, the Company acquired 100% of Baby Jogger Holdings, Inc. (“Baby Jogger”), a designer and marketer of premium infant and juvenile products focused on activity strollers and related accessories. Baby Jogger is headquartered in the U.S. and markets and sells its products in North America, Europe and Asia. The Company acquired Baby Jogger for net cash consideration of $210.1 million, a portion of which was used to repay Baby Jogger’s outstanding debt obligations at closing.
Other Items
The goodwill associated with the acquisitions is primarily attributable to synergies expected to arise after the acquisitions. At December 31, 2016, approximately $495.0 million of the goodwill is expected to be deductible for income tax purposes.
FOOTNOTE 3
Divestitures and Planned Divestitures
Based on the Company’s strategy to allocate resources to its businesses relative to their growth potential and those with the greater right to win in the marketplace, the Company determined that certain businesses as described below did not align with the Company’s long-term growth plans, which led to the decisions to divest or cease operations of these businesses.
Discontinued Operations
During 2014, the Company’s Endicia and Culinary electrics and retail businesses were classified as discontinued operations based on the Company’s commitment in 2014 to sell the businesses. The Endicia business was included in the Writing segment, and the Culinary businesses were included in the Home Solutions segment. The Endicia business provides on-line postage solutions. The
72
Culinary electrics business sells kitchen electrics and accessories to retailers, and the retail business sells cookware products and accessories through outlet stores. During 2015, the Company sold Endicia for net proceeds of $208.7 million, subject to customary working capital adjustments, resulting in a pretax gain of $154.2 million. The proceeds are net of $5.2 million of transaction expenses and $5.6 million of cash included in the assets sold. The $60.1 million of Endicia assets sold (which includes the Endicia cash sold) included $50.0 million of goodwill. During 2015, the Company ceased operations in its Culinary electrics and retail businesses.
The following table provides a summary of amounts included in discontinued operations, which primarily relate to the Endicia and Culinary electrics and retail businesses (in millions):
2016 | 2015 | 2014 | |||||||||
Net sales | $ | — | $ | 56.5 | $ | 83.4 | |||||
Income (loss) from discontinued operations before income taxes | $ | (1.9 | ) | $ | (7.7 | ) | $ | 2.2 | |||
Income tax expense (benefit) | (0.6 | ) | (2.8 | ) | 0.8 | ||||||
Income (loss) from discontinued operations | (1.3 | ) | (4.9 | ) | 1.4 | ||||||
Net gain from sale of discontinued operations, net of tax (1) | 0.6 | 95.6 | 3.4 | ||||||||
Income (loss) from discontinued operations, net of tax | $ | (0.7 | ) | $ | 90.7 | $ | 4.8 | ||||
(1) | 2015 includes pretax gains of $154.2 million (related tax expense of $58.6 million) relating to the sale of the Endicia business. 2014 includes pretax gains of $2.2 million (related tax benefit of $1.2 million) relating to the recognition of $4.8 million of previously deferred gains on the sale of the international Hardware businesses, offset by $2.6 million of impairments relating to the Culinary businesses. |
Divestitures
On June 30, 2016, the Company sold its Décor business, including Levolor® and Kirsch® window coverings and drapery hardware, for consideration, net of fees, of $223.5 million. The net assets of the Décor business were $63.3 million, including $19.2 million of goodwill, resulting in a pretax gain of $160.2 million, which is included in other (income) expense, net, for the year ended December 31, 2016. The Décor business was included in the Company’s consolidated results from continuing operations, including net sales of $141.4 million, until it was sold in June 2016.
During 2015, the Company divested its Rubbermaid medical cart business, which focuses on optimizing nurse work flow and medical records processing in hospitals and was included in the Commercial Products segment. The Company sold substantially all of the assets of the Rubbermaid medical cart business in August 2015. The consideration exchanged was not material. The Rubbermaid medical cart business was included in the consolidated results from continuing operations (in the Commercial Products segment), including net sales of $26.5 million in 2015, until it was sold in August 2015. The Rubbermaid medical cart business generated 0.4% and 1.2% of the Company’s consolidated net sales for the years ended December 31, 2015 and 2014, respectively.
Held for Sale
During 2016, the Company committed to plans to divest several businesses and brands to strengthen the portfolio to better align with the long-term growth plan. The affected businesses and brands, which will all be reported in future periods continuing operations, are as follows: the Tools business, including the Irwin®, Lenox®, and hilmorTM brands in the Tools segment; the Winter Sports business, including the Völkl® and K2® brands and the Zoot® and Squadra® brands in the Outdoor Solutions segment; the heaters, fans, and humidifiers business with related brands in the Consumer Solutions segment; the Rubbermaid® consumer storage totes business in the Home Solutions segment; the Lehigh business, primarily ropes, cordage and chains under the Lehigh® brand and the firebuilding business, primarily under the Pine Mountain® brand, in the Branded Consumables segment; and the stroller business under the Teutonia® brand in the Baby and Parenting segment.
During October 2016, the Company entered into an agreement to sell the Tools business for an estimated price of $1.95 billion, subject to working capital adjustments. The transaction is expected to close in early 2017, subject to certain customary conditions, including regulatory approvals, and the Company anticipates this will result in a pretax gain of approximately $0.9 billion. The Tools business generated 5.5%, 12.9% and 14.4% of the Company’s consolidated net sales for the years ended December 31, 2016, 2015 and 2014, respectively.
73
The following table presents information related to the major classes of assets and liabilities that were classified as assets and liabilities held for sale in the Consolidated Balance Sheets as of December 31, (in millions):
2016 | 2015 | ||||||
Accounts receivable, net | $ | 164.4 | $ | — | |||
Inventories, net | 311.6 | 35.3 | |||||
Prepaid expenses and other | 24.3 | 2.0 | |||||
Property, plant and equipment, net | 224.9 | 18.2 | |||||
Goodwill | 762.5 | 19.2 | |||||
Other intangible assets, net | 244.5 | 23.7 | |||||
Other assets | 13.5 | — | |||||
Total Assets | $ | 1,745.7 | $ | 98.4 | |||
Accounts payable | $ | 88.2 | $ | 34.8 | |||
Accrued compensation | 35.3 | — | |||||
Other accrued liabilities | 81.6 | 8.5 | |||||
Short-term debt and current portion long-term debt | 4.3 | — | |||||
Other noncurrent liabilities | 131.1 | — | |||||
Total Liabilities | $ | 340.5 | $ | 43.3 | |||
FOOTNOTE 4
Stockholders’ Equity
In October 2013, the Company entered into agreements with Goldman, Sachs & Co. (“Goldman Sachs”) to effect an accelerated stock buyback (the “ASB Agreement”) of the Company’s common stock. Under the ASB Agreement, the Company paid Goldman Sachs an initial purchase price of $350.0 million, and Goldman Sachs delivered to the Company 9.4 million shares of the Company’s common stock based on an initial per share amount of $29.69, representing a substantial majority of the shares expected to be delivered under the ASB Agreement. The number of shares that the Company ultimately purchased under the ASB Agreement was determined based on the average of the daily volume-weighted average share prices of the Company’s common stock over the course of a calculation period, less a discount, and was subject to certain adjustments under the ASB Agreement. Upon settlement following the end of the calculation period in March 2014, Goldman Sachs delivered 2.0 million additional shares to the Company so that the aggregate value of the shares initially delivered plus such additional shares, based on the final price, was $350.0 million. Such shares were immediately retired.
In August 2011, the Company announced a $300.0 million three-year share repurchase program (the “SRP”). Under the SRP, the Company may repurchase its own shares of common stock through a combination of 10b5-1 automatic trading plans, discretionary market purchases or in privately negotiated transactions. The SRP was originally authorized for a period of three years ending in August 2014. In 2014, the SRP was expanded and extended such that the Company may repurchase over $750.0 million of additional shares from February 2014 through the end of 2017, and the $42.9 million availability remaining at December 31, 2013 under the initial $300.0 million authorization was canceled. During 2016, the Company did not repurchase any shares pursuant to the SRP. From the commencement of the SRP in August 2011 through December 31, 2016, the Company has repurchased and retired a total of 28.9 million shares at an aggregate cost of $800.7 million, and the Company has $255.9 million of authorized repurchases remaining under the SRP as of December 31, 2016. The repurchase of additional shares will depend upon many factors, including the Company’s financial condition, liquidity and legal requirements.
74
The following tables display the components of accumulated other comprehensive income (loss ) (“AOCI”) as of and for the years ended December 31, 2016, 2015 and 2014 (in millions):
Foreign Currency Translation Loss, net of tax(1) | Unrecognized Pension & Postretirement Costs, net of tax | Derivative Hedging (Loss) Income, net of tax | Accumulated Other Comprehensive Loss | ||||||||||||
Balance at December 31, 2013 | $ | (161.5 | ) | $ | (483.3 | ) | $ | (0.4 | ) | $ | (645.2 | ) | |||
Other comprehensive (loss) income before reclassifications | (126.3 | ) | (84.1 | ) | 9.5 | (200.9 | ) | ||||||||
Amounts reclassified to earnings | — | 55.7 | (4.0 | ) | 51.7 | ||||||||||
Net current period other comprehensive (loss) income | (126.3 | ) | (28.4 | ) | 5.5 | (149.2 | ) | ||||||||
Balance at December 31, 2014 | (287.8 | ) | (511.7 | ) | 5.1 | (794.4 | ) | ||||||||
Other comprehensive (loss) income before reclassifications | (153.3 | ) | 42.1 | 5.3 | (105.9 | ) | |||||||||
Amounts reclassified to earnings | 29.4 | 47.3 | (10.2 | ) | 66.5 | ||||||||||
Net current period other comprehensive (loss) income | (123.9 | ) | 89.4 | (4.9 | ) | (39.4 | ) | ||||||||
Balance at December 31, 2015 | (411.7 | ) | (422.3 | ) | 0.2 | (833.8 | ) | ||||||||
Other comprehensive (loss) income before reclassifications | (198.0 | ) | 10.0 | (48.0 | ) | (236.0 | ) | ||||||||
Amounts reclassified to earnings | 1.8 | 12.3 | 10.9 | 25.0 | |||||||||||
Net current period other comprehensive (loss) income | (196.2 | ) | 22.3 | (37.1 | ) | (211.0 | ) | ||||||||
Balance at December 31, 2016 | $ | (607.9 | ) | $ | (400.0 | ) | $ | (36.9 | ) | $ | (1,044.8 | ) | |||
(1) | Includes foreign exchange (losses) gains of $(23.3) million, $(22.9) million and $(29.6) million during 2016, 2015 and 2014, respectively, associated with intercompany loans designated as long-term. |
For 2016, 2015 and 2014 reclassifications from AOCI to the results of operations for the Company’s pension and postretirement benefit plans were a pre-tax expense of $16.5 million, $74.1 million and $86.4 million, respectively, and primarily represent the amortization of net actuarial losses and plan settlements (see Footnote 13). These costs are recorded in selling, general and administrative expenses and cost of sales. For 2016, 2015 and 2014, reclassifications from AOCI to the results of operations for the Company’s derivative financial instruments for effective cash flow hedges were pre-tax (loss) income of $(12.0) million, $14.3 million and $5.5 million, respectively (see Footnote 11). For 2015, $39.7 million pre-tax foreign currency translation charge was reclassified from AOCI to the results of operations related to the Venezuela deconsolidation.
The income tax (provision) benefit allocated to the components of OCI are as follows (in millions):
2016 | 2015 | 2014 | ||||||||||
Foreign currency translation adjustments | $ | — | $ | (10.3 | ) | $ | — | |||||
Unrecognized pension and postretirement costs | (19.6 | ) | (41.1 | ) | 6.0 | |||||||
Derivative hedging (loss) gain | 20.7 | (0.6 | ) | (3.9 | ) | |||||||
Income tax (provision) benefit related to OCI | $ | 1.1 | $ | (52.0 | ) | $ | 2.1 | |||||
FOOTNOTE 5
Restructuring Costs
Restructuring provisions were determined based on estimates prepared at the time the restructuring actions were approved by management and are periodically updated for changes. Restructuring amounts also include amounts recognized as incurred.
Project Renewal
In April 2015, the Company committed to a further expansion of Project Renewal (the “April 2015 Expansion”). Project Renewal was initially launched in October 2011 to reduce the complexity of the organization and increase investment in growth platforms within the business. Under Project Renewal, the Company is simplifying and aligning its businesses around two key activities - Brand & Category Development and Market Execution & Delivery. Pursuant to the program, the Company eliminated its operating groups and consolidated 13 global business units into three operating groups that manage five operating segments. Pursuant to an expansion of Project Renewal in October 2014, the Company is: (i) further streamlining its supply chain function, including reducing overhead and realigning the supply chain management structure; (ii) investing in value analysis and value engineering efforts to reduce product and packaging costs; (iii) reducing operational and manufacturing complexity in its Writing segment; and (iv) further streamlining its distribution and transportation functions. Under the April 2015 Expansion, the Company plans
75
to implement additional activities designed to further streamline business partnering functions (e.g., Finance/IT, Legal and Human Resources), optimize global selling and trade marketing functions and rationalize the Company’s real estate portfolio.
In connection with the April 2015 Expansion, the Company expects to incur approximately $150.0 million of additional costs, including cash costs of approximately $135.0 million. The additional costs include pretax restructuring charges in the range of approximately $125.0 million to $135.0 million, a majority of which are expected to be facility exit costs and employee-related cash costs, including severance, retirement and other termination benefits, including costs associated with relocating the Company’s Atlanta business hub within Atlanta, Georgia.
Cumulative costs of the expanded Project Renewal are expected to be approximately $690.0 million to $725.0 million pretax, with cash costs of approximately $645.0 million to $675.0 million. Approximately 60% to 70% of the total costs are expected to be restructuring costs, a majority of which are expected to be employee-related cash costs, including severance, retirement and other termination benefits and costs. Project Renewal is expected to be complete by the end of 2017, and as a result, cash payments and savings will be realized in 2018 and later years.
The following table depicts the restructuring charges, net of adjustments, incurred in connection with Project Renewal for the years ended December 31, (in millions):
2016 | 2015 | 2014 | Since Inception Through December 31, 2016 | ||||||||||||
Facility and other exit costs, including impairments | $ | 2.6 | $ | 6.7 | $ | 7.5 | $ | 30.0 | |||||||
Employee severance, termination benefits and relocation costs | (9.1 | ) | 52.4 | 25.2 | 209.4 | ||||||||||
Exited contractual commitments and other | 16.4 | 14.9 | 21.1 | 80.3 | |||||||||||
$ | 9.9 | $ | 74.0 | $ | 53.8 | $ | 319.7 | ||||||||
The following tables depict the activity in accrued restructuring reserves for Project Renewal for 2016 and 2015 (in millions):
December 31, 2015 | December 31, 2016 | ||||||||||||||
Balance | Provision | Costs Incurred | Balance | ||||||||||||
Facility and other exit costs, including impairments | $ | — | $ | 2.6 | $ | (2.6 | ) | $ | — | ||||||
Employee severance, termination benefits and relocation costs | 49.3 | (9.1 | ) | (24.4 | ) | 15.8 | |||||||||
Exited contractual commitments and other | 17.3 | 16.4 | (16.3 | ) | 17.4 | ||||||||||
$ | 66.6 | $ | 9.9 | $ | (43.3 | ) | $ | 33.2 | |||||||
December 31, 2014 | December 31, 2015 | ||||||||||||||
Balance | Provision | Costs Incurred | Balance | ||||||||||||
Facility and other exit costs, including impairments | $ | — | $ | 6.7 | $ | (6.7 | ) | $ | — | ||||||
Employee severance, termination benefits and relocation costs | 22.8 | 52.4 | (25.9 | ) | 49.3 | ||||||||||
Exited contractual commitments and other | 17.5 | 14.9 | (15.1 | ) | 17.3 | ||||||||||
$ | 40.3 | $ | 74.0 | $ | (47.7 | ) | $ | 66.6 | |||||||
The following tables depict the activity in accrued restructuring reserves for Project Renewal for 2016 and 2015 aggregated by reportable business segment (in millions):
December 31, 2015 | December 31, 2016 | ||||||||||||||
Segment | Balance | Provision | Costs Incurred | Balance | |||||||||||
Writing | $ | 14.0 | $ | 0.7 | $ | (3.3 | ) | $ | 11.4 | ||||||
Home Solutions | 5.1 | (2.0 | ) | (2.6 | ) | 0.5 | |||||||||
Tools | 4.3 | 0.5 | (3.2 | ) | 1.6 | ||||||||||
Commercial Products | 3.8 | — | (2.1 | ) | 1.7 | ||||||||||
Baby & Parenting | — | 3.2 | (2.8 | ) | 0.4 | ||||||||||
Corporate | 39.4 | 7.5 | (29.3 | ) | 17.6 | ||||||||||
$ | 66.6 | $ | 9.9 | $ | (43.3 | ) | $ | 33.2 | |||||||
76
December 31, 2014 | December 31, 2015 | ||||||||||||||
Segment | Balance | Provision | Costs Incurred | Balance | |||||||||||
Writing | $ | 9.7 | $ | 9.3 | $ | (5.0 | ) | $ | 14.0 | ||||||
Home Solutions | 1.0 | 5.5 | (1.4 | ) | 5.1 | ||||||||||
Tools | 0.5 | 2.9 | 0.9 | 4.3 | |||||||||||
Commercial Products | 5.1 | 2.2 | (3.5 | ) | 3.8 | ||||||||||
Baby & Parenting | 2.2 | 0.7 | (2.9 | ) | — | ||||||||||
Corporate | 21.8 | 53.4 | (35.8 | ) | 39.4 | ||||||||||
$ | 40.3 | $ | 74.0 | $ | (47.7 | ) | $ | 66.6 | |||||||
Other Restructuring
In addition to Project Renewal, the Company has incurred restructuring costs primarily relating to the Jarden Acquisition and the Elmer's acquisition. The following table depicts the restructuring charges, net of adjustments, incurred outside of Project Renewal for the year ended December 31, (in millions):
2016 | |||
Facility and other exit costs, including impairments | $ | 5.7 | |
Employee severance, termination benefits and relocation costs | 56.2 | ||
Exited contractual commitments and other | 3.1 | ||
$ | 65.0 | ||
The following table depicts the activity in other accrued restructuring reserves for 2016 (in millions):
December 31, 2015 | December 31, 2016 | ||||||||||||||
Balance | Provision | Costs Incurred | Balance | ||||||||||||
Facility and other exit costs, including impairments | $ | — | $ | 5.7 | $ | (5.7 | ) | $ | — | ||||||
Employee severance, termination benefits and relocation costs | 0.8 | 56.2 | (18.8 | ) | 38.2 | ||||||||||
Exited contractual commitments and other | — | 3.1 | (2.6 | ) | 0.5 | ||||||||||
$ | 0.8 | $ | 65.0 | $ | (27.1 | ) | $ | 38.7 | |||||||
Total Restructuring Costs
The table below shows restructuring costs recognized in continuing operations for all restructuring activities for the years indicated, aggregated by reportable business segment (in millions):
Segment | 2016 | 2015 | 2014 | ||||||||
Writing | $ | 9.9 | $ | 9.3 | $ | 9.8 | |||||
Home Solutions(1) | (1.9 | ) | 5.8 | 1.6 | |||||||
Tools | 0.6 | 2.9 | 4.5 | ||||||||
Commercial Products | 3.0 | 2.2 | 3.2 | ||||||||
Baby & Parenting(1) | 3.2 | 3.6 | 2.1 | ||||||||
Branded Consumables | 10.5 | — | — | ||||||||
Consumer Solutions | 11.6 | — | — | ||||||||
Outdoor Solutions | 10.8 | — | — | ||||||||
Process Solutions | 0.1 | — | — | ||||||||
Corporate | 27.1 | 53.4 | 31.6 | ||||||||
$ | 74.9 | $ | 77.2 | $ | 52.8 | ||||||
(1) | Includes $0.3 million of restructuring costs in the Home Solutions segment associated with the integration of Ignite and bubba for 2015 and $2.9 million of restructuring costs for 2015 in the Baby & Parenting segment associated with the integration of Baby Jogger. |
Cash paid for all restructuring activities included in operating activities was $59.9 million, $51.5 million and $71.8 million for 2016, 2015 and 2014, respectively.
77
FOOTNOTE 6
Inventories, Net
The components of net inventories were as follows as of December 31, (in millions):
2016 | 2015 | ||||||
Materials and supplies | $ | 350.7 | $ | 117.3 | |||
Work-in-process | 236.1 | 108.0 | |||||
Finished products | 1,529.2 | 496.5 | |||||
$ | 2,116.0 | $ | 721.8 | ||||
Inventory costs include direct materials, direct labor and manufacturing overhead, or when finished goods are sourced, the cost is the amount paid to the third party. Approximately 17.5% and 51.3% of gross inventory costs at December 31, 2016 and 2015, respectively, were determined by the last-in, first-out (“LIFO”) method; for the balance, cost was determined using the first-in, first-out (“FIFO”) method. As of December 31, 2016 and 2015, LIFO reserves were $16.6 million and $23.6 million, respectively. The pretax income from continuing operations recognized by the Company related to the liquidation of LIFO-based inventories in 2016, 2015 and 2014 was $2.9 million, $1.5 million and $7.2 million, respectively.
FOOTNOTE 7
Property, Plant & Equipment, Net
Property, plant and equipment, net, consisted of the following as of December 31, (in millions):
2016 | 2015 | ||||||
Land | $ | 108.4 | $ | 20.2 | |||
Buildings and improvements | 653.0 | 350.8 | |||||
Machinery and equipment | 2,454.6 | 1,743.7 | |||||
3,216.0 | 2,114.7 | ||||||
Accumulated depreciation | (1,672.6 | ) | (1,515.5 | ) | |||
$ | 1,543.4 | $ | 599.2 | ||||
Depreciation expense for continuing operations was $214.1 million, $93.0 million and $93.2 million in 2016, 2015 and 2014, respectively.
FOOTNOTE 8
Goodwill and Other Intangible Assets, Net
A summary of changes in the Company’s goodwill by reportable business segment is as follows for 2016 and 2015 (in millions):
Segment | December 31, 2015 Balance | Acquisitions(1) | Other Adjustments(2) | Foreign Currency | December 31, 2016 Balance | ||||||||||
Writing | $ | 1,359.0 | $ | 502.9 | $ | — | $ | (14.7 | ) | $ | 1,847.2 | ||||
Home Solutions | 361.1 | 578.4 | — | — | 939.5 | ||||||||||
Tools | 474.4 | 249.6 | (713.6 | ) | (5.3 | ) | 5.1 | ||||||||
Commercial Products | 387.3 | 239.3 | — | (0.9 | ) | 625.7 | |||||||||
Baby & Parenting | 209.4 | 375.5 | — | 0.4 | 585.3 | ||||||||||
Branded Consumables | — | 3,180.1 | (12.5 | ) | (50.0 | ) | 3,117.6 | ||||||||
Consumer Solutions | — | 938.6 | (28.5 | ) | (5.3 | ) | 904.8 | ||||||||
Outdoor Solutions | — | 1,810.7 | (7.9 | ) | (5.6 | ) | 1,797.2 | ||||||||
Process Solutions | — | 396.5 | — | — | 396.5 | ||||||||||
$ | 2,791.2 | $ | 8,271.6 | $ | (762.5 | ) | $ | (81.4 | ) | $ | 10,218.9 | ||||
78
Segment | December 31, 2014 Balance | Acquisitions (3) | Other Adjustments (4) | Foreign Currency | December 31, 2015 Balance | ||||||||||
Writing | $ | 1,090.9 | $ | 373.5 | $ | (50.0 | ) | $ | (55.4 | ) | $ | 1,359.0 | |||
Home Solutions | 379.3 | 1.0 | (19.2 | ) | — | 361.1 | |||||||||
Tools | 478.6 | — | — | (4.2 | ) | 474.4 | |||||||||
Commercial Products | 387.5 | — | — | (0.2 | ) | 387.3 | |||||||||
Baby & Parenting | 209.7 | — | — | (0.3 | ) | 209.4 | |||||||||
$ | 2,546.0 | $ | 374.5 | $ | (69.2 | ) | $ | (60.1 | ) | $ | 2,791.2 | ||||
(1) | Amounts primarily represent the preliminary estimate of goodwill attributable to the Jarden Acquisition and the preliminary allocation of goodwill to the Company’s segments. |
(2) | Includes amounts reclassified to assets held for sale. |
(3) | On October 22, 2015, the Company acquired Elmer’s Products Inc. for $571.4 million, of which $373.5 million was preliminarily allocated to goodwill. |
(4) | During the year ended December 31, 2015, the Company sold Endicia, including $50.0 million of goodwill. Endicia was included in the Company’s Writing segment. The Company also reclassified $19.2 million of Décor goodwill to assets held for sale. |
Cumulative impairment charges relating to goodwill were $1,642.4 million as of December 31, 2016.
The table below summarizes the balance of other intangible assets, net and the Company’s amortization periods using the straight-line method and attribution method for other intangible assets, including capitalized software consisted of the following as of December 31, (in millions):
2016 | 2015 | ||||||||||||||||||||
Gross Carrying Amount | Accumulated Amortization | Net Book Value | Gross Carrying Amount | Accumulated Amortization | Net Book Value | Amortization Periods (in years) | |||||||||||||||
Trade names — indefinite life | $ | 9,935.1 | $ | — | $ | 9,935.1 | $ | 653.4 | $ | — | $ | 653.4 | N/A | ||||||||
Trade names — other | 286.3 | (34.2 | ) | 252.1 | 46.0 | (30.0 | ) | 16.0 | 3–30 years | ||||||||||||
Capitalized software | 482.0 | (252.9 | ) | 229.1 | 465.6 | (252.7 | ) | 212.9 | 3–12 years | ||||||||||||
Patents and intellectual property | 227.9 | (105.0 | ) | 122.9 | 142.8 | (89.9 | ) | 52.9 | 3–14 years | ||||||||||||
Customer relationships & distributor channels | 3,761.7 | (204.0 | ) | 3,557.7 | 231.9 | (104.5 | ) | 127.4 | 3–30 years | ||||||||||||
Other | 25.9 | (11.0 | ) | 14.9 | 4.2 | (3.1 | ) | 1.1 | 3–5 years | ||||||||||||
$ | 14,718.9 | $ | (607.1 | ) | $ | 14,111.8 | $ | 1,543.9 | $ | (480.2 | ) | $ | 1,063.7 | ||||||||
Amortization expense for intangible assets for continuing operations was $223.1 million, $76.5 million and $60.6 million in 2016, 2015 and 2014, respectively.
As of December 31, 2016, the aggregate estimated intangible amortization amounts for the succeeding five years are as follows (in millions):
2017 | 2018 | 2019 | 2020 | 2021 |
$316.8 | $311.5 | $288.2 | $237.7 | $210.3 |
Actual amortization expense to be reported in future periods could differ materially from these estimates as a result of finalizing the purchase price allocation of the Jarden Acquisition, future acquisitions, changes in useful lives and other relevant factors.
79
FOOTNOTE 9
Other Accrued Liabilities
Other accrued liabilities included the following as of December 31, (in millions):
2016 | 2015 | ||||||
Customer accruals | $ | 432.4 | $ | 314.8 | |||
Accruals for manufacturing, marketing and freight expenses | 89.3 | 73.0 | |||||
Accrued self-insurance liabilities, contingencies and warranty | 370.3 | 86.2 | |||||
Accrued income taxes | 64.9 | 67.4 | |||||
Accrued interest expense | 108.5 | 18.1 | |||||
Other | 399.5 | 169.4 | |||||
Other accrued liabilities | $ | 1,464.9 | $ | 728.9 | |||
Customer accruals are promotional allowances and rebates, including cooperative advertising, given to customers in exchange for their selling efforts and volume purchased as well as allowances for returns. Payments for annual rebates and other customer programs are generally made in the first quarter of the year. Self-insurance liabilities relate to casualty liabilities such as workers’ compensation, general and product liability and auto liability and are estimated based upon historical loss experience combined with actuarial evaluation methods, review of significant individual files and the application of risk transfer programs.
FOOTNOTE 10
Debt
The following is a summary of outstanding debt as of December 31, (in millions):
2016 | 2015 | ||||||
2.05% senior notes due 2017 | $ | 349.4 | $ | 348.7 | |||
6.25% senior notes due 2018 | 249.8 | 249.7 | |||||
2.15% senior notes due 2018 | 298.9 | 298.3 | |||||
2.60% senior notes due 2019 | 995.0 | — | |||||
2.875% senior notes due 2019 | 347.9 | 347.2 | |||||
4.70% senior notes due 2020 | 380.0 | 379.7 | |||||
3.15% senior notes due 2021 | 991.7 | — | |||||
3.75% senior notes due 2021 | 326.9 | — | |||||
4.00% senior notes due 2022 | 248.5 | 248.2 | |||||
3.85% senior notes due 2023 | 1,737.0 | — | |||||
5.00% senior notes due 2023 | 314.1 | — | |||||
4.00% senior notes due 2024 | 495.2 | 494.6 | |||||
3.90% senior notes due 2025 | 296.8 | 296.4 | |||||
4.20% senior notes due 2026 | 1,981.0 | — | |||||
6.11% senior notes due 2028 | 1.5 | 1.5 | |||||
5.375% senior notes due 2036 | 494.7 | — | |||||
5.50% senior notes due 2046 | 1,725.7 | — | |||||
Hedge accounting impact of interest rate swaps | (5.9 | ) | (3.1 | ) | |||
Gain on settled interest rate swap | 7.2 | 12.9 | |||||
Term loan | 399.5 | — | |||||
Commercial paper | — | — | |||||
Receivables facilities | 187.4 | 350.0 | |||||
Other debt | 70.5 | 33.8 | |||||
Total debt | 11,892.8 | 3,057.9 | |||||
Short-term debt and current portion of long-term debt | (601.9 | ) | (388.8 | ) | |||
Long-term debt | $ | 11,290.9 | $ | 2,669.1 | |||
80
In March 2016, the Company completed the offering and sale of $8.0 billion principal amount of unsecured senior notes, consisting of $1.0 billion of aggregate principal amount of 2.60% notes due March 2019 (the “2019 Notes”), $1.0 billion of aggregate principal amount of 3.15% notes due April 2021 (the “2021 Notes”), $1.75 billion of aggregate principal amount of 3.85% notes due April 2023 (the “2023 Notes”), $2.0 billion of aggregate principal amount of 4.20% notes due April 2026 (the “2026 Notes”), $500.0 million of aggregate principal amount of 5.375% notes due April 2036 (the “2036 Notes”) and $1.75 billion of aggregate principal amount of 5.50% notes due April 2046 (the “2046 Notes” and, together with the 2019 Notes, the 2021 Notes, the 2023 Notes, the 2026 Notes and the 2036 Notes, the “Notes”). The aggregate net proceeds from the issuance of the Notes were $7.9 billion, which were used to pay the cash portion of the merger consideration in the Jarden Acquisition and to repay a significant portion of Jarden’s outstanding debt at closing. The Notes are senior obligations of the Company and rank equally with all of its other unsecured and unsubordinated indebtedness from time to time outstanding. At the Company’s option, all or any portion of the 2019 Notes may be redeemed at any time, all or any portion of the 2021 Notes may be redeemed at any time prior to March 1, 2021 (the date that is one month prior to the maturity date), all or any portion of the 2023 Notes may be redeemed at any time prior to February 1, 2023 (the date that is two months prior to the maturity date), all or any portion of the 2026 Notes may be redeemed at any time prior to January 1, 2026 (the date that is three months prior to the maturity date), all or any portion of the 2036 Notes may be redeemed at any time prior to October 1, 2035 (the date that is six months prior to the maturity date), and all or any portion of the 2046 Notes may be redeemed at any time prior to October 1, 2045 (the date that is six months prior to the maturity date) (each such date the applicable “par call date”). The redemption price for the Notes is equal to the greater of (1) 100% of the principal amount of the Notes being redeemed on the redemption date or (2) the sum of the present values of the remaining scheduled payments of principal and interest on the Notes being redeemed (in the case of the 2026 Notes, assuming that the 2026 Notes matured on the par call date) (not including any portion of any payments of interest accrued to the redemption date), discounted to the redemption date on a semi-annual basis (assuming a 360-day year consisting of twelve 30-day months) at the treasury rate, plus an applicable premium; plus in each case, accrued and unpaid interest on the Notes being redeemed to the redemption date. If the 2021 Notes are redeemed on or after a date that is one month prior to the maturity date of the 2021 Notes, the 2023 Notes are redeemed on or after a date that is two months prior to the maturity date of the 2023 Notes, the 2026 Notes are redeemed on or after a date that is three months prior to the maturity date of the 2026 Notes, or the 2036 Notes or the 2046 Notes are redeemed on or after a date that is six months prior to the maturity date of such notes, then the redemption price of such notes will be equal to 100% of the principal amount of the notes so redeemed plus accrued interest to such redemption date. The interest rate payable on each series of Notes will be subject to adjustment if either of two credit rating agencies downgrade (or subsequently upgrade) its rating assigned to the Notes, but in no event shall the interest rate payable on each series of Notes be less than the stated interest rate or more than 200 basis points greater than the stated interest rate on each series of Notes as a result of such credit rating agencies downgrades or upgrades.
In October 2015, the Company completed the offering and sale of $600.0 million of unsecured senior notes, consisting of $300.0 million aggregate principal amount of 2.15% notes due 2018 (the “2018 Notes”) and $300.0 million aggregate principal amount of 3.90% notes due 2025 (the “2025 Notes” and, together with the 2018 Notes, the “Senior Notes”). The aggregate net proceeds from the issuance of the Senior Notes were $594.6 million, which were used for the acquisition of Elmer’s and for general corporate purposes. The Senior Notes are senior obligations of the Company and rank equally with all of its other unsecured and unsubordinated indebtedness from time to time outstanding. The 2018 Notes and 2025 are redeemable at a price equal to the greater of (i) 100% of the aggregate principal amount redeemed or (ii) the sum of the present values of the remaining scheduled payments, plus in each case, accrued and unpaid interest. If the 2024 Notes are redeemed within three months of the scheduled maturity date, they may be redeemed at a price equal to 100% of the aggregate principal amount being redeemed, plus accrued and unpaid interest.
In November 2014, the Company completed the offering and sale of $850.0 million of unsecured senior notes, consisting of $350.0 million aggregate principal amount of 2.875% notes due 2019 (the “2.875% 2019 Notes”) and $500.0 million aggregate principal amount of 4.00% notes due 2024 (the “2024 Notes”). The aggregate net proceeds from the issuance of the 2019 Notes and 2024 Notes were $841.8 million, which were used, in part, to redeem an aggregate principal amount of $439.4 million of then existing long-term debt, reduce borrowings under the Company’s commercial paper program and receivables facility and finance acquisitions. The purchase of the long-term debt resulted in an aggregate loss on extinguishment of debt of $33.2 million. The 2019 Notes and 2024 are redeemable at a price equal to the greater of (i) 100% of the aggregate principal amount redeemed or (ii) the sum of the present values of the remaining scheduled payments, plus in each case, accrued and unpaid interest. If the 2019 Notes and 2024 Notes are redeemed within one month and three months, respectively, of their scheduled maturity date, they may be redeemed at a price equal to 100% of the aggregate principal amount being redeemed, plus accrued and unpaid interest.
In December 2014, the Company exercised the early redemption provisions of the $250.0 million of outstanding 2.00% notes due 2015 (“2015 Notes”) and repaid and retired the $250.0 million outstanding principal amount of the 2015 Notes. At settlement, the Company paid $251.9 million, which included a $1.9 million premium payable pursuant to the terms of the 2015 Notes. The Company recognized a loss of $2.3 million on extinguishment of the 2015 Notes, which included the premium paid and the write-off of unamortized debt issuance costs.
81
In December 2014, the Company also exercised the early redemption provisions of the 10.60% 2019 Notes and repaid and retired the remaining $20.7 million outstanding principal amount of the 10.60% 2019 Notes. At settlement, the Company made a cash payment of $28.1 million, which included a $7.4 million premium payable pursuant to the terms of the 10.60% 2019 Notes. The Company recognized a loss of $7.7 million on extinguishment of the 10.60% 2019 Notes, which included the premium paid and the write-off of unamortized debt issuance costs.
In December 2014, the Company completed a tender offer for the $550.0 million principal amount outstanding 4.70% notes due 2020 (“2020 Notes”) and purchased $168.7 million principal amount of the $550.0 million outstanding 2020 Notes. Pursuant to the terms of the tender offer, the Company made a cash payment of $184.7 million, which included a $16.0 million premium payable pursuant to the terms of the tender offer. The Company recognized a loss on extinguishment of debt of $23.2 million in connection with the tender offer for the 2020 Notes, which included the premium paid, the write-off of unamortized debt issuance costs, transaction expenses and the settlement of interest rate swaps designated as fair value hedges of $154.0 million of the $168.7 million 2020 Notes tendered and repaid.
Receivables-Related Borrowings
In October 2016, the Company entered into a new $950.0 million receivables purchase agreement (the “Securitization Facility”) that matures in October 2019 and bears interest at a margin over a variable interest rate. The Securitization facility replaced the Company’s existing Receivable Facility and Jarden Securitization Facility. Under the Securitization Facility, on an ongoing basis certain operating subsidiaries will sell their receivables to a special purpose entity Jarden Receivables, LLC (“Jarden Receivables”), which is a wholly-owned consolidated indirect subsidiary of the Company. Jarden Receivables funds these purchases with borrowings under a loan agreement, which are secured by the accounts receivable. There is no recourse to the Company for the unpaid portion of any loans under this loan agreement. At December 31, 2016, the borrowing rate margin and the unused line fee on the securitization were 0.80% and 0.40% per annum, respectively.
Revolving Credit Facility and Commercial Paper
The Company maintain a $1.25 billion revolving credit facility that matures in January 2022 (the “Facility”). Under the Facility, the Company may borrow funds on a variety of interest rate terms. The Facility also provides for the issuance of up to $100.0 million of letters of credit, so long as there is a sufficient amount available for borrowing under the Facility. There was no commercial paper outstanding at the end of 2016.
Jarden Bridge Credit Facility
On December 13, 2015, the Company entered into a commitment letter with Goldman Sachs & Co. to provide financing for the Jarden transaction, consisting of a $10.5 billion senior unsecured bridge facility (the “Jarden Bridge Facility”). The availability under the Jarden Bridge Facility was subject to reduction in equivalent amounts upon the completion of any issuance of debt securities by the Company and upon other specified events. Due to the Company entering into the Term Loan Credit Agreement described below, completing the issuance of the Notes in March 2016 and other considerations, the Jarden Bridge Facility was terminated.
Term Loan Credit Agreement
On January 26, 2016, the Company entered into a credit agreement (the “Term Loan Credit Agreement”) for a $1.5 billion senior unsecured term loan facility with a syndicate of banks. In April 2016, the Company borrowed $1.5 billion pursuant to the Term Loan Credit Agreement, and the borrowings were used to pay a portion of the cash portion of the merger consideration in connection with the Jarden Acquisition. The Term Loan Credit Agreement provides for a maturity date of three years from the closing date of the Jarden Acquisition and requires the Company to repay 5% of the initial borrowings by each of April 2017 and April 2018, 45% of the borrowings by October 2018 and the remaining 45% of the borrowings by April 2019. At the Company’s election, borrowings under the Term Loan Credit Agreement bear interest either at (i) the eurodollar rate plus an applicable margin, or (ii) the base rate plus an applicable margin. During the year ended December 31, 2016, the Company repaid $1.1 billion of the borrowings outstanding under the Term Loan Credit Agreement. The interest rate on the Term Loan Credit Agreement was approximately at 2.31% at December 31, 2016.
For the year ended December 31, 2016, the Company recorded $47.6 million of charges associated with the loss on extinguishment of debt terminating its Jarden Bridge Facility and the repayment of Term Loans.
Notes Exchange
In March 2016, the Company commenced exchange offers (the “Exchange Offers”) pursuant to which the Company offered to issue new senior notes (the “Newell Notes”) in exchange for €300.0 million aggregate principal amount of the outstanding 3.75% senior notes due October 2021 issued by Jarden and of the $300.0 million aggregate principal amount of the outstanding 5.00%
82
senior notes due November 2023 issued by Jarden (collectively, the “Existing Jarden Notes”) and concurrently solicited consents (the “Consent Solicitations”) from the eligible holders of the Existing Jarden Notes to amend the related indentures. The Exchange Offers and Consent Solicitations expired and were settled in April 2016. The aggregate principal amount of each series of Newell Notes issued in the Exchange Offers totaled €271.9 million of 3.75% senior notes due October 2021 (the “Euro Notes”) and $295.1 million 5.00% senior notes due November 2023 (“the “USD Notes”). The Newell Notes are senior unsecured obligations of the Company and rank equally in right of payment with all of its other existing or future senior unsecured debt, and are structurally subordinated to the secured and unsecured debt of the Company’s subsidiaries, including any debt of Jarden that remains outstanding.
The Exchange Offers were not registered under the Securities Act of 1933, as amended (the “Securities Act”), and as a result, the Newell Notes may not be offered or sold in the U.S. absent registration or an applicable exemption from, or in a transaction not subject to, the registration requirements of the Securities Act and applicable state laws. In connection with the completion of the Exchange Offers, the Company entered into a registration rights agreement pursuant to which the Company agreed to use its commercially reasonable efforts to file a registration statement before January 2017 relating to an offer to exchange the Newell Notes for registered notes of the Company having substantially the same terms as the Newell Notes. The Company completed the required registered exchange offer on October 26, 2016 and exchanged 95.61% of the Euro Notes and 100% of the USD Notes for registered notes, in each case, having substantially identical terms.
Following the consummation of the Exchange Offers, Jarden had outstanding approximately (i) €28.1 million in aggregate principal amount of its 3.75% senior notes due October 2021 (the “Jarden Euro Notes”) and (ii) $4.9 million in aggregate principal amount of its 5.00% senior notes due November 2023 (the “Jarden USD Notes” and, together with the Jarden Euro Notes, the “Remaining Existing Jarden Notes”). In April 2016, Jarden entered into supplemental indentures related to the Remaining Existing Jarden Notes that eliminated substantially all of the restrictive covenants, eliminated the cross-default under Jarden’s indebtedness as an event of default, released the guarantees of any guarantors on the Remaining Existing Jarden Notes and evidenced the assumption of the obligations of the Remaining Existing Jarden Notes by a wholly-owned subsidiary of the Company. The Remaining Existing Jarden Notes are the senior unsecured obligations of a wholly-owned subsidiary of the Company.
Net Investment Hedge
The Company has designated approximately €300.0 million principal balance of the 3.75% senior notes due October 2021 as a net investment hedge of the foreign currency exposure of its net investment (the “Hedging Instrument”) in certain Euro-functional currency subsidiaries with Euro-denominated net assets. Foreign currency gains and losses on the Hedging Instrument, which was a $28.0 million gain during the year ended December 31, 2016, are recorded as an adjustment to AOCI. See Footnote 11 for disclosures regarding the Company’s derivative financial instruments.
Future Debt Maturities
The Company’s debt maturities for the five years following December 31, 2016 and thereafter are as follows (in millions):
2017 | 2018 | 2019 | 2020 | 2021 | Thereafter | Total |
$599.0 | $558.8 | $1,750.0 | $381.3 | $1,312.4 | $7,353.8 | $11,955.3 |
FOOTNOTE 11
Derivatives
From time to time, the Company enters into derivative transactions to hedge its exposures to interest rate, foreign currency rate and commodity price fluctuations. The Company does not enter into derivative transactions for trading purposes.
Interest Rate Contracts
The Company manages its fixed and floating rate debt mix using interest rate swaps. The Company may use fixed and floating rate swaps to alter its exposure to the impact of changing interest rates on its consolidated results of operations and future cash outflows for interest. Floating rate swaps would be used, depending on market conditions, to convert the fixed rates of long-term debt into short-term variable rates. Fixed rate swaps would be used to reduce the Company’s risk of the possibility of increased interest costs. Interest rate swap contracts are therefore used by the Company to separate interest rate risk management from the debt funding decision. The cash paid and received from the settlement of interest rate swaps is included in interest expense.
83
Fair Value Hedges
At December 31, 2016, the Company had $596.0 million notional amount of interest rate swaps that exchange a fixed rate of interest for variable rate (LIBOR) of interest plus a weighted average spread. These floating rate swaps are designated as fair value hedges against $346.0 million of principal on the 4.7% Senior Subordinated Notes due 2020 and $250.0 million of principal on the 4.0% Senior Subordinated Notes due 2024 for the remaining life of these notes. The effective portion of the fair value gains or losses on these swaps is offset by fair value adjustments in the underlying debt.
Cross-Currency Contracts
The Company uses cross-currency swaps to hedge foreign currency risk on certain intercompany financing arrangements with foreign subsidiaries. As of December 31, 2016, the notional value of outstanding cross-currency interest rate swaps was $173.7 million. The cross-currency interest rate swaps are intended to eliminate uncertainty in cash flows in U.S. Dollars and British Pounds in connection with the intercompany financing arrangements. The effective portions of the changes in fair values of these cross-currency interest rate swap agreements are reported in AOCI and an amount is reclassified out of AOCI into other (income) expense, net, in the same period that the carrying value of the underlying foreign currency intercompany financing arrangements are remeasured.
Foreign Currency Contracts
The Company uses forward foreign currency contracts to mitigate the foreign currency exchange rate exposure on the cash flows related to forecasted inventory purchases and sales and have maturity dates through December 2017. The derivatives used to hedge these forecasted transactions that meet the criteria for hedge accounting are accounted for as cash flow hedges. The effective portion of the gains or losses on these derivatives is deferred as a component of AOCI and is recognized in earnings at the same time that the hedged item affects earnings and is included in the same caption in the statements of operations as the underlying hedged item. At December 31, 2016, the Company had approximately $419.0 million notional amount outstanding of forward foreign currency contracts that are designated as cash flow hedges of forecasted inventory purchases and sales.
The Company also uses foreign currency contracts, primarily forward foreign currency contracts, to mitigate the foreign currency exposure of certain other foreign currency transactions. At December 31, 2016, the Company had approximately $1.4 billion notional amount outstanding of these foreign currency contracts that are not designated as effective hedges for accounting purposes and have maturity dates through January 2017. Fair market value gains or losses are included in the results of operations and are classified in other (income) expense, net.
Commodity Contracts
The Company enters into commodity-based derivatives in order to mitigate the risk associated with the impact changes in prices of commodities could have on the cost of certain of the Company’s raw materials. These commodity-based derivatives provide the Company with cost certainty, and in certain instances, allow the Company to benefit should the cost of the commodity fall below certain dollar thresholds. At December 31, 2016 , the Company had approximately $0.7 million notional amount outstanding of commodity-based derivatives that are not designated as effective hedges for accounting purposes and have maturity dates through December 2017. Fair market value gains or losses associated with commodity derivative instruments are included in the results of operations and are classified in cost of products sold.
84
The following table summarizes the Company’s outstanding derivative instruments and their effects on the Consolidated Balance Sheets as of December 31, 2016 and 2015 (in millions):
Assets | Liabilities | |||||||||||||||||||
Derivatives designated as hedging instruments: | Balance Sheet Location | 2016 | 2015 | Balance Sheet Location | 2016 | 2015 | ||||||||||||||
Interest rate swaps | Other assets | $ | — | $ | 2.2 | Other noncurrent liabilities | $ | 5.9 | $ | 5.3 | ||||||||||
Forward-starting interest rate swaps | Prepaid expenses and other | — | 0.1 | Other accrued liabilities | — | 3.2 | ||||||||||||||
Cross-currency interest rate swaps | Other assets | 0.7 | 0.6 | Other noncurrent liabilities | 16.3 | 3.3 | ||||||||||||||
Foreign exchange contracts on forecasted transactions | Prepaid expenses and other and Other assets | 14.2 | 6.6 | Other accrued liabilities | 3.4 | 0.1 | ||||||||||||||
Foreign exchange contracts on intercompany borrowings | Prepaid expenses and other | — | — | Other accrued liabilities | — | 1.6 | ||||||||||||||
Subtotal | 14.9 | 9.5 | 25.6 | 13.5 | ||||||||||||||||
Derivatives not designated as effective hedges: | ||||||||||||||||||||
Foreign exchange contracts | Prepaid expenses and other | 18.2 | — | Other accrued liabilities | 10.9 | — | ||||||||||||||
Commodity contracts | Prepaid expenses and other | 0.2 | — | Other accrued liabilities | 0.3 | — | ||||||||||||||
Subtotal | 18.4 | — | 11.2 | — | ||||||||||||||||
Total | $ | 33.3 | $ | 9.5 | $ | 36.8 | $ | 13.5 | ||||||||||||
The Company recognized income of $25.6 million in other (income) expense, net, during the year ended December 31, 2016, related to derivatives that are not designated as hedging instruments. The amounts of gains (losses) from changes in the fair value of derivatives not designated as hedging instruments was not material for the year ended December 31, 2015.
The Company is not a party to any derivatives that require collateral to be posted prior to settlement.
Cash Flow Hedges
The pretax effects of derivative instruments designated as cash flow hedges on the Company’s Consolidated Statements of Operations and AOCI for 2016, 2015 and 2014 were as follows (in millions):
Derivatives in cash flow hedging relationships | Location of gain (loss) recognized in income | Amount of gain (loss) reclassified from AOCI into income | ||||||||||||
2016 | 2015 | 2014 | ||||||||||||
Foreign exchange contracts on forecasted transactions | Cost of products sold, intercompany sales, third party sales | $ | 7.4 | $ | 16.2 | $ | 5.9 | |||||||
Foreign exchange contracts on intercompany borrowings | Other expense, net | — | (0.1 | ) | 0.3 | |||||||||
Forward-starting interest rate swaps | Interest expense, net | (6.2 | ) | (0.8 | ) | (0.7 | ) | |||||||
Cross-currency interest rate swaps on intercompany borrowings | Other expense, net | (13.2 | ) | (1.0 | ) | — | ||||||||
$ | (12.0 | ) | $ | 14.3 | $ | 5.5 | ||||||||
85
Derivatives in cash flow hedging relationships | Amount of gain (loss) recognized in AOCI | |||||||||||
2016 | 2015 | 2014 | ||||||||||
Foreign exchange contracts on forecasted transactions | $ | 31.2 | $ | 15.5 | $ | 11.6 | ||||||
Foreign exchange contracts on intercompany borrowings | 0.1 | 0.3 | 3.3 | |||||||||
Forward-starting interest rate swaps | (88.1 | ) | (3.1 | ) | — | |||||||
Cross-currency interest rate swaps on intercompany borrowings | (13.0 | ) | (2.7 | ) | — | |||||||
$ | (69.8 | ) | $ | 10.0 | $ | 14.9 | ||||||
During December 2015, the Company entered into forward-starting interest rate swaps for an aggregate $1.0 billion notional amount for the anticipated issuance of notes to finance the Jarden transaction (the “2015 Swaps”). During January 2016, the Company entered into additional forward-starting interest rate swaps for an aggregate $1.3 billion notional amount (the “2016 Swaps,” and together with the 2015 Swaps, the “Swaps”). The total notional amount of the Swaps relating to the anticipated debt issuances for the Jarden Acquisition was $2.3 billion. In March 2016, the Company completed the offering and sale of the Notes (see Footnote 10 for additional information) and settled the Swaps. The net pretax loss and net amount paid upon settlement of the Swaps was $91.2 million, which was recorded in AOCI and is being amortized to interest expense over the terms of the Notes the Swaps were designated to hedge.
The ineffectiveness related to cash flow hedges during 2016, 2015 and 2014 was not material. The Company estimates that during the next 12 months it will reclassify income of $20.4 million included in the pretax amount recorded in AOCI as of December 31, 2016 into earnings.
FOOTNOTE 12
Commitments
The Company leases manufacturing, warehouse and other facilities; real estate; and transportation, data processing and other equipment under leases that expire at various dates through the year 2025. Rent expense, which is recognized on a straight-line basis over the life of the lease term, for continuing operations, was $216.2 million, $105.1 million and $106.1 million in 2016, 2015 and 2014, respectively.
Future minimum rental payments for operating leases with initial or remaining terms in excess of one year are as follows as of December 31, 2016 (in millions):
2017 | 2018 | 2019 | 2020 | 2021 | Thereafter | Total |
$219.1 | $189.4 | $150.8 | $113.8 | $91.4 | $260.8 | $1,025.3 |
FOOTNOTE 13
Employee Benefit and Retirement Plans
The Company and its subsidiaries have noncontributory pension, profit sharing and contributory 401(k) plans covering substantially all of their international and domestic employees. Plan benefits are generally based on years of service and/or compensation. The Company’s funding policy is to contribute not less than the minimum amounts required by the Employee Retirement Income Security Act of 1974, as amended, the Internal Revenue Code of 1986, as amended, or foreign statutes to ensure that plan assets will be adequate to provide retirement benefits.
The Company expects to recognize $17.0 million of costs in 2017 associated with amortizing net actuarial losses and prior service credits. Substantially all of the unrecognized pension and postretirement costs included in AOCI (see Footnote 4) are due to unrecognized actuarial losses.
Effective December 31, 2015, the Company changed the method used to estimate the service and interest components of net periodic benefit cost for its defined benefit pension and postretirement plans. The new estimation approach discounts the individual expected cash flows underlying the service cost and interest cost using the applicable spot rates derived from the yield curve used to discount the cash flows used to measure the benefit obligations. Historically, the estimated service and interest cost components utilized a single weighted-average discount rate derived from the yield curve used to measure the benefit obligations at the beginning of the period.
The Company elected this change to provide a more precise measurement of service and interest costs by improving the correlation between projected benefit cash flows and the corresponding spot yield curve rates. The change was accounted for as a change in accounting estimate that is inseparable from a change in accounting principle and accordingly was accounted for prospectively.
86
The Company’s tax-qualified defined benefit pension plan is frozen for the entire U.S. workforce, and the Company has replaced the defined benefit pension plan with an additional defined contribution benefit arrangement, which benefit vests after three years of employment. The Company recorded $17.4 million, $16.5 million and $15.8 million in expense for the defined contribution benefit arrangement for 2016, 2015 and 2014, respectively. The liability associated with the defined contribution benefit arrangement as of December 31, 2016 and 2015 is $17.6 million and $16.7 million, respectively, and is included in other accrued liabilities in the Consolidated Balance Sheets.
In September 2015 and September 2014, the Company commenced offers to approximately 3,300 and 5,700 former employees, respectively, who have deferred vested benefits under the Company’s tax-qualified U.S. pension plan. These former employees had the opportunity to make a one-time election to receive a lump-sum distribution of the present value of their benefits by the end of the year of the offer. Cash payments of $70.6 million and $98.6 million were made from the pension plan assets in December 2015 and December 2014, respectively, to those electing the lump-sum distribution.
As of December 31, 2016 and 2015, the Company maintained various nonqualified deferred compensation plans with varying terms. The total liability associated with these plans was $41.7 million and $44.2 million as of December 31, 2016 and 2015, respectively. These liabilities are included in other accrued liabilities and other noncurrent liabilities in the Consolidated Balance Sheets. The Company maintains assets to offset the impact of the market gains and losses associated with the deferred compensation liabilities, and the values of these assets were $57.1 million and $55.3 million as of December 31, 2016 and 2015, respectively. These assets are included in other assets in the Consolidated Balance Sheets.
The Company has a Supplemental Executive Retirement Plan (“SERP”), which is a nonqualified defined benefit and defined contribution plan pursuant to which the Company will pay supplemental benefits to certain key employees upon retirement based upon the employees’ years of service and compensation. The SERP is primarily funded through a trust agreement with a trustee that owns life insurance policies on both active and former key employees with aggregate net death benefits of $289.7 million. At December 31, 2016 and 2015, the life insurance contracts were accounted for using the investment method and had a cash surrender value of $116.0 million and $108.4 million, respectively, and are included in other assets in the Consolidated Balance Sheets. All premiums paid and proceeds received associated with the life insurance policies are included in accrued liabilities and other in the Consolidated Statements of Cash Flows. The projected benefit obligation was $122.5 million and $119.5 million at December 31, 2016 and 2015, respectively. The SERP liabilities are included in the pension table below; however, the value of the Company’s investments in the life insurance contracts, cash and mutual funds are excluded from the table, as they do not qualify as plan assets.
The Company’s matching contributions to the contributory 401(k) plan were $25.5 million, $14.0 million and $13.6 million for 2016, 2015 and 2014, respectively.
Defined Benefit Pension Plans
The following provides a reconciliation of benefit obligations, plan assets and funded status of the Company’s noncontributory defined benefit pension plans, including the SERP, as of December 31, (dollars in millions):
U.S. | International | ||||||||||||||
2016 | 2015 | 2016 | 2015 | ||||||||||||
Change in benefit obligation: | |||||||||||||||
Benefit obligation at beginning of year | $ | 937.7 | $ | 1,060.7 | $ | 613.6 | $ | 671.7 | |||||||
Service cost | 2.7 | 3.2 | 6.6 | 5.8 | |||||||||||
Interest cost | 45.1 | 41.3 | 17.5 | 19.6 | |||||||||||
Actuarial (gain) loss | (16.3 | ) | (91.9 | ) | 104.2 | (51.8 | ) | ||||||||
Currency translation | — | — | (107.9 | ) | (34.7 | ) | |||||||||
Benefits paid | (98.2 | ) | (140.4 | ) | (25.3 | ) | (28.7 | ) | |||||||
Acquisitions | 721.2 | 64.8 | 64.8 | 11.2 | |||||||||||
Curtailments, settlements and other | — | — | (26.1 | ) | 20.5 | ||||||||||
Benefit obligation at end of year (1) | $ | 1,592.2 | $ | 937.7 | $ | 647.4 | $ | 613.6 | |||||||
87
Change in plan assets: | |||||||||||||||
Fair value of plan assets at beginning of year | $ | 722.9 | $ | 752.0 | $ | 560.3 | $ | 584.4 | |||||||
Actual return on plan assets | 70.7 | (14.0 | ) | 112.4 | (7.0 | ) | |||||||||
Contributions | 12.0 | 83.1 | 16.4 | 14.5 | |||||||||||
Currency translation | — | — | (105.9 | ) | (26.9 | ) | |||||||||
Benefits paid | (98.2 | ) | (140.4 | ) | (25.3 | ) | (28.7 | ) | |||||||
Acquisitions | 523.2 | 42.2 | 34.0 | 15.0 | |||||||||||
Settlements and other | — | — | (26.6 | ) | 9.0 | ||||||||||
Fair value of plan assets at end of year | $ | 1,230.6 | $ | 722.9 | $ | 565.3 | $ | 560.3 | |||||||
Funded status at end of year | $ | (361.6 | ) | $ | (214.8 | ) | $ | (82.1 | ) | $ | (53.3 | ) | |||
Amounts recognized in the Consolidated Balance Sheets: | |||||||||||||||
Prepaid benefit cost, included in other assets | $ | — | $ | — | $ | 48.7 | $ | 35.9 | |||||||
Accrued current benefit cost, included in other accrued liabilities | (12.5 | ) | (9.6 | ) | (4.4 | ) | (3.3 | ) | |||||||
Accrued noncurrent benefit cost, included in other noncurrent liabilities | (349.1 | ) | (205.2 | ) | (126.4 | ) | (85.9 | ) | |||||||
Total | $ | (361.6 | ) | $ | (214.8 | ) | $ | (82.1 | ) | $ | (53.3 | ) | |||
U.S. | International | ||||||||||||||
2016 | 2015 | 2016 | 2015 | ||||||||||||
Assumptions: | |||||||||||||||
Weighted-average assumptions used to determine benefit obligation: | |||||||||||||||
Discount rate | 3.98 | % | 4.23 | % | 2.35 | % | 3.37 | % | |||||||
Long-term rate of compensation increase | 2.50 | % | 2.50 | % | 3.53 | % | 3.58 | % | |||||||
Accumulated benefit obligation (1) | $ | 1,592.2 | $ | 937.7 | $ | 635.1 | $ | 604.6 | |||||||
Summary of under-funded or non-funded pension benefit plans with projected benefit obligation in excess of plan assets at December 31, (in millions):
Pension Benefits | |||||||
2016 | 2015 | ||||||
Projected benefit obligation | $ | 1,941.9 | $ | 1,253.7 | |||
Fair value of plan assets | 1,449.5 | 948.4 | |||||
Summary of pension plans with accumulated obligations in excess of plan assets at December 31, (in millions):
Pension Benefits | |||||||
2016 | 2015 | ||||||
Accumulated benefit obligation | $ | 1,933.2 | $ | 1,249.9 | |||
Fair value of plan assets | 1,449.5 | 948.4 | |||||
Net pension cost includes the following components for the years ended December 31, (dollars in millions):
U.S. | International | ||||||||||||||||||||||
2016 | 2015 | 2014 | 2016 | 2015 | 2014 | ||||||||||||||||||
Service cost | $ | 2.7 | $ | 3.2 | $ | 4.1 | $ | 6.6 | $ | 5.8 | $ | 5.9 | |||||||||||
Interest cost | 45.1 | 41.3 | 45.1 | 17.5 | 19.6 | 25.3 | |||||||||||||||||
Expected return on plan assets | (69.1 | ) | (58.0 | ) | (57.5 | ) | (20.8 | ) | (22.1 | ) | (26.6 | ) | |||||||||||
Amortization of: | |||||||||||||||||||||||
Prior service (credit) cost | (0.1 | ) | (0.1 | ) | — | 0.5 | — | (0.1 | ) | ||||||||||||||
Actuarial loss | 21.8 | 26.2 | 24.2 | 2.2 | 3.4 | 3.2 | |||||||||||||||||
Curtailment, settlement and termination benefit costs | — | 52.1 | 65.4 | 2.9 | 0.4 | (0.1 | ) | ||||||||||||||||
Net pension cost | $ | 0.4 | $ | 64.7 | $ | 81.3 | $ | 8.9 | $ | 7.1 | $ | 7.6 | |||||||||||
88
U.S. | International | ||||||||||||||||
Assumptions: | 2016 | 2015 | 2014 | 2016 | 2015 | 2014 | |||||||||||
Weighted-average assumptions used to determine net periodic benefit cost: | |||||||||||||||||
Effective discount rate for benefit obligations | 4.06 | % | 4.00 | % | 4.50 | % | 3.29 | % | 3.03 | % | 4.21 | % | |||||
Effective rate for interest on benefit obligations | 3.21 | % | 4.00 | % | 4.50 | % | 2.92 | % | 3.03 | % | 4.21 | % | |||||
Effective rate for service cost | 4.16 | % | 4.00 | % | 4.50 | % | 3.39 | % | 3.03 | % | 4.21 | % | |||||
Effective rate for interest on service cost | 3.67 | % | 4.00 | % | 4.50 | % | 3.35 | % | 3.03 | % | 4.21 | % | |||||
Long-term rate of return on plan assets | 6.34 | % | 7.25 | % | 7.25 | % | 3.93 | % | 3.86 | % | 5.01 | % | |||||
Long-term rate of compensation increase | 2.50 | % | 2.50 | % | 2.50 | % | 3.51 | % | 3.60 | % | 4.21 | % | |||||
The Company made a voluntary cash contribution of $70.0 million to its U.S. defined benefit plan in January 2015. The Company expects to make cash contributions of approximately $12.5 million and $14.1 million to its domestic and international defined benefit plans, respectively, in 2017.
Plan Assets
The Company employs a total return investment approach for its pension plans whereby a mix of equities and fixed income investments are used to maximize the long-term return of pension plan assets. The intent of this strategy is to minimize plan expenses by outperforming plan liabilities over the long run. Risk tolerance is established through careful consideration of plan liabilities, plan funded status, and the Company’s financial condition. The domestic investment portfolios contain a diversified blend of equity and fixed-income investments. The domestic equity investments are diversified across geography and market capitalization through investments in U.S. large-capitalization stocks, U.S. small-capitalization stocks and international securities. The domestic fixed income investments are primarily comprised of investment-grade and high-yield securities through investments in corporate and government bonds, government agencies and asset-backed securities. The Level 1 investments are primarily based upon quoted market prices. The domestic Level 3 investments are primarily comprised of hedge funds whose assets are primarily valued based upon the net asset value (“NAV’) per share and insurance contracts valued at contract value. The investments excluded from the fair value hierarchy are NAV-based hedge fund investments that generally have a redemption frequency of 90 days or less, with various redemption notice periods that are generally less than a month. The notice periods for certain investments may vary based on the size of the redemption. The international Level 2 investments are primarily comprised of insurance contracts whose fair values are estimated based on the future cash flows to be received under the contracts discounted to the present using a discount rate that approximates the discount rate used to measure the associated pension plan liabilities. The international Level 3 investments are primarily comprised of insurance contracts valued at contract value. Investment risk is measured and monitored on an ongoing basis through annual liability measurements, periodic asset/liability studies and quarterly investment portfolio reviews.
The expected long-term rate of return for plan assets is based upon many factors, including expected asset allocations, historical asset returns, current and expected future market conditions, risk and active management premiums. The expected long-term rate of return is adjusted when there are fundamental changes in expected returns on the Company’s defined benefit pension plan’s investments. The target asset allocations for the Company’s domestic pension plans may vary by plan, based in part due to plan demographics, funded status and liability duration. In general, the Company’s target asset allocations are as follows: equities approximately 25% to 40%; bonds approximately 20% to 40%; and cash, alternative investments and other, approximately 25% to 45%. Actual asset allocations may vary from the targeted allocations for various reasons, including market conditions and the timing of transactions. The Company maintains numerous international defined benefit pension plans. The asset allocations for the international investment may vary by plan and jurisdiction and are primarily based upon the plan structure and plan participant profile.
89
The composition of domestic pension plan assets at December 31, 2016 and 2015 is as follows:
Plan Assets - Domestic Plans | ||||||||||||||||||||||||
December 31, 2016 | ||||||||||||||||||||||||
Fair Value Measurements | NAV-Based | |||||||||||||||||||||||
Asset Category | Level 1 | Level 2 | Level 3 | Subtotal | Assets | Total | ||||||||||||||||||
Equity securities and funds: | ||||||||||||||||||||||||
Domestic | $ | 149.8 | $ | — | $ | — | $ | 149.8 | $ | 120.6 | $ | 270.4 | ||||||||||||
International | 80.4 | — | — | 80.4 | 101.2 | 181.6 | ||||||||||||||||||
Fixed income securities and funds | 372.7 | — | — | 372.7 | 211.0 | 583.7 | ||||||||||||||||||
Alternative investments | 23.5 | — | 61.4 | 84.9 | 81.2 | 166.1 | ||||||||||||||||||
Cash and other | 12.5 | 15.2 | 1.1 | 28.8 | — | 28.8 | ||||||||||||||||||
Total | $ | 638.9 | $ | 15.2 | $ | 62.5 | $ | 716.6 | $ | 514.0 | $ | 1,230.6 | ||||||||||||
December 31, 2015 | ||||||||||||||||||||||||
Fair Value Measurements | NAV-Based | |||||||||||||||||||||||
Asset Category | Level 1 | Level 2 | Level 3 | Subtotal | Assets | Total | ||||||||||||||||||
Equity securities and funds: | ||||||||||||||||||||||||
Domestic | $ | 25.8 | $ | — | $ | — | $ | 25.8 | $ | 129.1 | $ | 154.9 | ||||||||||||
International | 20.3 | — | — | 20.3 | 85.7 | 106.0 | ||||||||||||||||||
Fixed income securities and funds | 307.7 | 19.7 | — | 327.4 | 82.1 | 409.5 | ||||||||||||||||||
Alternative investments | — | — | 26.3 | 26.3 | — | 26.3 | ||||||||||||||||||
Cash and other | 2.6 | 23.6 | — | 26.2 | — | 26.2 | ||||||||||||||||||
Total | $ | 356.4 | $ | 43.3 | $ | 26.3 | $ | 426.0 | $ | 296.9 | $ | 722.9 | ||||||||||||
The composition of international pension plan assets at December 31, 2016 and 2015 is as follows:
Plan Assets - International Plans | ||||||||||||||||||||||||
December 31, 2016 | ||||||||||||||||||||||||
Fair Value Measurements | NAV-Based | |||||||||||||||||||||||
Asset Category | Level 1 | Level 2 | Level 3 | Subtotal | Assets | Total | ||||||||||||||||||
Equity securities and funds | $ | 26.2 | $ | — | $ | — | $ | 26.2 | $ | 44.8 | $ | 71.0 | ||||||||||||
Fixed income securities and funds | 164.0 | — | 5.3 | 169.3 | 46.3 | 215.6 | ||||||||||||||||||
Cash and other | 4.7 | 217.8 | 13.5 | 236.0 | 42.7 | 278.7 | ||||||||||||||||||
Total | $ | 194.9 | $ | 217.8 | $ | 18.8 | $ | 431.5 | $ | 133.8 | $ | 565.3 | ||||||||||||
December 31, 2015 | ||||||||||||||||||||||||
Fair Value Measurements | NAV-Based | |||||||||||||||||||||||
Asset Category | Level 1 | Level 2 | Level 3 | Subtotal | Assets | Total | ||||||||||||||||||
Equity securities and funds | $ | 70.0 | $ | — | $ | — | $ | 70.0 | $ | 34.4 | $ | 104.4 | ||||||||||||
Fixed income securities and funds | — | 96.2 | — | 96.2 | 81.5 | 177.7 | ||||||||||||||||||
Cash and other | 3.5 | 207.4 | 0.6 | 211.5 | 66.7 | 278.2 | ||||||||||||||||||
Total | $ | 73.5 | $ | 303.6 | $ | 0.6 | $ | 377.7 | $ | 182.6 | $ | 560.3 | ||||||||||||
90
A reconciliation of the change in the fair value measurement of the defined benefit plans’ consolidated assets using significant unobservable inputs (Level 3) for 2016 and 2015 is as follows (in millions):
Total | |||
Fair value as of December 31, 2014 | $ | 68.3 | |
Realized gains | 5.2 | ||
Unrealized (losses) gains | (4.9 | ) | |
Purchases, sales, settlements, and other, net | (41.7 | ) | |
Fair value as of December 31, 2015 | $ | 26.9 | |
Acquisitions | 73.6 | ||
Realized gains | 2.2 | ||
Unrealized losses | (0.6 | ) | |
Purchases, sales, settlements and other, net | (20.8 | ) | |
Fair value as of December 31, 2016 | $ | 81.3 | |
Postretirement Benefit Plans
Several of the Company’s subsidiaries currently provide retiree health care and life insurance benefits for certain employee groups.
The following provides a reconciliation of benefit obligations and funded status of the Company’s postretirement benefit plans as of December 31, (dollars in millions):
2016 | 2015 | ||||||
Change in benefit obligation: | |||||||
Benefit obligation at beginning of year | $ | 67.9 | $ | 88.1 | |||
Service cost | 0.1 | 0.3 | |||||
Interest cost | 2.2 | 3.4 | |||||
Actuarial loss (gain) | 3.0 | (18.3 | ) | ||||
Benefits paid, net | (6.1 | ) | (5.6 | ) | |||
Acquisitions | 7.2 | — | |||||
Changes in plan benefits | 0.3 | — | |||||
Benefit obligation at end of year | $ | 74.6 | $ | 67.9 | |||
Funded status and net liability recognized at end of year | $ | (74.6 | ) | $ | (67.9 | ) | |
Amounts recognized in the Consolidated Balance Sheets: | |||||||
Accrued current benefit cost, included in other accrued liabilities | $ | (6.4 | ) | $ | (5.8 | ) | |
Accrued noncurrent benefit cost, included in other noncurrent liabilities | (68.2 | ) | (62.1 | ) | |||
Total | $ | (74.6 | ) | $ | (67.9 | ) | |
2016 | 2015 | ||||
Assumptions: | |||||
Weighted-average assumptions used to determine benefit obligation: | |||||
Discount rate | 3.75 | % | 4.00 | % | |
Current health care cost trend rate | 8.67 | % | 8.70 | % | |
Ultimate health care cost trend rate | 4.50 | % | 4.50 | % | |
There are no plan assets associated with the Company’s postretirement benefit plans.
91
Postretirement benefit costs include the following components for the years ended December 31, (in millions):
2016 | 2015 | 2014 | |||||||||
Service cost | $ | 0.1 | $ | 0.3 | $ | 1.0 | |||||
Interest cost | 2.2 | 3.4 | 4.8 | ||||||||
Amortization of: | |||||||||||
Prior service benefit | (5.2 | ) | (6.6 | ) | (6.4 | ) | |||||
Actuarial (gain) loss | (5.2 | ) | (1.2 | ) | — | ||||||
Net postretirement benefit (income) expense | $ | (8.1 | ) | $ | (4.1 | ) | $ | (0.6 | ) | ||
2016 | 2015 | 2014 | ||||||
Assumptions: | ||||||||
Weighted-average assumptions used to determine net periodic benefit cost: | ||||||||
Effective discount rate for benefits obligations | 3.97 | % | 4.00 | % | 4.50 | % | ||
Effective rate for interest on benefit obligations | 3.10 | % | 4.00 | % | 4.50 | % | ||
Effective rate for service cost | 3.46 | % | 4.00 | % | 4.50 | % | ||
Effective rate for interest on service cost | 3.19 | % | 4.00 | % | 4.50 | % | ||
The current healthcare cost trend rate gradually declines through 2037 to the ultimate trend rate and remains level thereafter. A one percentage point change in assumed healthcare cost trend rate would not have a material effect on the postretirement benefit obligation or the service and interest cost components of postretirement benefit costs.
Estimated Future Benefit Payments
Estimated future benefit payments under the Company’s defined benefit pension plans and postretirement benefit plans are as follows as of December 31, 2016 (in millions):
2017 | 2018 | 2019 | 2020 | 2021 | Thereafter | |||||||||||||
Pension benefits | $ | 126.8 | $ | 126.4 | $ | 127.3 | $ | 130.3 | $ | 130.1 | $ | 647.4 | ||||||
Postretirement benefits | $ | 6.5 | $ | 6.4 | $ | 6.3 | $ | 6.1 | $ | 5.9 | $ | 27.0 | ||||||
FOOTNOTE 14
Earnings Per Share
The calculation of basic and diluted earnings per share is shown below for the years ended December 31, (in millions, except per share data):
2016 | 2015 | 2014 | |||||||||
Numerator for basic and diluted earnings per share: | |||||||||||
Income from continuing operations | $ | 528.5 | $ | 259.3 | $ | 373.0 | |||||
(Loss) income from discontinued operations, net of tax | (0.7 | ) | 90.7 | 4.8 | |||||||
Net income | $ | 527.8 | $ | 350.0 | $ | 377.8 | |||||
Dividends and equivalents for share-based awards expected to be forfeited | — | 0.1 | 0.1 | ||||||||
Net income for basic and diluted earnings per share | $ | 527.8 | $ | 350.1 | $ | 377.9 | |||||
Denominator for basic and diluted earnings per share: | |||||||||||
Weighted-average shares outstanding | 418.3 | 267.9 | 274.2 | ||||||||
Share-based payment awards classified as participating securities | 1.5 | 1.4 | 1.9 | ||||||||
Dilutive effect from Jarden Acquisition | 1.5 | — | — | ||||||||
Denominator for basic earnings per share | 421.3 | 269.3 | 276.1 | ||||||||
Dilutive securities (1) | 1.8 | 2.2 | 2.8 | ||||||||
Denominator for diluted earnings per share | 423.1 | 271.5 | 278.9 | ||||||||
92
(1) | Dilutive securities include “in the money” options, non-participating restricted stock units and performance stock units. The weighted-average shares outstanding for 2016, 2015 and 2014 exclude the effect of approximately 0.1 million, 0.2 million and 0.2 million common stock equivalents, respectively, because such securities were anti-dilutive. |
As of December 31, 2016 , there were 9.1 million shares of the Company’s common stock that had not been issued to the former holders of 10.6 million of Jarden shares who are exercising their right to judicial appraisal under Delaware law. Absent consent by the Company, these dissenting shareholders are no longer entitled to the merger consideration, but are instead entitled only to the judicially determined fair value of their shares, plus interest accruing from the date of the Jarden Acquisition, payable in cash. However, it is possible that the Company could issue a consent to or reach agreement with one or more of these shareholders resulting in the issuance of Company shares (in lieu of or along with the payment of cash) in settlement of the dissenters’ claims.
FOOTNOTE 15
Stock-Based Compensation
The Company offers stock-based compensation to its employees that includes stock options and time-based and performance-based restricted stock units, as follows:
Stock Options
The Company has issued both nonqualified and incentive stock options at exercise prices equal to the Company’s common stock price on the date of grant with contractual terms of ten years. Stock options issued by the Company generally vest and are expensed ratably over three years. For options granted prior to 2008, options become fully vested and are exercisable for one year following termination due to death, disability or retirement at age 65 or older. For options granted since the beginning of 2008, options fully vest and are exercisable for a period of time depending on the employee’s age and years of service in the case of retirement (as defined in the stock option agreement). Stock option grants are generally subject to forfeiture if employment terminates prior to vesting, except upon retirement, in which case the options may remain outstanding and exercisable for the remaining contractual term of the option. The Company has not granted stock options since 2011.
Time-Based Restricted Stock Units
Awards of time-based restricted stock units are independent of stock option grants and are generally subject to forfeiture if employment terminates prior to vesting. The awards generally cliff-vest in one to three years or vest ratably over three years from the date of grant. In the case of retirement (as defined in the award agreement), awards vest depending on the employee’s age and years of service. The time-based restricted stock units have rights to dividend equivalents payable in cash. The Company expenses the cost of restricted stock units ratably over the vesting period, net of estimated forfeitures.
Performance-Based Restricted Stock Units
Performance-based restricted stock unit awards represent the right to receive unrestricted shares of stock based on the achievement of Company performance objectives and/or individual performance goals established by the Organizational Development & Compensation Committee and the Board of Directors. The performance-based restricted stock units generally entitle recipients to shares of common stock equal to 0% up to 200% of the number of units granted at the vesting date, depending on the level of achievement of the specified market and performance conditions (“Performance-Based RSUs”). With respect to Performance-Based RSUs granted in all years other than 2015, the number of shares in which the participant vests is based on the Company’s total shareholder return relative to its peer group over a three-year period (“Relative TSR Metric”). For Performance-Based RSUs granted in 2015, the number of shares in which the participant will vest is based on three criteria, including the Relative TSR Metric, a sales growth metric and an earnings growth metric.
Other performance-based restricted stock units entitle the recipient to shares of common stock if specified market and performance conditions are achieved and vest no earlier than one year from the date of grant and no later than seven years from the date of grant (“Stock-Price Based RSUs”).
The grant date fair value of the Performance-Based RSUs subject to the Relative TSR Metric and certain Stock-Price Based RSUs is estimated using Monte Carlo simulation, with the primary input into such valuation being the expected future volatility of the Company’s common stock, and if applicable, the volatilities of the common stocks of the companies in the Company’s peer group, upon which the relative total shareholder return performance is measured. The fair values of these awards generally approximate the fair value of the Company’s common stock on the date of grant. For Performance-Based RSUs and Stock-Price Based RSUs whose vesting is dependent on a sales growth, earnings growth or other performance metric, the Company assesses the probability of achievement of such metrics each period and records expense for the awards based on the probable achievement of such metrics.
93
Performance-based restricted stock units are not subject to the payment of dividend equivalents in the same manner as time-based restricted stock units. Rather, with respect to performance-based restricted stock units, dividend equivalents are credited to the recipient and are paid only to the extent the applicable performance criteria are met and the performance-based restricted stock units vest and the related stock is issued. In the case of retirement (as defined in the award agreement), awards vest depending on the employee’s age and years of service, subject to the satisfaction of the applicable performance criteria.
Stock Plans
The Company’s stock plans include plans adopted in 2003, 2010 and 2013. In 2013, a plan was approved by the Company’s stockholders (the “2013 Plan”). Upon approval of the 2013 Plan, shares available for issuance of new awards under all plans other than the 2013 Plan were canceled, and all future grants are required to be made from the 2013 Plan. In addition, awards under the 2010 plan granted and forfeited after December 31, 2012 have the effect of decreasing and increasing, respectively, the availability under the 2013 Plan as if the 2013 Plan were in effect as of January 1, 2013. The total number of shares of the Company’s common stock that may be issued under the 2013 Plan may not exceed 62.5 million; however, stock awards and stock units for one share reduce availability under the 2013 Plan by 3.5 shares. The 2013 Plan generally provides for awards to vest over a minimum three-year period, except for performance-based grants, which may vest over a minimum of one year, and executive new hire grants, which have no required minimum vesting period.
The following table depicts the number of shares authorized for issuance and available under the 2013 Plan (shares in millions):
2013 Plan | ||
Authorized for issuance | 62.5 | |
Effects of: | ||
Restricted stock units and Stock-Price Based RSUs (3½ times the number of awards) | 5.0 | |
Performance-Based RSUs (7 times the number of awards) | 14.4 | |
Shares available for issuance | 43.1 | |
As of December 31, 2016, the Company had 0.3 million and 0.4 million options outstanding under the 2010 and 2003 plans, respectively.
The Company accounts for stock-based compensation pursuant to relevant authoritative guidance, which requires measurement of compensation cost for all stock awards at fair value on the date of grant and recognition of compensation, net of estimated forfeitures, over the requisite service period for awards expected to vest.
The table below summarizes the expense related to share-based payments for the years ended December 31, (in millions):
2016 | 2015 | 2014 | |||||||||
Stock options | $ | — | $ | — | $ | 0.7 | |||||
Restricted stock units | 63.9 | 29.2 | 29.2 | ||||||||
Stock-based compensation | $ | 63.9 | $ | 29.2 | $ | 29.9 | |||||
Stock-based compensation, net of income tax benefit of $30.4 million, $12.9 million and $11.5 million in 2016, 2015 and 2014, respectively | $ | 33.5 | $ | 16.3 | $ | 18.4 | |||||
The following table summarizes the changes in the number of shares of common stock under option for 2016 (shares and aggregate intrinsic value in millions):
Shares | Weighted-Average Exercise Price Per Share | Aggregate Intrinsic Value | ||||||||
Outstanding at December 31, 2015 | 1.2 | $ | 20 | |||||||
Exercised | (0.5 | ) | $ | 21 | ||||||
Outstanding at December 31, 2016 | 0.7 | $ | 20 | $ | 17.5 | |||||
Exercisable at December 31, 2016 | 0.7 | $ | 20 | $ | 17.5 | |||||
The total intrinsic value of options exercised was $11.3 million in 2016. The weighted-average remaining contractual life for options outstanding and options exercisable was two years as of December 31, 2016.
94
The following table summarizes the changes in the number of outstanding restricted stock units for 2016 (shares in millions):
Restricted Stock Units | Weighted-Average Grant Date Fair Value Per Share | |||||
Outstanding at December 31, 2015 | 2.9 | $ | 34 | |||
Granted | 2.7 | $ | 54 | |||
Vested | (1.0 | ) | $ | 26 | ||
Forfeited | (0.3 | ) | $ | 45 | ||
Outstanding at December 31, 2016 | 4.3 | $ | 48 | |||
Expected to vest at December 31, 2016 | 4.0 | $ | 48 | |||
The weighted-average grant-date fair values of awards granted were $41 and $33 per share in 2015 and 2014, respectively. The fair values of awards that vested were $54.1 million, $74.2 million and $41.0 million in 2016, 2015 and 2014, respectively. In 2017, the Company expects to repurchase 0.4 million shares to satisfy employee tax withholding obligations in connection with the vesting of restricted stock units and Performance-Based RSUs.
During 2016, 2015 and 2014, the Company awarded 1.1 million, 0.7 million and 0.7 million Performance-Based RSUs, respectively, which entitle recipients to shares of the Company’s stock at the end of a three-year vesting period if specified performance or market conditions are achieved. The Performance-Based RSUs entitle recipients to shares of common stock equal to 0% up to 200% of the number of units granted at the vesting date, depending on the level of achievement of the specified performance, market and service conditions. As of December 31, 2016, 2.1 million Performance-Based RSUs were outstanding, and based on performance through December 31, 2016, recipients of Performance-Based RSUs would be entitled to 3.0 million shares at the vesting date. The Performance-Based RSUs are included in the preceding table as if the participants earn shares equal to 100% of the units granted.
The following table summarizes the Company’s total unrecognized compensation cost related to stock-based compensation as of December 31, 2016 (in millions):
Unrecognized Compensation Cost | Weighted-Average Period of Expense Recognition (in years) | ||||
Restricted stock units | $ | 119.1 | 2 | ||
FOOTNOTE 16
Income Taxes
The provision for income taxes consists of the following for the years ended December 31, (in millions):
2016 | 2015 | 2014 | |||||||||
Current: | |||||||||||
Federal | $ | 126.6 | $ | 103.0 | $ | 24.5 | |||||
State | 39.0 | 18.8 | 5.9 | ||||||||
Foreign | 86.8 | 19.4 | 19.2 | ||||||||
Total current | 252.4 | 141.2 | 49.6 | ||||||||
Deferred | 33.4 | (7.2 | ) | 39.3 | |||||||
Total provision | $ | 285.8 | $ | 134.0 | $ | 88.9 | |||||
Total provision (benefit) — discontinued operations | $ | (0.2 | ) | $ | 55.8 | $ | (0.2 | ) | |||
Total provision — continuing operations | $ | 286.0 | $ | 78.2 | $ | 89.1 | |||||
The non-U.S. component of income before income taxes was $480.4 million, $186.2 million and $163.3 million in 2016, 2015 and 2014, respectively.
95
A reconciliation of the U.S. statutory rate to the effective income tax rate on a continuing basis is as follows for the years ended December 31,:
2016 | 2015 | 2014 | ||||||
Statutory rate | 35.0 | % | 35.0 | % | 35.0 | % | ||
Add (deduct) effect of: | ||||||||
State income taxes, net of federal income tax effect | 4.2 | 3.0 | 2.1 | |||||
Foreign tax credit | 1.3 | (17.5 | ) | (5.5 | ) | |||
Foreign rate differential | (9.8 | ) | (10.5 | ) | (7.0 | ) | ||
Resolution of tax contingencies, net of increases | (2.1 | ) | 1.2 | (0.6 | ) | |||
Valuation allowance reserve (decrease) increase | (3.3 | ) | 0.2 | (2.7 | ) | |||
Manufacturing deduction | (2.2 | ) | (2.0 | ) | (1.5 | ) | ||
Statutory tax rate change | (4.9 | ) | — | — | ||||
Tools outside basis difference | 20.2 | — | — | |||||
Venezuela deconsolidation | — | 15.7 | — | |||||
Other | (3.3 | ) | (1.9 | ) | (0.5 | ) | ||
Effective rate | 35.1 | % | 23.2 | % | 19.3 | % | ||
The components of net deferred tax assets are as follows as of December 31, (in millions):
2016 | 2015 | ||||||
Deferred tax assets: | |||||||
Accruals not currently deductible for tax purposes | $ | 285.8 | $ | 166.9 | |||
Inventory | 83.9 | 4.8 | |||||
Postretirement liabilities | 44.0 | 28.6 | |||||
Pension liabilities | 149.8 | 113.5 | |||||
Net operating losses | 361.3 | 248.3 | |||||
Foreign tax credits | 34.0 | — | |||||
Other | 193.0 | 78.8 | |||||
Total gross deferred tax assets | 1,151.8 | 640.9 | |||||
Less valuation allowance | (325.3 | ) | (291.0 | ) | |||
Net deferred tax assets after valuation allowance | $ | 826.5 | $ | 349.9 | |||
Deferred tax liabilities: | |||||||
Accelerated depreciation | $ | (159.5 | ) | $ | (69.7 | ) | |
Amortizable intangibles | (5,300.5 | ) | (463.6 | ) | |||
Outside basis differences | (319.0 | ) | — | ||||
Other | (35.0 | ) | (4.7 | ) | |||
Total gross deferred tax liabilities | $ | (5,814.0 | ) | $ | (538.0 | ) | |
Net deferred tax liabilities | $ | (4,987.5 | ) | $ | (188.1 | ) | |
Noncurrent deferred income tax assets | $ | 95.3 | $ | 38.5 | |||
Noncurrent deferred income tax liabilities | (5,082.8 | ) | (226.6 | ) | |||
$ | (4,987.5 | ) | $ | (188.1 | ) | ||
The Company has $1,511.3 million of U.S., State, and foreign net operating losses, of which $811.3 million do not expire and $700.0 million expire between 2017 and 2036. $442.2 million are U.S. federal net operating losses which are subject to varying limitations on their use under Section 382 of the Internal Revenue Code of 1986, as amended. Of these U.S. federal net operating losses, $406.0 million are not reflected in the consolidated financial statements and approximately $31.0 million were utilized in the current year. The foreign tax credit carryforwards begin to expire in 2020.
The Company routinely reviews valuation allowances recorded against deferred tax assets on a more likely than not basis as to whether the Company has the ability to realize the deferred tax assets. In making such a determination, the Company takes into consideration all available and appropriate positive and negative evidence, including projected future taxable income, future reversals of existing taxable temporary differences, the ability to carryback net operating losses, and available tax planning
96
strategies. Although realization is not assured, based on this existing evidence, the Company believes it is more likely than not that the Company will realize the benefit of existing deferred tax assets, net of the valuation allowances.
As of December 31, 2016, the Company has a valuation allowance recorded against foreign net operating losses and other deferred tax assets the Company believes are not more likely than not to be realized due to the uncertainty resulting from a lack of previous taxable income within the applicable tax jurisdictions. A valuation allowance of $325.3 million and $291.0 million was recorded against certain deferred tax asset balances as of December 31, 2016 and 2015, respectively. For the year ended December 31, 2016, the Company recorded a net valuation allowance increase of $34.3 million which comprised of acquired valuation allowance from Jarden, a valuation allowance decrease of $17.9 million related to the Company’s UK operations for which the Company concluded the deferred tax assets were realizable; currency translation in foreign jurisdictions due to the strengthening of the U.S. dollar against the Euro, British Pound, and other currencies; and the increase in valuation allowance in the current year in certain jurisdictions that the Company previously determined were not more likely than not to be realized. For the year ended December 31, 2015, the Company recorded a net valuation allowance decrease of $54.3 million which is comprised of a valuation allowance reduction of $12.8 million for which the Company concluded the deferred tax assets were realizable; currency translation in foreign jurisdictions due to the strengthening of the U.S. dollar against the Euro and other currencies; and, the utilization of prior year net operating losses in the current year in certain jurisdictions that the Company previously determined were not more likely than not to be realized. For the year ended December 31, 2014, the Company recorded a net valuation allowance decrease of $30.2 million which comprised a valuation allowance reduction of $18.4 million related to various foreign jurisdictions in which the Company concluded the deferred tax assets were realizable; currency translation in foreign jurisdictions due to the strengthening of the U.S. dollar against the Euro, Yen, and other currencies; and the utilization of prior year net operating losses in the current year in certain jurisdictions that the Company previously determined were not more likely than not to be realized.
As of the acquisition date April 15, 2016, the Company analyzed the unremitted historical earnings of Jarden’s non-U.S. subsidiaries and recorded a deferred tax liability on the opening balance sheet of $120 million related to most of Jarden’s historical unremitted earnings. As of December 31, 2016, this deferred tax liability decreased to $79.9 million due to distributions and currency fluctuations. The remaining, unremitted non-U.S. subsidiary earnings of the Company at December 31, 2016 are $1,236.1 million. These earnings and profits are considered to be indefinitely reinvested and, accordingly, no U.S. federal or state deferred income taxes have been provided on this amount or any additional excess of the amount for financial reporting over the tax basis of investments in foreign subsidiaries. Earnings and profits is the most significant component of the basis difference which is indefinitely reinvested. Upon distribution of those earnings in the form of dividends or otherwise, the Company would be subject to U.S. income taxes and withholding taxes payable in various non-U.S. jurisdictions, which could potentially be offset by foreign tax credits. Determination of the amount of unrecognized deferred U.S. income tax liability is not practicable because of the complexities associated with its hypothetical calculation.
As of December 31, 2016 and 2015, the Company had unrecognized tax benefits of $367.9 million and $162.9 million, respectively. The Company recorded unrecognized tax benefit as a result of acquisitions of $216.4 million in 2016. If recognized, $359.9 million and $155.4 million as of December 31, 2016 and 2015, respectively, would affect the effective tax rate. The Company recognizes interest and penalties, if any, related to unrecognized tax benefits as a component of income tax expense. As of December 31, 2015 and 2014, the Company had recorded accrued interest and penalties related to the unrecognized tax benefits of $21.2 million and $6.3 million, respectively. During 2016, the Company recognized income tax expense on interest and penalties of $3.4 million due to the accrual of current year interest on existing positions offset by the resolution of certain tax contingencies offset. In 2015, the Company recognized an income tax benefit on interest and penalties of $0.1 million due to the resolution of certain tax contingencies offset by an accrual of current year interest on existing positions.
The following table summarizes the changes in gross unrecognized tax benefits for the years ended December 31, (in millions):
2016 | 2015 | ||||||
Unrecognized tax benefits balance at January 1, | $ | 162.9 | $ | 101.4 | |||
Acquisition related | 216.4 | — | |||||
Increases in tax positions for prior years | 4.8 | 63.1 | |||||
Decreases in tax positions for prior years | (4.4 | ) | (19.4 | ) | |||
Increases in tax positions for current year | 30.0 | 21.5 | |||||
Settlements with taxing authorities | (0.1 | ) | (2.6 | ) | |||
Lapse of statute of limitations | (41.7 | ) | (1.1 | ) | |||
Unrecognized tax benefits balance at December 31, | $ | 367.9 | $ | 162.9 | |||
The Company anticipates approximately $39.6 million of unrecognized tax benefits will reverse within the next 12 months. It is reasonably possible due to activities of various worldwide taxing authorities, including proposed assessments of additional tax and possible settlement of audit issues that additional changes to the Company’s unrecognized tax benefits could occur. In the
97
normal course of business, the Company is subject to audits by worldwide taxing authorities regarding various tax liabilities. The Company’s U.S. federal income tax returns for 2011, 2012, and 2013 as well as certain state and non-US income tax returns for various years, are under routine examination.
The Company files numerous consolidated and separate income tax returns in the U.S. federal jurisdiction and various state and foreign jurisdictions. The statute of limitations for the Company’s U.S. federal income tax returns has expired for years prior to 2011.The Company’s Canadian tax returns are subject to examination for years after 2010. With few exceptions, the Company is no longer subject to other income tax examinations for years before 2012.
FOOTNOTE 17
Fair Value
Accounting principles generally accepted in the U.S. define fair value as the price that would be received to sell an asset or transfer a liability in an orderly transaction between market participants. As such, fair value is a market-based measurement that should be determined based on assumptions that market participants would use in pricing an asset or liability. The authoritative guidance discusses valuation techniques, such as the market approach (comparable market prices), the income approach (present value of future income or cash flow), and the cost approach (cost to replace the service capacity of an asset or replacement cost). These valuation techniques are based upon observable and unobservable inputs. Observable inputs reflect market data obtained from independent sources, while unobservable inputs reflect the Company’s market assumptions. As the basis for evaluating such inputs, a three-tier value hierarchy prioritizes the inputs used in measuring fair value as follows:
Level 1: Observable inputs such as quoted prices for identical assets or liabilities in active markets.
Level 2: Observable inputs other than quoted prices that are directly or indirectly observable for the asset or liability, including quoted prices for similar assets or liabilities in active markets; quoted prices for similar or identical assets or liabilities in markets that are not active; and model-derived valuations whose inputs are observable or whose significant value drivers are observable.
Level 3: Unobservable inputs that reflect the reporting entity’s own assumptions.
Recurring Fair Value Measurements
The Company’s financial assets and liabilities adjusted to fair value at least annually are its money market fund investments included in cash and cash equivalents, its mutual fund investments included in other assets, and its derivative instruments, which are primarily included in prepaid expenses and other, other assets, other accrued liabilities and other noncurrent liabilities.
The Company determines the fair value of its mutual fund investments based on quoted market prices (Level 1).
Level 2 fair value determinations are derived from directly or indirectly observable (market-based) information. Such inputs are the basis for the fair values of the Company’s money market fund investments and derivative instruments. The money market fund investments held by the Company and included in cash and cash equivalents are not publicly traded, but the fair value is determined based on the values of the underlying investments in the money market fund (Level 2). The Company generally uses derivatives for hedging purposes, and the Company’s derivatives are primarily foreign currency forward contracts and interest rate swaps. The Company determines the fair value of its derivative instruments using standard pricing models and market-based assumptions for all significant inputs, such as yield curves and quoted spot and forward exchange rates. Accordingly, the Company’s derivative instruments are classified as Level 2.
98
The following tables present the Company’s non-pension financial assets and liabilities, which are measured at fair value on a recurring basis (in millions):
Fair value as of December 31, 2016 | Total | Level 1 | Level 2 | Level 3 | |||||||||||
Assets | |||||||||||||||
Investment securities, including mutual funds(1) | $ | 14.7 | $ | 4.8 | $ | 9.9 | $ | — | |||||||
Derivatives | 33.3 | — | 33.3 | — | |||||||||||
Total | $ | 48.0 | $ | 4.8 | $ | 43.2 | $ | — | |||||||
Liabilities | |||||||||||||||
Derivatives | $ | 36.8 | — | 36.8 | — | ||||||||||
Total | $ | 36.8 | $ | — | $ | 36.8 | $ | — | |||||||
Fair value as of December 31, 2015 | |||||||||||||||
Assets | |||||||||||||||
Investment securities, including mutual funds(1) | $ | 6.9 | $ | 4.5 | $ | 2.4 | $ | — | |||||||
Derivatives | 9.5 | — | 9.5 | — | |||||||||||
Total | $ | 16.4 | $ | 4.5 | $ | 11.9 | $ | — | |||||||
Liabilities | |||||||||||||||
Derivatives | $ | 13.5 | — | 13.5 | — | ||||||||||
Total | $ | 13.5 | $ | — | $ | 13.5 | $ | — | |||||||
(1) | The values of investment securities, including mutual funds, are classified as cash and cash equivalents ($7.9 million and $2.0 million as of December 31, 2016 and 2015, respectively) and other assets ($6.8 million and $4.9 million as of December 31, 2016 and 2015, respectively). For mutual funds that are publicly traded, fair value is determined on the basis of quoted market prices and, accordingly, these investments have been classified as Level 1. Other investment securities are valued at the net asset value per share or unit multiplied by the number of shares or units held as of the measurement date and have been classified as Level 2. |
The Company adjusts its pension asset values to fair value on an annual basis. See Footnote 13 of the Notes to Consolidated Financial Statements for information regarding the fair values of the Company’s pension assets.
Nonrecurring Fair Value Measurements
The Company’s nonfinancial assets which are measured at fair value on a nonrecurring basis include property, plant and equipment, goodwill, intangible assets and certain other assets.
The Company’s annual and interim impairment tests of goodwill and indefinite-lived intangible assets did not result in the Company recording any material impairment charges during 2016, 2015 and 2014. In making the assessment of goodwill impairment, management relies on a number of factors including operating results, business plans, economic projections, anticipated future cash flows, transactions and marketplace data. Accordingly, these fair value measurements fall in Level 3 of the fair value hierarchy. The factors used by management in the impairment analysis are inherently subject to uncertainty. While the Company believes it has made reasonable estimates and assumptions to determine the fair value of its reporting units, if actual results are not consistent with management’s estimates and assumptions, goodwill and other intangible assets may be overstated and could potentially trigger additional impairment charges.
During 2016, 2015 and 2014 impairments associated with plans to dispose of certain property, plant and equipment were not material. The impairments were estimated based on the proceeds expected to be realized upon disposition of the assets. In the absence of a definitive sales price for these and similar types of assets, the Company generally uses projected cash flows, discounted as necessary, or market multiples to estimate the fair values of the impaired assets. Key inputs into the projected cash flows include management’s projections of cash flows on a held-and-used basis (if applicable), management’s projections of cash flows upon disposition and discount rates. Key inputs into the market multiple approach include identifying companies comparable to the Company’s business and estimated control premiums. Accordingly, these fair value measurements fall in the Level 3 category of the fair value hierarchy. These assets and certain liabilities are measured at fair value on a nonrecurring basis as part of the Company’s impairment assessments and as circumstances require.
The Company completed the acquisitions of Jarden during 2016, Elmer’s during 2015 and Ignite and Baby Jogger during 2014. The Company also acquired the assets of bubba during 2014. The Company allocates purchase consideration to the tangible assets acquired, liabilities assumed and intangible assets acquired based on their estimated fair values. Determining the fair values of assets acquired and liabilities assumed, particularly acquired intangible assets, requires the Company to make estimates and assumptions, including estimates regarding the future expected cash flows from customer relationships, trade names and trademarks and acquired patents and developed technology; royalty rates; the period of time the Company expects to use the acquired intangible
99
asset; and discount rates. In marking these estimates, the Company considers demand, competition and other economic factors. The Company allocated $13.5 billion and $249.0 million of value to intangible assets acquired in 2016 and 2015, respectively. The Company’s estimates and projections are inherently uncertain, and the estimated values of assets acquired and liabilities assumed are dependent on such estimates. Accordingly, these fair value measurements fall in the Level 3 category of the fair value hierarchy. Acquired assets and liabilities are measured at fair value on a nonrecurring basis, generally in connection with acquisitions and as circumstances require for impairment testing.
The carrying value and estimated fair value measurement of assets held for sale are classified as Level 3, as the fair values utilize significant unobservable inputs. As discussed in Footnote 3, as of December 31, 2015, the net assets held for sale represented the Décor business, which was sold on June 30, 2016 without further adjustment to their carrying values. Also as discussed in Footnote 3, as of December 31, 2016, there were several businesses and brands that the Company announced it would divest and relating to which their assets and liabilities were classified as assets and liabilities held for sale as of December 31, 2016.
Financial Instruments
The Company’s financial instruments include cash and cash equivalents, accounts receivable, accounts payable, derivative instruments, notes payable and short- and long-term debt. The carrying values for current financial assets and liabilities, including cash and cash equivalents, accounts receivable and accounts payable, approximate fair value due to the short maturity of such instruments. The fair values of the Company’s derivative instruments are recorded in the Consolidated Balance Sheets and are disclosed in Footnote 11. The fair values of the Company’s senior notes (see Footnote 11) are based on quoted market prices and are as follows as of December 31, (in millions):
2016 | 2015 | ||||||||||||||
Fair Value | Book Value | Fair Value | Book Value | ||||||||||||
Senior notes | $ | 11,979.2 | $ | 11,234.1 | $ | 2,660.7 | $ | 2,692.6 | |||||||
The carrying amounts of all other significant debt approximates fair value.
FOOTNOTE 18
Industry Segment Information
On April 15, 2016, Jarden became a direct wholly-owned subsidiary of Newell Brands Inc. Jarden is a global consumer products company with brands such as Yankee Candle®, Crock-Pot®, FoodSaver®, Mr. Coffee®, Oster®, Coleman®, First Alert®, Rawlings®, Jostens®, K2®, Marker®, Marmot®, Völkl® and many others. The segment information includes results of operations of Jarden since the acquisition date in the following Jarden segments: Branded Consumables, Consumer Solutions, Outdoor Solutions and Process Solutions.
On October 22, 2015, the Company acquired Elmer’s, whose brands include Elmer’s®, Krazy Glue® (a trademark of Toagosei Co. Ltd. used with permission) and X-Acto®. Elmer’s is a provider of activity-based adhesive and cutting products and is included in the Writing segment. The segment information includes the results of operations of Elmer’s since the acquisition date. Refer to Footnote 2 for additional information about the acquisition.
On September 4, 2014, the Company acquired 100% of Ignite. Ignite is a designer and marketer of durable beverage containers sold under the Contigo® and Avex® brands and is included in the Home Solutions segment. On October 22, 2014, the Company acquired the assets of bubba, a designer and marketer of durable beverage containers, which is included in the Home Solutions segment. On December 15, 2014, the Company acquired Baby Jogger, a designer and marketer of premium infant and juvenile products focused on activity strollers and related accessories, which is included in the Baby & Parenting segment. The segment information includes the results of operations of all three acquired companies since the acquisition date. Refer to Footnote 2 for additional information about the acquisitions.
100
The Company’s reportable segments are as follows:
Segment | Key Brands | Description of Primary Products | ||
Writing | Sharpie®, Paper Mate®, Expo®, Prismacolor®, Mr. Sketch®, Elmer's®, X-Acto®, Parker®, Waterman®, Dymo® Office | Writing instruments, including markers and highlighters, pens and pencils; art products; activity-based adhesive and cutting products; fine writing instruments; labeling solutions | ||
Home Solutions | Rubbermaid®, Contigo®, bubba®, Calphalon®, Goody® | Indoor/outdoor organization, food storage and home storage products; durable beverage containers; gourmet cookware, bakeware and cutlery; hair care accessories | ||
Tools | Irwin®, Lenox®, hilmor™, Dymo® Industrial | Hand tools and power tool accessories; industrial bandsaw blades; tools for HVAC systems; label makers and printers for industrial use | ||
Commercial Products | Rubbermaid Commercial Products® | Cleaning and refuse products; hygiene systems; material handling solutions | ||
Baby & Parenting | Graco®, Baby Jogger®, Aprica®, Teutonia® | Infant and juvenile products such as car seats, strollers, highchairs and playards | ||
Branded Consumables | Yankee Candle®, Waddington, Ball®, Diamond®, First Alert®, NUK®, Quickie®, Pine Mountain® | Branded consumer products; consumable and fundamental household staples | ||
Consumer Solutions | Crock-Pot®, FoodSaver®, Holmes®, Mr. Coffee®, Oster®, Rainbow®, Sunbeam® | Household products, including kitchen appliances and home environment products | ||
Outdoor Solutions | Coleman®, Jostens®, Berkley®, Shakespeare®, Rawlings®, Völkl®, K2®, Marmot® | Products for outdoor and outdoor-related activities | ||
Process Solutions | Jarden Plastic Solutions, Jarden Applied Materials, Jarden Zinc Products | Plastic products, including closures, contact lens packaging, medical disposables, plastic cutlery and rigid packaging | ||
101
The Company’s segment and geographic results are as follows as of and for the years ended December 31, (in millions):
2016 | 2015 | 2014 | |||||||||
Net Sales(1) | |||||||||||
Writing | $ | 1,941.9 | $ | 1,763.5 | $ | 1,708.9 | |||||
Home Solutions | 1,568.4 | 1,704.2 | 1,575.4 | ||||||||
Tools | 760.7 | 790.0 | 852.2 | ||||||||
Commercial Products | 776.6 | 809.7 | 837.1 | ||||||||
Baby & Parenting | 919.5 | 848.3 | 753.4 | ||||||||
Branded Consumables | 2,839.2 | — | — | ||||||||
Consumer Solutions | 1,766.3 | — | — | ||||||||
Outdoor Solutions | 2,415.9 | — | — | ||||||||
Process Solutions | 275.5 | — | — | ||||||||
$ | 13,264.0 | $ | 5,915.7 | $ | 5,727.0 | ||||||
Operating Income(2) | |||||||||||
Writing | $ | 462.7 | $ | 430.8 | $ | 416.6 | |||||
Home Solutions | 179.2 | 238.4 | 196.0 | ||||||||
Tools | 85.4 | 85.1 | 94.6 | ||||||||
Commercial Products | 113.1 | 100.8 | 101.3 | ||||||||
Baby & Parenting | 114.4 | 55.2 | 40.6 | ||||||||
Branded Consumables | 330.5 | — | — | ||||||||
Consumer Solutions | 147.1 | — | — | ||||||||
Outdoor Solutions | 90.1 | — | — | ||||||||
Process Solutions | 14.8 | — | — | ||||||||
Restructuring costs | (74.9 | ) | (77.2 | ) | (52.8 | ) | |||||
Corporate | (362.3 | ) | (231.7 | ) | (191.6 | ) | |||||
$ | 1,100.1 | $ | 601.4 | $ | 604.7 | ||||||
2016 | 2015 | 2014 | |||||||||
Depreciation & Amortization(2) | |||||||||||
Writing | $ | 33.9 | $ | 23.9 | $ | 25.9 | |||||
Home Solutions | 49.1 | 45.4 | 29.7 | ||||||||
Tools | 16.7 | 16.6 | 15.3 | ||||||||
Commercial Products | 17.5 | 16.9 | 21.4 | ||||||||
Baby & Parenting | 16.2 | 15.0 | 11.1 | ||||||||
Branded Consumables | 118.4 | — | — | ||||||||
Consumer Solutions | 30.6 | — | — | ||||||||
Outdoor Solutions | 86.7 | — | — | ||||||||
Process Solutions | 24.5 | — | — | ||||||||
Corporate(2) | 43.6 | 52.3 | 50.4 | ||||||||
$ | 437.2 | $ | 170.1 | $ | 153.8 | ||||||
102
2016 | 2015 | 2014 | |||||||||
Capital Expenditures(3) | |||||||||||
Writing | $ | 61.8 | $ | 39.5 | $ | 34.3 | |||||
Home Solutions | 59.8 | 47.6 | 31.1 | ||||||||
Tools | 19.1 | 19.2 | 18.4 | ||||||||
Commercial Products | 22.9 | 31.1 | 27.6 | ||||||||
Baby & Parenting | 12.5 | 14.1 | 8.7 | ||||||||
Branded Consumables | 106.7 | — | — | ||||||||
Consumer Solutions | 13.8 | — | — | ||||||||
Outdoor Solutions | 56.3 | — | — | ||||||||
Process Solutions | 15.9 | — | — | ||||||||
Corporate(3) | 72.6 | 58.7 | 40.1 | ||||||||
$ | 441.4 | $ | 210.2 | $ | 160.2 | ||||||
2016 | 2015 | ||||||
Identifiable Assets | |||||||
Writing | $ | 3,152.0 | $ | 1,286.5 | |||
Home Solutions | 1,757.8 | 776.7 | |||||
Tools | 1,756.7 | 578.8 | |||||
Commercial Products | 989.2 | 351.7 | |||||
Baby & Parenting | 1,048.0 | 485.1 | |||||
Branded Consumables | 11,103.1 | — | |||||
Consumer Solutions | 5,298.8 | — | |||||
Outdoor Solutions | 6,975.3 | — | |||||
Process Solutions | 1,020.6 | — | |||||
Corporate(4) | 736.0 | 3,780.7 | |||||
$ | 33,837.5 | $ | 7,259.5 | ||||
Geographic Area Information | |||||||||||
(in millions) | 2016 | 2015 | 2014 | ||||||||
Net Sales(1) (5) | |||||||||||
United States | $ | 9,518.4 | $ | 4,291.8 | $ | 3,945.1 | |||||
Canada | 720.1 | 249.8 | 284.3 | ||||||||
Total North America | 10,238.5 | 4,541.6 | 4,229.4 | ||||||||
Europe, Middle East and Africa | 1,659.0 | 591.1 | 683.5 | ||||||||
Latin America | 643.6 | 408.5 | 409.9 | ||||||||
Asia Pacific | 722.9 | 374.5 | 404.2 | ||||||||
Total International | 3,025.5 | 1,374.1 | 1,497.6 | ||||||||
$ | 13,264.0 | $ | 5,915.7 | $ | 5,727.0 | ||||||
Operating Income (Loss)(2) | |||||||||||
United States | $ | 746.3 | $ | 440.1 | $ | 405.2 | |||||
Canada | 111.1 | 53.4 | 62.7 | ||||||||
Total North America | 857.4 | 493.5 | 467.9 | ||||||||
Europe, Middle East and Africa | 188.9 | 57.1 | 82.0 | ||||||||
Latin America | 6.3 | 43.4 | 39.1 | ||||||||
Asia Pacific | 47.5 | 7.4 | 15.7 | ||||||||
Total International | 242.7 | 107.9 | 136.8 | ||||||||
$ | 1,100.1 | $ | 601.4 | $ | 604.7 | ||||||
103
(1) | All intercompany transactions have been eliminated. Sales to Wal-Mart Stores, Inc. and subsidiaries amounted to approximately 13.5%, 10.9% and 10.6% of consolidated net sales in 2016, 2015 and 2014, respectively, substantially across all segments. |
(2) | Operating income (loss) by segment is net sales less cost of products sold and selling, general & administrative (“SG&A”) expenses. Operating income by geographic area is net sales less cost of products sold, SG&A expenses, impairment charges and restructuring costs. Certain headquarters expenses of an operational nature are allocated to business segments and geographic areas primarily on a net sales basis. Depreciation and amortization is allocated to the segments on a percentage of sales basis, and the allocated depreciation and amortization is included in segment operating income. Depreciation and amortization excludes $1.5 million and $2.3 million included in discontinued operations for 2015 and 2014, respectively. |
(3) | Corporate capital expenditures includes capital expenditures related to the SAP and other software implementations and corporate property, plant and equipment. Capital expenditures exclude $1.2 million and $1.7 million associated with discontinued operations in 2015 and 2014, respectively. |
(4) | Corporate assets primarily include goodwill (in 2015), capitalized software, cash, deferred tax assets and assets held for sale. |
(5) | Geographic sales information is based on the region from which the products are shipped and invoiced. Long-lived assets by geography are not presented because it is impracticable to do so. |
The following table summarizes the net sales by product grouping for the years ended December 31, (in millions):
2016 | 2015 | 2014 | |||||||||
Writing: | |||||||||||
Writing instruments | $ | 1,469.8 | $ | 1,501.3 | $ | 1,451.3 | |||||
Adhesive and cutting products | 243.5 | 36.3 | — | ||||||||
Technology solutions | 228.6 | 225.9 | 257.6 | ||||||||
1,941.9 | 1,763.5 | 1,708.9 | |||||||||
Home Solutions: | |||||||||||
Home and food storage products | 1,058.7 | 1,033.0 | 867.5 | ||||||||
Décor | 141.8 | 300.8 | 315.3 | ||||||||
Other | 367.9 | 370.4 | 392.6 | ||||||||
1,568.4 | 1,704.2 | 1,575.4 | |||||||||
Tools | 760.7 | 790.0 | 852.2 | ||||||||
Commercial Products | 776.6 | 809.7 | 837.1 | ||||||||
Baby & Parenting | 919.5 | 848.3 | 753.4 | ||||||||
Branded Consumables | 2,839.2 | — | — | ||||||||
Consumer Solutions | 1,766.3 | — | — | ||||||||
Outdoor Solutions | 2,415.9 | — | — | ||||||||
Process Solutions | 275.5 | — | — | ||||||||
$ | 13,264.0 | $ | 5,915.7 | $ | 5,727.0 | ||||||
FOOTNOTE 19
Litigation and Contingencies
The Company is involved in legal proceedings in the ordinary course of its business. These proceedings include claims for damages arising out of use of the Company’s products, allegations of infringement of intellectual property, commercial disputes and employment matters, as well as environmental matters. Some of the legal proceedings include claims for punitive as well as compensatory damages, and certain proceedings may purport to be class actions.
The Company, using current product sales data and historical trends, actuarially calculates the estimate of its exposure for product liability. The Company had product liability reserves of $81.7 million and $41.2 million as of December 31, 2016 and 2015, respectively. The Company is insured for product liability claims for amounts in excess of established deductibles and accrues for the estimated liability as described up to the limits of the deductibles. All other claims and lawsuits are handled on a case-by-case basis.
The Company recognizes warranty costs based on an estimate of amounts required to meet future warranty obligations arising as part of the sale of its products. The Company accrues an estimated liability at the time of a product sale based on historical claim rates applied to current period sales, as well as any information applicable to current product sales that may indicate a deviation from such historical claim rate trends.
Recall of Harness Buckles on Select Car Seats
In February 2014, Graco, a subsidiary of the Company, announced a voluntary recall in the U.S. of harness buckles used on approximately 4 million toddler car seats manufactured between 2006 and 2013. In July 2014, Graco announced that it had agreed
104
to expand the recall to include certain infant car seats manufactured between July 2010 and May 2013. There have been no reported injuries associated with the recalled harness buckles used on these toddler or infant car seats. In December 2014, the National Highway Traffic Safety Administration (the “NHTSA”) announced an investigation into the timeliness of the recall, and in March 2015, the investigation concluded with Graco entering into a consent order with NHTSA pursuant to which Graco committed to spend $7.0 million in total over a five-year period to enhance child passenger safety and make a $3.0 million payment to NHTSA, which was paid in the year ended December 31, 2015. With respect to the $7.0 million required to be spent over five years, the Company has spent approximately $2.1 million to date. The Company recorded the $10.0 million of costs associated with the consent order in the first quarter of 2015.
Legal Matters
A class action lawsuit, Hirsch v. Lillie, et al., was filed on February 24, 2016 on behalf of Jarden shareholders in the United States District Court for the Southern District of Florida, alleging violations of Section 14(a) of the Exchange Act in respect of the Registration/Proxy Statement on Form S-4 relating to the Jarden Acquisition. The suit named each of the Jarden directors as defendants, as well as the Company. No individual directors or officers of the Company were named as defendants. The parties entered into a settlement term sheet, pursuant to which the Company added certain disclosures to the Form S-4. Counsel for the shareholders filed in July 2016, but then withdrew in August 2016, a motion to approve the settlement. In October 2016, the Company and its relevant subsidiaries were voluntarily dismissed from the case. In December 2016, the parties (including the Company) entered into a new settlement whereby the lawsuit was voluntarily dismissed.
A second class action lawsuit, Paree v. Franklin, et al., was filed in the State Circuit Court in Palm Beach County, Florida on March 10, 2016, purportedly on behalf of Jarden stockholders, against the directors of Jarden. The Company was also named as a defendant. Plaintiff alleged that defendants breached their fiduciary duties to Jarden stockholders in connection with the Jarden Acquisition by, among other things, failing to take reasonable steps to obtain and/or ensure that Jarden stockholders receive fair and adequate value for their shares, and that the Company aided and abetted such breaches. Plaintiff further alleged that defendants provided materially false and misleading disclosures and omitted necessary information in their joint proxy statement/prospectus concerning the sales process of Jarden. The complaint sought rescission or rescissory damages with respect to the merger transactions, an award of attorneys’ and experts’ fees and costs, and a direction from the court that Jarden’s individual board members account for all damages suffered as a result of their alleged wrongdoing. On March 28, 2016, the parties filed an Agreed Joint Motion to Stay Proceedings, seeking a stay of the litigation, pending the outcome of the Hirsch v. Lillie action. In December 2016, the parties (including the Company) entered into a settlement whereby the lawsuit was voluntarily dismissed.
Jarden Acquisition
Under the Delaware General Corporation Law (“DGCL”), any Jarden stockholder who did not vote in favor of adoption of the Merger Agreement, and otherwise complies with the provisions of Section 262 of the DGCL, is entitled to seek an appraisal of its shares of Jarden common stock by the Court of Chancery of the State of Delaware as provided under Section 262 of the DGCL. As of December 31, 2016, dissenting stockholders collectively holding approximately 10.6 million shares of Jarden common stock have delivered (and not withdrawn) to Jarden written demands for appraisal. Two separate appraisal petitions, styled Dunham Monthly Distribution Fund v. Jarden Corporation, Case No. 12454-VCS (Court of Chancery of the State of Delaware) and Merion Capital LP v. Jarden Corporation, Case No. 12456-VCS (Court of Chancery of the State of Delaware), respectively, were filed on June 14, 2016 by a total of ten purported Jarden stockholders seeking an appraisal of the fair value of their shares of Jarden common stock pursuant to Section 262 of the DGCL. A third appraisal petition (Fir Tree Value Master Fund, LP v. Jarden Corporation, Case No. 12546-VCS (Court of Chancery of the State of Delaware)) was filed on July 8, 2016 by two purported Jarden stockholders seeking an appraisal of the fair value of their shares of Jarden common stock pursuant to Section 262 of the DGCL. A fourth appraisal petition (Veritian Partners Master Fund LTP v. Jarden Corporation, Case No. 12650-VCS (Court of Chancery of the State of Delaware)) was filed on August 12, 2016 by two purported Jarden stockholders seeking an appraisal of the fair value of their shares of Jarden common stock pursuant to Section 262 of the DGCL. These cases remain pending, and litigation is ongoing. The fair value of the 10.6 million Jarden common shares held by these dissenting stockholders, as determined by the court, would be payable in cash and could be lower or higher than the merger consideration and/or may include a greater amount of cash than the merger consideration to which such Jarden stockholders would have been entitled under the Merger Agreement.
Environmental Matters
The Company is involved in various matters concerning federal and state environmental laws and regulations, including matters in which the Company has been identified by the U.S. Environmental Protection Agency (“U.S. EPA”) and certain state environmental agencies as a potentially responsible party (“PRP”) at contaminated sites under the Federal Comprehensive Environmental Response, Compensation and Liability Act (the “CERCLA”) and equivalent state laws.
105
In assessing its environmental response costs, the Company has considered several factors, including the extent of the Company’s volumetric contribution at each site relative to that of other PRPs; the kind of waste; the terms of existing cost sharing and other applicable agreements; the financial ability of other PRPs to share in the payment of requisite costs; the Company’s prior experience with similar sites; environmental studies and cost estimates available to the Company; the effects of inflation on cost estimates; and the extent to which the Company’s, and other parties’, status as PRPs is disputed.
The Company’s estimate of environmental remediation costs associated with these matters as of December 31, 2016 was $41.9 million, which is included in other accrued liabilities and other noncurrent liabilities in the Consolidated Balance Sheet. No insurance recovery was taken into account in determining the Company’s cost estimates or reserves, nor do the Company’s cost estimates or reserves reflect any discounting for present value purposes, except with respect to certain long-term operations and maintenance CERCLA matters.
Lower Passaic River Matter
U.S. EPA has issued General Notice Letters (“GNLs”) to over 100 entities, including the Company and Berol Corporation, a subsidiary of the Company (“Berol”), alleging that they are PRPs at the Diamond Alkali Superfund Site, which includes a 17-mile stretch of the Lower Passaic River and its tributaries. Seventy-two of the GNL recipients, including the Company on behalf of itself and its subsidiaries, Goody Products, Inc. and Berol (the “Company Parties”), have taken over the performance of the remedial investigation (“RI”) and feasibility study (“FS”) for the Lower Passaic River. On April 11, 2014, while work on the RI/FS remained underway, U.S. EPA issued a Source Control Early Action Focused Feasibility Study (“FFS”), which proposed four alternatives for remediation of the lower 8.3 miles of the Lower Passaic River. U.S. EPA’s cost estimates for its cleanup alternatives ranged from $315.0 million to approximately $3.2 billion in capital costs plus from $0.5 million to $1.8 million in annual maintenance costs for 30 years, with its preferred alternative carrying an estimated cost of approximately $1.7 billion plus an additional $1.6 million in annual maintenance costs for 30 years. In February 2015, the participating parties submitted to the U.S. EPA a draft RI, followed by submission of a draft FS in April 2015. The draft FS sets forth various alternatives for remediating the lower 17 miles of the Passaic River, ranging from a “no action” alternative, to targeted remediation of locations along the entire lower 17 mile stretch of the river, to remedial actions consistent with U.S. EPA’s preferred alternative as set forth in the FFS for the lower 8.3 miles coupled with monitored natural recovery and targeted remediation in the upper 9 miles. The estimated cost estimates for these alternatives range from approximately $28.0 million to $2.7 billion, including related operation maintenance and monitoring costs. The draft RI/FS remains under review by U.S. EPA.
U.S. EPA issued its final Record of Decision for the lower 8.3 miles of the Lower Passaic (the “ROD”) in March 2016, which, in the language of the document, finalizes as the selected remedy the preferred alternative set forth in the FFS, which U.S. EPA estimates will cost $1.4 billion. Subsequent to the release of the ROD in March 2016, U.S. EPA issued GNLs for the lower 8.3 miles of the Passaic River (the “2016 GNL”) to numerous entities, apparently including all previous recipients of the initial GNL as well as several additional entities. As with the initial GNL, the Company and Berol were among the recipients of the 2016 GNL. The 2016 GNL states that U.S. EPA would like to determine whether one entity, Occidental Chemical Corporation (“OCC”), will voluntarily perform the remedial design for the selected remedy for the lower 8.3 miles, and that following execution of an agreement for the remedial design, U.S. EPA plans to begin negotiation of a remedial action consent decree “under which OCC and the other major PRPs will implement and/or pay for U.S. EPA’s selected remedy for the lower 8.3 miles of the Lower Passaic River and reimburse U.S. EPA’s costs incurred for the Lower Passaic River.” The letter “encourage[s] the major PRPs to meet and discuss a workable approach to sharing responsibility for implementation and funding of the remedy" without indicating who may be the “major PRPs.” Finally, U.S. EPA states that it “believes that some of the parties that have been identified as PRPs under CERCLA, and some parties not yet named as PRPs, may be eligible for a cash out settlement with U.S. EPA for the lower 8.3 miles of the Lower Passaic River. U.S. EPA intends to provide separate notice of the opportunity to discuss a cash out settlement at a later date.” In September 2016, OCC and EPA entered into an Administrative Order on Consent for performance of the remedial design. At this time, it is unclear how the cost of any cleanup would be allocated among any of the parties, including the Company Parties or any other entities. The site is also subject to a Natural Resource Damage Assessment.
OCC has asserted that it is entitled to indemnification by Maxus Energy Corporation (“Maxus”) for its liability in connection with the Diamond Alkali Superfund Site. OCC has also asserted that Maxus’s parent company, YPF, S.A., and certain other affiliates (the “YPF Entities”) similarly must indemnify OCC, including on an “alter ego” theory. On June 17, 2016, Maxus and certain of its affiliates commenced a chapter 11 bankruptcy case in the U.S. Bankruptcy Court for the District of Delaware. In connection with that proceeding, the YPF Entities are attempting to resolve any liability they may have to Maxus and the other Maxus entities undergoing the chapter 11 bankruptcy.
Given the uncertainties pertaining to this matter, including that U.S. EPA is still reviewing the draft RI and FS, that no framework for or agreement on allocation for the investigation and ultimate remediation has been developed, and that there exists the potential for further litigation regarding costs and cost sharing, the extent to which the Company Parties may be held liable or responsible is not yet known. Accordingly, it is not possible at this time for the Company to estimate its ultimate liability related to this matter.
106
Based on currently known facts and circumstances, the Company does not believe that this matter is reasonably likely to have a material impact on the Company’s results of operations, including, among other factors, because the Company Parties’ facilities are not even alleged to have discharged the contaminants which are of the greatest concern in the river sediments, and because there are numerous other parties who will likely share in any costs of remediation and/or damages. However, in the event of one or more adverse determinations related to this matter, it is possible that the ultimate liability resulting from this matter and the impact on the Company’s results of operations could be material.
Because of the uncertainties associated with environmental investigations and response activities, the possibility that the Company could be identified as a PRP at sites identified in the future that require the incurrence of environmental response costs and the possibility that sites acquired in business combinations may require environmental response costs, actual costs to be incurred by the Company may vary from the Company’s estimates.
Clean Air Act Labeling Matter
In April 2015, the Company became aware that two beverage container products, one product of its recently acquired bubba brands business and one product of its recently acquired Ignite business, contained closed cell rigid polyurethane foam insulation that was blown with HCFC-141b, which is listed as a Class II ozone-depleting substance under the Montreal Protocol on Substances that Deplete the Ozone Layer. Under the Clean Air Act and U.S. EPA’s regulations promulgated thereunder, as of January 1, 2015, certain products made with or containing ozone depleting substances, including HCFC-141b, must bear a specific warning label. The Company discovered that the affected products imported in early 2015 did not display the required label. While the affected product lines were not compliant with applicable environmental regulations regarding ozone depleting substances, use of the products is safe and poses no risk to consumers. Upon discovery, the Company self-reported the violations to the U.S. EPA and replaced the blowing agent in the products. The Company is in the process of negotiating a settlement with U.S. EPA which would include payment of a penalty; although settlement negotiations are at an early stage, the Company does not expect that the penalty will exceed $110,000.
Other Matters
Although management of the Company cannot predict the ultimate outcome of these proceedings with certainty, it believes that the ultimate resolution of the Company’s proceedings, including any amounts it may be required to pay in excess of amounts reserved, will not have a material effect on the Company’s Consolidated Financial Statements, except as otherwise described above.
In the normal course of business and as part of its acquisition and divestiture strategy, the Company may provide certain representations and indemnifications related to legal, environmental, product liability, tax or other types of issues. Based on the nature of these representations and indemnifications, it is not possible to predict the maximum potential payments under all of these agreements due to the conditional nature of the Company’s obligations and the unique facts and circumstances involved in each particular agreement. Historically, payments made by the Company under these agreements did not have a material effect on the Company’s business, financial condition or results of operations.
As of December 31, 2016, the Company had $80.0 million in standby letters of credit primarily related to the Company’s self-insurance programs, including workers’ compensation, product liability and medical.
ITEM 9. CHANGES IN AND DISAGREEMENTS WITH ACCOUNTANTS ON ACCOUNTING AND FINANCIAL DISCLOSURE
Not applicable.
ITEM 9A. CONTROLS AND PROCEDURES
(a) | Evaluation of Disclosure Controls and Procedures: as of December 31, 2016, an evaluation was performed by the Company’s management, under the supervision and with the participation of the Company’s chief executive officer and chief financial officer, of the effectiveness of the Company’s disclosure controls and procedures. Based on that evaluation, the chief executive officer and the chief financial officer concluded that the Company’s disclosure controls and procedures were effective as of December 31, 2016. |
(b) | Management’s Report on Internal Control Over Financial Reporting: the Company’s management’s annual report on internal control over financial reporting is set forth under Item 8 of this annual report. |
The report of PricewaterhouseCoopers LLP, the Company’s independent registered public accounting firm, which addresses the effectiveness of the Company’s internal control over financial reporting is set forth under Item 8 of this annual report.
107
(c) | Changes in Internal Control Over Financial Reporting: there were no changes in the Company’s internal control over financial reporting that occurred during the quarter ended December 31, 2016 that have materially affected, or are reasonably likely to materially affect, the Company’s internal control over financial reporting. |
ITEM 9B. OTHER INFORMATION
None.
108
PART III
ITEM 10. DIRECTORS, EXECUTIVE OFFICERS AND CORPORATE GOVERNANCE
Information required under this Item with respect to Directors will be contained in the Company’s Proxy Statement for the Annual Meeting of Stockholders (the “Proxy Statement”) under the captions “Election of Directors” and “Information Regarding Board of Directors and Committees and Corporate Governance,” which information is incorporated by reference herein.
Information required under this Item with respect to Executive Officers of the Company is included as a supplemental item at the end of Part I of this report.
Information required under this Item with respect to compliance with Section 16(a) of the Exchange Act will be included in the Proxy Statement under the caption “Section 16(a) Beneficial Ownership Compliance Reporting,” which information is incorporated by reference herein.
Information required under this Item with respect to the audit committee and audit committee financial experts will be included in the Proxy Statement under the caption “Information Regarding Board of Directors and Committees and Corporate Governance — Committees — Audit Committee,” which information is incorporated by reference herein.
Information required under this Item with respect to communications between security holders and Directors will be included in the Proxy Statement under the caption “Information Regarding Board of Directors and Committees and Corporate Governance — Director Nomination Process,” and “Information Regarding Board of Directors and Committees and Corporate Governance — Communications with the Board of Directors,” which information is incorporated by reference herein.
The Board of Directors has adopted a “Code of Ethics for Senior Financial Officers,” which is applicable to the Company’s senior financial officers, including the Company’s principal executive officer, principal financial officer, principal accounting officer and controller. The Company also has a separate “Code of Business Conduct and Ethics” that is applicable to all Company employees, including each of the Company’s directors and officers. Both the Code of Ethics for Senior Financial Officers and the Code of Business Conduct and Ethics are available under the “Corporate Governance” link on the Company’s website at www.newellbrands.com. The Company posts any amendments to or waivers of its Code of Ethics for Senior Financial Officers or to the Code of Business Conduct and Ethics (to the extent applicable to the Company’s directors or executive officers) at the same location on the Company’s website. In addition, copies of the Code of Ethics for Senior Financial Officers and of the Code of Business Conduct and Ethics may be obtained in print without charge upon written request by any stockholder to the office of the Corporate Secretary of the Company at 221 River Street, Hoboken, New Jersey 07030.
ITEM 11. EXECUTIVE COMPENSATION
Information required under this Item will be included in the Proxy Statement under the captions “Organizational Development & Compensation Committee Report,” “Executive Compensation,” and “Compensation Committee Interlocks and Insider Participation,” which information is incorporated by reference herein.
ITEM 12. SECURITY OWNERSHIP OF CERTAIN BENEFICIAL OWNERS AND MANAGEMENT AND RELATED STOCKHOLDER MATTERS
Information required under this Item will be included in the Proxy Statement under the captions “Certain Beneficial Owners” and “Equity Compensation Plan Information,” which information is incorporated by reference herein.
ITEM 13. CERTAIN RELATIONSHIPS AND RELATED TRANSACTIONS, AND DIRECTOR INDEPENDENCE
Information required under this Item with respect to certain relationships and related transactions will be included in the Proxy Statement under the caption “Certain Relationships and Related Transactions,” which information is incorporated by reference herein.
Information required under this Item with respect to director independence will be included in the Proxy Statement under the caption “Information Regarding Board of Directors and Committees and Corporate Governance — Director Independence,” which information is incorporated by reference herein.
ITEM 14. PRINCIPAL ACCOUNTING FEES AND SERVICES
Information required under this Item will be included in the Proxy Statement under the caption “Ratification of Appointment of Independent Registered Public Accounting Firm,” which information is incorporated by reference herein.
109
PART IV
ITEM 15. EXHIBITS, FINANCIAL STATEMENT SCHEDULES
(a)(1) The following is a list of the financial statements of Newell Brands Inc. included in this report on Form 10-K, which are filed herewith pursuant to Item 8:
Reports of Independent Registered Public Accounting Firms
Consolidated Statements of Operations — Years Ended December 31, 2016, 2015 and 2014
Consolidated Statements of Comprehensive Income — Years Ended December 31, 2016, 2015 and 2014
Consolidated Balance Sheets — December 31, 2016 and 2015
Consolidated Statements of Cash Flows — Years Ended December 31, 2016, 2015 and 2014
Consolidated Statements of Stockholders’ Equity — Years Ended December 31, 2016, 2015 and 2014
Notes to Consolidated Financial Statements — December 31, 2016, 2015 and 2014
(2) The following consolidated financial statement schedule of the Company included in this report on Form 10-K is filed herewith pursuant to Item 15(c) and appears immediately following the Exhibit Index:
SCHEDULE II — VALUATION AND QUALIFYING ACCOUNTS
All other financial schedules are not required under the related instructions or are inapplicable and, therefore, have been omitted.
(3) The exhibits filed herewith are listed on the Exhibit Index filed as part of this report on Form 10-K. Each management contract or compensatory plan or arrangement of the Company listed on the Exhibit Index is separately identified by an asterisk.
(b) EXHIBIT INDEX
ITEM 2 – PLAN OF ACQUISITION, REORGANIZATION, ARRANGEMENT, LIQUIDATION OR SUCCESSION
Exhibit Description of Exhibit
Number
2.1 | Agreement and Plan of Merger, dated as of December 13, 2015, by and among Newell Rubbermaid Inc., Jarden Corporation, NCPF Acquisition Corp. I and NCPF Acquisition Corp. II (incorporated by reference to Exhibit 2.1 to the Company’s Current Report on Form 8-K dated December 13, 2015, File No. 001-09608). |
2.2 | Stock and Asset Purchase Agreement, dated as of October 12, 2016, by and between Newell Brands Inc. and Stanley Black & Decker, Inc. (incorporated by reference to Exhibit 2.1 to the Company’s Current Report on Form 8-K dated October 12, 2016, File No. 001-09608). |
ITEM 3 - ARTICLES OF INCORPORATION AND BY-LAWS
Exhibit Description of Exhibit
Number
3.1 | Restated Certificate of Incorporation of Newell Brands Inc., as amended as of April 15, 2016 (incorporated by reference to Exhibit 3.1 to the Company’s Current Report on Form 8-K dated April 15, 2016, File No. 001-09608). |
3.2 | By-Laws of Newell Brands Inc., as amended April 15, 2016 (incorporated by reference to Exhibit 3.2 to the Company’s Current Report on Form 8-K dated April 15, 2016, File No. 001-09608). |
110
ITEM 4 - INSTRUMENTS DEFINING THE RIGHTS OF SECURITY HOLDERS, INCLUDING INDENTURES
Exhibit Description of Exhibit
Number
4.1 | Indenture dated as of November 1, 1995, between Newell Rubbermaid Inc. and The Bank of New York Trust Company, N.A. (as successor to JPMorgan Chase Bank, formerly known as The Chase Manhattan Bank (National Association)), as trustee (incorporated by reference to Exhibit 4.1 to the Company’s Current Report on Form 8-K dated May 3, 1996, File No. 001-09608). |
4.2 | Indenture, dated as of June 14, 2012, between Newell Rubbermaid Inc. and The Bank of New York Mellon Trust Company, N.A. , as trustee (incorporated by reference to Exhibit 4.1 to the Company’s Current Report on Form 8-K dated June 11, 2012, File No. 001-09608). |
4.3 | Indenture, dated as of November 19, 2014, between Newell Rubbermaid Inc. and U.S. Bank National Association, as trustee (incorporated by reference to Exhibit 4.1 to the Company’s Current Report on Form 8-K dated November 14, 2014). |
4.4 | Specimen Stock Certificate for Newell Brands Inc. (incorporated by reference to Exhibit 4.1 to the Company’s Quarterly Report on Form 10-Q for the quarterly period ended March 31, 2016). |
4.5 | Form of 6.25% Notes due 2018 issued pursuant to an Indenture dated as of November 1, 1995, between Newell Rubbermaid Inc. and The Bank of New York Trust Company, N.A. (as successor to JPMorgan Chase Bank, formerly known as The Chase Manhattan Bank (National Association)), as trustee (incorporated by reference to Exhibit 4.2 to the Company’s Current Report on Form 8-K dated March 25, 2008, File No. 001-09608). |
4.6 | Form of 4.70% Notes due 2020 issued pursuant to an Indenture dated as of November 1, 1995, between Newell Rubbermaid Inc. and The Bank of New York Mellon Trust Company, N.A. (as successor to JPMorgan Chase Bank, formerly known as The Chase Manhattan Bank (National Association)), as trustee (incorporated by reference to Exhibit 4.1 to the Company’s Current Report on Form 8-K dated August 2, 2010, File No. 001-09608). |
4.7 | Form of 4.000% Note due 2022 issued pursuant to the Indenture, dated as of June 14, 2012, between Newell Rubbermaid Inc. and The Bank of New York Mellon Trust Company, N.A., as trustee (incorporated by reference to Exhibit 4.3 to the Company’s Current Report on Form 8-K dated June 11, 2012, File No. 001-09608). |
4.8 | Form of 2.050% Note due 2017 issued pursuant to the Indenture, dated as of June 14, 2012, between Newell Rubbermaid Inc. and The Bank of New York Mellon Trust Company, N.A. , as trustee (incorporated by reference to Exhibit 4.1 to the Company’s Current Report on Form 8-K dated November 29, 2012, File No. 001-09608). |
4.9 | Form of 2.875% Note due 2019 issued pursuant to the Indenture, dated as of November 19, 2014, between Newell Rubbermaid Inc. and U.S. Bank National Association, as trustee (incorporated by reference to Exhibit 4.2 to the Company’s Current Report on Form 8-K dated November 14, 2014, File No. 001-09608). |
4.10 | Form of 4.000% Note due 2024 issued pursuant to the Indenture, dated as of November 19, 2014, between Newell Rubbermaid Inc. and U.S. Bank National Association, as trustee (incorporated by reference to Exhibit 4.3 to the Company’s Current Report on Form 8-K dated November 14, 2014, File No. 001-09608). |
4.11 | Form of 2.150% Note due 2018 issued pursuant to the Indenture, dated as of November 19, 2014, between Newell Rubbermaid Inc. and U.S. Bank National Association, as trustee (incorporated by reference to Exhibit 4.1 to the Company’s Current Report on Form 8-K dated October 14, 2015, File No. 001-09608). |
4.12 | Form of 3.900% Note due 2025 issued pursuant to the Indenture, dated as of November 19, 2014, between Newell Rubbermaid Inc. and U.S. Bank National Association, as trustee (incorporated by reference to Exhibit 4.2 to the Company’s Current Report on Form 8-K dated October 14, 2015, File No. 001-09608). |
4.13 | Form of 2.600% note due 2019 issued pursuant to the Indenture, dated as of November 19, 2014, between the Company and U.S. Bank National Association, as trustee (incorporated by reference to Exhibit 4.1 to the Company’s Current Report on Form 8-K dated March 18, 2016, File No. 001-09608). |
111
4.14 | Form of 3.150% note due 2021 issued pursuant to the Indenture, dated as of November 19, 2014, between the Company and U.S. Bank National Association, as trustee (incorporated by reference to Exhibit 4.2 to the Company’s Current Report on Form 8-K dated March 18, 2016, File No. 001-09608). |
4.15 | Form of 3.850% note due 2023 issued pursuant to the Indenture, dated as of November 19, 2014, between the Company and U.S. Bank National Association, as trustee (incorporated by reference to Exhibit 4.3 to the Company’s Current Report on Form 8-K dated March 18, 2016, File No. 001-09608). |
4.16 | Form of 4.200% note due 2026 issued pursuant to the Indenture, dated as of November 19, 2014, between the Company and U.S. Bank National Association, as trustee (incorporated by reference to Exhibit 4.4 to the Company’s Current Report on Form 8-K dated March 18, 2016, File No. 001-09608). |
4.17 | Form of 5.375% note due 2036 issued pursuant to the Indenture, dated as of November 19, 2014, between the Company and U.S. Bank National Association, as trustee (incorporated by reference to Exhibit 4.5 to the Company’s Current Report on Form 8-K dated March 18, 2016, File No. 001-09608). |
4.18 | Form of 5.500% note due 2046 issued pursuant to the Indenture, dated as of November 19, 2014, between the Company and U.S. Bank National Association, as trustee (incorporated by reference to Exhibit 4.6 to the Company’s Current Report on Form 8-K dated March 18, 2016, File No. 001-09608). |
4.19 | Form of 3 3/4% note due 2021 issued pursuant to the Indenture, dated as of November 19, 2014, between the Company and U.S. Bank National Association, as trustee. |
4.20 | Form of 5% note due 2023 issued pursuant to the Indenture, dated as of November 19, 2014, between the Company and U.S. Bank National Association, as trustee. |
Pursuant to item 601(b)(4)(iii)(A) of Regulation S-K, the Company is not filing certain documents. The Company agrees to furnish a copy of each such document upon the request of the Commission.
ITEM 10 - MATERIAL CONTRACTS
10.1* | Newell Rubbermaid Inc. Deferred Compensation Plan as amended and restated August 5, 2013 (incorporated by reference to Exhibit 10.5 to the Company’s Quarterly Report on Form 10-Q for the quarterly period ended June 30, 2013). |
10.2* | Newell Rubbermaid Inc. 2002 Deferred Compensation Plan, as amended and restated as of January 1, 2004 (incorporated by reference to Exhibit 10.1 to the Company’s Quarterly Report on Form 10-Q for the quarterly period ended March 31, 2004, File No. 001-09608). |
10.3* | Newell Rubbermaid Inc. Deferred Compensation Plans Trust Agreement, effective as of June 1, 2013 (incorporated by reference to Exhibit 10.1 to the Company’s Quarterly Report on Form 10-Q for the quarterly period ended June 30, 2013, File No. 001-09068). |
10.4* | Newell Rubbermaid Inc. Supplemental Executive Retirement Plan, effective January 1, 2008 (incorporated by reference to Exhibit 10.7 to the Company’s Report on Form 10-K for the year ended December 31, 2007, File No. 001-09068). |
10.5* | First Amendment to the Newell Rubbermaid Supplemental Executive Retirement Plan dated August 5, 2013 (incorporated by reference to Exhibit 10.6 to the Company’s Quarterly Report on Form 10-Q for the quarterly period ended June 30, 2013, File No. 001-09068). |
10.6* | Newell Rubbermaid Severance Plan -- Summary Plan Description for Executives in Bands 10 and above, effective July 1, 2014 (incorporated by reference to Exhibit 10.2 to the Company’s Quarterly Report on Form 10-Q for the quarterly period ended June 30, 2014). |
10.7* | Newell Rubbermaid Inc. 2003 Stock Plan, as amended and restated effective February 8, 2006, and as amended effective August 9, 2006 (incorporated by reference to Appendix B to the Company’s Proxy Statement, dated April 3, 2006, and Exhibit 10.1 to the Company’s Quarterly Report on Form 10-Q for the quarterly period ended September 30, 2006, File No. 001-09068). |
112
10.8* | Newell Rubbermaid Inc. 2010 Stock Plan (incorporated by reference to Exhibit 10.1 to the Company’s Current Report on Form 8-K dated May 11, 2010, File No. 001-09068). |
10.9* | First Amendment to the Newell Rubbermaid Inc. 2010 Stock Plan dated July 1, 2011 (incorporated by reference to Exhibit 10.3 to the Company’s Quarterly Report on Form 10-Q for the quarterly period ended June 30, 2011, File No. 001-09068). |
10.10* | Newell Rubbermaid Inc. 2013 Incentive Plan (incorporated by reference to Appendix B to the Company’s Proxy Statement dated March 28, 2013, File No. 001-09068). |
10.11* | Forms of Stock Option Agreement under the Newell Rubbermaid Inc. 2003 Stock Plan (incorporated by reference to Exhibit 10.9 to the Company’s Annual Report on Form 10-K for the year ended December 31, 2008, File No. 001-09068). |
10.12* | Form of Michael B. Polk Stock Option Agreement for July 18, 2011 Award (incorporated by reference to Exhibit 10.2 to the Company’s Current Report on Form 8-K dated July 18, 2011, File No. 001-09068). |
10.13* | Performance-Based Restricted Stock Unit Award Agreement of Mark Tarchetti dated May 10, 2016 (incorporated by reference to Exhibit 10.5 to the Company’s Quarterly Report on Form 10-Q for the quarterly period ended June 30, 2016, File No. 001-09068). |
10.14* | Performance-Based Restricted Stock Unit Award Agreement of Ralph Nicoletti dated June 8, 2016 (incorporated by reference to Exhibit 10.8 to the Company’s Quarterly Report on Form 10-Q for the quarterly period ended June 30, 2016, File No. 001-09068). |
10.15* | Performance-Based Restricted Stock Unit Award Agreement of Fiona Laird, dated May 31, 2016. |
10.16* | Form of Agreement for Restricted Stock Unit Award Granted to Paula S. Larson on December 16, 2013 (incorporated by reference to Exhibit 10.23 to the Company’s Report on Form 10-K for the year ended December 31, 2014, File No. 001-09068). |
10.17* | 2014 Restricted Stock Unit Equivalent Award Agreement dated as of December 28, 2015 between Newell Rubbermaid Inc. and Mark S. Tarchetti (incorporated by reference to Exhibit 10.2 to the Company’s Current Report on Form 8-K dated December 22, 2015, File No. 001-09068). |
10.18* | 2015 Restricted Stock Unit Equivalent Award Agreement dated as of December 28, 2015 between Newell Rubbermaid Inc. and Mark S. Tarchetti (incorporated by reference to Exhibit 10.3 to the Company’s Current Report on Form 8-K dated December 22, 2015, File No. 001-09068). |
10.19* | Long-Term Incentive Performance Pay Terms and Conditions under the Newell Rubbermaid Inc. 2013 Incentive Plan for 2014 (incorporated by reference to Exhibit 10.1 to the Company’s Quarterly Report on Form 10-Q for the quarterly period ended March 31, 2014, File No. 001-09068). |
10.20* | Long-Term Incentive Performance Pay Terms and Conditions under the Newell Rubbermaid Inc. 2013 Incentive Plan, as updated February 10, 2015 (incorporated by reference to Exhibit 10.2 to the Company's Current Report on Form 8-K dated February 10, 2015, File No. 001-09068). |
10.21* | Long-Term Incentive Performance Pay Terms and Conditions under the Newell Rubbermaid Inc. 2013 Incentive Plan, as amended May 10, 2016 (incorporated by reference to Exhibit 10.1 to the Company’s Current Report on Form 8-K dated May 10, 2016, File No. 001-09068). |
10.22* | Form of Stock Option Agreement under the Newell Rubbermaid Inc. 2010 Stock Plan (incorporated by reference to Exhibit 10.6 to the Company’s Quarterly Report on Form 10-Q for the quarterly period ended June 30, 2010, File No. 001-09068, File No. 001-09068). |
10.23* | Form of Restricted Stock Unit Award Agreement under the Newell Rubbermaid Inc. 2010 Stock Plan for 2013Awards (incorporated by reference to Exhibit 10.3 to the Company’s Quarterly Report on Form 10-Q for the quarterly period ended March 31, 2013, File No. 001-09068). |
113
10.24* | Form of Restricted Stock Unit Award Agreement under the Newell Rubbermaid Inc. 2013 Incentive Plan for Awards to Employees (incorporated by reference to Exhibit 10.3 to the Company’s Quarterly Report on Form 10-Q for the quarterly period ended June 30, 2013, File No. 001-09068). |
10.25* | Form of Restricted Stock Unit Agreement under the Newell Rubbermaid Inc. 2013 Incentive Plan for 2014 Awards (incorporated by reference to Exhibit 10.2 to the Company’s Quarterly Report on Form 10-Q for the quarterly period ended March 31, 2014, File No. 001-09068). |
10.26* | Form of Restricted Stock Unit Agreement under the Newell Rubbermaid Inc. 2013 Incentive Plan for Employees as Amended February 10, 2015 (incorporated by reference to Exhibit 10.3 to the Company's Current Report on Form 8-K dated February 10, 2015, File No. 001-09068). |
10.27* | Form of Restricted Stock Unit Agreement under the Newell Rubbermaid Inc. 2013 Incentive Plan for Employees, as Amended May 10, 2016 (incorporated by reference to Exhibit 10.2 to the Company’s Current Report on Form 8-K dated May 13, 2016, File No. 001-09068). |
10.28* | Form of Non-Employee Director Restricted Stock Unit Award Agreement under the Newell Rubbermaid Inc. 2013 Incentive Plan for Awards Beginning May 2014 (incorporated by reference to Exhibit 10.1 to the Company’s Quarterly Report on Form 10-Q for the quarterly period ended June 30, 2014, File No. 001-09068). |
10.29* | Employment Security Agreement with Michael B. Polk dated July 18, 2011 (incorporated by reference to Exhibit 10.1 to the Company’s Quarterly Report on Form 10-Q for the quarterly period ended September 30, 2011, File No. 001-09068). |
10.30* | Form of Employment Security Agreement between the Company and the named executive officers of the Company other than the Chief Executive Officer (incorporated by reference to Exhibit 10.39 to the Company’s Annual Report on Form 10-K for the year ended December 31, 2014, File No. 001-09068). |
10.31* | Newell Rubbermaid Inc. Employment Security Agreements Trust Agreement, effective as of June 1, 2013 (incorporated by reference to Exhibit 10.2 to the Company’s Quarterly Report on Form 10-Q for the quarterly period ended June 30, 2013). |
10.32* | Written Compensation Arrangement with Michael B. Polk, dated June 23, 2011 (incorporated by reference to Exhibit 10.1 to the Company’s Current Report on Form 8-K dated June 23, 2011, File No. 001-09068). |
10.33* | Amendment to Written Compensation Arrangement with Michael B. Polk, dated October 1, 2012 (incorporated by reference to Exhibit 10.34 to the Company’s Annual Report on Form 10-K for the year ended December 31, 2012, File No. 001-09068). |
10.34* | Amendment to Written Compensation Arrangement with Michael B. Polk dated May 11, 2016 (incorporated by reference to Exhibit 10.3 to the Company’s Quarterly Report on Form 10-Q for the quarterly period ended June 30, 2016, File No. 001-09068). |
10.35* | Compensation Arrangement with Mark Tarchetti dated May 12, 2016 (incorporated by reference to Exhibit 10.4 to the Company’s Quarterly Report on Form 10-Q for the quarterly period ended June 30, 2016, File No. 001-09068). |
10.36* | Compensation Arrangement with William A. Burke III, dated May 12, 2016 (incorporated by reference to Exhibit 10.6 to the Company’s Quarterly Report on Form 10-Q for the quarterly period ended June 30, 2016, File No. 001-09068). |
10.37* | Compensation Arrangement with Ralph Nicoletti dated May 12, 2016 (incorporated by reference to Exhibit 10.7 to the Company’s Quarterly Report on Form 10-Q for the quarterly period ended June 30, 2016, File No. 001-09068). |
10.38* | Compensation Arrangement with Fiona Laird dated May 25, 2016. |
10.39* | Separation Agreement and General Release, dated as of March 10, 2016, by and between Newell Rubbermaid Inc. and Paula Larson (incorporated by reference to Exhibit 10.1 to the Company’s Current Report on Form 8-K dated March 10, 2016, File No. 001-09068). |
114
10.40* | Separation Agreement and General Release, dated as of May 12, 2016, by and between Newell Brands Inc. and John K. Stipancich (incorporated by reference to Exhibit 10.9 to the Company’s Quarterly Report on Form 10-Q for the quarterly period ended June 30, 2016, File No. 001-09068). |
10.41* | Separation Agreement and General Release, dated as of July 28, 2016, by and between Newell Brands Inc. and Joseph A. Arcuri (incorporated by reference to Exhibit 10.1 of the Company’s Current Report on Form 8-K dated July 28, 2016, File No. 001-09068). |
10.42 | Advisory Services Agreement, dated as of December 13, 2015, by and among Newell Rubbermaid Inc. and Mariposa Capital, LLC (incorporated by reference to Exhibit 10.2 of Amendment No. 1 to Newell’s Registration Statement on Form S-4/A filed on February 17, 2016, File No. 333-208989). |
10.43 | Assignment and Assumption Agreement dated as of April 25, 2016 by and between Mariposa Capital, LLC and Mariposa Associates, LLC whereby Mariposa Capital, LLC assigns its rights, duties and obligations under the Advisory Services Agreement, dated as of December 13, 2015, by and among Newell Rubbermaid Inc. and Mariposa Capital, LLC to Mariposa Associates, LLC (incorporated by reference to Exhibit 10.24 to the Company’s Quarterly Report on Form 10-Q for the quarterly period ended June 30, 2016, File No. 001-09068). |
10.44* | Separation Agreement, dated as of December 13, 2015, by and between Jarden Corporation and Martin E. Franklin (incorporated by reference to Exhibit 10.4 of Jarden Corporation’s Current Report on Form 8-K dated December 17, 2015, File No. 001-13665). |
10.45* | Separation Agreement, dated as of December 13, 2015, by and between Jarden Corporation and Ian G.H. Ashken (incorporated by reference to Exhibit 10.5 of Jarden Corporation’s Current Report on Form 8-K dated December 17, 2015, File No. 001-13665). |
10.46 | Amended and Restated Credit Agreement dated as of January 26, 2016 among Newell Rubbermaid Inc., the subsidiary borrowers party thereto, the guarantors party thereto, the lenders party thereto and JPMorgan Chase Bank, N.A., as Administrative Agent (incorporated by reference to Exhibit 10.1 to the Company’s Current Report on Form 8-K dated January 26, 2016, File No. 001-09068). |
10.47 | Term Loan Credit Agreement dated as of January 26, 2016 among Newell Rubbermaid Inc., the guarantors party thereto, the lenders party thereto and JPMorgan Chase Bank, N.A., as Administrative Agent (incorporated by reference to Exhibit 10.2 to the Company’s Current Report on Form 8-K dated January 26, 2016, File No. 001-09068). |
10.48 | Loan and Servicing Agreement, dated as of October 3, 2016, among Jarden Receivables, LLC, as Borrower, Newell Brands Inc., as Servicer, the Conduit Lenders, the Committed Lenders and the Managing Agents named therein, Wells Fargo Bank, National Association, as Issuing Lender, PNC Bank, National Association, as Administrative Agent, and PNC Capital Markets LLC, as Structuring Agent (incorporated by reference to Exhibit 10.1 to the Company’s Current Report on Form 8-K dated October 3, 2016, File No. 001-09068). |
10.49 | Omnibus Amendment, dated as of December 16, 2016 among Jarden Receivables, LLC, Originator parties thereto, Newell Brands Inc., as Servicer, PNC Bank, National Association, as Administrative Agent and as a Managing Agent, Wells Fargo Bank, National Association, as Issuing Lender and each Managing Agent party thereto. |
ITEM 12 — STATEMENT RE COMPUTATION OF RATIOS
12 | Statement of Computation of Earnings to Fixed Charges. |
ITEM 21 — SUBSIDIARIES OF THE REGISTRANT
21.1 | Significant Subsidiaries of the Company. |
ITEM 23 — CONSENT OF EXPERTS AND COUNSEL
23.1 | Consent of PricewaterhouseCoopers LLP. |
23.2 | Consent of Ernst & Young LLP. |
115
ITEM 31 — RULE 13a-14(a)/15d-14(a) CERTIFICATIONS
31.1 | Certification of Chief Executive Officer Pursuant to Rule 13a-14(a) or Rule 15d-14(a), as Adopted Pursuant to Section 302 of the Sarbanes-Oxley Act of 2002. |
31.2 | Certification of Chief Financial Officer Pursuant to Rule 12a-14(a) or Rule 15d-14(a), as Adopted Pursuant to Section 302 of the Sarbanes-Oxley Act of 2002. |
ITEM 32 — SECTION 1350 CERTIFICATIONS
32.1 | Certification of Chief Executive Officer Pursuant to 18 U.S.C. Section 1350, as Adopted Pursuant to Section 906 of the Sarbanes-Oxley Act of 2002. |
32.1 | Certification of Chief Financial Officer Pursuant to 18 U.S.C. Section 1350, as Adopted Pursuant to Section 906 of the Sarbanes-Oxley Act of 2002. |
ITEM 101 — INTERACTIVE DATA FILE
101.INS | XBRL Instance Document |
101.SCH | XBRL Taxonomy Extension Schema Document |
101.CAL | XBRL Taxonomy Extension Calculation Linkbase Document |
101.DEF | XBRL Taxonomy Definition Linkbase Document |
101.LAB | XBRL Taxonomy Extension Label Linkbase Document |
101.PRE | XBRL Taxonomy Extension Presentation Linkbase Document |
ITEM 16. FORM 10-K SUMMARY
116
SIGNATURES
Pursuant to the requirements of Section 13 or 15(d) of the Securities Exchange Act of 1934, the Registrant has duly caused this report to be signed on its behalf by the undersigned, thereunto duly authorized.
NEWELL BRANDS INC. | ||
Registrant | ||
By | /s/ Ralph J. Nicoletti | |
Ralph J. Nicoletti | ||
Title | Executive Vice President, Chief Financial Officer | |
Date | March 1, 2017 | |
117
Pursuant to the requirements of the Securities Exchange Act of 1934, this report has been signed below on March 1, 2017, by the following persons on behalf of the Registrant and in the capacities indicated.
Signature | Title | |
/s/ Michael B. Polk | President, Chief Executive Officer and Director | |
Michael B. Polk | ||
/s/ Ralph J. Nicoletti | Executive Vice President, Chief Financial Officer | |
Ralph J. Nicoletti | ||
/s/ James L. Cunningham, III | Senior Vice President, Chief Accounting Officer | |
James L. Cunningham, III | ||
/s/ Michael T. Cowhig | Chairman of the Board and Director | |
Michael T. Cowhig | ||
/s/ Ian G. H. Ashken | Director | |
Ian G. H. Ashken | ||
/s/ Thomas E. Clarke | Director | |
Thomas E. Clarke | ||
/s/ Kevin C. Conroy | Director | |
Kevin C. Conroy | ||
/s/ Scott S. Cowen | Director | |
Scott S. Cowen | ||
/s/ Domenico De Sole | Director | |
Domenico De Sole | ||
/s/ Martin E. Franklin | Director | |
Martin E. Franklin | ||
/s/ Ros L'Esperance | Director | |
Ros L'Esperance | ||
/s/ Steven J. Strobel | Director | |
Steven J. Strobel | ||
/s/ Michael A. Todman | Director | |
Michael A. Todman | ||
/s/ Raymond G. Viault | Director | |
Raymond G. Viault | ||
118
Schedule II
Newell Brands Inc. and subsidiaries
Valuation and Qualifying Accounts
(in millions) | Balance at Beginning of Period | Provision(1) | Charges to Other Accounts | Write-offs(2) | Balance at End of Period | ||||||||||
Reserve for Doubtful Accounts and Cash Discounts: | |||||||||||||||
Year Ended December 31, 2016 | $ | 22.0 | $ | 125.9 | $ | (1.7 | ) | $ | (107.7 | ) | $ | 38.5 | |||
Year Ended December 31, 2015 | 25.3 | 41.4 | 0.2 | (44.9 | ) | 22.0 | |||||||||
Year Ended December 31, 2014 | 38.0 | 49.2 | (1.6 | ) | (60.3 | ) | 25.3 | ||||||||
(1) | The provision amounts include accounts receivable reserve charges included in discontinued operations of $0.6 million for the year ended December 31, 2014. |
(2) | Represents accounts written off during the year and cash discounts taken by customers. |
(in millions) | Balance at Beginning of Period | Net Provision(1) | Other | Write-offs/ Dispositions | Balance at End of Period | ||||||||||
Inventory Reserves (including excess, obsolescence and shrink reserves): | |||||||||||||||
Year Ended December 31, 2016 | $ | 32.9 | $ | 33.0 | $ | (0.2 | ) | $ | (19.8 | ) | $ | 45.9 | |||
Year Ended December 31, 2015 | 32.6 | 23.3 | 0.5 | (23.5 | ) | 32.9 | |||||||||
Year Ended December 31, 2014 | 37.8 | 24.1 | (1.6 | ) | (27.7 | ) | 32.6 | ||||||||
(1) | The net provision amounts include inventory reserve (benefits) charges included in discontinued operations of $(0.1) million and for the year ended December 31, 2014. |
119