Attached files
| file | filename |
|---|---|
| 8-K - FORM 8-K - OCCIDENTAL PETROLEUM CORP /DE/ | form8k-20110428.htm |
| EX-99.1 - EXHIBIT 99.1 - OCCIDENTAL PETROLEUM CORP /DE/ | ex99_1-20110428.htm |
| EX-99.2 - EXHIBIT 99.2 - OCCIDENTAL PETROLEUM CORP /DE/ | ex99_2-20110428.htm |
| EX-99.3 - EXHIBIT 99.3 - OCCIDENTAL PETROLEUM CORP /DE/ | ex99_3-20110428.htm |
| EX-99.5 - EXHIBIT 99.5 - OCCIDENTAL PETROLEUM CORP /DE/ | ex99_5-20110428.htm |
EXHIBIT 99.4

Occidental Petroleum Corporation
First Quarter 2011 Earnings Conference Call
April 28, 2011
First Quarter 2011 Earnings Conference Call
April 28, 2011
1

2
First Quarter 2011 Earnings - Highlights
First Quarter 2011 Earnings - Highlights
• Core Results - $1.6 Billion vs. $1.1 Billion in 1Q10
– Core EPS $1.96 (diluted) vs. $1.35 in 1Q10.
• Non-core items amounted to a net after-tax charge of
$44 mm, which included:
$44 mm, which included:
– pre-tax gain of $225 mm from the sale of the Argentine operations;
– pre-tax gain of $22 mm from the sale of an interest in a Colombia
pipeline, and;
pipeline, and;
– pre-tax charges of $163 mm related to the early redemption of $1.4
billion face value of debt;
billion face value of debt;
– pre-tax write-off of $35 mm for the entire accumulated cost of
exploration properties in Libya, and;
exploration properties in Libya, and;
– non-recurring charges for state and foreign taxes of $62 mm.
• Net Income - $1.5 Billion vs. $1.1 Billion in 1Q10
– EPS $1.90 (diluted) vs. $1.31 in 1Q10.
2

3
*See the Investor Relations Supplemental Schedules for the 2010 quarterly realized prices and production and
sales volumes reflecting these changes.
sales volumes reflecting these changes.
First Quarter 2011 Earnings - Oil & Gas Operations
First Quarter 2011 Earnings - Oil & Gas Operations
• We reorganized our Permian operations into two
business units.
business units.
– One unit will hold the CO2 flood assets and the other will
operate the conventional production.
operate the conventional production.
– In connection with these, we moved the production from
Southwest Texas, which was previously part of Midcontinent
and other, into the Permian.
Southwest Texas, which was previously part of Midcontinent
and other, into the Permian.
– Midcontinent and other includes production from the recently
acquired South Texas and North Dakota properties.
acquired South Texas and North Dakota properties.
• Natural Gas Liquids account for about 10% of our oil and
gas volumes and sell at a discount to crude oil.
gas volumes and sell at a discount to crude oil.
– Starting this quarter, we are reporting NGL and crude oil
production and sales volumes separately as opposed to the
previously disclosed combined liquids volumes.*
production and sales volumes separately as opposed to the
previously disclosed combined liquids volumes.*
3
4
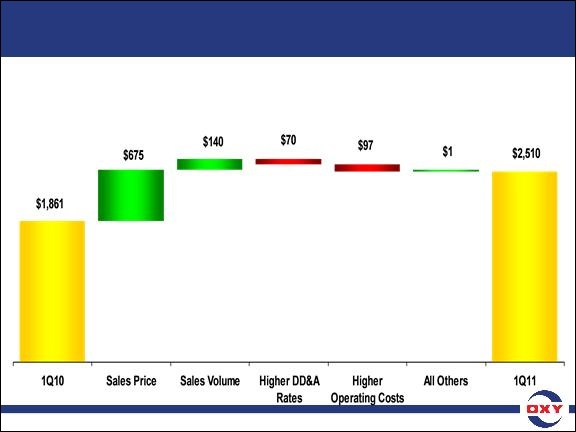
($ in millions)
• Core Results for 1Q11 of $2.5 Billion vs. $1.9 Billion in 1Q10
– Realized prices increased 24% for crude oil in 2011 and 11% for NGL prices on a year-over-
year basis but domestic natural gas prices declined 25% from 1Q10.
year basis but domestic natural gas prices declined 25% from 1Q10.
First Quarter 2011 Earnings - Oil & Gas
Segment Variance Analysis - 1Q11 vs. 1Q10
Segment Variance Analysis - 1Q11 vs. 1Q10
4

5
First Quarter 2011 Earnings - Oil & Gas Segment
1Q11 4Q10
Oil and Gas Production Volumes (mboe/d) 730 714
• The production guidance we gave you in last quarter’s conference call of 740
to 750 mboe/d was at an $85 average oil price assumption.
to 750 mboe/d was at an $85 average oil price assumption.
• The actual average 1Q11 oil price reduced our production volumes by about
10 mboe/d, including 1 mboe/d at THUMS in Long Beach.
10 mboe/d, including 1 mboe/d at THUMS in Long Beach.
• As previously disclosed, our Iraq production was lower by ~ 9 mboe/d due to
less than planned spending levels as we are in start-up phase of operations.
less than planned spending levels as we are in start-up phase of operations.
• Inclement weather, mainly in Texas, caused an additional reduction of about
7 mboe/d.
7 mboe/d.
• These reductions were offset by less than expected production loss from the
Elk Hills maintenance shutdown and operational enhancements providing
higher than expected production in Colombia, Yemen, Qatar and the new
assets resulting in production of 730 mboe/d.
Elk Hills maintenance shutdown and operational enhancements providing
higher than expected production in Colombia, Yemen, Qatar and the new
assets resulting in production of 730 mboe/d.
• 1Q11 production volumes of 730 mboe/d compared to 4Q10 production of 714
mboe/d, included 25 mboe/d from new domestic acquisitions in South Texas
and the North Dakota Williston Basin.
mboe/d, included 25 mboe/d from new domestic acquisitions in South Texas
and the North Dakota Williston Basin.
5

6
750
(10)
740
(9)
731
(7)
724
Earlier 1Q11 Guidance Range
Price Impact
Guidance Adjusted for Price
Iraq Spending Impact
Weather Impact
Actual Production Volume
(thousand boe/d)
Oil & Gas
Production
Production
1Q11 Oil & Gas Production Guidance Reconciliation
740
(10)
730
(9)
721
(7)
714
730
First Quarter 2011 Earnings - Oil & Gas Segment
6

7
First Quarter 2011 Earnings - Oil & Gas Segment
1Q11 1Q10
• Oil and Gas Sales Volumes (mboe/d) 728 685
• + 6% year-over-year
• Sales volumes of 728 mboe/d, which was higher than our
guidance of 725 mboe/d, differ from production volumes
due to the timing of liftings, principally caused by Iraq
where liftings are expected in the latter half of 2011.
guidance of 725 mboe/d, differ from production volumes
due to the timing of liftings, principally caused by Iraq
where liftings are expected in the latter half of 2011.
7
8
725
(10)
715
(7)
708
14
722
728
Earlier 1Q11 Guidance
Price Impact
Guidance Adjusted for Price
Weather Impact
Lifting timing
Actual Sales Volume
(thousand boe/d)
Oil & Gas
Sales
Sales
1Q11 Oil & Gas Sales Guidance Reconciliation
First Quarter 2011 Earnings - Oil & Gas Segment
8

9
1Q11 1Q10
Reported Segment Earnings ($mm) $2,468 $1,861
WTI Oil Price ($/bbl) $94.10 $78.71
NYMEX Gas Price ($/mcf) $4.27 $5.39
Oxy’s Realized Prices
Worldwide Oil ($/bbl) $92.14 $74.09
Worldwide NGLs ($/bbl) $52.64 $47.48
US Natural Gas ($/mcf) $4.21 $5.62
First Quarter 2011 Earnings - Oil & Gas Segment
9

10
First Quarter 2011 Earnings - Oil & Gas
Segment - Cash Production Costs and Taxes
Segment - Cash Production Costs and Taxes
First Quarter 2011 Earnings - Oil & Gas
Segment - Cash Production Costs and Taxes
Segment - Cash Production Costs and Taxes
• Oil and gas cash production costs were $11.30 a barrel
for 1Q11, compared with last year's twelve-month costs
of $10.19 a barrel.
for 1Q11, compared with last year's twelve-month costs
of $10.19 a barrel.
– The increase reflects increased workovers and maintenance
activity and higher costs for energy.
activity and higher costs for energy.
• Taxes - other than on income, which are directly related
to product prices, were $2.25 per barrel for 1Q11,
compared to $1.83 per barrel for all of 2010.
to product prices, were $2.25 per barrel for 1Q11,
compared to $1.83 per barrel for all of 2010.
• Total exploration expense was $84 mm in 1Q11. This
amount included the Libya write off of $35 mm, which is
included in non-core items discussed earlier.
amount included the Libya write off of $35 mm, which is
included in non-core items discussed earlier.
10
11
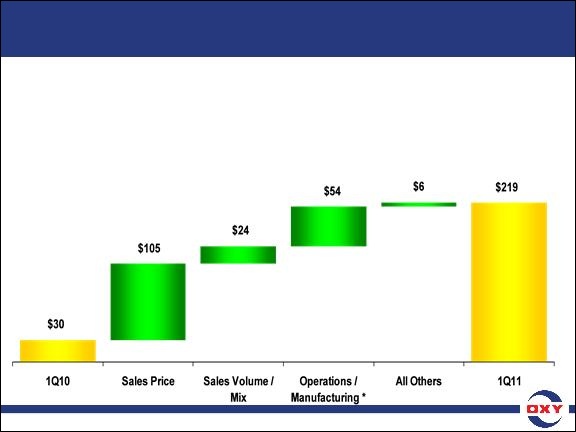
($ in millions)
*Lower energy and feedstock costs
• Core Results for 1Q11 were $219 mm vs. $30 mm in 1Q10,
and greater than our earlier guidance.
and greater than our earlier guidance.
– These results are among the best ever reported for the Chemical segment’s first quarter
operations, which is historically a weak quarter due to seasonal factors.
operations, which is historically a weak quarter due to seasonal factors.
– 1Q11 operations were positively impacted by strong export demand and improved
supply/demand balances across most products resulting in higher margins, including
higher demand for calcium chloride resulting from the severe winter storms in the Northeast
and Midwest sections of the US.
supply/demand balances across most products resulting in higher margins, including
higher demand for calcium chloride resulting from the severe winter storms in the Northeast
and Midwest sections of the US.
First Quarter 2011 Earnings - Chemical
Segment Variance Analysis - 1Q11 vs. 1Q10
Segment Variance Analysis - 1Q11 vs. 1Q10
11
12
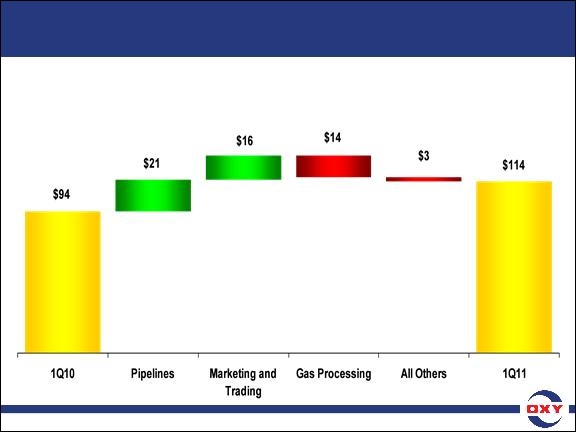
($ in millions)
• Core Results for 1Q11 of $114 mm vs. $94 mm in 1Q10
– The sequential decrease in Midstream segment earnings from $202 mm in 4Q10 was mainly
due to lower marketing and trading income.
due to lower marketing and trading income.
First Quarter 2011 Earnings - Midstream
Segment Variance Analysis - 1Q11 vs. 1Q10
Segment Variance Analysis - 1Q11 vs. 1Q10
12

13
First Quarter 2011 Earnings -
Capital Spending and Rig Activity
Capital Spending and Rig Activity
• Capital spending for 1Q11 was $1.3 billion.
– Of this, about 88% was in Oil and Gas, 10% in Midstream and the
remainder in Chemicals.
remainder in Chemicals.
• We are currently operating 16 rigs in the Permian and 24
rigs in California, compared to 5 and 11 rigs,
respectively, in 1Q10.
rigs in California, compared to 5 and 11 rigs,
respectively, in 1Q10.
13
14
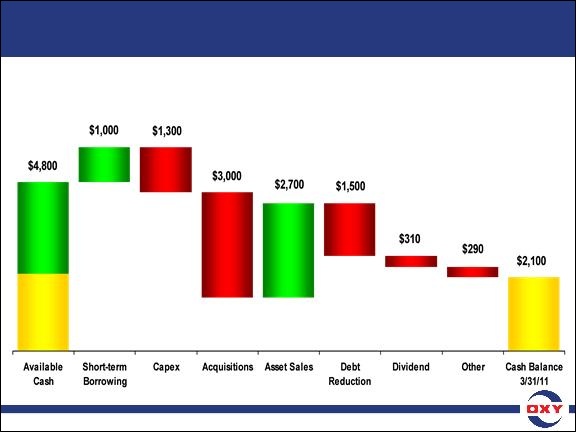
Cash Flow
From
Operations
$2,200
From
Operations
$2,200
Beginning
Cash
$2,600
12/31/10
Cash
$2,600
12/31/10
($ in millions)
– Free cash flow from continuing operations after capex and dividends
but before acquisition and debt activity was about $500 million.
but before acquisition and debt activity was about $500 million.
Note: See attached GAAP reconciliation.
First Quarter 2011 Earnings -
2011 YTD Cash Flow
2011 YTD Cash Flow
14

15
First Quarter 2011 Earnings - Acquisitions
First Quarter 2011 Earnings - Acquisitions
• Our acquisition expenditures in 1Q11 were $3 billion.
– The acquisitions included the previously announced South
Texas purchase and properties in California and the Permian.
Texas purchase and properties in California and the Permian.
– Excluding the South Texas purchase, the new properties did not
materially impact the 1Q11 production volumes.
materially impact the 1Q11 production volumes.
• During 2Q11, we will make a payment of about $500
million in connection with the signing of the Shah Field
Development Project.
million in connection with the signing of the Shah Field
Development Project.
– This amount represents development costs incurred by the
project prior to the effective date of our participation.
project prior to the effective date of our participation.
– Future development costs will be reflected in capital
expenditures.
expenditures.
15

16
First Quarter 2011 Earnings -
Shares Outstanding and Debt
Shares Outstanding and Debt
Shares Outstanding (mm) 1Q11 3/31/11
Weighted Average Basic 812.6
Weighted Average Diluted 813.4
Basic Shares Outstanding 812.6
Diluted Shares Outstanding 813.4
3/31/11 12/31/10
Debt/Capital 12% 14%
• Our remaining outstanding debt has an average interest
rate of 3.7%.
rate of 3.7%.
16

17
First Quarter 2011 Earnings -
Oil and Gas Production & Sales - 2Q11 Outlook
Oil and Gas Production & Sales - 2Q11 Outlook
• At 1Q11 average oil prices of about $95 WTI, we expect 2Q11
oil and gas production volumes to be as follows:
oil and gas production volumes to be as follows:
– Domestic volumes are expected to increase to about 425 mboe/d,
compared with 1Q11 production of 404 mboe/d;
compared with 1Q11 production of 404 mboe/d;
– Latin America is expected to be comparable to 1Q11 volumes;
– In the Middle East region, an overwhelming majority of the value, using
SEC’s standardized measure, and income comes from Qatar, including
Dolphin, and Oman where operations are running normally;
SEC’s standardized measure, and income comes from Qatar, including
Dolphin, and Oman where operations are running normally;
– With regard to 2Q11 production from the Middle East region:
• We expect no production for Libya;
• Production levels in Iraq are not easily predictable due to volatile
spending levels at this early stage of that project. This is caused by
the nature of the contract, which allows immediate recovery of
expenditures through cost recovery barrels. As a result, the level of
development spending in any given period has an immediate impact
on volumes for that period;
spending levels at this early stage of that project. This is caused by
the nature of the contract, which allows immediate recovery of
expenditures through cost recovery barrels. As a result, the level of
development spending in any given period has an immediate impact
on volumes for that period;
17

18
First Quarter 2011 Earnings -
Oil and Gas Production & Sales - 2Q11 Outlook
Oil and Gas Production & Sales - 2Q11 Outlook
– With regard to 2Q11 production from the Middle East region (cont’d):
• In Yemen, almost all of our production comes from concessions
operated by others. In addition, the Masila Field contract, which
produces, net to us, about 11 mboe/d, is approaching expiration at
the end of 2011 and capital spending is being phased out. These
factors make the forecasting of production volumes very difficult.
operated by others. In addition, the Masila Field contract, which
produces, net to us, about 11 mboe/d, is approaching expiration at
the end of 2011 and capital spending is being phased out. These
factors make the forecasting of production volumes very difficult.
• For the remainder of the Middle East, we expect production to be
comparable to 1Q11 volumes.
comparable to 1Q11 volumes.
• Total sales volumes are expected to be about 725
mboe/d, which do not include any volumes from Iraq or
Libya.
mboe/d, which do not include any volumes from Iraq or
Libya.
• A $5.00 increase in WTI would reduce our PSC volumes
by about 3,500 boe/d.
by about 3,500 boe/d.
18

19
First Quarter 2011 Earnings - Capex Increase
• We are increasing our total year capital program to $6.8
billion, with about $500 million of the increase related to
the Shah Field development program subsequent to the
effective date of our participation and the remainder
principally in California for spending attributable to
additional permits being obtained.
billion, with about $500 million of the increase related to
the Shah Field development program subsequent to the
effective date of our participation and the remainder
principally in California for spending attributable to
additional permits being obtained.
19

20
First Quarter 2011 Earnings - 2Q11 Outlook
• Commodity Price Sensitivity - Earnings
– At current market prices, a $1.00 per barrel change in oil prices
impacts oil and gas quarterly earnings before income taxes by
about $34 mm;
impacts oil and gas quarterly earnings before income taxes by
about $34 mm;
– The average 1Q11 WTI oil price was $94.10 per barrel;
– A $1.00 per barrel change in WTI prices impacts NGL quarterly
earnings before income taxes by $4 mm.
earnings before income taxes by $4 mm.
– A swing of $0.50 per mm BTU in domestic gas prices has a $34 mm
impact on quarterly pretax income;
impact on quarterly pretax income;
– The current NYMEX gas price is around $4.25 p/mcf.
• We expect 2Q11 exploration expense to be about $85 mm
for seismic and drilling for our exploration programs.
for seismic and drilling for our exploration programs.
20

21
First Quarter 2011 Earnings - 2Q11 Outlook
First Quarter 2011 Earnings - 2Q11 Outlook
• The Chemical segment 2Q11 earnings are expected to be
comparable to 1Q11.
comparable to 1Q11.
– We expect continuation of 1Q11 trends with sufficient gains from
strong exports and seasonal demand improvement offsetting the
reduced contributions from the calcium chloride business.
strong exports and seasonal demand improvement offsetting the
reduced contributions from the calcium chloride business.
• We expect our combined worldwide tax rate in 2Q11 to
be about 39 percent.
be about 39 percent.
21

22
First Quarter 2011 Earnings - California Update
First Quarter 2011 Earnings - California Update
• We are continuing the program as discussed in last
quarter’s conference call, which is progressing with
satisfactory results.
quarter’s conference call, which is progressing with
satisfactory results.
• Permitting is still an issue but we have recently obtained
some permits that make us optimistic about increasing
our 2H11 capital spending.
some permits that make us optimistic about increasing
our 2H11 capital spending.
• Governor Brown has been working to speed up the
permitting process.
permitting process.
– We expect that his effort will be successful, which should enable
us to increase our activity and add more jobs in the state.
us to increase our activity and add more jobs in the state.
• In 1Q11, we drilled and completed 26 shale wells outside
of the Elk Hills field.
of the Elk Hills field.
22
23
23
|
Occidental Petroleum Corporation
|
||
|
Free Cash Flow
|
||
|
Reconciliation to Generally Accepted Accounting Principles (GAAP)
|
||
|
($ Millions)
|
||
|
Three Months
|
||
|
2011
|
||
|
Consolidated Statement of Cash Flows
|
||
|
Cash flow from operating activities
|
2,222
|
|
|
Cash flow from investing activities
|
(1,741
|
)
|
|
Cash flow from financing activities
|
(959
|
)
|
|
Change in cash
|
(478
|
)
|
|
Free Cash Flow
|
||
|
Cash flow from operating activities
|
2,222
|
|
|
Capital spending
|
(1,325
|
)
|
|
Cash dividends paid
|
(310
|
)
|
|
Distribution to noncontrolling interest
|
(121
|
)
|
|
Free cash flow from continuing operations
|
466
|
|